Abstract
Objective:
To develop a composite MRI-based measure of motor network integrity, and determine if it explains disability better than conventional MRI measures in patients with multiple sclerosis (MS).
Methods:
Tract density imaging and constrained spherical deconvolution tractography were used to identify motor network connections in 22 controls. Fractional anisotropy (FA), magnetization transfer ratio (MTR), and normalized volume were computed in each tract in 71 people with relapse onset MS. Principal component analysis was used to distill the FA, MTR, and tract volume data into a single metric for each tract, which in turn was used to compute a composite measure of motor network efficiency (composite NE) using graph theory. Associations were investigated between the Expanded Disability Status Scale (EDSS) and the following MRI measures: composite motor NE, NE calculated using FA alone, FA averaged in the combined motor network tracts, brain T2 lesion volume, brain parenchymal fraction, normal-appearing white matter MTR, and cervical cord cross-sectional area.
Results:
In univariable analysis, composite motor NE explained 58% of the variation in EDSS in the whole MS group, more than twice that of the other MRI measures investigated. In a multivariable regression model, only composite NE and disease duration were independently associated with EDSS.
Conclusions:
A composite MRI measure of motor NE was able to predict disability substantially better than conventional non-network-based MRI measures.
In multiple sclerosis (MS), the most widely used clinical score is the Expanded Disability Status Scale (EDSS).1,2 However, while accepted as a primary outcome in treatment trials, its reliability3 and sensitivity to change are limited, requiring large cohorts and lengthy follow-up to reliably identify treatment effects. MRI measures, such as white matter (WM) lesion load,4 enable treatment effects to be detected in smaller cohorts but are not accepted primary outcomes as their correlation with disability is modest.5,6 MRI measures are usually of the whole brain or anatomical regions of interest (ROIs), potentially including functionally irrelevant, or overlooking relevant, areas.7 An alternative is to evaluate networks underlying functions.8 A network can be assessed as a single ROI, but information about connectivity is lost. In structural connectomics studies, graph theory (GT)9,10 enables a single measure, such as network efficiency (NE), to encapsulate network-wide damage while weighting the effects of pathology dependent on where it occurs. Such studies are usually based on diffusion MRI measures,11 but in MS, combining them with other measures, such as magnetization transfer ratio (MTR), could provide a more comprehensive assessment of pathology.
The aims of this work were to determine whether (1) motor network compared with non-network-based MRI measures correlate more closely with EDSS scores; (2) EDSS scores correlate more with NE than WM fractional anisotropy (FA) in the motor network; and (3) EDSS scores correlate more with NE computed using FA or FA and MTR.
METHODS
Patients.
Seventy-one patients with relapse-onset MS (mean age 46.2 ± 10.3 years; mean disease duration 15.4 ± 10.0 years; 44 female, 27 male; 27 secondary progressive MS [SPMS] and 44 relapsing-remitting MS [RRMS]) were included in this study. Clinical and MRI assessments were not undertaken in those who had had a relapse or received corticosteroids within the preceding 4 weeks. The primary clinical measure of this study was the EDSS.1 Clinical and demographic data for the whole MS group and the SPMS and RRMS subgroups are shown in table 1.
Table 1.
Demographic, MRI, and clinical data of patients with multiple sclerosis and healthy controls enrolled in the study
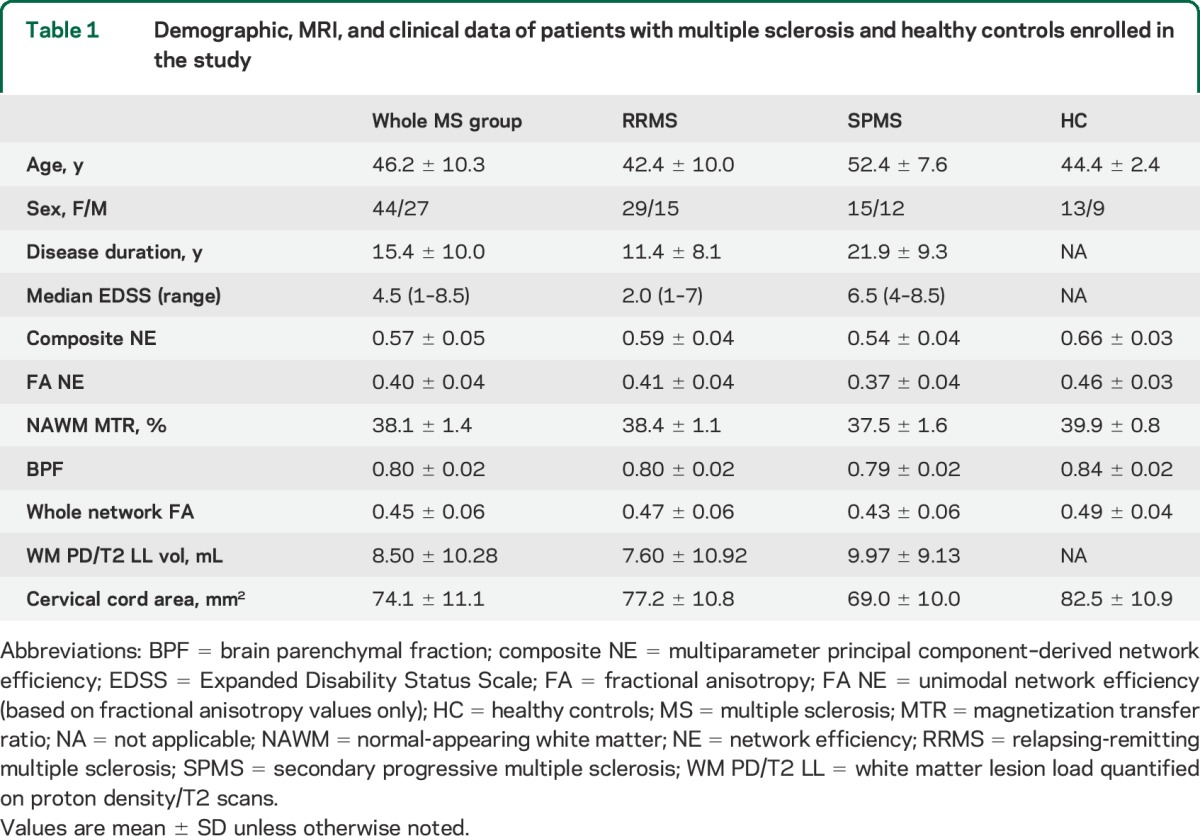
A group of 22 age- and sex-matched healthy controls (age 44.4 ± 2.4 years; 13 female, 9 male), with no known neurologic or psychiatric conditions, were also enrolled in the study.
Standard protocol approvals, registrations, and patient consents.
Written informed consent was obtained from all patients. This study was approved by the local institutional ethics committee.
MRI protocol and analysis.
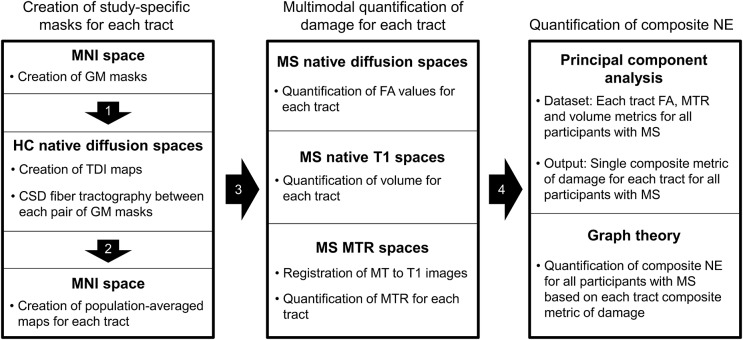
An outline of the analysis pipeline is shown in figure 1.
Figure 1. MRI analysis pipeline.
CSD = constrained spherical deconvolution; FA = fractional anisotropy; GM = gray matter; HC = healthy controls; MNI = Montreal Neurologic Institute (atlas); MTR = magnetization transfer ratio; MS = multiple sclerosis; NE = network efficiency; TDI = track density imaging.
MRI protocol and preprocessing.
Brain MRI was performed on a Philips Achieva 3T system (Philips Healthcare, Best, Netherlands) using a 32-channel head coil. The high angular resolution diffusion imaging scan consisted of a cardiac-gated spin-echo echoplanar imaging sequence, with slices acquired in the axial-oblique orientation aligned with the anterior commissure–posterior commissure (AC-PC) line (2 × 2 × 2 mm3, 61 isotropically distributed diffusion-weighted directions with b = 1,200 seconds/mm2, 7 b = 0 volumes, echo time [TE] = 68 ms, repetition time [TR] = 24 seconds [depending on the cardiac rate], sensitivity encoding factor = 3.1, field of view 112 × 112, number of slices 72). In each subject we also acquired the following: (1) dual-echo proton density (PD)/T2-weighted axial-oblique scans aligned with the AC-PC line (1 × 1 × 3 mm3, TR = 3,500 ms, TE = 19/85 ms, field of view 240 × 240), (2) 3D sagittal T1-weighted fast field echo scan (1 × 1 × 1 mm3, TR = 6.9 ms, TE = 3.1 ms), and (3) magnetization transfer imaging (MTI) scans (1 × 1 × 1 mm3, TR = 6.4 ms, TE = 2.7/4.3 ms, field of view 256 × 256, number of slices 180).
Preprocessing steps included (1) removal of non-brain tissue using FSL,12 (2) eddy-current correction of diffusion images and vector realignment using FSL,12 and (3) fitting of the diffusion tensor using Camino.13
Network-based analysis: Identification of the motor network components and quantification of tract FA, MTR, and volume.
The pipeline for the identification of the motor network components is reported in the e-Methods on the Neurology® Web site at Neurology.org and summarized in figure 1. Briefly, the cortical and subcortical gray matter (GM) structures of the motor network were identified based on published models of motor function14 using the Harvard-Oxford cortical and subcortical structural atlas, included in FSL.12 Using these as seed points, constrained spherical deconvolution tractography15 was used to create in healthy controls the population-weighted masks of all the WM tracts connecting the motor network GM structures (i.e., masks for all tracts of interest [TOIs]). FA, MTR, and normalized volume were then computed for each TOI for all participants with MS as described in the e-Methods.
Network-based analysis: Principal component analysis of multiparameter MRI data.
Principal component analysis (PCA) is a data reduction technique that extracts the main components that explain observed variation in multiple different measurements. Practically, it can be used to distill multiple MRI measures into fewer variables,16,17 so enabling multimodal MRI data to be used where only unimodal data could otherwise be used. GT network analysis works with single measurements for each WM tract, and so in this work we used PCA to condense multimodal MRI data from the WM tracts. To achieve this, FA, MTR, and normalized volume data from all tracts in all patients were included in a single PCA analysis. Each tract in each subject represented a separate data point. The analysis revealed a single factor that explained ∼80% of the variance in these 3 measures (in this order of association), i.e., 80% of the unique information in the tracts' FA, MTR, and normalized volume measures. This value of this PCA factor was then calculated in all tracts, rescaled between 0 and 1 across all tracts, and then used in the subsequent GT network analysis.
Network-based analysis: Computation of multiparameter and FA NE.
NE, normalized to the maximum theoretical efficiency of the network, was computed using the MATLAB Connectivity Toolbox (www.brain-connectivity-toolbox.net). NE was computed separately (1) based on the WM tract FA (as per previous studies)11 to generate an FA-based NE measure (FA NE) and (2) using the PCA main factor to generate a composite NE measure incorporating effects of FA, MTR, and tissue volume. In this analysis, higher NE values represent the potential for more efficient information exchange.9,10
Other MRI metrics.
All the tracts of the motor network were merged to form a single mask of motor network WM. Mean FA was then measured inside this mask (whole network FA). Whole brain PD/T2-weighted lesion volumes, normal-appearing WM (NAWM) MTR, brain parenchymal fraction (BPF), and cervical cord area were measured. WM PD/T2 lesion load was measured using PD/T2 images and JIM (Xinpase Systems; www.xinapse.com). NAWM MTR values were computed from the WM mask (generated as above) excluding PD/T2 WM lesions. BPF was computed using the GM, WM, and CSF masks.18 Cervical spinal cord area was measured using the T1-weighted volumetric images as previously described.19
Statistical analysis.
Log-transformed volume was used to normalize the PD/T2 WM lesion load data. In the whole MS group, associations between EDSS and MRI metrics were examined with Spearman and Pearson correlations. Multivariable associations with EDSS were examined using multiple linear regression, with the MRI and demographic variables as predictors. There was no evidence of residual non-normality, but as a precaution the results assuming normality were confirmed using a nonparametric bias-corrected and accelerated bootstrap with 1,000 replicates. There was evidence of heteroscedasticity, but robust standard error20 regressions accommodating heteroscedasticity did not materially alter results, therefore standard least squares results are reported. Although the regression p values, confidence intervals, and R2 are valid after the residual checks above, regression coefficients must be interpreted with caution: the EDSS scale does not have a uniform linear interpretation. For this reason, the potentially different association between EDSS and composite NE in SPMS and RRMS was examined not with a conventional interaction test, which compares slopes in the 2 groups, but by comparing residual variance between the groups using an F test, with smaller variance indicating better model fit. The same analysis was performed dividing the whole MS group into EDSS >3.5 or EDSS ≤3.5 subgroups. Statistical analyses were performed in Stata 13.1 (Stata Corporation, College Station, TX), and statistical significance reported at p < 0.05. Data are reported as mean ± SD, unless stated otherwise.
RESULTS
MRI and EDSS associations in the whole MS group.
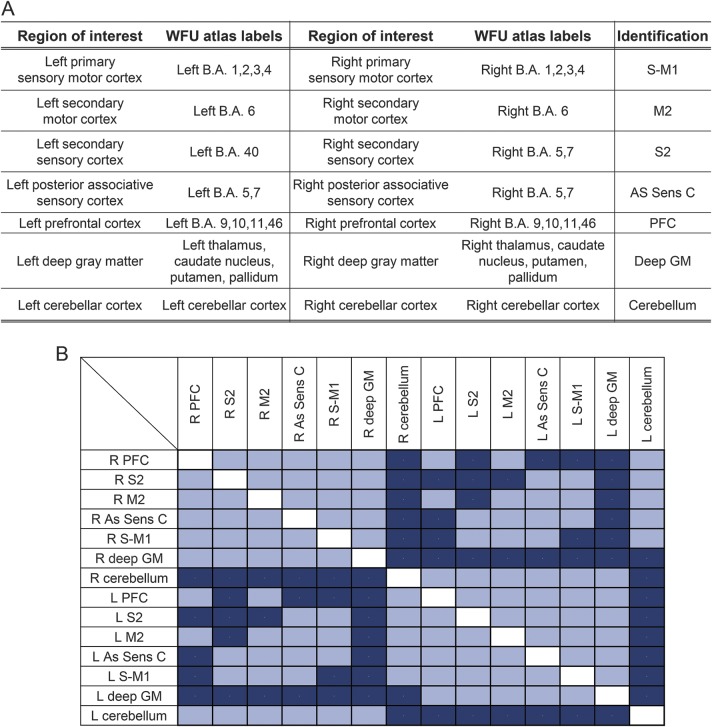
The connectivity matrix of the motor network is shown in figure 2 (lower panel). The MRI measurement values are given in table 1. Table 2 shows pairwise correlations and R2 values among EDSS, MRI, and demographic variables. While all correlations were significant (table 2), composite NE had the highest R2, explaining 58% of variance in EDSS scores compared with 21% for FA NE (figure 3) and with 18% for cervical cord area (the second and third best performing metrics).
Figure 2. Gray and white matter components of the motor network.
(A) Gray matter (GM) regions included in the motor network. (B) Connectivity matrix of the tracts included in the motor network based on the tractography results. Included tracts are shown in light blue; tracts not identified by fiber tractography are shown in dark blue. As Sens C = associative parietal sensory cortex; BA = Brodmann area; deep GM = deep gray matter; M2 = secondary motor area; PFC = prefrontal cortex; S-M1 = primary sensory motor cortex; S2 = secondary sensory area.
Table 2.
Correlations and univariable R2 of the MRI measures with EDSS in the whole multiple sclerosis group
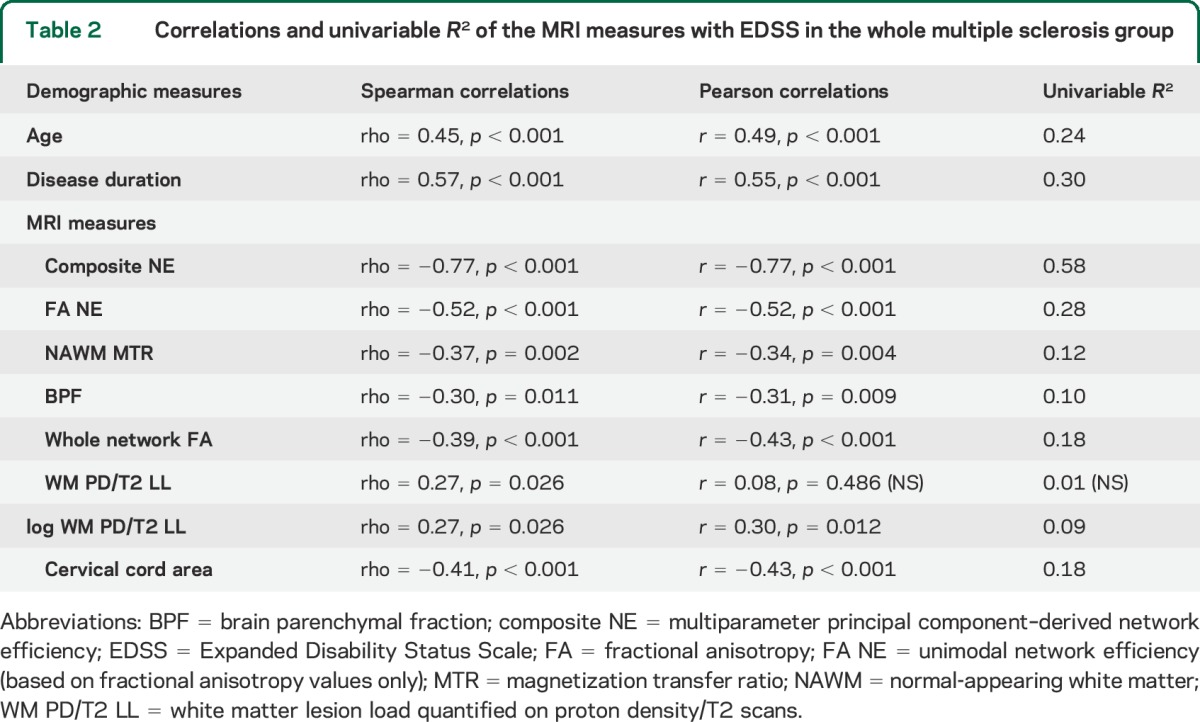
Figure 3. Correlation between multiparameter motor NE (composite NE) and EDSS scores.
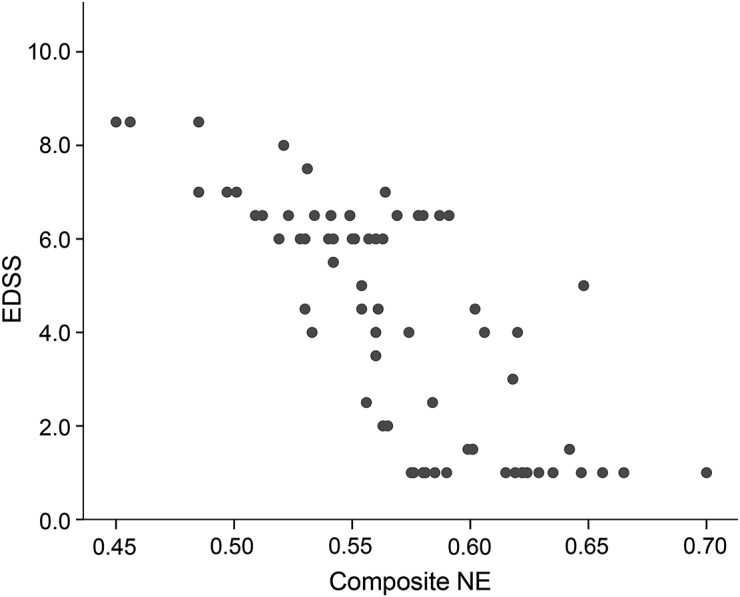
EDSS = Expanded Disability Status Scale; NE = network efficiency.
In a multivariable regression analysis including composite NE and other MRI or demographic variables, disease duration was the only significant predictor of EDSS independent from the composite NE (model R2 0.64, composite NE p < 0.001, disease duration p = 0.003). While none of the MRI parameters were independent predictors of EDSS in models with composite NE, the logarithmic transformation of T2 lesion load approached significance (p = 0.081), despite having the smallest univariable R2 (0.09). However, log T2 lesion load lost significance in a model with disease duration as a covariate.
MRI and EDSS association in RRMS and SPMS subgroups.
The composite NE was also significantly associated with EDSS in the RRMS (R2 0.46) and SPMS (R2 0.50) groups. The reduced R2 value observed in either subgroup compared to that in the whole MS cohort is consistent with the smaller range of values in the MRI and EDSS measures seen in the subgroups when compared with the whole MS group. A comparison of the residual variance in the 2 subgroups confirmed a higher variance in RRMS than in SPMS (p < 0.001), providing evidence that composite NE prediction of EDSS is better in the SPMS than in the RRMS group. Neither disease duration nor any other variable predicted EDSS independently of composite NE in separate models for SPMS and RRMS. As reported in the supplementary data on the Neurology® Web site at Neurology.org, the association between composite NE and EDSS remained significant when considering separately patients with MS with EDSS ≤3.5 (27 patients) or EDSS >3.5 (44 patients).
DISCUSSION
The results of this study suggest that a network-based multiparameter MRI measure (composite NE) correlates significantly better with EDSS scores than either conventional brain or spinal cord MRI measures or NE calculated using FA alone. Composite NE explained ∼58% of the variability in EDSS scores, with the next best measure (FA NE) explaining about half of this variability. No MRI variable predicted EDSS independently of composite NE in the whole MS group or in the SPMS and RRMS subgroups, indicating that the network multiparameter MRI approach used in this study improves the prediction of clinical disability from MRI data.
Developing MRI markers of clinical outcomes has proven difficult in MS. One major issue is the spatial variability of MS pathology, which can have very different effects on clinical outcomes dependent on its location. As such, it is not surprising that the correlations between whole brain MRI measures of MS pathology and neurologic and cognitive disability5,6 are only modest, and ROI-based studies have not clearly found a single region that consistently correlates with motor outcomes.7 Network-based metrics avoid these pitfalls by incorporating data from all the functionally relevant components of a network.
Assessing performance across a neural network can be undertaken in different ways, but in connectomics GT has proven useful as it enables network-wide characteristics to be summarized in a single metric.9,10 In MS, GT has been applied at a whole brain level using functional MRI,21,22 diffusion,23,24 and volumetric MRI data,25 showing that MS pathology has detectable effects on the function of networks. At a single network level, we have previously found that for Paced Auditory Serial Addition Test (PASAT) scores, FA NE was better able to predict test performance than the raw PASAT network WM tract FA measures used to calculate NE.26 The results of the present study confirm that this approach is applicable to other brain networks in MS.
NE is calculated using a single measure only, and previous structural GT studies have relied exclusively on FA measures to calculate NE in MS23,24 and other neurologic conditions.11 However, no single MRI measure fully captures the spectrum of MS pathology, and so using several different MRI measures may provide a more comprehensive assessment. Previous multiparameter MRI studies in MS, however, have looked at each MRI measure independently.27,28 We found that multiparameter MRI data combined using PCA, when compared with FA alone, further improved the association between network-based MRI measures and EDSS scores, increasing the explained variance in EDSS scores from 21% using a FA NE measure (based on FA alone) to 58% with a composite NE that used MTR, FA, and normalized tract volume measures. These 3 measures provide complementary information on the underlying pathology. MTR is reduced with demyelination,29 FA in WM tracts is reduced both with demyelination and when axonal integrity is disrupted,30 and a decrease in tissue volumes is thought to reflect axonal loss and neurodegenerative changes.31 This may account for the stronger correlation of the composite NE measure with disability than NE computed using FA alone. Associations between the composite NE measure and EDSS were similar in RRMS (R2 0.46) and SPMS (0.50), suggesting that this measure may be equally useful across different disease subtypes.
A limitation of the study is the difficulty in identifying relevant GM areas to prime motor network tractography. While we included all the main areas described in published models of motor function,14 in people with MS, additional cortical areas are recruited during the execution of motor tasks as disability increases.32 However, the majority of studies localize these additional areas in contralateral motor or prefrontal territories, i.e., all areas already included in our network.32 In addition, our GM masks are larger than those usually used in whole-brain connectomics studies, potentially incorporating functionally independent areas in some masks. This will tend to reduce the apparent associations between network measures and clinical scores. However, larger GM regions, and consequently larger WM tract masks, will reduce the impact of interindividual anatomical variability. As this study sought to determine whether a GT-based approach was worth pursuing in MS, we focused on NE, the most commonly used GT metric. As NE quantifies a physiologically relevant property, i.e., the structural capacity for information transfer between parts of a network, it was a suitable choice for this proof-of-concept study. Other network properties that can be characterized using GT, such as nodal degree (which represents the strength with which a given GM region is connected to the rest of the network),9,10 should be explored in future studies to determine which parameters best encapsulate the effects of MS pathology on a network. Similarly, the MRI parameters included in this study were based on those most often used in MS clinical studies, but again future work could determine whether or not other parameters contribute further.
In this study, the generation of composite measures has been optimized for this dataset. While including people with a wide range of EDSS scores (1–8.5), a substantial proportion had EDSS scores ≤3.5 (27 out of 71), and people who were in, or had recently had, a relapse were not included. Further studies in cohorts with a greater proportion of people with higher EDSS scores, and in people during and after relapses, are required to more fully assess the performance of multiparameter motor network efficiency measures throughout the EDSS scale, and to determine whether or not associations between NE and disability are disrupted by acute inflammatory activity. This study used cross-sectional data from a single center; however, treatment trials are often multisite and require serial measurements. Further work is also needed to determine the reliability of motor NE measures, and whether or not they need to be tuned for MRI scanners individually in multicenter studies. Finally, while the clinical outcome measure used in this work was EDSS, future studies are warranted to assess associations of MRI-based motor network measures with more specific measures of upper and lower limb function.
The results of this study suggest that multiparameter MRI-based measures of motor network efficiency may have a useful role in the assessment of clinically relevant pathology. They were able to explain about 58% of the variation in EDSS scores in a diverse group of people with MS, substantially and significantly outperforming a series of conventional and non-network-based MRI measures.
Supplementary Material
GLOSSARY
- AC-PC
anterior commissure–posterior commissure
- BPF
brain parenchymal fraction
- EDSS
Expanded Disability Status Scale
- FA
fractional anisotropy
- GM
gray matter
- GT
graph theory
- MS
multiple sclerosis
- MTI
magnetization transfer imaging
- MTR
magnetization transfer ratio
- NAWM
normal-appearing white matter
- NE
network efficiency
- PASAT
Paced Auditory Serial Addition Test
- PCA
principal component analysis
- PD
proton density
- ROI
region of interest
- RRMS
relapsing-remitting multiple sclerosis
- SPMS
secondary progressive multiple sclerosis
- TE
echo time
- TOI
tract of interest
- TR
repetition time
- WM
white matter
Footnotes
Supplemental data at Neurology.org
Editorial, page 1096
AUTHOR CONTRIBUTIONS
Study concept and design: M.P., D.H.M., D.T.C. Acquisition, analysis, and interpretation of data: all authors. Drafting of the manuscript: M.P., D.T.C. Critical revision of the manuscript for important intellectual content: all authors. Statistical analysis: M.P., D.R.A. Obtaining funding: D.H.M., D.T.C. Study supervision: D.H.M., D.T.C.
STUDY FUNDING
NMR Research Unit is supported by the Multiple Sclerosis Society in the United Kingdom and the UCL UCLH Comprehensive Biomedical Research Centre. D.A. is partially funded by the Multiple Sclerosis Society in the United Kingdom. D.C. has received research support from the MS Society of Great Britain and Northern Ireland and the UCLH/UCL NIHR Biomedical Research Centre. M.P. is supported by the nonprofit AKWO Association, Lavagna (GE, Italy).
DISCLOSURE
M. Pardini received research support from Novartis. O. Yaldizli has received lecture fees from Teva, Novartis, and Bayer Schering, which was exclusively used for funding of research and continuous medical education in the Department of Neurology at the University Hospital Basel. V. Sethi receives research support from Biogen Idec and Novartis. N. Muhlert, Z. Liu, and R. Samson report no disclosures relevant to the manuscript. D. Altmann has received an honorarium from Merck & Co. and gave expert testimony in the case of Mylan v. Yeda. He is partially funded by the Multiple Sclerosis Society in the United Kingdom. M. Ron reports no disclosures relevant to the manuscript. C. Wheeler-Kingshott is on the advisory board for BG12 (Biogen). D. Miller has received honoraria from Biogen Idec, Novartis, GlaxoSmithKline, and Bayer Schering, and research grant support for MRI analysis in multiple sclerosis trials sponsored by GlaxoSmithKline, Biogen Idec, and Novartis. D. Chard has received honoraria (paid to UCL) from Bayer, Teva, and Serono Symposia International Foundation for faculty-led education work and Teva for advisory board work; has received support for meeting expenses from Teva; and holds stock in GlaxoSmithKline. He has received research support from the MS Society of Great Britain and Northern Ireland and the UCLH/UCL NIHR Biomedical Research Centre. Go to Neurology.org for full disclosures.
REFERENCES
- 1.Kurtzke JF. Rating neurologic impairment in multiple sclerosis: an expanded disability status scale (EDSS). Neurology 1983;33:1444–1452. [DOI] [PubMed] [Google Scholar]
- 2.Balcer LJ. Clinical outcome measures for research in multiple sclerosis. J Neuroophthalmol 2001;21:296–301. [DOI] [PubMed] [Google Scholar]
- 3.Meyer-Moock S, Feng YS, Maeurer M, Dippel FW, Kohlmann T. Systematic literature review and validity evaluation of the Expanded Disability Status Scale (EDSS) and the Multiple Sclerosis Functional Composite (MSFC) in patients with multiple sclerosis. BMC Neurol 2014;14:58. [DOI] [PMC free article] [PubMed] [Google Scholar]
- 4.Sormani MP, Bruzzi P. MRI lesions as a surrogate for relapses in multiple sclerosis: a meta-analysis of randomised trials. Lancet Neurol 2013;12:669–676. [DOI] [PubMed] [Google Scholar]
- 5.Bar-Zohar D, Agosta F, Goldstaub D, Filippi M. Magnetic resonance imaging metrics and their correlation with clinical outcomes in multiple sclerosis: a review of the literature and future perspectives. Mult Scler 2008;14:719–727. [DOI] [PubMed] [Google Scholar]
- 6.Goodin DS. Magnetic resonance imaging as a surrogate outcome measure of disability in multiple sclerosis: have we been overly harsh in our assessment? Ann Neurol 2006;59:597–605. [DOI] [PubMed] [Google Scholar]
- 7.Filippi M, Agosta F. Imaging biomarkers in multiple sclerosis. Journal of magnetic resonance imaging. JMRI 2010;31:770–788. [DOI] [PubMed] [Google Scholar]
- 8.Catani M, Dell'acqua F, Bizzi A, et al. Beyond cortical localization in clinico-anatomical correlation. Cortex 2012;48:1262–1287. [DOI] [PubMed] [Google Scholar]
- 9.Bullmore ET, Bassett DS. Brain graphs: graphical models of the human brain connectome. Annu Rev Clin Psychol 2011;7:113–140. [DOI] [PubMed] [Google Scholar]
- 10.Rubinov M, Sporns O. Complex network measures of brain connectivity: uses and interpretations. NeuroImage 2010;52:1059–1069. [DOI] [PubMed] [Google Scholar]
- 11.Verstraete E, Veldink JH, Mandl RC, van den Berg LH, van den Heuvel MP. Impaired structural motor connectome in amyotrophic lateral sclerosis. PloS One 2011;6:e24239. [DOI] [PMC free article] [PubMed] [Google Scholar]
- 12.Smith SM, Jenkinson M, Woolrich MW, et al. Advances in functional and structural MR image analysis and implementation as FSL. NeuroImage 2004;23:S208–S219. [DOI] [PubMed] [Google Scholar]
- 13.Cook P, Bai Y, Nedjati-Gilani S, et al. Camino: open-source diffusion-MRI reconstruction and processing. 14th Scientific Meeting of the International Society for Magnetic Resonance in Medicine 2006;2759.
- 14.Felleman DJ, Van Essen DC. Distributed hierarchical processing in the primate cerebral cortex. Cereb Cortex 1991;1:1–47. [DOI] [PubMed] [Google Scholar]
- 15.Jeurissen B, Leemans A, Jones DK, Tournier JD, Sijbers J. Probabilistic fiber tracking using the residual bootstrap with constrained spherical deconvolution. Hum Brain Mapp 2011;32:461–479. [DOI] [PMC free article] [PubMed] [Google Scholar]
- 16.Dehmeshki J, Ruto AC, Arridge S, Silver NC, Miller DH, Tofts PS. Analysis of MTR histograms in multiple sclerosis using principal components and multiple discriminant analysis. Magn Reson Med 2001;46:600–609. [DOI] [PubMed] [Google Scholar]
- 17.Abdi H, Williams LJ. Principal component analysis. Wiley Interdiscip Rev Comput Stat 2010;2:433–459. [Google Scholar]
- 18.Rudick RA, Fisher E, Lee JC, Simon J, Jacobs L. Use of the brain parenchymal fraction to measure whole brain atrophy in relapsing-remitting MS: Multiple Sclerosis Collaborative Research Group. Neurology 1999;53:1698–1704. [DOI] [PubMed] [Google Scholar]
- 19.Liu Z, Yaldizli Ö, Pardini M, et al. Cervical cord area measurement using volumetric brain magnetic resonance imaging in multiple sclerosis. Mult Scler Relat Disord 2015;4:52–57. [DOI] [PubMed] [Google Scholar]
- 20.White H. A heteroskedasticity-consistent covariance matrix estimator and a direct test for heteroskedasticity. Econometrica 1980:817–838. [Google Scholar]
- 21.Rocca MA, Valsasina P, Martinelli V, et al. Large-scale neuronal network dysfunction in relapsing-remitting multiple sclerosis. Neurology 2012;79:1449–1457. [DOI] [PubMed] [Google Scholar]
- 22.Rocca MA, Valsasina P, Absinta M, et al. Intranetwork and internetwork functional connectivity abnormalities in pediatric multiple sclerosis. Hum Brain Mapp 2014;35:4180–4192. [DOI] [PMC free article] [PubMed] [Google Scholar]
- 23.Li Y, Jewells V, Kim M, et al. Diffusion tensor imaging based network analysis detects alterations of neuroconnectivity in patients with clinically early relapsing-remitting multiple sclerosis. Hum Brain Mapp 2013;34:3376–3391. [DOI] [PMC free article] [PubMed] [Google Scholar]
- 24.Shu N, Liu Y, Li K, et al. Diffusion tensor tractography reveals disrupted topological efficiency in white matter structural networks in multiple sclerosis. Cereb Cortex 2011;21:2565–2577. [DOI] [PubMed] [Google Scholar]
- 25.He Y, Dagher A, Chen Z, et al. Impaired small-world efficiency in structural cortical networks in multiple sclerosis associated with white matter lesion load. Brain 2009;132:3366–3379. [DOI] [PMC free article] [PubMed] [Google Scholar]
- 26.Pardini M, Sethi V, Muhlert N, et al. Network efficiency as a final common pathway for cognitive deficits in multiple sclerosis: a single network graph theory study. Neurology 2014;82(suppl):P6.128. [Google Scholar]
- 27.Otaduy MC, Callegaro D, Bacheschi LA, Leite CC. Correlation of magnetization transfer and diffusion magnetic resonance imaging in multiple sclerosis. Mult Scler 2006;12:754–759. [DOI] [PubMed] [Google Scholar]
- 28.Reich DS, Smith SA, Zackowski KM, et al. Multiparametric magnetic resonance imaging analysis of the corticospinal tract in multiple sclerosis. NeuroImage 2007;38:271–279. [DOI] [PMC free article] [PubMed] [Google Scholar]
- 29.Schmierer K, Scaravilli F, Altmann DR, Barker GJ, Miller DH. Magnetization transfer ratio and myelin in postmortem multiple sclerosis brain. Ann Neurology 2004;56:407–415. [DOI] [PubMed] [Google Scholar]
- 30.Schmierer K, Wheeler-Kingshott CA, Boulby PA, et al. Diffusion tensor imaging of post mortem multiple sclerosis brain. NeuroImage 2007;35:467–477. [DOI] [PMC free article] [PubMed] [Google Scholar]
- 31.De Stefano N, Airas L, Grigoriadis N, et al. Clinical relevance of brain volume measures in multiple sclerosis. CNS Drugs 2014;28:147–156. [DOI] [PubMed] [Google Scholar]
- 32.Cifelli A, Matthews PM. Cerebral plasticity in multiple sclerosis: insights from fMRI. Mult Scler 2002;8:193–199. [DOI] [PubMed] [Google Scholar]
Associated Data
This section collects any data citations, data availability statements, or supplementary materials included in this article.


