


Abstract
In recent times, high-throughput screening analyses have broadly defined the RNA cellular targets of TDP-43, a nuclear factor involved in neurodegeneration. A common outcome of all these studies is that changing the expression levels of this protein can alter the expression of several hundred RNAs within cells. What still remains to be clarified is which changes represent direct cellular targets of TDP-43 or just secondary variations due to the general role played by this protein in RNA metabolism. Using an HTS-based splicing junction analysis we identified at least six bona fide splicing events that are consistent with being controlled by TDP-43. Validation of the data, both in neuronal and non-neuronal cell lines demonstrated that TDP-43 substantially alters the levels of isoform expression in four genes potentially important for neuropathology: MADD/IG20, STAG2, FNIP1 and BRD8. For MADD/IG20 and STAG2, these changes could also be confirmed at the protein level. These alterations were also observed in a cellular model that successfully mimics TDP-43 loss of function effects following its aggregation. Most importantly, our study demonstrates that cell cycle alterations induced by TDP-43 knockdown can be recovered by restoring the STAG2, an important component of the cohesin complex, normal splicing profile.
INTRODUCTION
Nuclear factor TDP-43 was first described in 2006 as being the major component of pathological inclusions present in the brain of patients affected by Amyotrophic Lateral Sclerosis (ALS) and Frontotemporal Lobar Degeneration (FTLD-TDP) (1–4). In recent years, large efforts have been made to identify the cellular targets of this protein. The obvious rationale for this search was to identify genes that are directly affected by TDP-43 and that could therefore represent primary targets for corrective therapies or for biomarker analysis to monitor disease onset/progression (5–7).
In theory, finding TDP-43 cellular targets at the mRNA level should be a rather straightforward task. Indeed, like most hnRNPs, one of the major distinguishing features of TDP-43 is its ability to bind RNA in a very specific manner through the presence of two RRM motifs within its sequence (8,9) and following the earliest description of its RNA binding preferences, it has been long known that TDP-43 preferentially binds UG-repeats and UG-rich sequences (8). These observations were subsequently confirmed by CLIP analyses (10,11) and a high resolution nuclear magnetic resonance structure of TDP-43 binding to one of these sequences has been recently solved (9). It should also be considered, however, that the presence of a potential binding site does not always mean it will play a fundamental functional role in a particular process (12). In addition, the functional consequences of TDP-43 binding to a particular element may not be predicted in a straightforward manner, as has been recently exemplified in the case of the human SORT1 gene where TDP-43 plays a different role in regulating the human exon 17b inclusion as opposed to the one observed in exon 17b gene of the mouse Sort1 gene (13).
In recent years, the search for functional RNA binding targets has been greatly aided by the development of several high-throughput screening approaches (HTS) that allow analysis of changes in RNA processing events on a global scale, without any subjective bias aside from individual technical or sample collection limitations (14,15). As expected, many bioinformatics-based/HTS techniques have already been used to explore TDP-43 targets in several experimental systems. At present, these range from looking at gene expression changes following straight knock-out or mutant expression of this protein in a variety of cultures including primary and neuronal cell lines (10–12,16–23), in mouse/fly in vivo models (24–28), iPSC cell lines derived from ALS patients carrying TDP-43 disease-associated missense mutations (29) and even in myofibers collected from patients affected by sporadic Inclusion Body Myositis (30).
All these approaches have yielded a huge number of genes whose expression/splicing levels become altered following changes in TDP-43 expression/localization. This result is not surprising if we consider the high number of molecular pathways in which TDP-43 seems to be involved, that include mRNA/lncRNA/miRNA processing, mRNA transport/stability and mRNA translation (3). However, this abundance of targets also suggests that all of these changes can not be ascribed to a direct consequence of just TDP-43 action, as recently reviewed by us (6). The reason being that most hnRNPs regulate mRNA splicing processes in a highly cooperative manner (31–33) and it is possible that many of the TDP-43 functional roles can also be dependent on the presence of specific partners. Indeed, TDP-43 is certainly no exception to this situation at least with regards to its role in splicing regulation (34).
To date, there are still very few genes whose splicing is known to be directly affected by TDP-43 levels at endogenous level (5). Among these, the best characterized are: human CFTR exon 9 (35), SKAR/POLDIP3 exon 2 (36,37), intron 7 in the 3′ UTR of TDP-43 mRNA (38) and Sort1 exon 17b (13). In addition, substantial changes in the endogenous protein production in neuronal cell lines following TDP-43 depletion were shown only for SKAR/POLDIP3 and the TDP-43 protein itself (36–38). From the point of view of understanding TDP-43 pathology, therefore, this could represent a crucial aspect of future therapeutic approaches. In fact, several lines of evidence from animal and cellular models are supporting the hypothesis that loss of normal TDP-43 function in the nucleus as a result of its sequestration in the insoluble aggregates, may represent the key factor in TDP-43 proteinopathies (39).
In order to increase our knowledge of the consequences of TDP-43 depletion in the cell we have now performed a series of overlapping HTS taking advantage of a series of very similar HEK293 cell lines that can be induced to express a variety of TDP-43 mutants (40). Due to the similar background between these lines, this approach has been particularly useful in identifying several novel genes where TDP-43 can play a direct role in regulating protein isoform production.
MATERIALS AND METHODS
Cell culture, RNA interference and RNA purification for microarray analysis
Flp-In HEK293 (Invitrogen) with inducible siRNA resistant FLAG-tagged wild-type TDP-43, F4L mutant and TDP43–12XQ/N aggregation effector have been described in detail before (40,41). Cells were cultured in DMEM-Glutamax-I (GIBCO) supplemented with 10% fetal bovine serum (EuroClone). Induction of tagged TDP-43 expression was achieved with 1 μg/ml tetracycline (Sigma).
Depletion of endogenous TDP-43 was performed by RNA interference using HiPerFect Transfection Reagent (Qiagen) and siRNA specific for TDP-43 (Dharmacon; target sequence 5′-aagcaaagccaagaugagccu-3′). Shortly before transfection 5 × 10⁵ cells were seeded in 6-well plates in 1.4 ml of culture medium containing serum and antibiotics. A total of 3 μl of 40 μM siRNA TDP-43 was diluted in 91 μl of Opti-MEM (Life Technologies) and 6 μl of HiPerFect Transfection Reagent (Qiagen) was added to the diluted siRNA. Following 10 min of incubation the complexes were added drop-wise onto the cells. After 24 h the same procedure was performed with the exception that the cells were detached from the 6-well plates and re-seeded shortly before transfection. Three siRNA transfections were performed for each experiment. The siRNA against the firefly luciferase gene was used as a control (Dharmacon Non-Targeting siRNA #2).
SiRNA mediated interference of endogenous STAG2 exon 30b-containing-isoform was performed in HeLa cells using two sets of siRNA: STAG2 siRNA A1 Fw: 5′-uagcucaaagacaacaaga[dT][dT]-3′ and Rv: 5′-ucuuguugucuuugagcua[dT][dT]-3′; STAG2 siRNA A2 Fw: 5′-gcgaacuaaucuucagcau[dT][dT]-3′ and Rv: 5′-augcugaagauuaguucgc[dT][dT]-3′ (Sigma-Aldrich). Each siRNA was used at a final concentration of 80 nM using Oligofectamine Transfection reagent (Life Technologies) according to manufacturer's instructions. The siRNA transfection procedure was performed twice in two consecutive days. On the third day cells were collected. Similarly, siRNA-mediated depletion of TDP-43 in HeLa cells was carried out using a final concentration of 80 nM of the previously described siRNA and Oligofectamine Transfection reagent (Life Technologies) according to manufacturer's instructions.
Total RNA from individual samples was purified using TRIzol reagent (Invitrogen) according to manufacturer's instructions. Specifically for the microarray analyses, total RNA extracted from four groups of HEK293 cells: control cells (siRNA Luciferase), cells depleted of TDP-43, cells expressing inducible siRNA resistant FLAG-tagged wild-type TDP-43 or F4L mutant, underwent RNA quality control and microarray analysis at GenoSplice (France).
Microarray and data analysis
Affymetrix HJAY were normalized using ‘Probe scaling’ method and background corrected with ProbeEffect from GeneBase (PMID: 18984598). Gene expression index was computed from probes that were selected using ProbeSelect from GeneBase (PMID: 18984598). The gene expression signal was computed using these probes. Genes were considered expressed if mean intensity ≥500. Genes were considered as regulated if (i) they were expressed in at least one condition (e.g. siTDP43 and/or siCTRL); (ii) fold-change was greater or equal than ≥2 and; (iii) unpaired t-test P-value between gene intensities was ≤0.05.
For each probe, a splicing-index was computed. Unpaired t-tests were performed to test the difference in probe expression between the two samples as described previously (PMID: 24623796, 4358235, 23393189). Probe P-values in each probeset were then summarized using Fisher's method. Using annotation files, splicing patterns (cassette exons, 5′/3′ alternative splice sites and mutually exclusive exons) were tested for differences between isoforms, selecting the ones with a minimum number of regulated probeset (with a P-value ≤ 0.01) in each competing isoform. For example, for cassette exon, the exclusion junction and at least one of the three inclusion probesets (one exon probeset and two inclusion junction probesets) have to be significant and have to show an opposite regulation for the splicing-index.
These data are publicly available from the GEO NCBI database. The ID for our datasets is the following: GSE67195.
Minigene constructs
For the MADD minigene, exon 31 together with 278 and 261 bp of 5′ and 3′ flanking intronic sequences were amplified using forward primer 5′-ccatatggaggccagcagcagggccttcgg-3′ and reverse primer 5′-ccatatggttcactgagctgcttcaggacc-3′. Both primers contained NdeI restriction sites at the 5′ ends that were used to clone the 609 bp fragment into the pTB reporter minigene, which is a modified version of the α-globin-fibronectin-EDB minigene. For STAG2, a three-exon minigene construct was prepared using the following primers: one set 5′-cggggtaccctgaagaaagtagtagtagtgacag-3′ forward and 5′-ataagaatgcggccgccaatggggagccacaga-3′ reverse, was used to amplify the first fragment of 898 bp (exon 30, intron 30, exon 30b and 508 bp of downstream intronic sequence) whereas the second set, 5′-ataagaatgcggccgcctctgtttgccatggtagac-3′ forward and 5′-atatatgggccccaaatctatatccatggtgtcaaaatcc-3′ reverse were used to amplify the second fragment of 737 bp (610 bp of upstream intronic sequence of exon 31 and exon 31 itself). The two fragments were sequentially cloned into the pcDNA3 vector. All constructs were confirmed by standard Sanger sequencing prior to transfection.
Mutagenesis in both MADD and STAG2 minigenes was performed using the Quik-change® Site-Directed mutagenesis kit according to the manufacturer's guidelines. Specifically for the MADD intronic sequence (5′-gtgtgctgtgt-3′) the primers: MADD MUT Fw (5′-gggtggggctgtagctgggagaACAtAcCgCgaggggcaggggtggagcctgtgggc-3′) and Rv (5′-gcccacaggctccacccctgcccctcGcGgTaTGTtctcccagctacagccccaccc-3′), mutated nucleotides in capital letters, were used in the mutagenesis polymerase chain reaction (PCR). Mutants were then confirmed by sequencing. For STAG2, the two sets of primers used for deletions of fragments 3 and 5 consisted of STAG2delta3 Fw 5′-ctattgtattagcttcatcattttccatt-3′ and Rv 5′-aatggaaaatgatgaagctaatacaatag-3′ and STAG2delta5 Fw 5′-tgagtgagtgcgcgcatgcctggtacaccatcattttccattatacttgaatatag-3′ and Rv 5′-ctatattcaaagtataatggaaaatgatggtgtaccaggcatgcgcgcactcactca-3′. DpnI digestion at 37°C was performed for all PCR products prior to transformation in DH5α Escherichia coli cells.
Approximately 3 μg of each minigene expression plasmid was transfected into the cells using a modified calcium phosphate (CaPO4) precipitation method. This was performed after 72 h of RNA interference and cells were incubated at 37°C with 5% CO2 for 24 h.
Standard RT-PCR analysis
Total RNA from individual samples was purified using TRIzol reagent (Invitrogen) according to manufacturer's instructions. The cDNA synthesis was performed using 1 μg of each RNA sample and Moloney murine leukemia virus reverse transcriptase (Invitrogen) and random hexameric primers. PCR analysis was performed using the following primers: BIM/Bcl-2 Fw 5′-tctgagtgtgaccgagaagg-3′; BIM/Bcl-2 Rv 5′-tcttgggcgatccatatctc-3′; SKAR/POLDIP3 Fw 5′-gcttaatgccagaccgggagttg-3′; SKAR/POLDIP3 Rv 5′-tcatcttcatccaggtcatataaatt-3′; STAG2 Fw 5′-gtatgtttacttggaaaagttcatg-3′; STAG2 Rv 5′-tgattcatccataattgaagctgga-3′; MADD Fw 5′-gacctgaattgggtggcgagttccct-3′; MADD Rv 5′-cattggtgtcttgtacttgtggctc-3′; FNIP1 Fw 5′-gctacaagatagtcttgaattcatc-3′; FNIP1 Rv 5′-cagaccgtgctatgccactgtctct-3′; BRD8 Fw 5′caattcttggccacgcagttgatta-3′; BRD8 Rv 5′-ctcagagagaaagtggaggaggttc-3′. The primers used in amplification of all the other genes tested in this study and listed in Supplementary Figure S4 are available upon request.
In all experiments exon inclusion/exclusion was quantified using Image J according to the methodology described in (42).
Recombinant GST-TDP-43 purification, western blots and antibodies
The production and purification of GST-TDP43 in a bacterial expression system has already been described (35). Western blots were performed according to standard protocols using the following antibodies: home-made rabbit polyclonal antibody for TDP-43 previously described by us (35), home-made mouse polyclonal antibody for tubulin, rabbit polyclonal antibody for STAG2 (Cell Signaling Technology) and polyclonal rabbit antibody for MADD (Santa Cruz).
Electrophoretic-mobility shift assays (EMSA)
For MADD exon 31 electrophoretic-mobility shift assays (EMSA) analysis, 278 bp of exon 31 immediate upstream intronic sequence were selected and divided into three separate fragments by PCR amplification with primers containing a T7 promoter sequence on the forward primer of each pair that would allow T7 in vitro transcription. The resultant RNA was used in the band shift analysis. Primers used in the amplification of each MADD fragment were as follows: MADDIn30Fg1Fw: 5′-TACGTAATACGACTCACTATAGGaggccagcagcagggccttcgggttg-3′ (capital letters indicate T7 promoter sequence) and MADDIn30 Fg1Rv: 5′-accttccgctcctggcc -3′, MADDIn30Fg2Fw:
5′-TACGTAATACGACTCACTATAGGtacatgccctttctgctatcttcgct-3′ and MADDIn30Fg2Rv: 5′-aagaaagtctatttcc-3, MADDIn30Fg3 Fw: 5′-TACGTAATACGACTCACTATAGGtgtgtgggtggggctgtagc-3′ and MADDIn30Fg3Rv: 5′-ggtaaggcccacag-3′. PCR products obtained were then gel purified and used as templates for in vitro T7 (Stratagene) RNA transcription. Integrity of all transcribed RNA fragments was confirmed by electrophoresis on a 1.5% agarose formaldehyde gel (Supplementary Figure S7A). The produced RNA was used as competitor to the positive (TDP-binding) control RNA oligo (UG6), which was synthesized by Sigma and radio-labelled using γ-32P adenosine triphosphate (ATP) (PerkinElmer) and T4 polynucleotide kinase (New England Biolabs). Briefly, 5 μl of RNA oligo (100 ng/μl), 1X T4 polynucleotide kinase buffer, 1 μl of T4 polynucleotide kinase (10 U/μl, New England BioLabs) and 1 μl of γ-32P ATP (100 μCi/μl) were incubated for 1 h at 37°C. The labelled oligo was then precipitated in three volumes ethanol and 3M NaAc pH 5.2 for an 1 h on dry ice and subsequently washed with 70% ethanol. Following centrifugation, the air-dried pellet was resuspended in 50 μl dH2O and 1 μl used in the binding reaction. Protein binding reactions with the labelled oligo with or without the competitors were performed in 1X binding buffer (10 mM NaCl2, 10 mM Tris pH 8.0, 2 mM MgCl2, 5% Glycerol and 1 mM DTT) containing RNase inhibitor 1U/μl (Life Technologies) for 10–20 min at room temperature prior to electrophoresis on a 6% Polyacrylamide gel at 100 Volts for 1.5 h in 0.5X Tris borate/ethylenediaminetetraacetic acid buffer at 4°C. The gel was then dried on 3MM Whatman paper and exposed on a Cyclone™ Phosphor screen (Packard).
Similarly, for the STAG2 3-exon minigene EMSA analysis exon 30b together with 1041 bp of the downstream intronic region was divided into five separate fragments by PCR amplification using primers containing a T7 promoter sequence. Primers used in the amplification of each fragment were as follows; STAG2 Fragment 1: Fw 5′-TACGTAATACGACTCACTATAGGcacgcaggtaacatggatgtta-3′ (capital letters indicate T7 promoter sequence) and Rv 5′-atggcatgctga-3′, Fragment 2: Fw 5′- TACGTAATACGACTCACTATAGGgtaagtgagagtgccttatt-3′ and Rv 5′-aagctaatacaata-3′, Fragment 3: Fw 5′-TACGTAATACGACTCACTATAGGtctaactggttttcttccctcaa-3′ and Rv 5′-gtgtaccaggcatg-3′, Fragment 4: Fw 5′-TACGTAATACGACTCACTATAGGctgtcacgtagtaggcattgtgtgagtgagtgcgcgca-3′ and Rv 5′-gtgtaccaggcatgcgcgcact-3′, Fragment 5: Fw 5′-TACGTAATACGACTCACTATAGGattaggtactgaatgaatga-3′ and Rv 5′-gaattaaaggtcag-3′. Resultant PCR products were then gel purified and used as templates for in vitro T7 (Stratagene) RNA transcription. Integrity of all transcribed RNA fragments was confirmed by electrophoresis on a 1.5% agarose formaldehyde gel (Supplementary Figure S7B). Competition binding analyses were performed against a known positive binder (UG6) of TDP-43, described above.
Quantitative real time PCR analysis
RNA extraction and cDNA synthesis was performed as previously described. In addition, in order to detect genomic DNA contamination, parallel cDNA synthesis reactions for each RNA sample were performed in the absence of reverse transcriptase. The quantification of gene expression levels was performed by real-time PCR using SYBR green technology. Specific primers for STAG2, MADD, FNIP, BRD8 and GAPDH genes were designed using Beacon designer software (Bio-Rad) and are as follows: STAG2 Fw 5′-aaaatcaaaaccatctacagg-3′, STAG2 Rv 5′-tactactactttcttcagtgag-3′, MADD Fw 5′-tctcaagcgcctggtg-3′, MADD Rv 5′-ctctcgaaggtcatgcag-3′, FNIP1 Fw 5′-cattcctctcagagtgtgg-3′, FNIP1 Rv 5′-ccatgtcttgtcgtttgc-3′, BRD8 Fw 5′-gcagcctgttacagatgac-3′, BRD8 Rv 5′-aatagttgacaaatccataggc-3′. The housekeeping gene GAPDH was used to normalize the results. All amplifications were performed on a CFX96 real-time PCR detection system (Bio-Rad). The relative expression levels were calculated according to Livak method (43), using the equation ΔCT = CT(target) – CT(normalizer) for Ct normalization; and the difference between ΔCT test (anti-TDP-43 siRNA-treated cells) and ΔCT calibrator (anti-luciferase siRNA-treated cells) to calculate the expression ratio and compare the expression levels of genes of interest. The data shown are the mean fold induction ± SD from three independent experiments. Statistical significance was calculated using student's t-test (indicated as *** for P ≤ 0.001; as ** for P ≤ 0.01 and as * for P ≤ 0.05. NS stands for not statistically significant).
Fluorescence-activated cell sorting analysis (FACS)
Cell cycle profiles (DNA content) of differentially treated HeLa cells were performed by DNA staining with propidium iodide (Sigma-Aldrich) and flow cytometry on a FACSCalibur apparatus (Becton Dickinson). The cell distributions of cell cycle profile were determined by a Modfit LT 3.0 and FlowJo software.
RESULTS
TDP-43 expressing cell lines and splice sensitive microarray analysis
In order to investigate TDP-43 effects on alternative splicing profiles we took advantage of two previously described HEK293 cell lines (40) that express, upon tetracycline induction, a siRNA-resistant wild-type TDP-43 (FLAG-TDP43-WT) or a siRNA-resistant mutant unable to bind RNA (FLAG-TDP43 F4L). The experimental design of this experiment consisted in obtaining four separate microarray datasets. The first was a control sample derived from HEK293 cells treated with a control luciferase siRNA (Figure 1A, Cont.). The second sample was obtained from RNAi-TDP-43 depleted HEK293 cells (Figure 1A, Sample A). The third sample was from cells where RNAi-TDP-43 depletion was rescued by inducing the production of a siRNA-resistant TDP-43 WT protein (Figure 1A, Sample B). Finally, the fourth sample was obtained from TDP-43 depleted cells producing a siRNA-resistant TDP-43 mutant that could not bind RNA (F4L, Figure 1A, Sample C). In order to provide a uniform background for comparison with Sample B and C, tetracycline was also added to the control and RNAi-TDP-43 depleted cells HEK293 (Figure 1A, Cont and Sample A).
Figure 1.
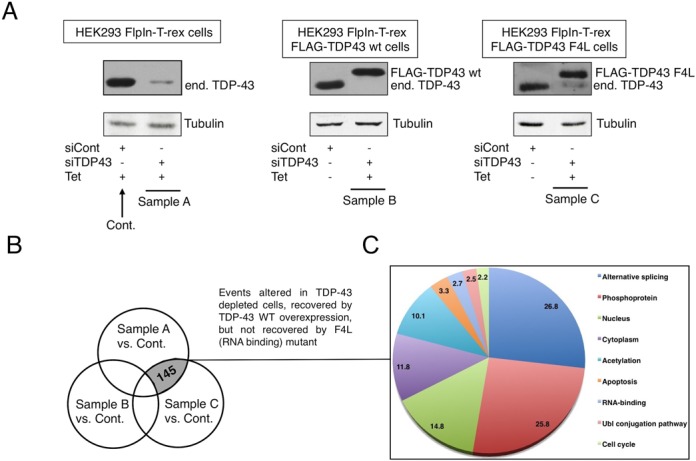
TDP-43 expressing cell lines and splice sensitive microarray analysis. (A) The first panel on the left shows the control HEK293 Flp-In T-rex cell line, the central panel shows the HEK293 Flp-In T-rex cell line that can inducibly express a siRNA-resistant wild-type TDP-43 (FLAG-TDP43-WT) and the right panel shows the HEK293 Flp-In T-rex cell line that can inducibly express a siRNA-resistant mutant form of TDP-43 unable to bind RNA (FLAG-TDP43 F4L). Each group of cells was treated either with control Luciferase siRNA or TDP-43 siRNA. All cells were also treated with Tet in order to provide identical conditions for analysis. Expression of WT TDP-43 and the F4L mutant and endogenous TDP-43 silencing were determined by western blot analysis using a polyclonal antibody against this protein. An anti-tubulin antibody was used as protein loading control. Samples used for microarray analysis are indicated as Control, Sample A, Sample B and Sample C. (B) Venn diagram showing which type of splicing events were further analysed. (C) KEGG analysis showing the cellular pathways in which the selected genes are involved.
After total RNA extraction of triplicate independent batches from each set of samples the isolated mRNAs were hybridized using Affymetrix Hjay (Junction Arrays) at Genosplice (France) (raw data are available in the GEO NCBI database with the following ID: GSE67195). These arrays provide exon and exon-junction analyses and can assess a change in exon inclusion in all known human transcripts based on combined junction and exon evidence. In particular, they are able to detect three types of splicing events: differential cassette exon splicing, mutually exclusive splicing and differential use of 5′/3′ splice sites.
The differences in splice site usage detected in Samples A, B and C (Figure 1B) were then compared with each other to find events consistent with a direct effect of TDP-43. This was considered to occur if they satisfied all three of the following criteria: (i) events must be altered following depletion of TDP-43 (Sample A), (ii) events must be rescued by the induction of the flagged si-resistant TDP-43 WT (Sample B), (iii) events cannot be rescued following induction of the flagged si-resistant TDP-43 F4L mutant (Sample C). As shown in the Venn diagram of Figure 1B, the number of splicing events that satisfied all these three requirements was 145.
The Kyoto Encyclopaedia of Genes and Genomes (KEGG) database (44) was used for retrieving pathway information of this splicing event list. The combination of pathway data and gene ontology analysis of differentially spliced genes was visualized by a pie chart using colour codes indicating the distribution of the implicated biological processes. Interestingly, this analysis showed that splicing variations were mostly enriched in genes involved in Alternative Splicing/RNA binding and Phosphoproteins (Figure 1C). In addition, many genes present in this list were also related to Ubl conjugation pathway and apoptotic pathways that have previously been associated with TDP-43 (see Discussion). This narrowed-down number of genes represented a substantial enrichment compared to the more than 900 splicing events that were detected to change following antisense-mediated depletion of TDP-43 in mouse brains (11) or the list of several hundred genes whose expression was altered following TDP-43 depletion in various cell lines (16,17). In relation to these previously reported results, very little overlap was observed between the genes detected in our screening and the ones reported in these studies (Supplementary Figure S1). As already mentioned, however, this is not particularly surprising and may well reflect differences at the technical/methodological level as well as the possibility that TDP-43 functions may vary considerably from cell to cell. In addition, it should be noted that changes in ratio of splicing isoforms within the same gene do not necessarily imply changes in gene expression (see below).
All the 145 genes were divided into three different Venn diagrams accordingly to the alternative splicing event analysed and the full list of names of the genes is reported in each of the closed boxes in Supplementary Figure S2. Firstly, from this list it can be noted that among the positive hits both BIM and SKAR/POLDIP3 were present, two genes that were previously reported and shown to change following TDP-43 depletion by several laboratories (10,36). Indeed, the splicing profile of BIM confirmed that removing TDP-43 from cells induced a shift towards the increased expression of the pro-apoptotic BIMS isoform with respect to the anti-apoptotic isoforms BIML/BIMEL (Supplementary Figure S3A, compare lanes 1 and 2). Most importantly, this shift in splicing isoforms could be reverted in the cells that expressed a wild-type si-resistant TDP-43 (lane 3) and no rescue could be observed in the cell line expressing the F4L mutant (lane 4). In keeping with this pattern, the same type of influence on splicing for SKAR/POLDIP3, could also be observed, where inclusion of exon 3 was abolished following endogenous TDP-43 depletion (Supplementary Figure S3B, lane 2), rescued by the expression of the si-resistant FLAG-TDP43 WT (lane 3) and not rescued by the FLAG-TDP43 F4L mutant (lane 4).
The list of 145 genes was also analysed according to three types of splicing events: (i) differential cassette exon splicing, (ii) mutually exclusive exon splicing events, and (iii) differential usage of 5′/3′ splice sites (Figure 2A–D). As shown in these figures, the splicing events mediated by TDP-43 highlight an increased number of cassette exons included when TDP-43 is silenced or inactivated, suggesting that in a majority of cassette exons TDP-43 acts as a negative regulator of splicing (Figure 2A). With regards to mutually exclusive exons, it is observed that absence/inactivation of TDP-43 leads to the preferential inclusion of exon 2 in comparison to exon 1 (Figure 2B and C). Finally, although numbers were very low, an increased number of exons short form generated by alternative 5′ and 3′ss usage compared to exons long form was also observed (Figure 2D).
Figure 2.
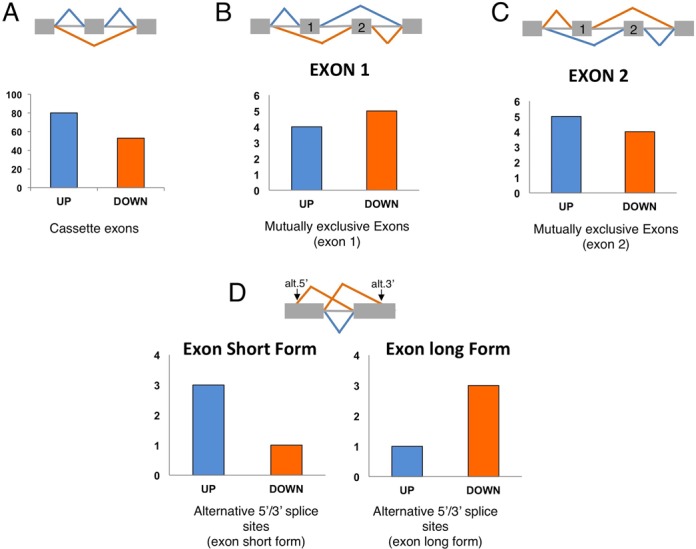
Analysis of the splicing events mediated by TDP-43. (A) Bar graphs show the number of exons included (Up) and excluded (Down) of the cassette exons analyzed. (B and C) Bar graphs show the number of exons included (Up) or excluded (Down) of the nine mutually exclusive exons analysed (exon 1 in B and exon 2 in C). (D) Bar graphs show the number of exons included (Up) and excluded (Down) of the analysed alternative 5′/3′ splice sites (exon short form, left graph, and exon long form, right graph).
Identifying new genes whose splicing and protein expression profile was affected by TDP-43 depletion
In order to identify new candidates whose splicing profile was clearly altered in the same manner as BIM and SKAR/POLDIP3, gene candidates listed in Supplementary Figure S2 that presented more than a two-fold change in their splicing profile were tested for subsequent validation and are reported in Supplementary Figure S4A. It should be noted that in this screening we looked for genes in which splicing alteration could be readily detected using standard RT-PCR approaches and not using more sensitive techniques such as RT-qPCR. The reasoning behind this choice was to facilitate a search for genes whose splicing profile would very likely result in a robust change in protein isoforms, as previously described, for example, for SKAR/POLDIP3. As such, for genes in which no clear alteration in the total ratio of splicing profile could be detected (Supplementary Figure S4B), no further analysis was pursued. Thus, the four best candidates to be further characterized at the protein level were the following: STAG2 (Figure 3A), MADD (Figure 3B), FNIP1 (Figure 3C) and BRD8 (Figure 3D). As shown in Figure 3, in all these genes each relevant exon behaved as would be expected of an exon dependent on TDP-43 for definition. Briefly, exon inclusion levels where affected when TDP-43 was removed, were restored by the presence of wild-type siRNA-resistant TDP-43, but could not be restored by the adding-back of a siRNA-resistant TDP-43 lacking the ability to bind RNA. At the protein level, the consequence of the splicing events in STAG2, FNIP1 and BRD8 genes was predicted to be the insertion/removal of a particular set of amino acids in the final protein sequence (shown in Supplementary Figure S5). In the case of MADD/IG20, on the other hand, exclusion of the affected exon was predicted to introduce a premature stop codon possibly leading to degradation of the transcript by Nonsense Mediated Decay (NMD) (see below).
Figure 3.
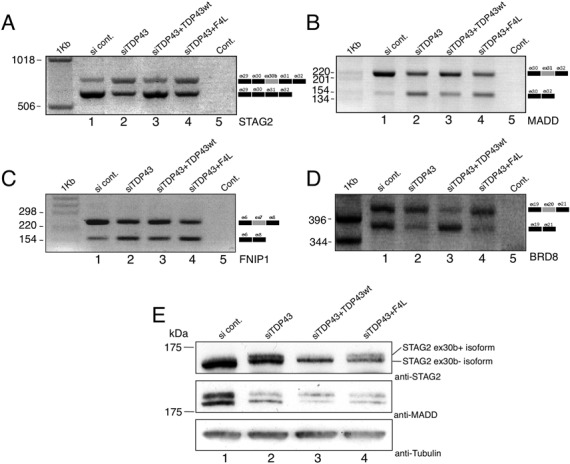
Effect of TDP-43 on the alternative splicing of selected genes. Differentially treated HEK293 stable cell lines were used to validate each candidate gene: control siRNA Luciferase transfected cells (lane 1, si cont.), depleted of TDP-43 (lane 2, siTDP43), depleted of endogenous TDP-43 but expressing a siRNA resistant transgenic TDP-43 (lane 3, siTDP43 + TDP43wt), depleted of endogenous TDP-43 and expressing a mutant form of a siRNA resistant protein unable to bind RNA (lane 4, siTDP43 + F4L). (A) Standard RT-PCR of STAG2 transcripts. The diagrams on the right are a schematic representation of the amplicons. The grey box represents the alternative exon 30b. (B) Standard RT-PCR of MADD transcripts. The diagrams on the right are a schematic representation of the amplicons. The grey box represents the alternative exon 31. (C) Standard RT-PCR of FNIP1 transcripts. The diagrams on the right are a schematic representation of the amplicons. The grey box represents the alternative exon 7. (D) Standard RT-PCR of BRD8 transcripts. The diagrams on the right are a schematic representation of the amplicons. The grey box represents the alternative exon 20. (E) Endogenous STAG2 and MADD protein expression levels following treatment with siTDP-43 (lane 2), rescue in the cell line expressing an si-resistant TDP-43 (lane 3, siTDP43+TDP43wt), and following expression of the RNA-binding impaired mutant F4L (lane 4, siTDP43 + F4L). Anti-tubulin was used for protein loading control.
Validating the genes affected by TDP-43 depletion at the protein expression level
To test whether these changes in splicing profile were reflected in the level of the protein isoforms produced by their differentially processed mRNAs, western blots were performed using antibodies directed against STAG2 and MADD (Figure 3E). These showed that the protein isoforms were changing accordingly to the observed changes in the mRNA isoforms.
In particular, for STAG2 the protein isoform that includes exon 30b is normally barely visible in HEK293 control cells (Figure 3E, lane 1). However, it becomes readily detectable following TDP-43 depletion (Figure 3E, lane 2), is repressed again by the production of the wild-type siRNA-resistant TDP-43 (Figure 3E, lane 3), but is not repressed when the F4L mutant is expressed in the absence of endogenous TDP-43 (Figure 3E, lane 4). Furthermore, at the mRNA expression level the overall expression of STAG2 was not affected by TDP-43 removal (Supplementary Figure S6), suggesting that changes in isoform expression do not significantly alter the total amount of STAG2 proteins in cells (in accordance with the western blots).
In the case of MADD, exclusion of exon 31 sequence gives rise to a truncated isoform due to the introduction of a stop codon within the mRNA sequence that will truncate any resulting MADD protein isoform before its normal stop codon. In the control HEK293 cells, two isoforms of this protein are expressed in almost equal proportions (Figure 3E, lane 1). Based on the commercial antibody specificity, the upper band should correspond to the full length MADD protein that includes exon 31. Following TDP-43 depletion, the expression of the upper band is decreased (Figure 3E, lane 2). This decrease is reversed following overexpression of TDP-43 WT (Figure 3E, lane 3) but not TDP-43 F4L mutant (Figure 3E, lane 4). At the overall gene expression level, furthermore, the results of an RT-qPCR (Supplementary Figure S6) showed that exon 31 skipping is associated with a significant reduction in the expression of the MADD gene (primers were chosen to amplify all isoforms). This observation is consistent with western blot results. However, no complete recovery in expression levels could be detected when the wild-type siRNA-resistant TDP-43 was added back (Figure 3E, lane 3). At the moment, we have no explanation for this but it may well be that protein recovery levels are lagging behind mRNA recovery because of its very high molecular weight.
Finally, western blot analysis could not unfortunately be performed for the BRD8 and FNIP1 genes as antibody preparations against these proteins failed to specifically detect them in a satisfactory manner (data not shown). However, RT-qPCR of their overall expression levels detected a significant increase in the total amount of RNA, suggesting that, upon TDP-43 depletion, also this property might be affected in addition to splicing isoforms ratio (Supplementary Figure S6).
Mapping the interaction between TDP-43 and MADD sequences
To better characterize the interaction between TDP-43 and the MADD gene it was of interest to investigate the mechanism through which TDP-43 was promoting the inclusion of exon 31. We used an EMSA approach to investigate which region was the TDP-43 target. Firstly, we analysed the immediate upstream intronic sequence of MADD exon 31 since it contained a tg-gt stretch (Figure 4A, underlined) and pyrimidine-rich sequences, to which TDP-43 has been reported to bind in some cases (21). The intron was divided into three fragments (listed in Figure 4A) which were in vitro transcribed and used in an in vitro binding experiment to determine their specificity in competitively binding to recombinant GST-TDP-43 WT in the presence of a (UG)6-repeated sequence oligo (8). The integrity of the in vitro transcribed fragments was verified in an agarose formaldehyde gel (shown in Supplementary Figure S7A). From this experiment, an increase in unbound labelled (UG)6 was observed when fragment 3 was used (Figure 4B, arrow). Interestingly, fragment 3 contained the tg-gt repeated sequence mentioned above (Figure 4A, underlined). To verify whether this sequence was indeed responsible for the TDP-43 binding, we used a small RNA oligo carrying this sequence to compete with (UG)6-repeated oligonucleotide. As expected, an increase in unbound labelled (UG)6 was observed when we used the small intronic sequence (Figure 4B, right panel). To functionally test this interaction we created a hybrid minigene containing the whole sequence of MADD exon 31 together with 278 and 261 bp of upstream and downstream flanking intronic regions, respectively (Figure 4A). Analysis of the mRNA produced from the minigene following transfection confirmed that knockdown of TDP-43 resulted in an approximate four-fold decrease in efficiency of exon 31 recognition (Figure 4C). Subsequently, to functionally confirm the significance of TDP-43 binding to the intron flanking MADD exon 31, we mutated the tg-gt rich sequence upstream of the exon in order to destroy the TDP-43 binding site (mutant pTB/MADD GT Mut, which nucleotide changes are shown in Figure 4A, bottom panel). As shown in Figure 4D, this mutation resulted in an increased skipping of this exon (left panel). Importantly, when we transfected the mutated construct in TDP-43 depleted cells, the extent of exon skipping did not change suggesting that the selected tg-gt repeated sequence represents the unique TDP-43 binding site in the pTB/MADD minigene (Figure 4D, right panel).
Figure 4.
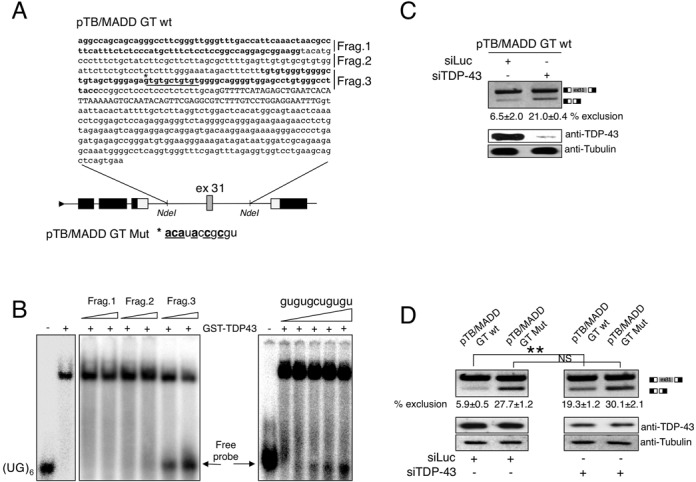
Mapping the functional TDP-43 binding sites in the region surrounding MADD exon 31. (A) Schematic diagram of the minigene system to test the effect of TDP-43 on MADD exon 31 inclusion (pTB/MADD GT WT). The α-globin, fibronectin EDB and human MADD exon 31 are shown as black, white and grey boxes, respectively. Diagram on the top shows MADD exon 31 (upper case) together with part of its intronic flanking regions cloned in the minigene. For the EMSA competition analysis the upstream intron was divided into three fragments (Frag1–3), which are indicated with alternating bold and plain letters. The underlined tg-gt-repeated sequence in the upstream intron represents the putative TDP-43 binding region. Mutagenesis of the TDP-43 binding region is shown and indicated as pTB/MADD GT Mut. (B) Band shift competition analysis using recombinant TDP-43 and labelled (UG)6 RNA. As competitors, cold RNAs of the indicated fragments of exon 31-upstream intron were used. The arrow indicates labelled unbound (UG)6 RNA which increases in accordance with increasing amounts of competitor used. (C) RT-PCR analysis performed on pTB/MADD GT WT-transfected in HEK293 cells upon treatment with control siRNA Luciferase and TDP-43 siRNA. Schematic representation of the amplicons is shown on the right. Efficiency of TDP-43 knockdown is shown in the lower panels by western blot. An anti-tubulin antibody was used as protein loading control (bottom of the panel). ImageJ quantification of exon exclusion percentage and corresponding standard deviations performed on three different experiments are indicated. (D) RT-PCR performed on HEK293 cells transfected with the minigene carrying the wild-type TDP-43 binding region (pTB/MADD GT wt) and the mutated one (pTB/MADD GT Mut) upon treatment with control siRNA Luciferase and TDP-43 siRNA. Schematic representation of the amplicons is shown on the right. Efficiency of TDP-43 knockdown is shown in the lower panels by western blot. An anti-tubulin antibody was used as protein loading control (bottom of the panel). ImageJ quantification of exon exclusion percentage and corresponding standard deviations performed on three different experiments are indicated, as well as P-values where *** means P ≤ 0.001, ** means P ≤ 0.01 and *means P ≤ 0.05. NS indicates not statistically significant difference.
Mapping the interaction between TDP-43 and STAG2 sequences
A similar attempt to recapitulate the splicing of STAG2 using a single exon (exon 30b with part of its intronic flanking regions) in the pTB minigene did not result in any changes in the splicing profile as it produced only skipped transcripts. This is probably due to the fact that in many minigenes it is important to maintain as much as possible of the original genomic milieu in order to successfully reproduce the same splicing behaviour observed in the endogenous gene (45). For this reason, a heterologous minigene was constructed, pcDNA3/STAG2 ex 30–30b-31 that included exon 30, intron 30, exon 30b, most of the downstream intron and exon 31 (see schematic diagram in Figure 5A). Following transfection of this minigene in TDP-43 depleted cells, it was possible to confirm that in the absence of this factor the inclusion levels of exon 30b were increased approximately three-fold (Figure 5A).
Figure 5.
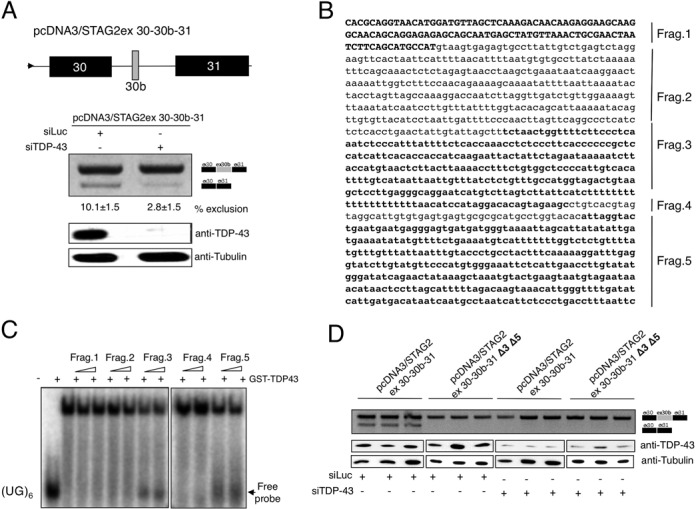
Mapping the functional TDP-43 binding sites in the region surrounding STAG2 exon 30b. (A) Schematic diagram of the minigene system to test the effect of TDP-43 on STAG2 exon 30b inclusion. The STAG2 exon 30 along with its downstream intron, exon 30b along with most of its downstream intron and exon 31 were cloned in pCDNA 3.1. The lower panel shows an RT-PCR analysis performed on minigene-transfected cells upon treatment with control Luciferase siRNA (siLuc) and TDP-43 siRNA (siTDP-43). Schematic representation of the amplicons is shown on the right. Efficiency of TDP-43 knockdown is reported in the western blots below. An antibody anti-tubulin was used as protein loading control (bottom panel). ImageJ quantification of exon exclusion percentage and corresponding standard deviations were performed on three different experiments and are indicated. (B) Sequence of exon 30b (capital letters) together with its downstream intronic region divided into five fragments (Frag.1-Frag.5) shown with alternating bold and plain letters and used in the EMSA analysis are shown. (C) Band shift competition analysis using recombinant TDP-43 and labelled (UG)6 RNA. As competitor, cold RNAs of Fragments 1–5 were used. The arrow indicates labelled unbound (UG)6 RNA which increases in accordance with the increasing amount of fragments number 3 and 5. (D) RT-PCR analysis performed on control Luciferase siRNA and TDP-43 siRNA treated cells following transfection of STAG2 minigene (named pcDNA3/STAG2ex 30–30b-31) and of the same minigene in which the two TDP-43 binding regions 3 and 5 were depleted (named pcDNA3/STAG2ex 30–30b-31 Δ3 Δ5). Three replicates for each condition are shown. Schematic representation of the amplicons is shown on the right. Efficiency of TDP-43 knockdown is shown in the western blot below and an antibody anti-tubulin was used as protein loading control (bottom panel).
Consequently, it was necessary to determine whether TDP-43 was capable of binding in the vicinity of exon 30b. However, unlike in MADD, no discernible tg-rich sequences within the exon or flanking intronic regions were visible, which made it difficult to identify likely TDP-43 binding motifs (see scheme in Figure 5B), except for a gt/gc-rich motif designated as Fragment 4. We then performed a competition binding analysis (Figure 5C) using exon 30b (Fragment 1) and 1041 bp of the downstream intronic region divided into four fragments (Fragments 2–5). In this experiment, in vitro transcribed cold RNAs (the integrity of which is shown in Supplementary Figure S7B) representing these different regions were used in a competition assay with WT GST-TDP-43 bound to a labelled (UG)6 synthetic oligo. As shown in Figure 5C, both fragments 3 and 5 were capable of successfully competing with the (UG)6 oligo for GST-TDP-43 binding, confirming that the downstream intronic regions of exon 30b contain at least two putative binding sites for this protein. The functional importance of these regions in mediating exon 30b inclusion was then confirmed at the minigene level by engineering a mutant that lacks these two sequences (pcDNA3/STAG2ex 30–30b-31 Δ3-Δ5). As expected, mRNA analysis after transfection suggests that TDP-43-binding to Fragments 3 and 5 affects exon 30b recognition (Figure 5D).
Finally, the same approach was also attempted for the relevant exons in the FNIP1 and BRD8 genes. However, in these cases it was impossible to engineer a minigene system that could mimic the splicing profile of the endogenous transcript (data not shown). Hence, mapping the exact TDP-43 binding sites in these genes was not possible and further work will be required to better characterize these two splicing events.
Validating the functional effects of STAG2 isoforms in cell cycle regulation
STAG2 is a subunit of the cohesin complex, which regulates the separation of sister chromatids during cell division (46). Therefore, to investigate the potential impact of the TDP-43-induced STAG2 exon 30b+ isoform on cells, we decided to analyse changes on cell cycle distribution following specific depletion of this STAG2 isoform from cells. To do so, we engineered two siRNAs that were specifically designed against the STAG2 exon 30b+ isoform (Figure 6A, upper diagram, underlined sequences). The efficiency of these siRNAs to selectively knockdown this isoform was then tested together with the silencing of TDP-43 (that greatly increases its expression). As shown in Figure 6A, lower panels, addition of the STAG2 ex30b+ siRNAs was capable of specifically downregulating the expression of the STAG2 exon 30b+ isoform even in the presence of siTDP-43, without affecting the expression level of the STAG2 exon 30− isoform. We therefore proceeded to perform Fluorescence-Activated Cell Sorting (FACS) analysis on these cell lines to determine the effects of these changes on cell cycle progression. As shown in Figure 6B, middle panel, depletion of TDP-43 with the consequent upregulation of the STAG2 exon 30b+ isoform resulted in an accumulation of cells in the G2/M phase, as previously reported (16). Strikingly, additional treatment of these cells with two specific STAG2 exon 30b+ siRNAs removed the block on G2/M progression (Figure 6B, lower panel). This experiment was repeated three times and the results are graphically reported in Figure 6C.
Figure 6.
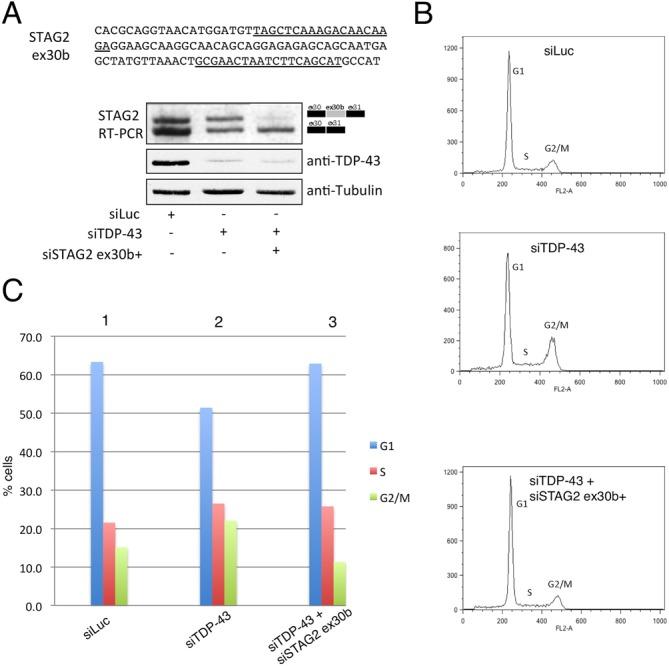
Functional effects of STAG2 exon 30b-containing isoform in TDP-43 depleted cells. (A) The upper panel shows the sequence of STAG2 exon 30b with the siRNA target sequences underlined. The lower panels show the effects of these siRNAs in specifically silencing the expression of this isoform following treatment with TDP-43 siRNA. (B) Flow cytometry profiles of HeLa cells treated with siRNA Luciferase (upper panel), siRNA TDP-43 (middle panel) and siRNAs against TDP-43 and STAG2 exon 30b-containing isoform (lower panel). (C) Histogram quantifying the cells distribution in the different phases of the cell cycle following differential siRNA treatment of cells illustrated in (B). The quantifications represent the average of three independent experiments. Corresponding standard deviations were the following: ±1.11, ±0.81, ±0.83 for the siRNA Luciferase treated cells in G1, S, G2/M respectively; ±0.83, ±0.12, ±0.72 for the siTDP-43 treated cells in G1, S, G2/M respectively and ±0.7, ±1.42, ±0.93 for the siTDP-43/STAG2 treated cells in G1, S, G2/M respectively. Significance values were calculated using the Student's t-test and were the following: for cells in G1 phase P-values were <0.05 for siRNA Luciferase versus siTDP-43 treated cells, for siRNA Luciferase versus siTDP-43/STAG2 treated cells and for siTDP-43 versus SiTDP-43/STAG2 treated cells; for cells in S-phase P-values were <0.01 for siRNA Luciferase versus SiTDP-43 treated cells, ns for siRNA Luciferase versus siTDP-43/STAG2 treated cells and for siTDP-43 versus siTDP-43/STAG2 treated cells; for cells in G2/M phase P-values were <0.05 for siRNA Luciferase versus siTDP-43 treated cells and for for siRNA Luciferase versus siTDP-43/STAG2 treated cells, <0.001 for siTDP-43 versus siTDP-43/STAG2 treated cells.
Altered splicing of the MADD, STAG2, BRD8 and FNIP1 genes using a TDP-43 loss of function model
Considering the involvement of TDP-43 in neuropathology, it was of interest to investigate whether the same alterations observed in our stable HEK293 cell lines could similarly be detected in a TDP-43 loss-of-function system recently developed in our laboratory (41). Briefly, this system is based on the tetracycline inducible expression of 12 tandem repeats of the Q/N rich region of TDP-43 (residues 342–366) fused to additional TDP-43 protein sequences. Expression of this effector causes TDP-43 aggregate formation (Figure 7A). These aggregates are able to sequester endogenous TDP-43 depleting it from the nucleus and inducing general TDP-43 loss of function effects at the pre-mRNA splicing level (41). Most importantly, this aggregation system achieves functional effects similar to TDP-43 RNAi depletion at the nuclear level without directly interfering with the expression of the endogenous gene.
Figure 7.
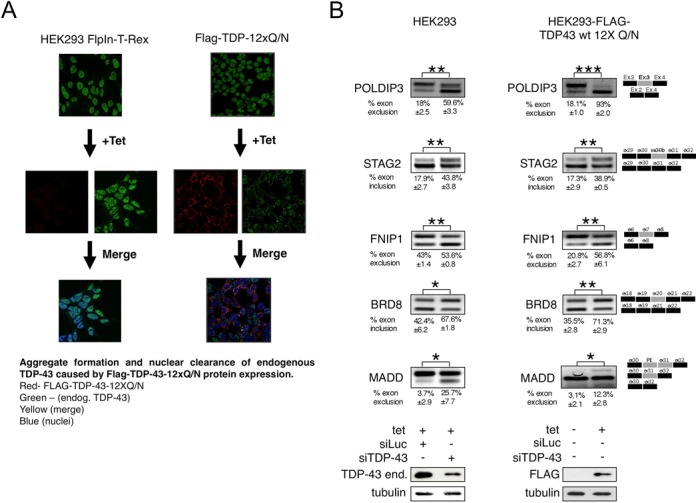
Alterations in pre-mRNA splicing levels using a TDP-43 loss of function cellular system. (A) Immunofluorescence of the endogenous TDP-43 present in untreated HEK293 FlpIn-T-Rex and FLAG-TDP-43–12XQ/N cell lines that is predominantly localized in the nucleus (visualized using an anti-TDP-43 antibody, upper panels). Following tetracycline induction the FLAG-TDP-43–12XQ/N is induced and observed using an anti-FLAG (red, middle right panels). On the other hand, no FLAG signal is observed when a non-transgenic cell line is treated with Tetracycline (middle left panels). A merge between anti-FLAG/anti-TDP-43 antibodies is reported in the lower panels showing, in the case of FLAG-TDP-43–12XQ/N cell line, the prominent aggregate formation in the cytoplasm often accompanied by TDP-43 nuclear clearance. The cell nuclei were stained with the reagent TOPRO-3. (B) shows the splicing pattern of the endogenous gene SKAR/POLDIP3, STAG2, FNIP1, BRD8 and MADD/IG20 following induction of FLAG-TDP-43–12xQ/N proteins (right panels, compare −Tet and +Tet lanes). In all cases, the result of knocking down the endogenous TDP-43 is reported (left panels). Exon inclusion was evaluated by RT-PCR. Schematic representation of the amplicons is shown on the right. Efficiency of TDP-43 knock down is reported in the western blots below. An antibody anti-tubulin was used as protein loading control (bottom panel). ImageJ quantification of exon inclusion or exclusion percentage and corresponding standard deviations were performed on three different experiments and are indicated.
Therefore, following tetracycline induction the effects of FLAG-TDP-43–12XQ/N expression on the alternative splicing profiles of SKAR/POLDIP3 (positive control), MADD, STAG2, BRD8 and FNIP1 were determined by RT-PCR. As shown in Figure 7B (right panels), in the stable cell line expressing the Flag-TDP43–12XQ/N protein the alterations in these genes closely mimicked the effects of TDP-43 depletion observed in HEK293 cell lines (Figure 7B, left panels). In particular, STAG2 exon 30b and BRD8 exon 20 inclusions were both upregulated whilst MADD exon 31 and FNIP1 exon 7 were down regulated. Interestingly, in the case of the MADD gene, not only skipping of exon 31 but the inclusion of a pseudoexon (47) sequence (marked as PE, Figure 7B, right panels) upstream of exon 31 was also observed. Sequencing of this extra band showed that it corresponded to a sequence of 115 nt that is flanked by apparently viable donor and acceptor splice sites (Supplementary Figure S8) but which are never used under normal TDP-43 expression conditions.
Altered splicing of the MADD, STAG2, BRD8 and FNIP1 genes in neuronal cell lines
Finally, to further determine significance of the TDP-43 dependent changes of the previously described genes in a neuronal context, we analysed neuronal cell lines to determine if similar alterations could be observed. For this reason, TDP-43 was silenced in both SH-SY-5Y and SK-N-BE (Supplementary Figure S9A), two neuroblastoma cell lines. The effects on MADD, STAG2, BRD8 and FNIP1 were then analysed by RT-PCR. As shown in Supplementary Figure S9B, in both cell lines the alterations in these genes closely mimicked the effects of TDP-43 depletion observed in the stable HEK293 cell lines and in the FLAG-TDP-43–12XQ/N expressing cells. Intriguingly, in these neuronal cell lines, the inclusion of the pseudoexon in the endogenous MADD transcript previously identified in the FLAG-TDP-43–12XQ/N expressing cells was also observed (marked as PE, Supplementary Figure S9B).
DISCUSSION
In animal models of TDP-43 proteinopathy, a common observation has been that depletion of TDP-43 is embryonic lethal at very early stages of development and that its overexpression above normal levels is highly toxic to cells, especially neurons (48). Most importantly from the point of view of the disease, several conditionally TDP-43 knockout mouse models display ALS phenotypes that are consistent with a picture in which sequestration of TDP-43 by insoluble aggregates can contribute to this pathology (49–51). In particular, when partial loss of TDP-43 was achieved using a synthetic siRNA, several changes in the splicing profiles of genes already known to be affected by TDP-43 in mouse, such as Sort1 and Skar/Poldip3 were observed (51). This is consistent with the central role that this protein plays in the control of RNA metabolism and protein homeostasis within cells (7,52) and probably the reason for the tightly regulated expression levels within cells, mostly through an auto regulatory feedback loop mechanism that acts through the 3′UTR of its own mRNA (38,53). In keeping with this assessment, all recent screening studies performed on this subject have confirmed that alterations in TDP-43 expression levels, both in a positive and a negative manner, can lead to hundreds of changes in the general RNA expression profile. Most importantly, this occurs for many kinds of RNAs, whether protein coding mRNAs, microRNAs or long non-coding RNAs (10,54–57).
Although many of these events/targets have shown a high degree of variability depending on the tissue/cells analysed (6), they have all supported the hypothesis that defects at the RNA processing level, also caused by other factors such as the recently described C9orf72 expansion, may considerably explain TDP-43 role in disease (58,59). What is still lacking, however, is a clear view of which of these changes are directly connected with this protein or just reflect secondary changes of a general deregulation at the RNA expression level.
Therefore, one of the main issues in today's research efforts is to determine the major RNA modifying events that are directly controlled by TDP-43 and whether they could be potentially affected at the neuronal level in the presence of aggregation. At present, the principal splicing target in neuronal and non-neuronal cells that becomes modified according to TDP-43 expression levels in a very significant manner is the SKAR/POLDIP3 gene (36,37). In all the studies performed so far, in fact, it is shown that TDP-43 knockdown can almost completely shift the expression of this gene from the predominant α to the β SKAR isoform. This event results in the more efficient activation of S6K1 (ribosomal protein S6 kinase 1) and increases global protein translation, suggesting that when TDP-43 is sequestered in the insoluble aggregates the alteration in the general area of protein homeostasis may contribute to disease pathogenesis. In this work, we now expand this list to four other genes, MADD, STAG2, BRD8 and FNIP1. Interestingly, an alteration in the splicing of the STAG2, BRD8 and MADD genes was also previously reported by Tollervey et al. (60). The fact that all these genes can be directly affected by TDP-43 further confirms the role played by TDP-43 in several pathological directions.
For example, the observation that altered splicing of the MADD gene can occur following TDP-43 depletion further confirms the very important role that TDP-43 protein plays in the apoptotic pathway. In fact, together with Bcl-2 initially described by Tollervey et al. (60) (and confirmed in this work), these two genes are very important in ensuring cellular survival. In particular, the MADD gene is implicated in cancer cell survival and apoptosis (61) and can be spliced to yield at least six different splice variants of which four are expressed more ubiquitously (MADD, DENN-SV, IG20pa, IG20-SV2) (62). Interestingly, the expression of these splice variants has previously been found to be affected in neuronal cell lines exposed to high concentrations of the A-beta peptide (63), suggesting that this is an important gene for ensuring neuronal survival. In addition, the finding that TDP-43 can affect the pre-mRNA splicing of this gene may represent a potentially important link with the protein produced by the C9orf72 gene, a major player in the ALS/FTD field, whose structure seems to be related to that of MADD/DENN Rab-GEFs (64).
At present, we do not know if some of the six possible isoforms described for the MADD gene (62) are more affected than others by the changes in skipping/inclusion of this exon and further work will be required to better understand the physiological consequences of this event. Nonetheless, in our case the changes observed in MADD expression suggest that there is not only a variation in the expression levels of these isoforms, but also that the TDP-43 induced changes can lead to a general decrease in its expression.
In the case of STAG2, we identified the TDP-43 intronic binding regions to be located much further in the downstream intron, within a relatively well-conserved region, suggesting a conserved functional significance. Intriguingly, it is a pyrimidine-rich sequence, to which TDP-43 has been reported to bind in some cases. It is interesting to note that both overexpression and silencing of TDP-43 expression have been reported to be capable of affecting cell cycle progression. For example, initial observations by Ayala et al. showed that TDP-43 silenced U2OS cells displayed alterations in cell cycle progression, with a 60% decrease in cells at the G0/G1 phase and a corresponding increase in cells at the S and G2/M phases (16). More recently, Yamashita et al. have reported that in SH-SY5Y cells overexpressing a full length wild-type TDP-43 coupled with Green Fluorescent Protein (GFP) there was an accumulation of cells in the G2/M and subG1 phase, reflecting growth arrest and apoptosis respectively (65). Finally, Lee et al. have shown that two- to five-fold overexpression of wild-type TDP-43 in HeLa cells was also capable of inducing partially p53-dependent G2/M arrest and p53-independent cell death (66). However, in none of these cases was the direct connection between TDP-43 and cell cycle affecting proteins was identified. In this regard, the only reported molecular connection between TDP-43 and cell cycle control was represented by the possible involvement of gadd7, a long non-coding RNA in the regulation of the CDK6 expression mediated by TDP-43 (56). In this work, we finally provide evidence that at least some of these observed effects of TDP-43 could be mediated by alterations in the pre-mRNA splicing profile of STAG2, an important component of the cohesin complex that is required to keep the sister chromatids together until their separation at anaphase (67). Indeed, we observed that the altered cell cycle distribution upon silencing of TDP-43 could be recovered following the additional silencing of the STAG2 exon 30b+ containing isoform.
From the point of view of the neurodegeneration, cell cycle dysregulation could have some significance for neuronal pathology as it has been reported that neurons undergoing degeneration re-enter the cell cycle, leading to apoptosis rather than cellular division, as recently reviewed by Campos-Melo et al. (68). In addition, the finding that TDP-43 can affect STAG2 splicing also offers a new connection with recent reports that depict its possible role in tumorigenesis, since recent cancer genomics analyses have reported a rather large number of somatic mutations at the level of the core cohesin factors (SMC1A, SMC3, RAD21 and STAG1/2) in a particular subset of human tumours including Ewing sarcoma, an aggressive bone tumour (69). In this respect, it is therefore highly interesting to note that a recent GWAS study aimed at identifying risk factors for Ewing sarcoma has found a significant decrease in TDP-43 expression in tumour material from patients (70) and that its expression and localization is altered in leukemic cell lines (71).
In the cases of the FNIP1 and BRD8 genes whose splicing was considerably affected by TDP-43 there is little literature to suggest a connection with observed consequences of TDP-43 depletion from cells. It is nonetheless interesting to note that FNIP1 together with FNIP2 and folliculin have been shown to physically interact with AMPK and affect mTOR activities during cellular differentiation, thus representing a possible connection with cancer (72).
In conclusion, our results show that in conditions of TDP-43 loss of function the splicing profiles of several important genes can significantly be affected in neuronal and non-neuronal cell lines. The observations that these alterations occur in both neuronal and non-neuronal cell lines, and that they can also be observed in cellular models mimicking TDP-43 aggregation, could represent a starting point for several strategic aims that include: the development of novel RNA-based therapeutic strategies aimed at modifying these alterations, for biomarker analysis to monitor disease onset/progression, or to test any type of therapeutic efficacy in the human context aimed at restoring TDP-43 functional levels within cells.
Supplementary Material
Acknowledgments
We wish to thank Prof. Francisco E. Baralle and Dr Pierre de la Grange (Genosplice) for helpful discussions and suggestions.
SUPPLEMENTARY DATA
Supplementary Data are available at NAR Online.
FUNDING
Thierry Latran Fondation (REHNPALS); EU Joint Programme-Neurodegenerative Diseases JPND (RiMod-FTD, Italy, Ministero della Sanita’). Funding for open access charge: Thierry Latran Fondation (REHNPALS); EU Joint Programme-Neurodegenerative Diseases JPND (RiMod-FTD, Italy, Ministero della Sanita’).
Conflict of interest statement. None declared.
REFERENCES
- 1.Neumann M., Sampathu D.M., Kwong L.K., Truax A.C., Micsenyi M.C., Chou T.T., Bruce J., Schuck T., Grossman M., Clark C.M., et al. Ubiquitinated TDP-43 in frontotemporal lobar degeneration and amyotrophic lateral sclerosis. Science. 2006;314:130–133. doi: 10.1126/science.1134108. [DOI] [PubMed] [Google Scholar]
- 2.Arai T., Hasegawa M., Akiyama H., Ikeda K., Nonaka T., Mori H., Mann D., Tsuchiya K., Yoshida M., Hashizume Y., et al. TDP-43 is a component of ubiquitin-positive tau-negative inclusions in frontotemporal lobar degeneration and amyotrophic lateral sclerosis. Biochem. Biophys. Res. Commun. 2006;351:602–611. doi: 10.1016/j.bbrc.2006.10.093. [DOI] [PubMed] [Google Scholar]
- 3.Buratti E., Baralle F.E. TDP-43: gumming up neurons through protein-protein and protein-RNA interactions. Trends Biochem. Sci. 2012;37:237–247. doi: 10.1016/j.tibs.2012.03.003. [DOI] [PubMed] [Google Scholar]
- 4.Lee E.B., Lee V.M., Trojanowski J.Q. Gains or losses: molecular mechanisms of TDP43-mediated neurodegeneration. Nat. Rev. Neurosci. 2012;13:38–50. doi: 10.1038/nrn3121. [DOI] [PMC free article] [PubMed] [Google Scholar]
- 5.Romano M., Buratti E. Targeting RNA binding proteins involved in neurodegeneration. J. Biomol. Screen. 2013;18:967–983. doi: 10.1177/1087057113497256. [DOI] [PubMed] [Google Scholar]
- 6.Buratti E., Romano M., Baralle F.E. TDP-43 high throughput screening analyses in neurodegeneration: advantages and pitfalls. Mol. Cell. Neurosci. 2013;56:465–474. doi: 10.1016/j.mcn.2013.03.001. [DOI] [PubMed] [Google Scholar]
- 7.Ling S.C., Polymenidou M., Cleveland D.W. Converging mechanisms in ALS and FTD: disrupted RNA and protein homeostasis. Neuron. 2013;79:416–438. doi: 10.1016/j.neuron.2013.07.033. [DOI] [PMC free article] [PubMed] [Google Scholar]
- 8.Buratti E., Baralle F.E. Characterization and functional implications of the RNA binding properties of nuclear factor TDP-43, a novel splicing regulator of CFTR exon 9. J. Biol. Chem. 2001;276:36337–36343. doi: 10.1074/jbc.M104236200. [DOI] [PubMed] [Google Scholar]
- 9.Lukavsky P.J., Daujotyte D., Tollervey J.R., Ule J., Stuani C., Buratti E., Baralle F.E., Damberger F.F., Allain F.H. Molecular basis of UG-rich RNA recognition by the human splicing factor TDP-43. Nat. Struct. Mol. Biol. 2013;20:1443–1449. doi: 10.1038/nsmb.2698. [DOI] [PubMed] [Google Scholar]
- 10.Tollervey J.R., Curk T., Rogelj B., Briese M., Cereda M., Kayikci M., Konig J., Hortobagyi T., Nishimura A.L., Zupunski V., et al. Characterizing the RNA targets and position-dependent splicing regulation by TDP-43. Nat. Neurosci. 2011;14:452–458. doi: 10.1038/nn.2778. [DOI] [PMC free article] [PubMed] [Google Scholar]
- 11.Polymenidou M., Lagier-Tourenne C., Hutt K.R., Huelga S.C., Moran J., Liang T.Y., Ling S.C., Sun E., Wancewicz E., Mazur C., et al. Long pre-mRNA depletion and RNA missplicing contribute to neuronal vulnerability from loss of TDP-43. Nat. Neurosci. 2011;14:459–468. doi: 10.1038/nn.2779. [DOI] [PMC free article] [PubMed] [Google Scholar]
- 12.Passoni M., De Conti L., Baralle M., Buratti E. UG Repeats/TDP-43 Interactions near 5′ Splice Sites Exert Unpredictable Effects on Splicing Modulation. J. Mol. Biol. 2012;415:46–60. doi: 10.1016/j.jmb.2011.11.003. [DOI] [PubMed] [Google Scholar]
- 13.Prudencio M., Jansen-West K.R., Lee W.C., Gendron T.F., Zhang Y.J., Xu Y.F., Gass J., Stuani C., Stetler C., Rademakers R., et al. Misregulation of human sortilin splicing leads to the generation of a nonfunctional progranulin receptor. Proc. Natl. Acad. Sci. U.S.A. 2012;109:21510–21515. doi: 10.1073/pnas.1211577110. [DOI] [PMC free article] [PubMed] [Google Scholar]
- 14.Soon W.W., Hariharan M., Snyder M.P. High-throughput sequencing for biology and medicine. Mol. Syst. Biol. 2013;9:640. doi: 10.1038/msb.2012.61. [DOI] [PMC free article] [PubMed] [Google Scholar]
- 15.Buratti E., Baralle M., Baralle F.E. From single splicing events to thousands: the ambiguous step forward in splicing research. Brief. Funct. Genomics. 2013;12:3–12. doi: 10.1093/bfgp/els048. [DOI] [PubMed] [Google Scholar]
- 16.Ayala Y.M., Misteli T., Baralle F.E. TDP-43 regulates retinoblastoma protein phosphorylation through the repression of cyclin-dependent kinase 6 expression. Proc. Natl. Acad. Sci. U.S.A. 2008;105:3785–3789. doi: 10.1073/pnas.0800546105. [DOI] [PMC free article] [PubMed] [Google Scholar]
- 17.Fiesel F.C., Voigt A., Weber S.S., Van den Haute C., Waldenmaier A., Gorner K., Walter M., Anderson M.L., Kern J.V., Rasse T.M., et al. Knockdown of transactive response DNA-binding protein (TDP-43) downregulates histone deacetylase 6. Embo J. 2010;29:209–221. doi: 10.1038/emboj.2009.324. [DOI] [PMC free article] [PubMed] [Google Scholar]
- 18.Bose J.K., Huang C.C., Shen C.K. Regulation of autophagy by neuropathological protein TDP-43. J. Biol. Chem. 2011;286:44441–44448. doi: 10.1074/jbc.M111.237115. [DOI] [PMC free article] [PubMed] [Google Scholar]
- 19.Colombrita C., Onesto E., Megiorni F., Pizzuti A., Baralle F.E., Buratti E., Silani V., Ratti A. TDP-43 and FUS RNA-binding proteins bind distinct sets of cytoplasmic messenger RNAs and differently regulate their post-transcriptional fate in motoneuron-like cells. J. Biol. Chem. 2012;287:15635–15647. doi: 10.1074/jbc.M111.333450. [DOI] [PMC free article] [PubMed] [Google Scholar]
- 20.Sephton C.F., Cenik C., Kucukural A., Dammer E.B., Cenik B., Han Y., Dewey C.M., Roth F.P., Herz J., Peng J., et al. Identification of neuronal RNA targets of TDP-43-containing ribonucleoprotein complexes. J. Biol. Chem. 2011;286:1204–1215. doi: 10.1074/jbc.M110.190884. [DOI] [PMC free article] [PubMed] [Google Scholar]
- 21.Xiao S., Sanelli T., Dib S., Sheps D., Findlater J., Bilbao J., Keith J., Zinman L., Rogaeva E., Robertson J. RNA targets of TDP-43 identified by UV-CLIP are deregulated in ALS. Mol. Cell. Neurosci. 2011;47:167–180. doi: 10.1016/j.mcn.2011.02.013. [DOI] [PubMed] [Google Scholar]
- 22.Honda D., Ishigaki S., Iguchi Y., Fujioka Y., Udagawa T., Masuda A., Ohno K., Katsuno M., Sobue G. The ALS/FTLD-related RNA-binding proteins TDP-43 and FUS have common downstream RNA targets in cortical neurons. FEBS Open Bio. 2013;4:1–10. doi: 10.1016/j.fob.2013.11.001. [DOI] [PMC free article] [PubMed] [Google Scholar]
- 23.Highley J.R., Kirby J., Jansweijer J.A., Webb P.S., Hewamadduma C.A., Heath P.R., Higginbottom A., Raman R., Ferraiuolo L., Cooper-Knock J., et al. Loss of nuclear TDP-43 in ALS causes altered expression of splicing machinery and widespread dysregulation of RNA splicing in motor neurons. Neuropathol. Appl. Neurobiol. 2014;40:670–685. doi: 10.1111/nan.12148. [DOI] [PubMed] [Google Scholar]
- 24.Igaz L.M., Kwong L.K., Lee E.B., Chen-Plotkin A., Swanson E., Unger T., Malunda J., Xu Y., Winton M.J., Trojanowski J.Q., et al. Dysregulation of the ALS-associated gene TDP-43 leads to neuronal death and degeneration in mice. J. Clin. Invest. 2011;121:726–738. doi: 10.1172/JCI44867. [DOI] [PMC free article] [PubMed] [Google Scholar]
- 25.Narayanan R.K., Mangelsdorf M., Panwar A., Butler T.J., Noakes P.G., Wallace R.H. Identification of RNA bound to the TDP-43 ribonucleoprotein complex in the adult mouse brain. Amyotroph. Lateral. Scler. 2012;14:252–260. doi: 10.3109/21678421.2012.734520. [DOI] [PubMed] [Google Scholar]
- 26.Chiang P.M., Ling J., Jeong Y.H., Price D.L., Aja S.M., Wong P.C. Deletion of TDP-43 down-regulates Tbc1d1, a gene linked to obesity, and alters body fat metabolism. Proc. Natl. Acad. Sci. U.S.A. 2010;107:16320–16324. doi: 10.1073/pnas.1002176107. [DOI] [PMC free article] [PubMed] [Google Scholar]
- 27.Hazelett D.J., Chang J.C., Lakeland D.L., Morton D.B. Comparison of parallel high-throughput RNA sequencing between knockout of TDP-43 and its overexpression reveals primarily nonreciprocal and nonoverlapping gene expression changes in the central nervous system of Drosophila. G3 (Bethesda) 2012;2:789–802. doi: 10.1534/g3.112.002998. [DOI] [PMC free article] [PubMed] [Google Scholar]
- 28.Huang C., Huang B., Bi F., Yan L.H., Tong J., Huang J., Xia X.G., Zhou H. Profiling the genes affected by pathogenic TDP-43 in astrocytes. J. Neurochem. 2014;129:932–939. doi: 10.1111/jnc.12660. [DOI] [PMC free article] [PubMed] [Google Scholar]
- 29.Egawa N., Kitaoka S., Tsukita K., Naitoh M., Takahashi K., Yamamoto T., Adachi F., Kondo T., Okita K., Asaka I., et al. Drug screening for ALS using patient-specific induced pluripotent stem cells. Sci. Transl. Med. 2012;4:145ra104. doi: 10.1126/scitranslmed.3004052. [DOI] [PubMed] [Google Scholar]
- 30.Cortese A., Plagnol V., Brady S., Simone R., Lashley T., Acevedo-Arozena A., de Silva R., Greensmith L., Holton J., Hanna M.G., et al. Widespread RNA metabolism impairment in sporadic inclusion body myositis TDP43-proteinopathy. Neurobiol. Aging. 2014;35:1491–1498. doi: 10.1016/j.neurobiolaging.2013.12.029. [DOI] [PMC free article] [PubMed] [Google Scholar]
- 31.Huelga S.C., Vu A.Q., Arnold J.D., Liang T.Y., Liu P.P., Yan B.Y., Donohue J.P., Shiue L., Hoon S., Brenner S., et al. Integrative genome-wide analysis reveals cooperative regulation of alternative splicing by hnRNP proteins. Cell Rep. 2012;1:167–178. doi: 10.1016/j.celrep.2012.02.001. [DOI] [PMC free article] [PubMed] [Google Scholar]
- 32.Wang Y., Xiao X., Zhang J., Choudhury R., Robertson A., Li K., Ma M., Burge C.B., Wang Z. A complex network of factors with overlapping affinities represses splicing through intronic elements. Nat. Struct. Mol. Biol. 2013;20:36–45. doi: 10.1038/nsmb.2459. [DOI] [PMC free article] [PubMed] [Google Scholar]
- 33.Chen M., David C.J., Manley J.L. Concentration-dependent control of pyruvate kinase M mutually exclusive splicing by hnRNP proteins. Nat. Struct. Mol. Biol. 2012;19:346–354. doi: 10.1038/nsmb.2219. [DOI] [PMC free article] [PubMed] [Google Scholar]
- 34.Buratti E., Baralle M., Baralle F.E. Defective splicing, disease and therapy: searching for master checkpoints in exon definition. Nucleic Acids Res. 2006;34:3494–3510. doi: 10.1093/nar/gkl498. [DOI] [PMC free article] [PubMed] [Google Scholar]
- 35.Buratti E., Dork T., Zuccato E., Pagani F., Romano M., Baralle F.E. Nuclear factor TDP-43 and SR proteins promote in vitro and in vivo CFTR exon 9 skipping. EMBO J. 2001;20:1774–1784. doi: 10.1093/emboj/20.7.1774. [DOI] [PMC free article] [PubMed] [Google Scholar]
- 36.Fiesel F.C., Weber S.S., Supper J., Zell A., Kahle P.J. TDP-43 regulates global translational yield by splicing of exon junction complex component SKAR. Nucleic Acids Res. 2012;40:2668–2682. doi: 10.1093/nar/gkr1082. [DOI] [PMC free article] [PubMed] [Google Scholar]
- 37.Shiga A., Ishihara T., Miyashita A., Kuwabara M., Kato T., Watanabe N., Yamahira A., Kondo C., Yokoseki A., Takahashi M., et al. Alteration of POLDIP3 splicing associated with loss of function of TDP-43 in tissues affected with ALS. PLoS One. 2012;7:e43120. doi: 10.1371/journal.pone.0043120. [DOI] [PMC free article] [PubMed] [Google Scholar]
- 38.Bembich S., Herzog J.S., De Conti L., Stuani C., Avendano-Vazquez S.E., Buratti E., Baralle M., Baralle F.E. Predominance of spliceosomal complex formation over polyadenylation site selection in TDP-43 autoregulation. Nucleic Acids Res. 2014;42:3362–3371. doi: 10.1093/nar/gkt1343. [DOI] [PMC free article] [PubMed] [Google Scholar]
- 39.Vanden Broeck L., Callaerts P., Dermaut B. TDP-43-mediated neurodegeneration: towards a loss-of-function hypothesis? Trends Mol. Med. 2014;20:66–71. doi: 10.1016/j.molmed.2013.11.003. [DOI] [PubMed] [Google Scholar]
- 40.Ayala Y.M., De Conti L., Avendano-Vazquez S.E., Dhir A., Romano M., D'Ambrogio A., Tollervey J., Ule J., Baralle M., Buratti E., et al. TDP-43 regulates its mRNA levels through a negative feedback loop. EMBO J. 2011;30:277–288. doi: 10.1038/emboj.2010.310. [DOI] [PMC free article] [PubMed] [Google Scholar]
- 41.Budini M., Romano V., Quadri Z., Buratti E., Baralle F.E. TDP-43 loss of cellular function through aggregation requires additional structural determinants beyond its C-terminal Q/N prion-like domain. Hum. Mol. Genet. 2014;24:9–20. doi: 10.1093/hmg/ddu415. [DOI] [PMC free article] [PubMed] [Google Scholar]
- 42.Schneider C.A., Rasband W.S., Eliceiri K.W. NIH Image to ImageJ: 25 years of image analysis. Nat. Methods. 2012;9:671–675. doi: 10.1038/nmeth.2089. [DOI] [PMC free article] [PubMed] [Google Scholar]
- 43.Schmittgen T.D., Livak K.J. Analyzing real-time PCR data by the comparative C(T) method. Nat. Protoc. 2008;3:1101–1108. doi: 10.1038/nprot.2008.73. [DOI] [PubMed] [Google Scholar]
- 44.Kanehisa M., Goto S., Hattori M., Aoki-Kinoshita K.F., Itoh M., Kawashima S., Katayama T., Araki M., Hirakawa M. From genomics to chemical genomics: new developments in KEGG. Nucleic Acids Res. 2006;34:D354–D357. doi: 10.1093/nar/gkj102. [DOI] [PMC free article] [PubMed] [Google Scholar]
- 45.Baralle M., Skoko N., Knezevich A., De Conti L., Motti D., Bhuvanagiri M., Baralle D., Buratti E., Baralle F.E. NF1 mRNA biogenesis: Effect of the genomic milieu in splicing regulation of the NF1 exon 37 region. FEBS Lett. 2006;580:4449–4456. doi: 10.1016/j.febslet.2006.07.018. [DOI] [PubMed] [Google Scholar]
- 46.Peters J.M., Tedeschi A., Schmitz J. The cohesin complex and its roles in chromosome biology. Genes Dev. 2008;22:3089–3114. doi: 10.1101/gad.1724308. [DOI] [PubMed] [Google Scholar]
- 47.Dhir A., Buratti E. Alternative splicing: role of pseudoexons in human disease and potential therapeutic strategies. FEBS J. 2010;277:841–855. doi: 10.1111/j.1742-4658.2009.07520.x. [DOI] [PubMed] [Google Scholar]
- 48.Tsao W., Jeong Y.H., Lin S., Ling J., Price D.L., Chiang P.M., Wong P.C. Rodent models of TDP-43: Recent advances. Brain Res. 2012;1462:26–39. doi: 10.1016/j.brainres.2012.04.031. [DOI] [PMC free article] [PubMed] [Google Scholar]
- 49.Wu L.S., Cheng W.C., Shen C.K. Targeted depletion of TDP-43 expression in the spinal cord motor neurons leads to the development of amyotrophic lateral sclerosis-like phenotypes in mice. J. Biol. Chem. 2012;287:27335–27344. doi: 10.1074/jbc.M112.359000. [DOI] [PMC free article] [PubMed] [Google Scholar]
- 50.Iguchi Y., Katsuno M., Niwa J., Takagi S., Ishigaki S., Ikenaka K., Kawai K., Watanabe H., Yamanaka K., Takahashi R., et al. Loss of TDP-43 causes age-dependent progressive motor neuron degeneration. Brain. 2013;136:1371–1382. doi: 10.1093/brain/awt029. [DOI] [PubMed] [Google Scholar]
- 51.Yang C., Wang H., Qiao T., Yang B., Aliaga L., Qiu L., Tan W., Salameh J., McKenna-Yasek D.M., Smith T., et al. Partial loss of TDP-43 function causes phenotypes of amyotrophic lateral sclerosis. Proc. Natl. Acad. Sci. U.S.A. 2014;111:E1121–E1129. doi: 10.1073/pnas.1322641111. [DOI] [PMC free article] [PubMed] [Google Scholar]
- 52.Janssens J., Van Broeckhoven C. Pathological mechanisms underlying TDP-43 driven neurodegeneration in FTLD-ALS spectrum disorders. Hum. Mol. Genet. 2013;22:R77–R87. doi: 10.1093/hmg/ddt349. [DOI] [PMC free article] [PubMed] [Google Scholar]
- 53.Budini M., Buratti E. TDP-43 Autoregulation: Implications for Disease. J. Mol. Neurosci. 2011;45:473–479. doi: 10.1007/s12031-011-9573-8. [DOI] [PubMed] [Google Scholar]
- 54.Lagier-Tourenne C., Polymenidou M., Hutt K.R., Vu A.Q., Baughn M., Huelga S.C., Clutario K.M., Ling S.C., Liang T.Y., Mazur C., et al. Divergent roles of ALS-linked proteins FUS/TLS and TDP-43 intersect in processing long pre-mRNAs. Nat. Neurosci. 2012;15:1488–1497. doi: 10.1038/nn.3230. [DOI] [PMC free article] [PubMed] [Google Scholar]
- 55.Buratti E., De Conti L., Stuani C., Romano M., Baralle M., Baralle F. Nuclear factor TDP-43 can affect selected microRNA levels. FEBS J. 2010;277:2268–2281. doi: 10.1111/j.1742-4658.2010.07643.x. [DOI] [PubMed] [Google Scholar]
- 56.Liu X., Li D., Zhang W., Guo M., Zhan Q. Long non-coding RNA gadd7 interacts with TDP-43 and regulates Cdk6 mRNA decay. EMBO J. 2012;31:4415–4427. doi: 10.1038/emboj.2012.292. [DOI] [PMC free article] [PubMed] [Google Scholar]
- 57.Cirillo D., Agostini F., Klus P., Marchese D., Rodriguez S., Bolognesi B., Tartaglia G.G. Neurodegenerative diseases: quantitative predictions of protein-RNA interactions. RNA. 2013;19:129–140. doi: 10.1261/rna.034777.112. [DOI] [PMC free article] [PubMed] [Google Scholar]
- 58.Polymenidou M., Lagier-Tourenne C., Hutt K.R., Bennett C.F., Cleveland D.W., Yeo G.W. Misregulated RNA processing in amyotrophic lateral sclerosis. Brain Res. 2012;1462:3–15. doi: 10.1016/j.brainres.2012.02.059. [DOI] [PMC free article] [PubMed] [Google Scholar]
- 59.Ramaswami M., Taylor J.P., Parker R. Altered ribostasis: RNA-protein granules in degenerative disorders. Cell. 2013;154:727–736. doi: 10.1016/j.cell.2013.07.038. [DOI] [PMC free article] [PubMed] [Google Scholar]
- 60.Tollervey J.R., Wang Z., Hortobagyi T., Witten J.T., Zarnack K., Kayikci M., Clark T.A., Schweitzer A.C., Rot G., Curk T., et al. Analysis of alternative splicing associated with aging and neurodegeneration in the human brain. Genome Res. 2011;21:1572–1582. doi: 10.1101/gr.122226.111. [DOI] [PMC free article] [PubMed] [Google Scholar]
- 61.Kurada B.R., Li L.C., Mulherkar N., Subramanian M., Prasad K.V., Prabhakar B.S. MADD, a splice variant of IG20, is indispensable for MAPK activation and protection against apoptosis upon tumor necrosis factor-alpha treatment. J. Biol. Chem. 2009;284:13533–13541. doi: 10.1074/jbc.M808554200. [DOI] [PMC free article] [PubMed] [Google Scholar]
- 62.Miura K., Fujibuchi W., Unno M. Splice variants in apoptotic pathway. Exp. Oncol. 2012;34:212–217. [PubMed] [Google Scholar]
- 63.Mo Y., Williams C., Miller C.A. DENN/MADD/IG20 alternative splicing changes and cell death in Alzheimer's disease. J. Mol. Neurosci. 2012;48:97–110. doi: 10.1007/s12031-012-9782-9. [DOI] [PubMed] [Google Scholar]
- 64.Levine T.P., Daniels R.D., Gatta A.T., Wong L.H., Hayes M.J. The product of C9orf72, a gene strongly implicated in neurodegeneration, is structurally related to DENN Rab-GEFs. Bioinformatics. 2013;29:499–503. doi: 10.1093/bioinformatics/bts725. [DOI] [PMC free article] [PubMed] [Google Scholar]
- 65.Yamashita M., Nonaka T., Hirai S., Miwa A., Okado H., Arai T., Hosokawa M., Akiyama H., Hasegawa M. Distinct pathways leading to TDP-43-induced cellular dysfunctions. Hum. Mol. Genet. 2014;23:4345–4356. doi: 10.1093/hmg/ddu152. [DOI] [PubMed] [Google Scholar]
- 66.Lee K., Suzuki H., Aiso S., Matsuoka M. Overexpression of TDP-43 causes partially p53-dependent G2/M arrest and p53-independent cell death in HeLa cells. Neurosci. Lett. 2012;506:271–276. doi: 10.1016/j.neulet.2011.11.021. [DOI] [PubMed] [Google Scholar]
- 67.Brooker A.S., Berkowitz K.M. The roles of cohesins in mitosis, meiosis, and human health and disease. Methods Mol. Biol. 2014;1170:229–266. doi: 10.1007/978-1-4939-0888-2_11. [DOI] [PMC free article] [PubMed] [Google Scholar]
- 68.Campos-Melo D., Droppelmann C.A., Volkening K., Strong M.J. RNA-binding proteins as molecular links between cancer and neurodegeneration. Biogerontology. 2014;15:587–610. doi: 10.1007/s10522-014-9531-2. [DOI] [PubMed] [Google Scholar]
- 69.Solomon D.A., Kim J.S., Waldman T. Cohesin gene mutations in tumorigenesis: from discovery to clinical significance. BMB Rep. 2014;47:299–310. doi: 10.5483/BMBRep.2014.47.6.092. [DOI] [PMC free article] [PubMed] [Google Scholar]
- 70.Postel-Vinay S., Veron A.S., Tirode F., Pierron G., Reynaud S., Kovar H., Oberlin O., Lapouble E., Ballet S., Lucchesi C., et al. Common variants near TARDBP and EGR2 are associated with susceptibility to Ewing sarcoma. Nat. Genet. 2012;44:323–327. doi: 10.1038/ng.1085. [DOI] [PubMed] [Google Scholar]
- 71.Teittinen K.J., Karkkainen P., Salonen J., Ronnholm G., Korkeamaki H., Vihinen M., Kalkkinen N., Lohi O. Nucleolar proteins with altered expression in leukemic cell lines. Leuk. Res. 2012;36:232–236. doi: 10.1016/j.leukres.2011.06.038. [DOI] [PubMed] [Google Scholar]
- 72.Rosner M., Hanneder M., Siegel N., Valli A., Fuchs C., Hengstschlager M. The mTOR pathway and its role in human genetic diseases. Mutat. Res. 2008;659:284–292. doi: 10.1016/j.mrrev.2008.06.001. [DOI] [PubMed] [Google Scholar]
Associated Data
This section collects any data citations, data availability statements, or supplementary materials included in this article.