

SUMMARY
Naïve CD4+ T cells can differentiate into specific helper and regulatory T cell lineages in order to combat infection and disease. The correct response to cytokines and a controlled balance of these populations is critical for the immune system and the avoidance of autoimmune disorders. To investigate how early cell fate commitment is regulated, we generated the first human genome-wide maps of histone modifications that reveal enhancer elements after 72 hrs of in vitro polarization toward T helper-1 (Th1) and T helper-2 (Th2) cell lineages. Our analysis indicated that even at this very early time point, cell-specific gene regulation and enhancers were at work directing lineage commitment. Further examination of lineage-specific enhancers identified transcription factors (TFs) with known and unknown T cell roles as putative drivers of lineage-specific gene expression. Lastly, an integrative analysis of immunopathogenic associated single nucleotide polymorphisms (SNPs) suggests a role for distal regulatory elements in disease etiology.
INTRODUCTION
Lymphocytes play a pivotal role in the regulation of an immune response. Upon immunogenic signals from antigen presenting cells induced by various pathogenic agents, naïve CD4+ T cells can differentiate into functionally distinct subsets including T helper 1 (Th1), Th2, Th17 and regulatory T (Treg) cells (Murphy and Stockinger, 2010; Rautajoki et al., 2008; Weaver et al., 2007). Each subtype is marked by specific cytokine secretion patterns (Zhou et al., 2009). These effector and regulatory CD4+ T cell lineages defend the host from various infections, while inappropriate activation and differentiation lead to pathogenesis of inflammatory and autoimmune diseases (Hirota et al., 2011; Reiner et al., 2007).
Molecular mechanisms leading to the polarization of CD4+ subsets have been made clearer through studies that defined unique signaling molecules and TFs for each lineage. Interleukin-12 (IL12) activates the signal transducer and activator of transcription 4 (STAT4) and initiates the differentiation of Th1 cells that secrete the signature cytokine interferon-γ (IFN-γ) and express the key transcriptional regulator TBX21 (T-bet) (Afkarian et al., 2002; Kaplan et al., 1996b; Schulz et al., 2009). IL4 in turn initiates Th2 cell differentiation by activating STAT6 and inducing the key TF GATA binding protein 3 (GATA3) and produce cytokines IL4 and IL13 (Elo et al., 2010; Horiuchi et al., 2011; Kaplan et al., 1996a). While important for host defense against intracellular and extracellular pathogens, inappropriate execution of Th1 and Th2 cell responses can lead to pathogenesis of autoimmune and inflammatory diseases (Rautajoki et al., 2008).
Cellular specification requires networks of TFs and epigenetic mechanisms to mediate changes in gene expression to determine cell fate (Rothenberg, 2007; Zhang et al., 2012). Previous studies have demonstrated that lineage specification in Th1 and Th2 cells is represented by the epigenetic state of signature cytokines loci: The Ifng locus in Th1 cells (Hatton et al., 2006; Schoenborn et al., 2007), and the Il4 locus in Th2 cells are marked by epigenetic modifications (Ansel et al., 2006). Epigenetic changes bring cellular specificity as well as plasticity. Th1 cell-specific gene loci Ifng and Il18r1 are associated with the histone activating mark H3K4me3 in Th1 cells, while in Th2 cells these loci are marked with the repressive H3K27me3 mark (Wei et al., 2009). Opposing modifications, H3K4me3 and H3K27me3 -termed ‘bivalent domains’, are co-localized at numerous promoter regions in T cells (Roh et al., 2006; Wei et al., 2009). Surprisingly, this includes genes such as Gata3 and Tbx21, suggesting lineages may retain some degree of plasticity even after polarization.
Enhancers play an important role in defining temporal and cell-specific expression (Bulger and Groudine, 2011; Ong and Corces, 2011). Histone modification patterns provide a distinct signature for global mapping of enhancer elements (Heintzman et al., 2009; Heintzman et al., 2007). The use of H3K4me1 has been used to identify enhancers in human, mouse, zebrafish, and fly genomes in a predominantly cell-specific manner (Aday et al., 2011; Creyghton et al., 2010; Ernst et al., 2011; Hawkins et al., 2011; Heintzman et al., 2009; Negre et al., 2011; Rada-Iglesias et al., 2011; Shen et al., 2012). Given the role of enhancers in driving cell fate commitment and gene expression responses to various stimuli, it is imperative to understand how chromatin structure defines enhancers that will contribute to induction and plasticity of T helper cell differentiation to distinct subsets as well as their role in autoimmune diseases.
In this study, we aimed to characterize the lineage-specific enhancer repertoire of early differentiating Th1 and Th2 cells relative to activated CD4+ T cells, using naïve CD4+ cells from human cord blood. We generated and analyzed global chromatin state maps from ChIP-seq (chromatin immunoprecipitation coupled to massively parallel DNA sequencing) using antibodies recognizing histone modifications that discriminate distal elements from proximal promoters (H3K4me1, H3K27ac, and H3K4me3). We focused on 72 h after polarization in an attempt to identify early regulators (enhancers and predicted binders) for these key lineage specifications. At this early stage of the differentiation process the cells are similar, as expected, yet hundreds of genes are differentially expressed, as determined by single-molecule sequencing, and thousands of lineage-specific enhancers often correlate with the gene expression changes. Lastly, under the principle that improper cell fate specification can lead to immunopathogenesis, we found within these lineage-specific enhancers overlap a great number of SNPs from genome-wide association studies (GWAS) for various autoimmune disorders, including type 1 diabetes, rheumatoid arthritis, Crohn’s disease, and asthma. Several SNPs altered TF binding site motifs, and a subset of such SNPs within these predicted sites influenced TF binding. This provides insight into how SNPs located at enhancers may contribute to early human T cell lineage specification and disease pathogenesis and is a valuable basis for additional investigation on the role of TF binding in human disease.
RESULTS
Global Mapping of Early Enhancers
We identified enhancer elements at an early stage of T cell differentiation. We generated global histone modification maps for H3K4me1 and H3K4me3. These modifications are known to distinguish enhancer and promoter elements, respectively (Heintzman et al., 2007). We compared chromatin maps at 72 h following activation of naïve human CD4+ T cells (abbreviated as Th0 for succinctness) with those 72 h after polarization toward Th1 and Th2 cell lineages (Figure 1A). At 72 h Th1 cells were positive for TBX21 protein expression, while Th2 cells were positive for GATA3 (Figure S1A). At day 7 the majority of cells expressed key lineage markers as determined by flow cytometry analysis (Figure S1B and C), indicating the cells polarized to Th1 and Th2 cell-specific lineages under these culture conditions.
Figure 1.
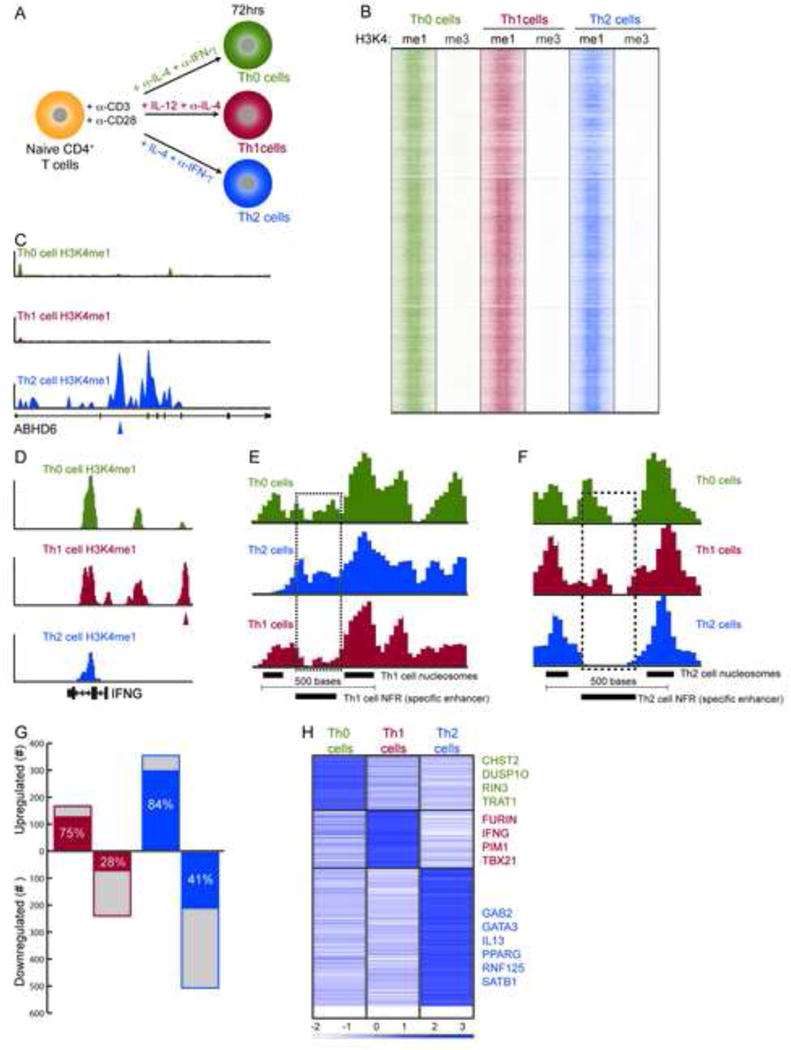
Genome-wide Mapping and Identification of Lineage-specific Enhancer Elements. (A) Illustration of experimental design for activating the cells (Th0) and for polarising cells to Th1 and Th2 cell subsets. (B) Global clustering of all predicted enhancers in Th0, Th1 or Th2 cells based on H3K4me1. H3K4me3 (promoter modification) is shown as a control. (C and D) ABHD6 and IFNG loci showing Th2- and Th1 cell-specific enhancer peaks identified through H3K4me1 predictions. (E and F) Example of lineage-specific nucleosome free regions (NFR) shown in high density plots for (E) a distal Th1 cell-specific enhancer predicted ~9kb downstream of IL10 and (F) Th2 cell-specific enhancer in an intron of BCAR3. The lineage-specific enhancer is determined by nucleosome spacing and overlapping nucleosome in the other two cell types (dashed rectangle). (G) Differential gene expression is shown for Th1 and Th2 cells relative to Th0 cells (total genes: blue + gray). Lineage-specific expression relative to Th0 cells and the other lineage (Th1 or Th2 cells) is shown in red for Th1 cells and blue bars for Th2 cells. (H) Lineage-specific differential expression relative to Thp cells to accommodate a three-way comparison.
Based on the distinct localization of H3K4me1 relative to H3K4me3 ((Heintzman et al., 2007), See Supplemental Methods), we determined 16,507, and 13,466 putative enhancers for Th1 and Th2 polarized cells respectively, and 16,552 in the control activated cells (Th0) (corrected p≤0.01. Table S1A). As expected at this early time point of differentiation, the chromatin profiles were largely similar between Th1, Th2 cells and control cells (Figure 1B). Enhancers unique to cells polarized toward Th1 or Th2 cells could also be determined (Figure 1C–D). To identify lineage-specific enhancers we implemented a recent analytical method that searches for sample-specific nucleosome free regions (NFR) (He et al., 2010). Using the histone modification signals, the method first predicts the nucleosome positions in the samples under consideration, identifies correctly spaced nucleosome pairs, and then detects nucleosome depletion in either of the samples. This method was employed to determine if peaks that appear similar in two or more lineages actually represented lineage-specific enhancer locations due to nucleosome re-positioning in active enhancers at the site of TF binding (Figure 1E–F, Figure 2, Figure S2, Table S1B). Using a stringent selection, we identified enhancers as lineage-specific if the peaks were called in our original analysis and contained a NFR relative to both the other lineage and control cells. That is, to be Th2 cell-specific the NFR must be present only in Th2 cell relative to both Th0 and Th1 cells, indicating a more open chromatin structure in only Th2 cells. We identified the following number of lineage-specific enhancers: 2144 (Th1 cells), and 2654 (Th2 cells) (Table S2A). Polarised cells showed a substantial increase in the number of unique enhancers compared to activated cells, 1636 (Th0 cells) (Table S2A).
Figure 2.
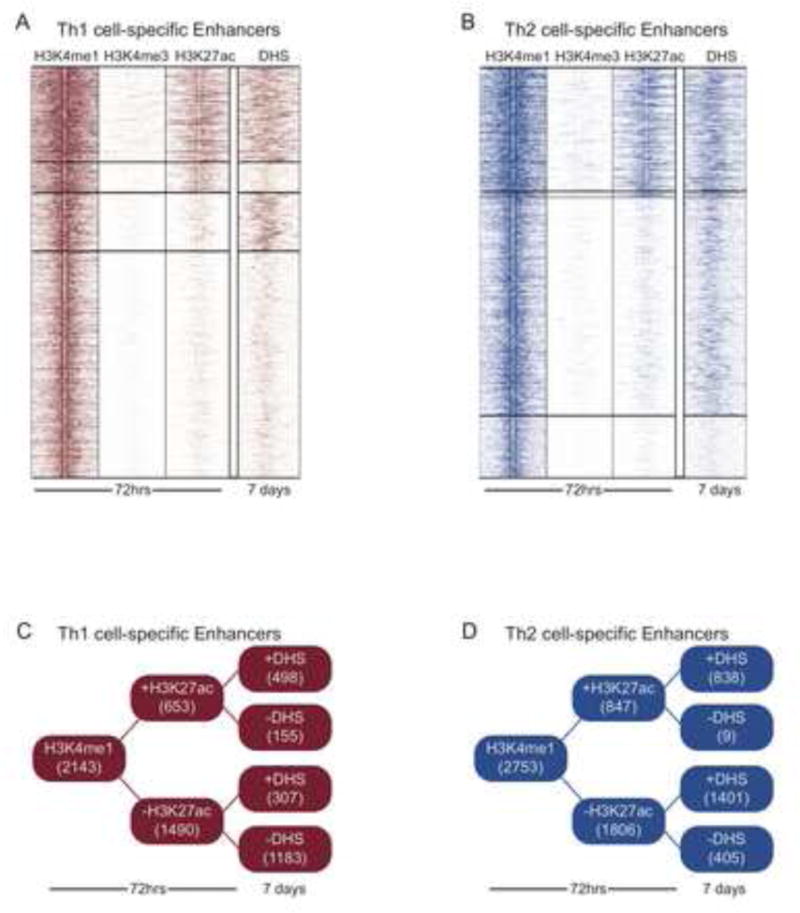
Continuum of Enhancer Chromatin States. (A) Clustering of Th1 cell-specific H3K4me1-marked enhancers. H3K27ac reveals active enhancers versus poised enhancers that lack H3K27ac at 72hrs. DNase hypersensitivity data (DHS) reflecting the active (hypersensitive sites) and non-active sites in the cells polarized to Th1 or Th2 direction for 7d. (B) Same as in A, except for Th2 cell-specific enhancers. (C–D) Distribution of enhancer states in Th1 and Th2 cell lineages.
To understand how lineage-specific enhancers might drive specific gene expression, we generated single-molecule digital gene expression data using the Heliscope platform to gain an accurate tag count of expressed genes in each subtype. Genes differentially expressed between Th1 and Th0 cells or Th2 and Th0 cells were identified using a stringent corrected p-value threshold of 0.01 from a negative binomial model (Anders and Huber, 2010) and expression fold change of ≥ 1.5 (Table S4 & S5). We identified 121 genes upregulated in Th1 cells, and 292 in the Th2 cell culture condition, while 116 were upregulated in the Th0 cell culture condition, for a total of 529 genes with highly unique expression patterns at 72h (Figure 1G; Table S4A; see Table S5 for all genes). Additionally, all subtypes showed differential expression relative to naïve T helper precursor cells (Thp) (Figure 1H). Consistent with our previous results, a number of genes become differentially expressed during the early stage of human Th cell differentiation (Elo et al., 2010; Lund et al., 2005; Lund et al., 2007). These genes are likely to be very important for the cell to gain the desired phenotype.
In summary, these chromatin-based enhancer maps provide a view of lineage-specific gene regulation during early human T cell specification. These unique enhancers and the bound TFs may be critical for driving gene expression essential for each lineage commitment.
Continuum of Enhancer States
A substantial fraction of mammalian enhancers are simultaneously marked by H3K27ac (Heintzman et al., 2009), and acetylation islands have enhancer activity (Roh et al., 2007). This is likely the result of histone acetyltransferases (HATs) that also act as transcriptional co-activators and bind enhancers, such as p300 (Heintzman et al., 2009; Heintzman et al., 2007; Shen et al., 2012; Visel et al., 2009). Yet, a subset of enhancers lacks this modification. Enhancers marked solely by H3K4me1 and lacking H3K27ac are deemed “poised enhancers” due to the absence of the active chromatin modification (Creyghton et al., 2010; Hawkins et al., 2011; Rada-Iglesias et al., 2011). This also holds true for the lineage-specific enhancers identified in this study (Figure 2). The abundance of poised enhancers likely reflects the fact that the cells are at an early stage of differentiation, and beginning to commit to distinct lineages.
To address the fate of the lineage-specific enhancers for Th1 and Th2 cells, we compared our enhancer chromatin maps to publically available genome-wide DNase hypersensitivity (DHS) data generated by the ENCODE consortium for Th1 and Th2 cells after 7–10 days of polarization (ENCODE, 2011; Maurano et al., 2012). Because DHS reflect an open chromatin structure, it is indicative of TFs bound to regulatory elements and presumed active. At this later time point for which DHS maps were generated, our data suggest the polarized cells are largely committed based on marker expression (Figure S1B–C). For Th1 and Th2 cell-specific enhancers about 30% were active based on histone modifications at 72 h (Figure 2). In Th1 cells, 76% of those remained active based on 7–10 day DHS data, while 99% remained active in Th2 cells. Those that were no longer hypersensitive are likely enhancers used to drive early lineage specification, but not needed to maintain the cell fate commitment. Of the poised enhancers, 21% in Th1 and 78% in Th2 cells became activated based on DHS data once the cells are committed to their respective lineages (Figure 2C–D). This suggests that the epigenome is already primed to regulate the future cell fate commitment.
STAT6 and Putative Enhancer Binders
Enhancer functionality is driven by the binding of TFs, which in turn facilitates looping to the target gene promoter and cell-specific gene upregulation. We analyzed enhancer sequences for known TFBS motifs to predict sequence-specific TFs as potential regulators of lineage-specific gene expression during T cell polarisation. Binding of TFs to enhancers were predicted with ProbTF (Lähdesmäki et al., 2008) using position specific frequency matrices (PSFM) from TRANSFAC (Matys et al., 2006) and combined with an empirical null model to choose hits above the background (p<0.01). Motifs were filtered based on gene expression to ensure the TFs were expressed in each T cell lineage. Examination of the identified motifs revealed both new and known Th cell regulators (Table S2A, bound TFs columns).
Lineage-specific enhancers were enriched for known T cell TF motifs relative to random genomic background (Table S3, Methods). For Th1 cell-specific enhancers, motifs included those for key factors STAT1, STAT4, ATF3, and JUN (Afkarian et al., 2002; Thieu et al., 2008; Filen et al., 2010). Th2 cell-specific enhancers included motifs for STAT6, PPARG, BACH, GFI1, NFIL3 and GATA3, which are all upregulated during early Th2 cell differentiation and regulate distinct genes either independently or in a coordinated fashion. For example, in the first intron of the GAB2 gene upregulated in Th2 cells, we identified a Th2 cell-specific enhancer that harbored a STAT6 motif (Figure 3A). STAT6 is a key regulator of the Th2 cell lineage by mediating the IL4 signal (Kaplan et al., 1996a). Interestingly, GAB2, an adaptor protein, activates PI3K and Akt, which subsequently regulates IL4 production (Frossi et al., 2007). This may provide a key part of the IL4-STAT6 regulatory feedback loop. The combination of chromatin-based enhancer maps and motif analysis filtered for TFs expressed in these cells reveals how key TFs are likely to utilize distal regulatory elements to drive lineage specification. In another study (Aijo et al., 2012), we identified only a limited number of enriched motifs for TF binding sites in the promoters of genes differentially expressed during the early Th cell differentiation, suggesting substantial contribution of enhancer-driven gene regulation. We also identified motifs in lineage-specific enhancers that corresponded to expressed TFs with unknown roles in Th1 and Th2 cell differentiation for further studies (Figure 3B–D; Table S3).
Figure 3.
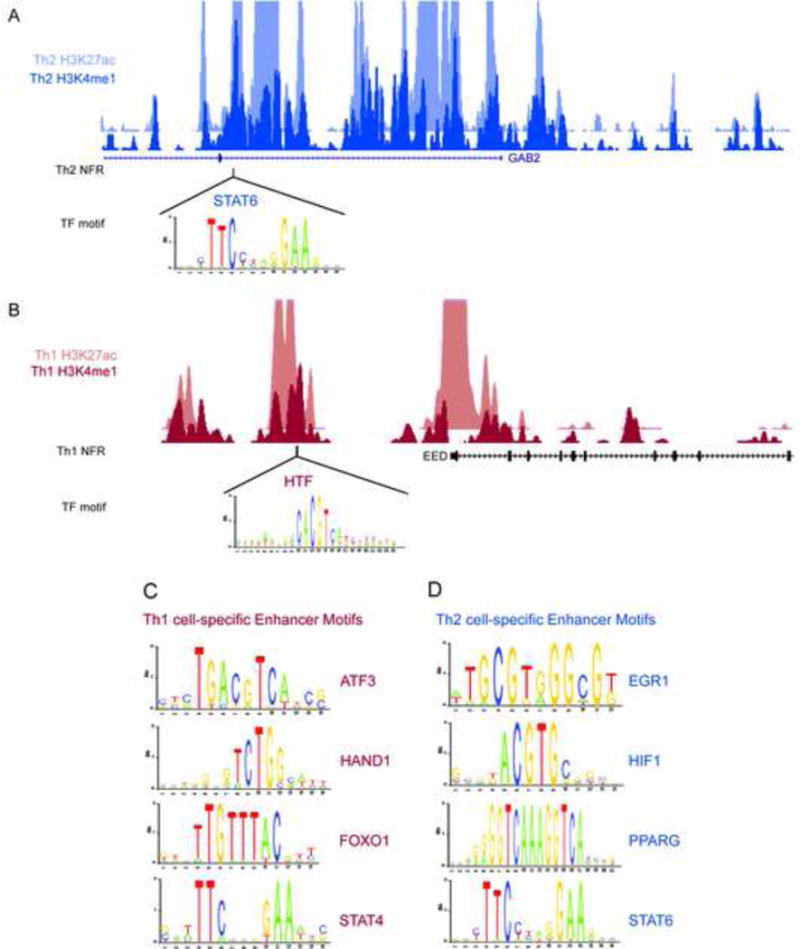
Identification of Putative Enhancer Binders through Motif Analysis. (A) Example of a Th2 cell-specific enhancer in a GAB2 gene intron containing a motif for a known Th2 cell regulator, STAT6. (B) Example of a motif at a Th1 cell-specific enhancer upstream of EED, for a TF not previously implicated in T cell biology. (C–E) Examples of motifs within lineage-specific enhancers for TFs with known and unknown roles in T cell differentiation.
To validate a subset of the enhancers and motif predictions, we generated ChIP data for at STAT6 motifs within Th2 cell-associated enhancers. Over 70% of STAT6 binding sites are enriched over introns and intergenic regions of genome (Elo et al., 2010). Our motif analysis showed STAT6 motif to be frequently enriched over Th2 cell-specific enhancers (Figure 3D; Table S3). We generated ChIP-qPCR data for STAT6, H3K4me1, and H3K27ac at 4h and 72h (Figure 4) and validated six Th2 cell-specific enhancers harboring predicted STAT6 binding sites. These enhancers were located nearby genes of known and unexplored function such as RUNX1, FOXP1, GAB2, IL10RA, SETBP1, and ABHD6, which are upregulated in a Th2 cell-specific manner. We found that H3K4me1 and H3K27ac were enriched at these enhancers in Th2 directed cells in contrast to naïve (Thp) and activated T cells (Th0), which suggest that these genes are regulated by STAT6 in Th2 cells by an enhancer-specific manner. STAT6 and H3K4me1 were largely consistent between 4 and 72h, whereas H3K27ac increased at 72h relative to 4h. The acquisition of H3K27ac is likely indicative of later transcriptional events beyond the initial marking of the enhancer elements (compare Figure 4B,C to 4D).
Figure 4.
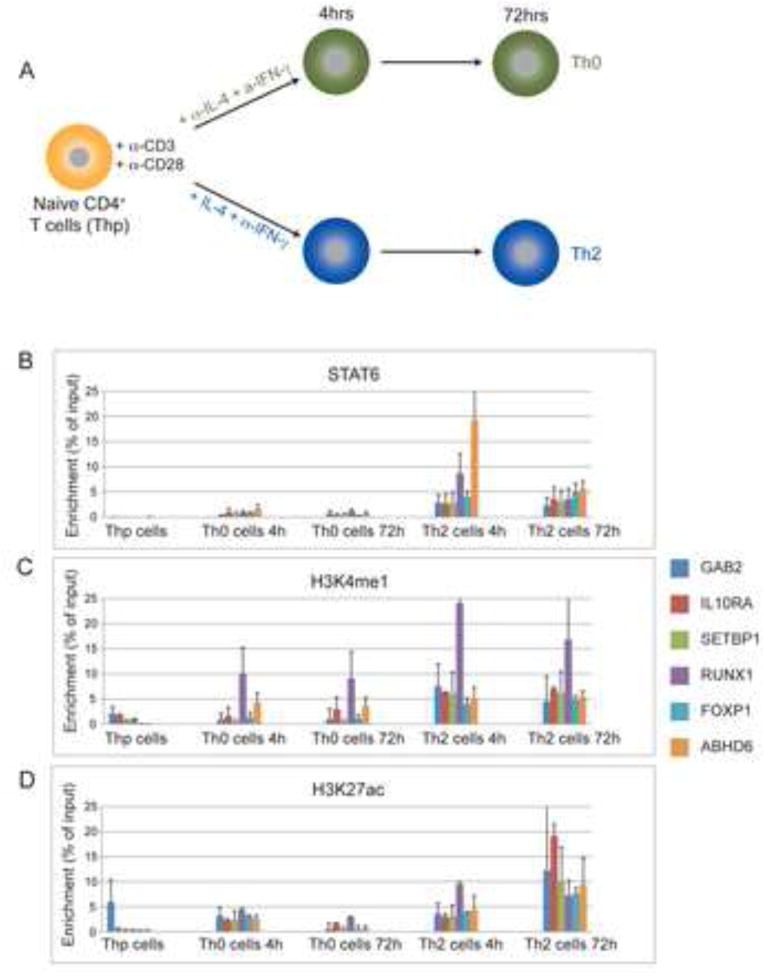
Enhancer and STAT6 Motif Validation by ChIP-qPCR. (A) Time course of Th2 cell polarization and Th0 cells as a control. H3K4me1, H3K27ac and STAT6 localization were tested by ChIP-qPCR at 6 ChIP-seq determined loci of Th2 cell-specific H3K4me1 marked enhancers containing STAT6 motifs. (B) ChIP-qPCR for STAT6 binding at 4hrs and 72hrs in early stages of Th2 cell polarization. Th0 and Thp cells serve as controls. Enrichment is a percent of input. (C) As in A, except for H3K4me1. (D) As in A, except for H3K27ac. Error bars were represented as mean +/− SEM.
Regulatory SNPs: Overlap of Enhancers with Disease Associated Variants
Genome-wide association studies (GWASs) have produced large numbers of disease associated single-nucleotide polymorphisms (SNPs). However, many of these studies have failed to identify causative mutations. This may be, in part, due to many associated SNPs lying outside of gene coding regions. A recent assessment of GWASs illustrated that 45% of disease or trait associated SNPs fell in introns, while 43% lie in intergenic regions (Hindorff et al., 2009). Regulatory SNPs (rSNPs) have been implicated in the altered expression of genes that constitute expression quantitative traits (eQTLs: for review see (Cheung and Spielman, 2009)). Global methods for determining chromatin states show that associated SNPs can overlap regulatory regions (Ernst et al., 2011; Gaulton et al., 2010; Maurano et al., 2012). To determine if disease-associated SNPs are potentially rSNPs, we analyzed the vicinities of associated SNPs from the NHGRI GWAS catalog (Hindorff et al., 2009) for overlap with our global T helper cell enhancer predictions at 72 h, including lineage-specific enhancers (see Methods). Several autoimmune disease associated SNP sets were enriched among all the 460 disease categories (Table S7), and we decided to conduct a detailed integrated analysis of the fine-mapped associated SNPs (using p-value cut-off of p<0.01 for the SNP associations) from asthma (Moffatt et al., 2010), Crohn’s disease (Duerr et al., 2006; Rioux et al., 2007), multiple sclerosis (MS) (Hafler et al., 2007), psoriasis (Cargill et al., 2007; Helms et al., 2003; Nair et al., 2006), rheumatoid arthritis (RA) (Stahl et al., 2010), type 1 diabetes (T1D) (Barrett et al., 2009) and ulcerative colitis (UC) (Anderson et al., 2011).
We first looked at the overlap of SNPs with the combined set of enhancers detected in all three T cell culture conditions. Significant (p<0.001) overlap was found for most of the aforementioned autoimmune diseases. In total, we determined that 1,281 SNPs overlap our global enhancer maps (Table 1). RA and UC exhibited the greatest overlap, >400 SNPs each, while Crohn’s and MS contributed the least, ~40 SNPs from each. As a control we performed the same analysis for a GWAS study of age-related macular degeneration (AMD) and age-related cataracts from The Age-Related Eye Disease Study (AREDS) (AREDS, 1999), a disease presumably with little or no association with Th cells. The overlap of the AREDS SNPs with enhancers was not significant (p-value 0.288). When focusing on SNP overlaps with global enhancers present in each culture condition (Th1 or Th2 or Th0 cells), some differences between enrichments of overlaps were revealed, such as increased overlap in Th1 cell-conditioned enhancers for Crohn’s disease (Table S8A). We examined the distribution of the 1,281 SNPs overlapping enhancer and found that ~50% are at intronic enhancers and ~43% are at distal enhancers (Figure 5A). The disease associated SNPs were typically within 100–200kb of the nearest neighboring gene, even when they were within our mapped enhancers (Figure 5B).
Table 1.
Lead Autoimmune Disease SNPs as Regulatory SNPs Based on Enhancer Overlap.
| All Enhancers | Th0-specific | Th1-specific | Th2-specific | ||
|---|---|---|---|---|---|
|
| |||||
| # SNPs | p-value | # SNPs | # SNPs | # SNPs | |
| Type 1 diabetes (T1D) | 126 | <0.001 | 1 | 5 | 3 |
| Crohn’s disease | 43 | 0.021 | 0 | 1 | 0 |
| Multiple sclerosis (MS) | 42 | 0.033 | 0 | 1 | 1 |
| Ulcerative colitis (UC) | 419 | <0.001 | 5 | 7 | 11 |
| Rheumatoid arthritis (RA) | 449 | <0.001 | 6 | 7 | 14 |
| Asthma | 134 | 0.059 | 2 | 4 | 5 |
| Psoriasis | 68 | <0.001 | 1 | 2 | 0 |
| AREDS (control) | 14 | 0.288 | |||
Associated lead SNPs were selected based on a p-value < 0.01
Figure 5.
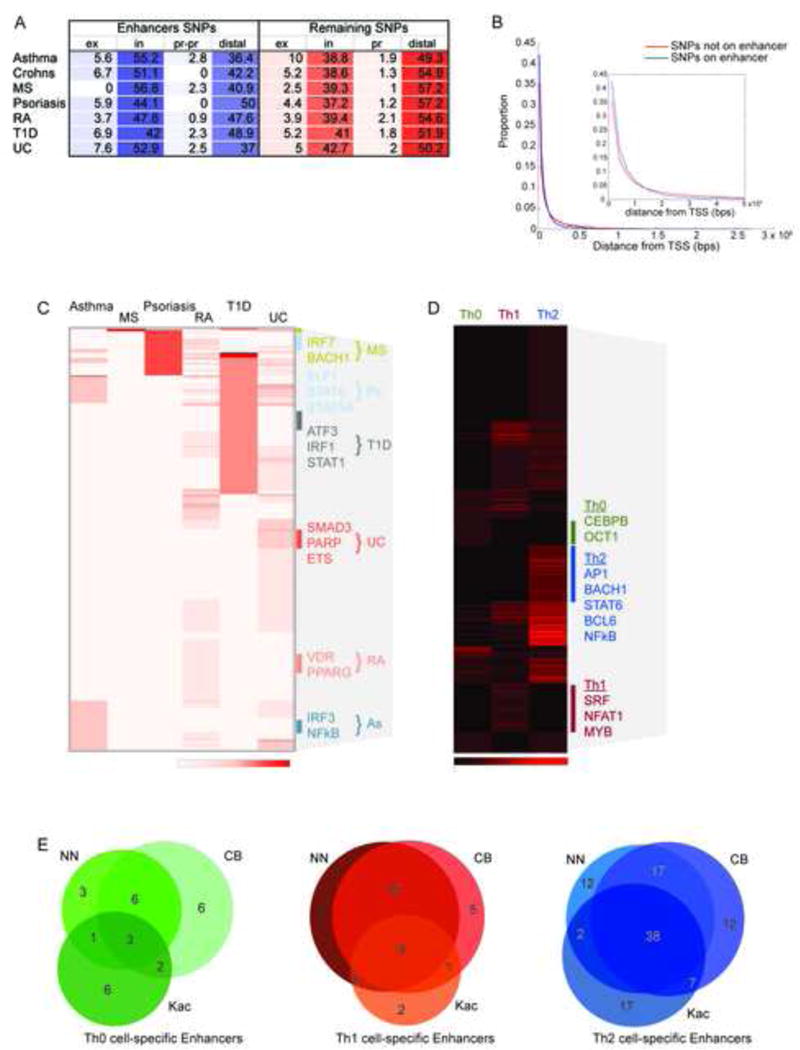
Disease Associated SNPs Directly Overlap with Known TF Motifs. (A) Percent distribution of all disease SNPs at T cell enhancers (Th1, Th2 or Th0 cell) identified in this study. The SNPs are categorized by overlap with exons (ex), introns (in), promoter proximal (pr-pr) or distal (left in blue) and percent distribution of remaining SNPs categorized similarly (right in red), except direct promoter (pr) overlap was considered. (B) Histogram of distance of disease SNPs from nearest neighboring gene for SNPs overlapping enhancers (blue) and remaining SNPs (red). Inset shows zoomed scale up to 5×10⁵. (C) Heatmap of enrichment of TFBS motifs in lineage-specific enhancers containing disease SNPs clustered by disease. Highly enriched motifs are listed on the right relative to enriched cluster position that is indicated by the color-coded bar. (D) Heatmap of enrichment of TFBS motifs in lineage-specific enhancers containing disease SNPs clustered by lineage. Highly enriched motifs are indicated on the right relative to cluster position that is indicated by the color-coded bar. (E) Overlap of predicted enhancer target genes for three models: nearest neighboring upregulated gene (NN), upregulated genes and enhancers within same CTCF block (CB), & enhancer H3K27ac with gene upregulation within 125kb (Kac). Venn diagrams are shown for Th0, Th1, and Th2 cells.
Next, we focused on the overlap of SNPs with enhancers selectively detected in Th cells cultured in Th1, Th2 or control Th0 cell conditions. We identified 76 associated SNPs (Table S9) from the aforementioned disease GWASs directly overlapping our Th1 cell-specific, Th2 cell-specific or Th0 cell-specific enhancer predictions that are defined by a condition-specific NFR of 105–250bp. These include 9 for T1D, 1 for Crohn’s disease, 2 for MS, 23 for ulcerative colitis, 27 for RA, 3 for psoriasis, and 11 for asthma (See Table S8B for lineage distributions). These SNPs were often distributed relatively uniformly across all three T cell types. The presence of associated SNPs in enhancers may alter regulatory networks, disrupt the proper balance in differentiation to various Th cell subsets, and contribute to the development of disease.
Inferring functional significance of rSNPs
Many SNPs were within binding site motifs of biologically relevant TFs. Focusing on the SNPs that overlapped TFBS motifs in Th cell subtype-specific enhancers, a number of TFBS motifs were highly abundant in a disease-specific manner (Figure 5C). For example, ATF3, IRF1 and STAT1 were often occurring in T1D, while VDR and PPARG were recurrent at enhancer SNPs for RA. In addition, IRF3 and NF-kB were frequently represented at asthma rSNPs, and ELF1, STAT6 and STAT5A were often present for psoriasis. We also found Th cell subtype-specific enrichment of TFBS motifs overlapping rSNPs. Th1 cell-associated rSNPs frequently overlapped SRF, NFAT1 and MYB motifs, and Th2 cell associated rSNPs were regularly present at AP1, BACH1, STAT6, BCL6 and NF-kB motifs (Figure 5D).
To gain insight on how enhancers overlapping variants might alter gene expression, we attempted to predict enhancer-promoter interactions by exploiting the following models used to correlate or predict enhancer gene targets: (i) assigning the nearest neighboring (NN) expressed or upregulated gene to the enhancer; (ii) assigning enhancers to genes if both are between two CTCF binding sites (Hawkins et al., 2011), a known enhancer blocker (Bell et al., 1999); or (iii) correlating changes in enhancer histone modification(s) with nearby changes in gene expression (Creyghton et al., 2010; Ernst et al., 2011), such as correlating changes in enhancer acetylation (H3K27ac) with changes in nearby gene expression (Kac).
We tested these three models to predict lineage-specific enhancer gene targets using only genes expressed in a Th1-, Th2-, or Th0 cell -specific manner (adjusted p-value 0.01, fold-change > 1.5) (Table S6; See Figure 5E for overlap of predictions by each method). To achieve our CTCF-block model (CB), we generated maps for CTCF binding using ChIP-seq in Th1, Th2 and Th0 cells. The correlation of expression with enhancer acetylation changes (Kac) was limited to genes within 125kb from the enhancer (Table S2B) and only highly correlated (corr >0.90) genes were selected. Collectively, the models determined that during the early stages of human Th cell differentiation 37 and 105 enhancer-target pairs were differentially activated when the cells are polarised to Th1 and Th2 cell subsets, respectively. Control activated Th cells utilized a distinct set of 27 enhancer-target pairs (Figure 5E). The lineage specificity of the enhancers and their predicted targets were in agreement with the regulatory networks controlling Th cell specification (Supplemental Figure S3). This begins to provide a better understanding of lineage-specific gene regulation via enhancer elements.
Next, we intersected enhancers with disease associated SNPs and enhancers with predicted target genes. In the case of ulcerative colitis rSNPs, JAK3, ARRDC2, ATXN1 (See Supplemental Figure S4), TNFRSF6B, IL6, NFkB, GATA3, and IL10 were predicted targets, A GATA3 intronic Th2 cell-specific enhancer overlapped associated SNP rs406103 that altered the PPARG motif, which is specifically expressed in Th2 polarised cells (Figure 6A, C).
Figure 6.
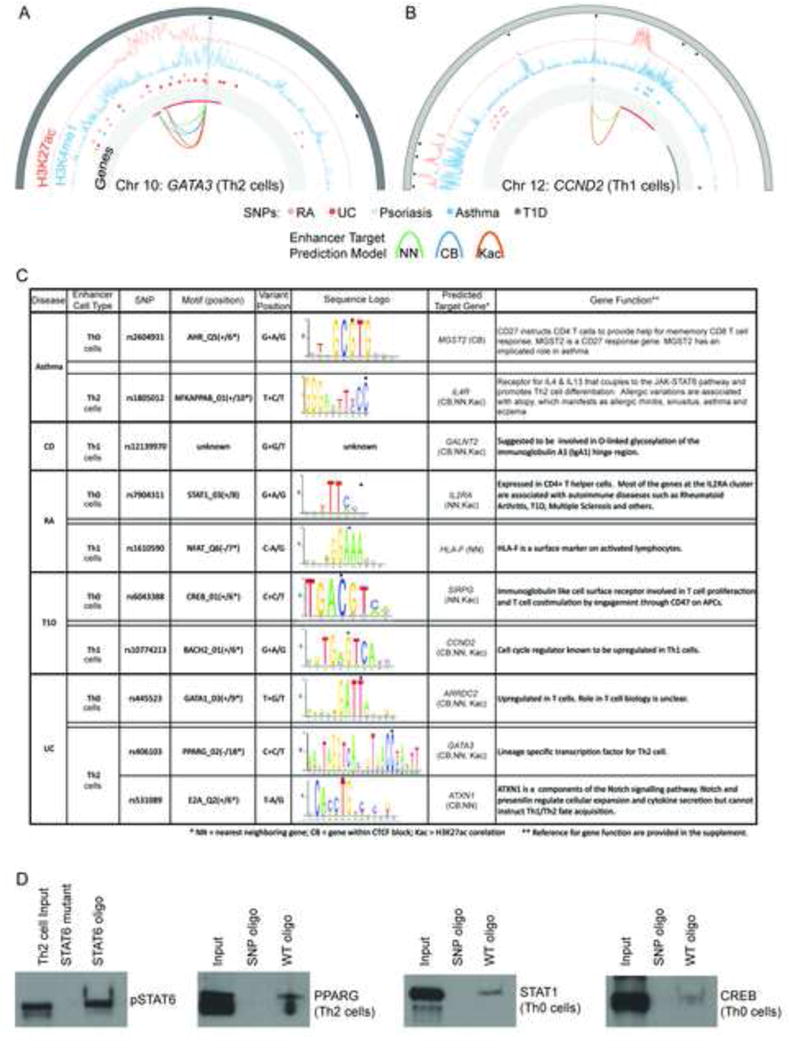
Potential Regulatory Effects of rSNPs at lineage-specific enhancers. (A & B) Circos plots for histone modifications, disease associated SNPs - including rSNPs (open circles), and predicted gene targets at two loci: GATA3 (A) and CCND2 (B). The outermost track shows the chromosome bands. Black boxes note enriched H3K4me1 peaks. Lineage-specific enhancers are displayed with light grey radial lines. The profiles show H3K27ac (orange) and H3K4me1 (blue). Disease SNPs are shown with color-coded circle as indicated. The SNPs overlapping a lineage-specific enhancer are highlighted as empty circles. Innermost track (with light grey background) shows the genes (upregulated in red, rest are grey). Arcs connect enhancers to genes based on the target prediction method (green: NN, blue: CB, orange: KAc). (C) List of a subset of SNPs associated with RA, T1D, Ulcerative colitis (UC) and Asthma that lie directly within known motifs of TFs (dot over base), that play and important role in T cell biology. Crohn’s disease (CD) rSNPs did not overlap with any known motifs. Predicted target genes of the effected enhancers are listed to further elucidate the potential effect of the SNP. References for gene function are given in supplement. (D) DAPA (DNA Affinity Precipitation Assay) experiments to determine if disease associated rSNPs can alter transcription factor binding to their predicted binding sites at enhancers. Double-stranded oligonucleotides containing the predicted PPARG, STAT1, and CREB binding sites at enhancers were used as bait. Binding was assayed using nuclear extracts from activated (Th0 cell) or polarised T cells (Th1, Th2 cells) at 72 h as indicated. The oligonucleotide bait containing the SNPs at transcription factor binding sites are shown in 6C (see Supplemental Materials and methods for complete probe sequences). DNA sequence with STAT6 binding site and a negative control DNA sequence (oligonucleotide where STAT6 binding site has been mutated) are provided as controls for DAPA. TF binding to oligonucleotides was detected by western blotting using antibodies specific to the selected transcription factors (See Supplemental Methods for antibodies used). Data shown is representative for three biological replicates (See Figure S5).
We identified 5 SNPs associated with T1D in motifs from different Th1 cell-specific enhancer sites. One such enhancer was predicted to target CCND2 (Figure 6B), an IL12 inducible gene known as a cell cycle G1-S1 checkpoint regulator and also associated with aryl hydrocarbon receptor (Ahr) signaling, IL8 signaling, p53 signaling pathway and molecular cancer pathways (Grangeiro de Carvalho et al., 2011; Iwanaga et al., 2008). The associated SNP rs10774213 lay within the enhancer region with BACH2 motif (Figure 6B–C). The reference nucleotide at this site is A and the variant is G. The A to G transition overlaps nucleotide 6 in the BACH2 motif, which is almost exclusively a G (Figure 6C). The C to T change at SNP rs6043388 was associated with T1D, and was present at an intronic enhancer for SIRPG with a CREB motif. CREB plays an important role in T cell survival and differentiation (Wen et al., 2010) (Figure 6C).
We found 11 associated SNPs for asthma overlapping our condition-specific enhancers. Interestingly, one such SNP, rs2604931, lay within an AHR motif in an activated T cell enhancer (Th0). This G to A transition alters an exclusively A nucleotide, at position 5 in the motif, to G. Ahr plays an important role in setting up Treg versus Th17 cell fates in mice depending on the ligand (Quintana et al., 2008). It remains to be determined if it also plays a role in Th1 or Th2 cell specification. The enhancer with this SNP is predicted to interact with the MGST2 gene, which is implicated in asthma (Scoggan et al., 1997; Sjostrom et al., 2001; Werz and Steinhilber, 2006). Additionally, an enhancer within the IL4R gene contains the associated SNP rs1805012 that lies within the NFKAPPAB motif (Supplemental Figure S4). The reference nucleotide at this site is C and the variant is T. The C to T transition overlaps nucleotide 10 in the NFKAPPAB motif, which is exclusively a C (Figure 6C).
In addition to the enhancers listed above, other interesting predicted gene targets of enhancers harboring variants include many well-known T cell markers, though some only show a modest change in expression or p-value (See Table S2A). This includes AHRR, RHOH and DUSP16 in T1D. In rheumatoid arthritis BATF, IL2RA, HLA-F (Supplemental Figure S4), and PRKCQ are predicted targets. Genetic variation at the IL2RA gene cluster has been shown to be associated primarily with autoimmune diseases including T1D, MS and RA. We found a RA associated SNP, rs7904311, at an intronic enhancer of the IL2RA gene, which laid within a STAT1 motif, potentially regulating T helper cell proliferation and differentiation. Though not all SNPs at enhancers overlap known motifs, our enhancer target predictions still allow us to infer some biological significance for these rSNPs (Table S2). Although no known TFBS overlapped rSNPs for Crohn’s disease, we could still predict target genes for a subset of these enhancers, such as GALNT2 (Figure 6C, S4). Enhancer elements are critical for fine-tuning the expression of their target genes. SNPs in the enhancers of these target genes could cause gain or loss of TF binding, and thus may alter the target gene expression, Th cell differentiation and ultimately contribute to disease, especially given that these are enhancers utilized during early T cell specification.
To determine if disease-associated rSNPs alter TF binding at enhancers, and therefore have a functional effect, we performed DNA Affinity Precipitation Assays (DAPA) using the hg18 reference sequence across the predicted motif or single base-pair variants (associated SNP) as bait. We selected 3 SNPs that overlap TF binding sites at predicted lineage-specific enhancers (Figure 6D). These are the UC-associated SNP rs406103 at the PPARG motif predicted to target GATA3 in Th2 cells; the RA-associated SNP rs7904311 at the STAT1 motif predicted to target IL2RA in Th0 cells; and the T1D-associated SNP rs604388 at the CREB motif predicted to target SIRPG in Th0 cells. The selection of SNPs and putative binding TFs for validation was limited to availability of high quality antibodies for TFs to be used in DAPA. The results show that PPARG, STAT1, and CREB bound to the predicted TFBS using the reference genome as bait sequence and that this TF binding was decreased when mutant oligonucleotides corresponding to disease associated SNPs were used instead (Figure 6D; See Figure S5 for replicates and western blots). Notably, the disrupted TF binding caused by the single base-pair change was roughly equivalent to our control experiment disrupting 4 conserved nucleotides in the STAT6 motif (Figure 6D; See Methods). The results indicated that introduction of a SNP mutation in the identified TFBS of enhancers alters TF binding, suggesting a possible mechanism by which SNPs affect enhancer function and target gene expression.
DISCUSSION
The control of cell fate decisions results from complex interactions of signaling and transcriptional regulatory networks and chromatin structure that can act as a gatekeeper controlling DNA access and demarcation of regulatory elements. We used an enhancer-specific histone modification to generate the first maps of these elements during the early cell fate specification of human T helper cells. By examining Th cells 72 h following polarization toward the Th1 and Th2 cell lineages, we identified over 30,000 Th cell enhancers, providing insight into early gene regulation and lineage specification. We identified enhancers unique for Th1 and Th2 cells suggesting that enhancers function in lineage-specific gene regulation during early human T helper cell specification. Furthermore, at this early stage of lineage commitment many enhancers were in a poised state based on chromatin structure. Comparing this poised state with Dnase I hypersensitivity at 7–10 days we discovered that many enhancers became active upon further polarization, while another subset remained active both at an early (H3K27ac+) and late (DHS+) stage of cell fate commitment. These categories likely reflect the regulatory changes that are essential to fully commit to their exact cell fate, as well as the plasticity of Th cells to respond to external stimuli even after polarization. Examining the kinetics of STAT6 binding and histone modifications across a short time course during Th2 cell specification corroborates this notion of a changing enhancer state. We found that while STAT6 and H3K4me1 were often enriched at 4hrs, H3K27ac seemed delayed to 72 h.
Our findings show that chromatin modifications marking enhancers reflect lineage specification. These enhancers are enriched for TF binding site (TFBS) motifs representing TFs that are often expressed in a lineage- or cell-specific manner and correlate with specific gene expression. Collectively, this highlights the importance of enhancers in driving unique expression profiles. Our TFBS motif analysis at predicted enhancer sequences demonstrated enrichment for both previously unknown and known lineage-specific Th cell regulators. For example, Th1 cell-associated enhancers were enriched with motifs for STAT1, STAT4, ATF3, ETS, IRF and JUN, while Th2 cell-associated enhancers motifs were enriched for STAT6, PPARG, BACH, GFI1, NFIL3 and GATA3. All these identified TFs were upregulated during early Th1 or Th2 cell differentiation and regulate target genes either independently or in a coordinated fashion. This suggests a means by which key TFs are likely to utilize distal regulatory elements to drive lineage specification. We validated several STAT6 predicted motifs at Th2 cell-specific enhancers by STAT6 ChIP. The sites were located nearby genes such as RUNX1, FOXP1, GAB2, IL10RA, SETBP1 and ABHD6, which were specifically upregulated in a Th2 cells. This indicates that these genes are likely regulated by STAT6 in an enhancer-specific manner. Additionally, our recent data reveals that only a fraction of genes that are differentially expressed during the early stages of Th cell differentiation are enriched for TFBS motifs in the promoters (Aijo et al., 2012). This further highlights the role of enhancers and their importance in priming gene regulation and cell fate commitment during the early Th cell differentiation.
The tight regulatory control for proper T helper cell differentiation suggests perturbations to the system have important implications for immunopathogenesis. One possible mechanism for such systematic error is through improper regulatory control of gene expression critical for a given cell fate commitment. The current collection of immunopathogenic GWAS has identified a large number of disease associated SNPs that fail to identify causative genes. Our integrative analysis of chromatin-mapped regulatory elements not only provides insight into the regulation of T cell fate commitment, but also determined that many associated SNPs are regulatory SNPs. In several instances these variants occurred more frequently in known motifs for TFs previously shown to be important in T helper cell differentiation. Functional validation of a panel of enhancer motifs indicated that SNPs could alter TF binding. To further our understanding of the basis of diseases such as asthma, RA, or T1D, we made use of predicted target genes for enhancers harboring associated variants to hypothesize that these genes may be affected by the rSNPs. Our integrative analysis of chromatin state maps, TFBS motif analysis, and modeling of enhancer-gene pairs combined with autoimmune GWAS provides new insight on the basic biology of early T cell differentiation and provides new avenues of investigation, such as the roles altered TF binding and distal regulatory elements play in the etiology of several immune disorders.
EXPERIMENTAL PROCEDURES
Detailed description of methods for Human cord blood CD4+ T cell isolation, Western blotting, flow cytometry, ChIP, ChIP-seq and DAPA can be found in the Supplemental Methods.
Human Cord Blood CD4+ T Cell Culturing
All the data included in this manuscript has been acquired under the permission from the Ethics Committee of the Hospital District of Southwest Finland.
Purified naïve CD4+ T cells were activated with plate-bound anti-CD3 (2.5 μg/ml for coating) and 500ng/ml soluble anti-CD28 (Immunotech, Marseille, France). Th1 cell polarization was initiated with 2.5 ng/ml IL-12 (R&D Systems, Minneapolis, MN) and Th2 cell neutralizing antibody anti-IL4 (1ug/ml), and 10 ng/ml IL-4 (R&D Systems) plus Th1 cell neutralizing antibody anti-IFN-γ (1ug/ml) to promote Th2 cell differentiation. For neutral Th0 cells, only neutralizing antibody without polarizing cytokines was added. 17ng/ml IL-2 (R&D Systems) was added to the cultures at 48h (Elo et al., 2010).
Gene Expression and Analysis
Total RNA was extracted from naïve precursor human cord blood CD4+ T cells, only activated Th0 cells, and differentiated toward Th1 and Th2 cells at 72 hrs using Trizol reagent (Invitrogen). For single-molecule, digital gene expression sequencing, 1ug of total RNA was used starting material and was processed according to the Helicos Digital Gene Expression (DGE) Sample Preparation guide. The sequencing data were generated on the Heliscope platform by Helicos BioSciences, Cambridge. The raw data filtering, alignment to RefSeq hg18 transcripts and transcript counting were done using Helicos Helisphere (http://open.helicosbio.com/mwiki/index.php/Main_Page). Combination of replicate values and differentially expressed genes were determined with DESeq (Anders and Huber, 2010).
ChIP-seq analysis
Sequenced reads were aligned to genome (version hg18) using Bowtie (Langmead et al., 2009). Only uniquely mapping and single read per genome location were retained. Input measurements were used to correct the read density profiles. CTCF binding sites were identified using MACS (Zhang et al., 2008) and further filtered for more high-confidence peaks by taking only sites where CTCF motif (from TRANSFAC) was found (p<1e-4 for motif scanning when comparing to 20000 random sequences). Enhancer elements were detected using the methods from (Heintzman et al., 2007) (H3K4me1 and H3K4me3) and (He et al., 2010) (H3K4me1).
Transcription factor binding analysis
Prediction of TF binding was done using ProbTF (Lähdesmäki et al., 2008) and TRANSFAC (Matys et al., 2006) version 2009.3. For calculating p-values the null distribution was estimated by sampling sequences (30× the number of predicted enhancers) randomly from the genome. TFs with p-value < 0.01 were further filtered for expressed ones (DESeq normalized read count > 10). Enrichments of bound TFs were calculated using binomial test (using p=0.01). For exact locations of TF binding the enhancer areas were scanned with the TF motifs and the location with highest score was selected.
Analysis of enhancer-SNP overlaps
Disease associated SNPs were downloaded from dbGaP database. Only SNPs with association with p-value < 0.05 were used in overlaps. Enrichment null distributions were estimated by counting the overlaps of SNPs with randomly selected locations of sizes equal to the enhancer sets from the genome (excluding centromeres and telomeres) and repeating this 1000 times.
Supplementary Material
HIGHLIGHTS.
The first genome-wide enhancer maps early in Th1 and Th2 cell lineage commitment.
Lineage-specific enhancers are mapped to nucleosome-free resolution.
Enhancers overlap SNPs associated with autoimmune disorders.
SNPs often occur at enhancers within TF binding site motifs.
Acknowledgments
We thank the donors and personnel of Turku University Hospital Department of Obstetrics and Gynecology, Maternity Ward for the cord blood collection. We thank Dr. Sanna Edelman and Dr. Soile Tuomela for suggestions and discussion. This work was supported in part by the Academy of Finland (Centre of Excellence in Molecular Systems Immunology and Physiology Research) and EC-FP7-SYBILLA-201106 (H.L., R.L.); TISE Graduate School (H.L.); The Sigrid Juselius Foundation (R.L.); NIH U01 ES017166 (B.R.) and Ludwig Institute for Cancer Research (B.R.); WA State Life Sciences Discover Fund/(265508)Northwest Institute for Genomic Medicine (R.D.H.).
Footnotes
Publisher's Disclaimer: This is a PDF file of an unedited manuscript that has been accepted for publication. As a service to our customers we are providing this early version of the manuscript. The manuscript will undergo copyediting, typesetting, and review of the resulting proof before it is published in its final citable form. Please note that during the production process errors maybe discovered which could affect the content, and all legal disclaimers that apply to the journal pertain.
References
- Aday AW, Zhu LJ, Lakshmanan A, Wang J, Lawson ND. Identification of cis regulatory features in the embryonic zebrafish genome through large-scale profiling of H3K4me1 and H3K4me3 binding sites. Dev Biol. 2011 doi: 10.1016/j.ydbio.2011.03.007. [DOI] [PMC free article] [PubMed] [Google Scholar]
- Afkarian M, Sedy JR, Yang J, Jacobson NG, Cereb N, Yang SY, Murphy TL, Murphy KM. T-bet is a STAT1-induced regulator of IL-12R expression in naive CD4+ T cells. Nat Immunol. 2002;3:549–557. doi: 10.1038/ni794. [DOI] [PubMed] [Google Scholar]
- Aijo T, Edelman SM, Lonnberg T, Larjo A, Kallionpaa H, Tuomela S, Engstrom E, Lahesmaa R, Lahdesmaki H. An integrative computational systems biology approach identifies differentially regulated dynamic transcriptome signatures which drive the initiation of human T helper cell differentiation. BMC Genomics. 2012;13:572. doi: 10.1186/1471-2164-13-572. [DOI] [PMC free article] [PubMed] [Google Scholar]
- Anders S, Huber W. Differential expression analysis for sequence count data. Genome Biol. 2010;11:R106. doi: 10.1186/gb-2010-11-10-r106. [DOI] [PMC free article] [PubMed] [Google Scholar]
- Anderson CA, Boucher G, Lees CW, Franke A, D’Amato M, Taylor KD, Lee JC, Goyette P, Imielinski M, Latiano A, et al. Meta-analysis identifies 29 additional ulcerative colitis risk loci, increasing the number of confirmed associations to 47. Nat Genet. 2011;43:246–252. doi: 10.1038/ng.764. [DOI] [PMC free article] [PubMed] [Google Scholar]
- Ansel KM, Djuretic I, Tanasa B, Rao A. Regulation of Th2 differentiation and Il4 locus accessibility. Annu Rev Immunol. 2006;24:607–656. doi: 10.1146/annurev.immunol.23.021704.115821. [DOI] [PubMed] [Google Scholar]
- AREDS. The Age-Related Eye Disease Study (AREDS): design implications. AREDS report no. 1. Control Clin Trials. 1999;20:573–600. doi: 10.1016/s0197-2456(99)00031-8. [DOI] [PMC free article] [PubMed] [Google Scholar]
- Barrett JC, Clayton DG, Concannon P, Akolkar B, Cooper JD, Erlich HA, Julier C, Morahan G, Nerup J, Nierras C, et al. Genome-wide association study and meta-analysis find that over 40 loci affect risk of type 1 diabetes. Nat Genet. 2009;41:703–707. doi: 10.1038/ng.381. [DOI] [PMC free article] [PubMed] [Google Scholar]
- Bell AC, West AG, Felsenfeld G. The protein CTCF is required for the enhancer blocking activity of vertebrate insulators. Cell. 1999;98:387–396. doi: 10.1016/s0092-8674(00)81967-4. [DOI] [PubMed] [Google Scholar]
- Bulger M, Groudine M. Functional and Mechanistic Diversity of Distal Transcription Enhancers. Cell. 2011;144:327–339. doi: 10.1016/j.cell.2011.01.024. [DOI] [PMC free article] [PubMed] [Google Scholar]
- Cargill M, Schrodi SJ, Chang M, Garcia VE, Brandon R, Callis KP, Matsunami N, Ardlie KG, Civello D, Catanese JJ, et al. A large-scale genetic association study confirms IL12B and leads to the identification of IL23R as psoriasis-risk genes. Am J Hum Genet. 2007;80:273–290. doi: 10.1086/511051. [DOI] [PMC free article] [PubMed] [Google Scholar]
- Cheung VG, Spielman RS. Genetics of human gene expression: mapping DNA variants that influence gene expression. Nat Rev Genet. 2009;10:595–604. doi: 10.1038/nrg2630. [DOI] [PMC free article] [PubMed] [Google Scholar]
- Creyghton MP, Cheng AW, Welstead GG, Kooistra T, Carey BW, Steine EJ, Hanna J, Lodato MA, Frampton GM, Sharp PA, et al. From the Cover: Histone H3K27ac separates active from poised enhancers and predicts developmental state. Proceedings of the National Academy of Sciences. 2010;107:21931–21936. doi: 10.1073/pnas.1016071107. [DOI] [PMC free article] [PubMed] [Google Scholar]
- Duerr RH, Taylor KD, Brant SR, Rioux JD, Silverberg MS, Daly MJ, Steinhart AH, Abraham C, Regueiro M, Griffiths A, et al. A genome-wide association study identifies IL23R as an inflammatory bowel disease gene. Science. 2006;314:1461–1463. doi: 10.1126/science.1135245. [DOI] [PMC free article] [PubMed] [Google Scholar]
- Elo LL, Järvenpää H, Tuomela S, Raghav S, Ahlfors H, Laurila K, Gupta B, Lund RJ, Tahvanainen J, Hawkins RD, et al. Genome-wide Profiling of Interleukin-4 and STAT6 Transcription Factor Regulation of Human Th2 Cell Programming. Immunity. 2010;32:852–862. doi: 10.1016/j.immuni.2010.06.011. [DOI] [PubMed] [Google Scholar]
- ENCODE. A user’s guide to the encyclopedia of DNA elements (ENCODE) PLoS Biol. 2011;9:e1001046. doi: 10.1371/journal.pbio.1001046. [DOI] [PMC free article] [PubMed] [Google Scholar]
- Ernst J, Kheradpour P, Mikkelsen TS, Shoresh N, Ward LD, Epstein CB, Zhang X, Wang L, Issner R, Coyne M, et al. Mapping and analysis of chromatin state dynamics in nine human cell types. Nature. 2011;473:43–49. doi: 10.1038/nature09906. [DOI] [PMC free article] [PubMed] [Google Scholar]
- Frossi B, Rivera J, Hirsch E, Pucillo C. Selective activation of Fyn/PI3K and p38 MAPK regulates IL-4 production in BMMC under nontoxic stress condition. J Immunol. 2007;178:2549–2555. doi: 10.4049/jimmunol.178.4.2549. [DOI] [PubMed] [Google Scholar]
- Gaulton KJ, Nammo T, Pasquali L, Simon JM, Giresi PG, Fogarty MP, Panhuis TM, Mieczkowski P, Secchi A, Bosco D, et al. A map of open chromatin in human pancreatic islets. Nat Genet. 2010;42:255–259. doi: 10.1038/ng.530. [DOI] [PMC free article] [PubMed] [Google Scholar]
- Grangeiro de Carvalho E, Bonin M, Kremsner PG, Kun JF. Plasmodium falciparum-infected erythrocytes and IL-12/IL-18 induce diverse transcriptomes in human NK cells: IFN-alpha/beta pathway versus TREM signaling. PLoS ONE. 2011;6:e24963. doi: 10.1371/journal.pone.0024963. [DOI] [PMC free article] [PubMed] [Google Scholar]
- Hafler DA, Compston A, Sawcer S, Lander ES, Daly MJ, De Jager PL, de Bakker PI, Gabriel SB, Mirel DB, Ivinson AJ, et al. Risk alleles for multiple sclerosis identified by a genomewide study. N Engl J Med. 2007;357:851–862. doi: 10.1056/NEJMoa073493. [DOI] [PubMed] [Google Scholar]
- Hatton RD, Harrington LE, Luther RJ, Wakefield T, Janowski KM, Oliver JR, Lallone RL, Murphy KM, Weaver CT. A distal conserved sequence element controls Ifng gene expression by T cells and NK cells. Immunity. 2006;25:717–729. doi: 10.1016/j.immuni.2006.09.007. [DOI] [PubMed] [Google Scholar]
- Hawkins RD, Hon GC, Yang C, Antosiewicz-Bourget JE, Lee LK, Ngo QM, Klugman S, Ching KA, Edsall LE, Ye Z, et al. Dynamic chromatin states in human ES cells reveal potential regulatory sequences and genes involved in pluripotency. Cell Res. 2011;21:1393–1409. doi: 10.1038/cr.2011.146. [DOI] [PMC free article] [PubMed] [Google Scholar]
- He HH, Meyer CA, Shin H, Bailey ST, Wei G, Wang Q, Zhang Y, Xu K, Ni M, Lupien M, et al. Nucleosome dynamics define transcriptional enhancers. Nat Genet. 2010;42:343–347. doi: 10.1038/ng.545. [DOI] [PMC free article] [PubMed] [Google Scholar]
- Heintzman ND, Hon GC, Hawkins RD, Kheradpour P, Stark A, Harp LF, Ye Z, Lee LK, Stuart RK, Ching CW, et al. Histone modifications at human enhancers reflect global cell-type-specific gene expression. Nature. 2009;459:108–112. doi: 10.1038/nature07829. [DOI] [PMC free article] [PubMed] [Google Scholar]
- Heintzman ND, Stuart RK, Hon G, Fu Y, Ching CW, Hawkins RD, Barrera LO, Van Calcar S, Qu C, Ching KA, et al. Distinct and predictive chromatin signatures of transcriptional promoters and enhancers in the human genome. Nat Genet. 2007;39:311–318. doi: 10.1038/ng1966. [DOI] [PubMed] [Google Scholar]
- Helms C, Cao L, Krueger JG, Wijsman EM, Chamian F, Gordon D, Heffernan M, Daw JA, Robarge J, Ott J, et al. A putative RUNX1 binding site variant between SLC9A3R1 and NAT9 is associated with susceptibility to psoriasis. Nat Genet. 2003;35:349–356. doi: 10.1038/ng1268. [DOI] [PubMed] [Google Scholar]
- Hindorff LA, Sethupathy P, Junkins HA, Ramos EM, Mehta JP, Collins FS, Manolio TA. Potential etiologic and functional implications of genome-wide association loci for human diseases and traits. Proc Natl Acad Sci U S A. 2009;106:9362–9367. doi: 10.1073/pnas.0903103106. [DOI] [PMC free article] [PubMed] [Google Scholar]
- Hirota K, Duarte JH, Veldhoen M, Hornsby E, Li Y, Cua DJ, Ahlfors H, Wilhelm C, Tolaini M, Menzel U, et al. Fate mapping of IL-17-producing T cells in inflammatory responses. Nat Immunol. 2011;12:255–263. doi: 10.1038/ni.1993. [DOI] [PMC free article] [PubMed] [Google Scholar]
- Horiuchi S, Onodera A, Hosokawa H, Watanabe Y, Tanaka T, Sugano S, Suzuki Y, Nakayama T. Genome-wide analysis reveals unique regulation of transcription of Th2-specific genes by GATA3. J Immunol. 2011;186:6378–6389. doi: 10.4049/jimmunol.1100179. [DOI] [PubMed] [Google Scholar]
- Iwanaga R, Ozono E, Fujisawa J, Ikeda MA, Okamura N, Huang Y, Ohtani K. Activation of the cyclin D2 and cdk6 genes through NF-kappaB is critical for cell-cycle progression induced by HTLV-I Tax. Oncogene. 2008;27:5635–5642. doi: 10.1038/onc.2008.174. [DOI] [PubMed] [Google Scholar]
- Kaplan MH, Schindler U, Smiley ST, Grusby MJ. Stat6 is required for mediating responses to IL-4 and for development of Th2 cells. Immunity. 1996a;4:313–319. doi: 10.1016/s1074-7613(00)80439-2. [DOI] [PubMed] [Google Scholar]
- Kaplan MH, Sun YL, Hoey T, Grusby MJ. Impaired IL-12 responses and enhanced development of Th2 cells in Stat4-deficient mice. Nature. 1996b;382:174–177. doi: 10.1038/382174a0. [DOI] [PubMed] [Google Scholar]
- Lähdesmäki H, Rust AG, Shmulevich I. Probabilistic inference of transcription factor binding from multiple data sources. PLoS ONE. 2008;3:e1820. doi: 10.1371/journal.pone.0001820. [DOI] [PMC free article] [PubMed] [Google Scholar]
- Langmead B, Trapnell C, Pop M, Salzberg SL. Ultrafast and memory-efficient alignment of short DNA sequences to the human genome. Genome Biol. 2009;10:R25. doi: 10.1186/gb-2009-10-3-r25. [DOI] [PMC free article] [PubMed] [Google Scholar]
- Lund R, Ahlfors H, Kainonen E, Lahesmaa AM, Dixon C, Lahesmaa R. Identification of genes involved in the initiation of human Th1 or Th2 cell commitment. Eur J Immunol. 2005;35:3307–3319. doi: 10.1002/eji.200526079. [DOI] [PubMed] [Google Scholar]
- Lund RJ, Loytomaki M, Naumanen T, Dixon C, Chen Z, Ahlfors H, Tuomela S, Tahvanainen J, Scheinin J, Henttinen T, et al. Genome-wide identification of novel genes involved in early Th1 and Th2 cell differentiation. J Immunol. 2007;178:3648–3660. doi: 10.4049/jimmunol.178.6.3648. [DOI] [PubMed] [Google Scholar]
- Matys V, Kel-Margoulis OV, Fricke E, Liebich I, Land S, Barre-Dirrie A, Reuter I, Chekmenev D, Krull M, Hornischer K, et al. TRANSFAC and its module TRANSCompel: transcriptional gene regulation in eukaryotes. Nucleic Acids Res. 2006;34:D108–110. doi: 10.1093/nar/gkj143. [DOI] [PMC free article] [PubMed] [Google Scholar]
- Maurano MT, Humbert R, Rynes E, Thurman RE, Haugen E, Wang H, Reynolds AP, Sandstrom R, Qu H, Brody J, et al. Systematic localization of common disease-associated variation in regulatory DNA. Science. 2012;337:1190–1195. doi: 10.1126/science.1222794. [DOI] [PMC free article] [PubMed] [Google Scholar]
- Moffatt MF, Gut IG, Demenais F, Strachan DP, Bouzigon E, Heath S, von Mutius E, Farrall M, Lathrop M, Cookson WO. A large-scale, consortium-based genomewide association study of asthma. N Engl J Med. 2010;363:1211–1221. doi: 10.1056/NEJMoa0906312. [DOI] [PMC free article] [PubMed] [Google Scholar]
- Murphy KM, Stockinger B. Effector T cell plasticity: flexibility in the face of changing circumstances. Nat Immunol. 2010;11:674–680. doi: 10.1038/ni.1899. [DOI] [PMC free article] [PubMed] [Google Scholar]
- Nair RP, Stuart PE, Nistor I, Hiremagalore R, Chia NV, Jenisch S, Weichenthal M, Abecasis GR, Lim HW, Christophers E, et al. Sequence and haplotype analysis supports HLA-C as the psoriasis susceptibility 1 gene. Am J Hum Genet. 2006;78:827–851. doi: 10.1086/503821. [DOI] [PMC free article] [PubMed] [Google Scholar]
- Negre N, Brown CD, Ma L, Bristow CA, Miller SW, Wagner U, Kheradpour P, Eaton ML, Loriaux P, Sealfon R, et al. A cis-regulatory map of the Drosophila genome. Nature. 2011;471:527–531. doi: 10.1038/nature09990. [DOI] [PMC free article] [PubMed] [Google Scholar]
- Ong CT, Corces VG. Enhancer function: new insights into the regulation of tissue-specific gene expression. Nature Reviews Genetics. 2011;12:283–293. doi: 10.1038/nrg2957. [DOI] [PMC free article] [PubMed] [Google Scholar]
- Quintana FJ, Basso AS, Iglesias AH, Korn T, Farez MF, Bettelli E, Caccamo M, Oukka M, Weiner HL. Control of T(reg) and T(H)17 cell differentiation by the aryl hydrocarbon receptor. Nature. 2008;453:65–71. doi: 10.1038/nature06880. [DOI] [PubMed] [Google Scholar]
- Rada-Iglesias A, Bajpai R, Swigut T, Brugmann SA, Flynn RA, Wysocka J. A unique chromatin signature uncovers early developmental enhancers in humans. Nature. 2011;470:279–283. doi: 10.1038/nature09692. [DOI] [PMC free article] [PubMed] [Google Scholar]
- Rautajoki KJ, Kylaniemi MK, Raghav SK, Rao K, Lahesmaa R. An insight into molecular mechanisms of human T helper cell differentiation. Ann Med. 2008;40:322–335. doi: 10.1080/07853890802068582. [DOI] [PubMed] [Google Scholar]
- Reiner SL, Sallusto F, Lanzavecchia A. Division of labor with a workforce of one: challenges in specifying effector and memory T cell fate. Science. 2007;317:622–625. doi: 10.1126/science.1143775. [DOI] [PubMed] [Google Scholar]
- Rioux JD, Xavier RJ, Taylor KD, Silverberg MS, Goyette P, Huett A, Green T, Kuballa P, Barmada MM, Datta LW, et al. Genome-wide association study identifies new susceptibility loci for Crohn disease and implicates autophagy in disease pathogenesis. Nat Genet. 2007;39:596–604. doi: 10.1038/ng2032. [DOI] [PMC free article] [PubMed] [Google Scholar]
- Roh TY, Cuddapah S, Cui K, Zhao K. The genomic landscape of histone modifications in human T cells. Proc Natl Acad Sci U S A. 2006;103:15782–15787. doi: 10.1073/pnas.0607617103. [DOI] [PMC free article] [PubMed] [Google Scholar]
- Roh TY, Wei G, Farrell CM, Zhao K. Genome-wide prediction of conserved and nonconserved enhancers by histone acetylation patterns. Genome Res. 2007;17:74–81. doi: 10.1101/gr.5767907. [DOI] [PMC free article] [PubMed] [Google Scholar]
- Rothenberg EV. Negotiation of the T lineage fate decision by transcription-factor interplay and microenvironmental signals. Immunity. 2007;26:690–702. doi: 10.1016/j.immuni.2007.06.005. [DOI] [PubMed] [Google Scholar]
- Schoenborn JR, Dorschner MO, Sekimata M, Santer DM, Shnyreva M, Fitzpatrick DR, Stamatoyannopoulos JA, Wilson CB. Comprehensive epigenetic profiling identifies multiple distal regulatory elements directing transcription of the gene encoding interferon-gamma. Nat Immunol. 2007;8:732–742. doi: 10.1038/ni1474. [DOI] [PMC free article] [PubMed] [Google Scholar]
- Schulz EG, Mariani L, Radbruch A, Hofer T. Sequential polarization and imprinting of type 1 T helper lymphocytes by interferon-gamma and interleukin-12. Immunity. 2009;30:673–683. doi: 10.1016/j.immuni.2009.03.013. [DOI] [PubMed] [Google Scholar]
- Scoggan KA, Jakobsson PJ, Ford-Hutchinson AW. Production of leukotriene C4 in different human tissues is attributable to distinct membrane bound biosynthetic enzymes. J Biol Chem. 1997;272:10182–10187. doi: 10.1074/jbc.272.15.10182. [DOI] [PubMed] [Google Scholar]
- Shen Y, Yue F, McCleary DF, Ye Z, Edsall L, Kuan S, Wagner U, Dixon J, Lee L, Lobanenkov VV, Ren B. A map of the cis-regulatory sequences in the mouse genome. Nature. 2012 doi: 10.1038/nature11243. [DOI] [PMC free article] [PubMed] [Google Scholar]
- Sjostrom M, Jakobsson PJ, Heimburger M, Palmblad J, Haeggstrom JZ. Human umbilical vein endothelial cells generate leukotriene C4 via microsomal glutathione S-transferase type 2 and express the CysLT(1) receptor. Eur J Biochem. 2001;268:2578–2586. doi: 10.1046/j.1432-1327.2001.02142.x. [DOI] [PubMed] [Google Scholar]
- Stahl EA, Raychaudhuri S, Remmers EF, Xie G, Eyre S, Thomson BP, Li Y, Kurreeman FA, Zhernakova A, Hinks A, et al. Genome-wide association study meta-analysis identifies seven new rheumatoid arthritis risk loci. Nat Genet. 2010;42:508–514. doi: 10.1038/ng.582. [DOI] [PMC free article] [PubMed] [Google Scholar]
- Visel A, Blow MJ, Li Z, Zhang T, Akiyama JA, Holt A, Plajzer-Frick I, Shoukry M, Wright C, Chen F, et al. ChIP-seq accurately predicts tissue-specific activity of enhancers. Nature. 2009;457:854–858. doi: 10.1038/nature07730. [DOI] [PMC free article] [PubMed] [Google Scholar]
- Weaver CT, Hatton RD, Mangan PR, Harrington LE. IL-17 family cytokines and the expanding diversity of effector T cell lineages. Annu Rev Immunol. 2007;25:821–852. doi: 10.1146/annurev.immunol.25.022106.141557. [DOI] [PubMed] [Google Scholar]
- Wei G, Wei L, Zhu J, Zang C, Hu-Li J, Yao Z, Cui K, Kanno Y, Roh TY, Watford WT, et al. Global mapping of H3K4me3 and H3K27me3 reveals specificity and plasticity in lineage fate determination of differentiating CD4+ T cells. Immunity. 2009;30:155–167. doi: 10.1016/j.immuni.2008.12.009. [DOI] [PMC free article] [PubMed] [Google Scholar]
- Wen AY, Sakamoto KM, Miller LS. The role of the transcription factor CREB in immune function. J Immunol. 2010;185:6413–6419. doi: 10.4049/jimmunol.1001829. [DOI] [PMC free article] [PubMed] [Google Scholar]
- Werz O, Steinhilber D. Therapeutic options for 5-lipoxygenase inhibitors. Pharmacol Ther. 2006;112:701–718. doi: 10.1016/j.pharmthera.2006.05.009. [DOI] [PubMed] [Google Scholar]
- Zhang JA, Mortazavi A, Williams BA, Wold BJ, Rothenberg EV. Dynamic transformations of genome-wide epigenetic marking and transcriptional control establish T cell identity. Cell. 2012;149:467–482. doi: 10.1016/j.cell.2012.01.056. [DOI] [PMC free article] [PubMed] [Google Scholar]
- Zhang Y, Liu T, Meyer CA, Eeckhoute J, Johnson DS, Bernstein BE, Nussbaum C, Myers RM, Brown M, Li W, Liu XS. Model-based analysis of ChIP-Seq (MACS) Genome Biol. 2008;9:R137. doi: 10.1186/gb-2008-9-9-r137. [DOI] [PMC free article] [PubMed] [Google Scholar]
- Zhou L, Chong MM, Littman DR. Plasticity of CD4+ T cell lineage differentiation. Immunity. 2009;30:646–655. doi: 10.1016/j.immuni.2009.05.001. [DOI] [PubMed] [Google Scholar]
Associated Data
This section collects any data citations, data availability statements, or supplementary materials included in this article.