

Abstract
Benzo[a]pyrene (BaP) is an environmentally relevant carcinogenic and endocrine disrupting compound that causes immediate, long-term, and multigenerational health deficits in mammals and fish. Previously, we found that BaP alters DNA methylation patterns in developing zebrafish, which may affect gene expression. Herein, we performed a genome-wide transcriptional analysis and discovered differential gene expression and splicing in developing zebrafish. Adult zebrafish were exposed to control or 42.0 ± 1.9 µg/l BaP for 7 days. Eggs were collected and raised in control conditions or continuously exposed to BaP until 3.3 and 96 h post–fertilization (hpf). RNA sequencing (RNA-Seq) was conducted on zebrafish embryos and larvae. Data were analyzed to identify differentially expressed (DE) genes (changed at the gene or transcript variant level) and genes with differential exon usage (DEU; changed at the exon level). At 3.3 hpf, BaP exposure resulted in 8 DE genes and 51 DEU genes. At 96 hpf, BaP exposure altered expression in 1153 DE genes and 159 DEU genes. Functional ontology analysis by Ingenuity Pathway Analysis revealed that many disease pathways, including organismal death, growth failure, abnormal morphology of embryonic tissue, congenital heart disease, and adverse neuritogenesis, were significantly enriched for the DE and DEU genes, providing novel insights on the mechanisms of action of BaP-induced developmental toxicities. Collectively, we discovered substantial transcriptomic changes at the gene, transcript variant, and exon levels in developing zebrafish after early life BaP waterborne exposure, and these changes may lead to long-term adverse physiological consequences.
Keywords: zebrafish, benzo[a]pyrene, development, RNA-Seq, gene expression, alternative splicing
Benzo[a]pyrene (BaP) is a model polycyclic aromatic hydrocarbon (PAH) and a ubiquitous contaminant generated from incomplete combustion of carbon. While BaP is classified as a Group 1 animal and human carcinogen in the 2012 International Agency for Research on Cancer (IARC) monographs (http://monographs.iarc.fr/ENG/Classification/), it is also an established reproductive and developmental toxicant in humans and wildlife. In humans, BaP has been detected in adult reproductive organs (Zenzes et al., 1998), maternal blood, placenta, cord blood, and breast milk (Madhavan and Naidu, 1995). Prenatal exposure to PAHs has been linked to miscarriage (Wu et al., 2010), preterm delivery and small size for gestational age (Choi et al., 2008), and low birth weight (Duarte-Salles et al., 2013; Perera et al., 2005). In zebrafish (Danio rerio), waterborne or dietary BaP/PAH exposure causes developmental toxicities including growth reduction, neonatal death, cardiac dysfunction, skeletal abnormalities, craniofacial deformities, and morphological defects in fin and swim bladder (Corrales et al., 2014a).
In addition to immediate birth defects, prenatal and neonatal BaP exposure causes long-term and transgenerational adverse effects. In animals, in utero BaP exposure leads to increased adiposity and hepatic steatosis (Ortiz et al., 2014), liver tumorigenesis (Wislocki et al., 1986), cardiac dysfunction (Huang et al., 2014; Jules et al., 2012), impaired learning and cognitive abilities (Chen et al., 2012), and reduced numbers of sperm and egg follicles in adults (Kristensen et al., 1995; MacKenzie and Angevine, 1981). Transgenerational BaP effects in mice include increased incidence of lung adenomas after in utero exposure and adversely impacted sperm function and fertility following paternal exposures (Mohamed el et al., 2010; Turusov et al., 1990). Our previous work also demonstrated that BaP exerts multigenerational effects on survival and developmental deformities in zebrafish larvae (Corrales et al., 2014a).
Although the mutagenic and adverse whole-organismal effects of BaP on development have been well recognized, the involved molecular mechanisms are less understood. Altered DNA methylation has more recently been implicated in BaP-mediated toxicities. BaP alters global and gene-specific DNA methylation patterns in cell models (Sadikovic and Rodenhiser, 2006; Sadikovic et al., 2004) and in humans, in utero PAH exposure is associated with lower global methylation in umbilical cord white blood cells (Herbstman et al., 2012). Our previous studies found that BaP decreases global DNA methylation levels and alters gene-specific methylation patterns in zebrafish embryos and larvae (Corrales et al., 2014b; Fang et al., 2013a). Because promoter DNA methylation typically inhibits gene expression and gene body DNA methylation also regulates transcription, we hypothesized that BaP-induced aberrant DNA methylation patterns may lead to abnormal gene expression profiles. Therefore, in this study, we used Illumina RNA sequencing technology (RNA-Seq) to detect genome-wide transcriptional changes in BaP-exposed zebrafish embryos and larvae, which could lead to understanding new mechanisms of BaP toxicity.
DNA methylation, gene mutations and DNA damage can influence alternative splicing during gene transcription (Maunakea et al., 2013; Revil et al., 2010). Alternative splicing is a major mechanism that generates proteomic diversity in higher eukaryotes (Wang and Cooper, 2007). Abnormal alternative splicing, as demonstrated by differential exon usage (DEU), may lead to both abnormal transcript variants and protein synthesis. DEU is often observed in diseases such as cardiovascular diseases, type 1 diabetes, and neurological disorders (Wang and Cooper, 2007). Notably, a recent genome-wide transcriptional analysis has found that alternative splicing and isoform expression are frequent in various tissues during development, and therefore, gene expression should be monitored at the whole gene and the transcript variant levels in developmental studies (Revil et al., 2010). A recent study reported that BaP causes abnormal alternative splicing in selective genes (Yan et al., 2010). By using RNA-Seq, we were able to assess DEU during development after BaP exposure.
Previously, we developed a treatment strategy of parental and continued embryonic waterborne BaP exposure (Fig. 1) that enhances the toxic effects of BaP in zebrafish compared with embryonic waterborne BaP exposure alone (Corrales et al., 2014b). This exposure regime is more relevant because adult animals including humans and their offspring typically live in the same polluted environment. Using this experimental design, we observed reduced egg production and offspring survival as well as changes in global and gene-specific DNA methylation in the zebrafish offspring (Corrales et al., 2014b). Thus, in this study, we performed transcriptomic RNA-Seq analysis on the embryos and larvae treated during the same BaP exposure. We found that parental and early BaP exposure until 3.3 h postfertilization (hpf) changed gene expression and alternative splicing in relatively few genes. When the exposure continued until 96 hpf, we detected substantial transcriptomic changes at the gene (all transcript variants), transcript variant (full length transcript), and exon (individual exon) levels. Pathway analysis on the observed gene expression changes indicated that canonical pathways, including xenobiotic metabolism signaling, NRF2-mediated oxidative stress response, and glutathione-mediated detoxification, were affected by BaP. In addition, many disease pathways were predicted to be activated, including organismal death, growth failure, abnormal morphology of embryonic tissue, congenital heart disease, and adverse neuritogenesis, which are consistent to the phenotypic outcomes of BaP exposure. Thus, our study provides novel insights on the mechanisms of action of BaP-induced developmental toxicities.
FIG 1.
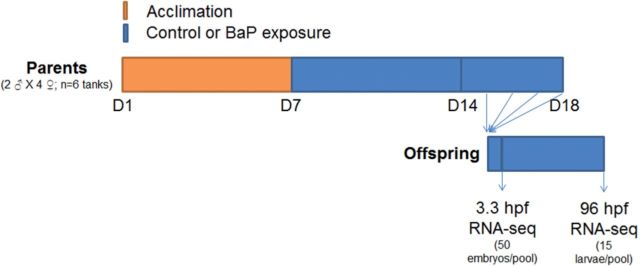
BaP exposure strategy. Parental zebrafish were acclimated in new culture conditions for 7 days before BaP (42.0 ± 1.9 µg/l) or control exposure for 11 days. Fertilized eggs were collected during exposure days 7–11. Eggs were continuously exposed to BaP until 3.3 or 96 hpf before being collected for gene expression analysis. Arrows indicate collection of offspring for exposure or RNA sequencing (RNA-Seq).
MATERIALS AND METHODS
Zebrafish care
AB line wild-type zebrafish were purchased from Zebrafish International Resource Center (ZFIN, Eugene, Oregon) and raised under the approved IACUC (Institutional Animal Care and Use Committee) protocol of the University of Mississippi. Fish were kept in Aquatic Habitats ZF0601 Zebrafish Stand-Alone System (Aquatic Habitats, Apopka, Florida) at 25–28°C, 14:10 light–dark cycle. The zebrafish water was at pH 7.0–7.5 with salinity of 60 ppm (parts per million; Instant Ocean, Cincinnati, Ohio). Fish were fed twice daily with TetraMin Tropical Flakes (Blacksburg, Virginia) and live brine shrimp. Healthy adult fish were used as breeders for parental exposure.
Parental and embryonic waterborne exposure
BaP exposure was performed as previously described (Fig. 1) (Corrales et al., 2014b). Adult zebrafish (2 males × 4 females, N = 6 replicate tanks) were acclimated for 7 days in an 818 Low Temp Illuminated Incubator (Precision Scientific, Chennai, India) at 28.5°C. During acclimation, fish tanks were covered to limit light except during 8:00–9:00 a.m. to trigger spawning. Thereafter, parental fish were waterborne exposed to control or 50 μg/l (ppb) BaP for 7 days before collecting eggs; ethanol was used as vehicle solvent at a final concentration of 0.1 ml/l (100 ppm). Multiple studies have reported ethanol effects on zebrafish development, and we and others found that 100 ppm is not a teratogenic dose to zebrafish (Ali et al., 2011). BaP (Supelco Analytical, Belfonte, Pennsylvania) at 50 μg/l was used because this dose of BaP reduces survival rate, delays hatching, and alters DNA methylation patterns in zebrafish embryos and larvae (Corrales et al., 2014b; Fang et al., 2013a). Also, this dose is below the EC50 (131 μg/l) for teratogenicity of BaP to zebrafish (Weigt et al., 2011).
Water was changed and/or re-dosed daily during adult zebrafish acclimation and exposure in adults and embryos. Both control and BaP-treated water were sampled 3 times for actual BaP quantitation. BaP concentrations in the water extracts were measured by gas chromatography (Agilent 6890, Agilent Technologies, Santa Clara, California) coupled with mass spectrometry (Agilent 5973 N) as described (Corrales et al., 2014b).
From days 7 to 11 of parental exposure, eggs were collected, counted, and raised in control conditions or continuously exposed to 50 μg/l BaP. At 3.3 or 96 hpf, embryos (50/pool) or larvae (15/pool) were collected and pooled for RNA isolation. These 2 time points were selected because at 3.3 hpf the mid-blastula transition has been reached and zygote transcription is activated, and by 96 hpf organogenesis is complete (Kimmel et al., 1995). Therefore, developmental effects at these 2 time points are biologically comparative from the onset of transcription to when the organism is fully developed.
RNA isolation and reverse transcription
Pooled embryos or larvae were homogenized with a Kontes Pellet Pestle Cordless Motor (Sigma-Aldrich, St. Louis, Missouri) in RNAzol (Molecular Research Center, Cincinnati, Ohio). RNA was isolated and purified with RNeasy Mini Kit (Qiagen, Valencia, California). Total RNA was used for RNA-Seq analysis or reverse transcribed to cDNA libraries by using TaqMan Reverse Transcription Reagents (Life Technologies Applied Biosystems, Grand Island, New York).
Illumina transcriptomic RNA sequencing (RNA-Seq)
Illumina-adapted library pools were prepared by a commercial service (Global Biologics, Columbia, Missouri). Total RNA was quantitated using the Qubit RNA assay and Qubit 2.0 Flourometer (Life Technologies). RNA integrity was confirmed using the Agilent RNA Pico assay reagents and Bioanalyzer 2100 system (Agilent Technologies). One microgram of total RNA was used for construction of the Illumina TruSeq v2 high throughput libraries (Illumina, San Diego, California). In brief, mRNA was enriched using oligo-dT magnetic beads and fragmented to ∼100–300 bp with a single shearing and an RT primer hybridization step prior to generating first and second strand cDNA. The resulting DNA was prepared for sequencing by blunt end repair, 3′ adenylation, multiplex compatible adapter ligation (containing TruSeq indexes), and PCR amplification. Library validation was performed using the Agilent Bioanalyzer 2100.
Illumina-adapted library pools were further size-fractionated on a Caliper LabChip XT with a DNA 750 Assay Kit (PerkinElmer, Waltham, Massachusetts) to remove residual adapter dimers. For each pool, the fraction between ∼320 and 480 bp was collected and then assayed by an Illumina library quantification kit (Kapa Biosystems, Woburn, Massachusetts) on a qPCR instrument (LightCycler 480, Roche Applied Science, Indianapolis, Indiana).
Ten Illumina-adapted libraries, which were 3 samples of control 3.3 hpf embryos, 3 samples of BaP-treated 3.3 hpf embryos, 2 samples of control 96 hpf larvae, and 2 samples of BaP-treated 96 hpf larvae, were pooled at equal molar ratio and clustered via cBot (Illumina) on a TruSeq PE Cluster Kit v3 paired-end flowcell (Illumina). Paired-end 2 × 100 bp sequencing was carried out on an Illumina HiSeq 2000 with TruSeq SBS Kit v3 (Illumina) chemistry. All RNA-Seq data were uploaded to the Gene Expression Omnibus (GEO) and can be accessed via http://www.ncbi.nlm.nih.gov/geo/; accession number GSE64198.
RNA-Seq data analysis for differential gene expression
RNA-Seq reads were uploaded to the Galaxy platform https://main.g2.bx.psu.edu/ (Blankenberg et al., 2010; Fang et al., 2014). 5′ or 3′ ends with low scores were trimmed, and RNA-Seq reads were mapped to the zebrafish genome (Danio_rerio.Zv9.70) with the Tophat for Illumina tool. The resulting Binary Sequence Alignment/Map (BAM) files were quantified for gene/transcript expression with Partek Genomics Suite (GS) version 6.11 (Partek, St. Louis, Missouri). Refseq Transcripts (2013-04-10) and Ensembl Transcripts release 70 databases were used for both gene and transcript annotation. Refseq is a collection of nonredundant and curated mRNA sequences, and Ensembl contains more gene sequences from multiple sources such as Refseq, UniProt, and Havana manual annotation. Thus, using both databases helped in identifying and annotating genes and transcripts. Pearson test, principal component analysis (PCA), and dendrogram clustering were performed to evaluate the correlation of samples. The raw counts of genes/transcripts were normalized with the Trimmed Mean of M-values (TMM) method. Differential expression (DE) of gene and transcript reads between treatments was analyzed using exact test with R package EdgeR (Robinson et al., 2010). Genes/transcripts with false discovery rate (FDR) < 0.05 and absolute fold change >1.5 were considered as significant. We defined DE genes as genes with altered expression at either gene or transcript level. Unique DE genes were identified by combining the results from both annotations with Refseq and Ensembl databases. The combined annotation results from both databases were used for further analysis. Functional ontology was conducted with the unique DE genes using the Database for Annotation, Visualization and Integrated Discovery (DAVID) http://david.abcc.ncifcrf.gov/ (Huang da et al., 2009) and Ingenuity Pathway Analysis (IPA; Qiagen). For IPA analysis, IDs of zebrafish DE genes were converted to their human orthologs using the Ensembl BioMart tool. These genes were uploaded with information of fold change and FDR to the IPA portal for functional ontology analysis, which includes 4 major analyses: (1) the Canonical Pathways function in IPA identifies the impacted molecular pathways based on the uploaded gene list; (2) the Network Analysis builds transcriptional networks and identifies regulatory events that lead to transcriptional effects; (3) the Diseases and Bio Functions analysis predicts activation or suppression of biological processes (biological and toxicological functions as well as risk of disease) based on gene expression results; and (4) the Upstream Regulator analysis predicts upstream molecules, including transcription factors, nuclear receptors, and microRNAs (miRNAs), that may be responsible for the observed gene expression changes. The significance criterion for IPA analysis is P < .05.
RNA-Seq data analysis for DEU
RNA-Seq data were filtered and mapped to the zebrafish genome (Ensembl Danio_rerio.Zv9.75) with the Tophat2 tool in the galaxy platform (Fang et al., 2014). DEU analysis was performed with R package DEXSeq to identify changes in the relative usage of each exon following BaP exposure (Anders et al., 2012). A comparison of expression for each exon between BaP and control samples was performed. Exons with FDR < .05 and absolute fold change > 1.5 were considered as significant. Functional annotation and ontology analysis on DEU genes was conducted with DAVID and IPA, respectively. For IPA analysis, IDs of zebrafish DEU genes were converted to their human orthologs using the Ensembl BioMart tool.
Overlap of DE and DEU genes
Distribution of DE and DEU genes across the chromosomes was analyzed. DE and DEU genes were compared, and the overlap of genes affected in expression and alternative splicing by BaP was identified. In the DE and DEU analyses, the reads were aligned to the Danio_rerio.Zv9 releases 70 and 75, respectively. Therefore, the differences in the gene builds may slightly affect the overlap between DE and DEU results. IPA analysis was performed on the overlap genes.
Quantitative reverse transcription real time PCR (qPCR)
qPCR primers were designed with FastPCR (PrimerDigital, Helsinki, Finland) and selected based on their specificity (checked with NCBI Primer-Blast) and whether they cross exon borders (Supplementary Table 1). Amplification efficiencies of the target genes and 18S rRNA primer pairs were not statistically different. Relative abundance of target genes to 18S rRNA transcripts was determined by qPCR with SYBR Green in a GeneAmp 7500 Sequence Detection System (Life Technologies Applied Biosystems). Each sample was measured in 2 separate reactions on the same plate. Fold change of gene expression was calculated with the 2−ΔΔCt method. Statistical differences between treatments or time-points were determined on the linearized 2−ΔCt values.
Results were analyzed using GraphPad Prism 6.0 (GraphPad Software, La Jolla, California). Statistical differences between treatment groups were determined using student’s t test (P < .05).
RESULTS
BaP Exposure Caused Deformities in Zebrafish Larvae
GC/MS data showed that the actual BaP concentration in the exposure water was 42.0 ± 1.9 μg/l, and BaP was not detected in the water of control tanks. Our previous publication reported that this exposure strategy significantly decreased egg production of zebrafish parents, reduced embryo survival, and increased overall deformity incidence in 96 hpf zebrafish larvae (Corrales et al., 2014b). In this study, we observed deformities including pericardial edema, tube heart, curly tail, and head and eye abnormalities in 96 hpf larvae (Supplementary Fig. 1), which are consistent with the phenotypes of similarly BaP-exposed zebrafish (Corrales et al., 2014a; Weigt et al., 2011).
Alignment and Annotation of RNA-Seq Reads
Transcriptomic sequencing was performed to identify DE genes caused by BaP exposure. The FastQC report showed that the sequence data had high-quality scores (>30). On average, the next generational sequencing run yielded 41 million reads per sample and the mapping efficiency of sequencing reads was 80.7% using TopHat aligner (Supplementary Table 2). About 21.5 million reads per sample were annotated to the zebrafish transcriptome released by Refseq and Ensembl databases. The percentages of mapping and annotation were similar among the treatment groups, indicating the data were of high quality and were uniform among samples.
Differential Gene Expression in 3.3 hpf Zebrafish Embryos After BaP Exposure
In 3.3 hpf embryos, DE analysis with EdgeR identified 4 genes, i.e. hspa5, elovl4a, LOC566022, and si:ch211-59h6.1, that were differentially expressed (DE) after BaP exposure (Supplementary Table 4). Because it is known that almost all genes have multiple transcript variants (Wang and Cooper, 2007), we also determined expression changes at the transcript level. Seven transcript variants, i.e. elovl4a (NM_200796), LOC566022 (NM_001100019), hcfc1b-002, si:ch211-59h6.1-201, fdxacb1-001, qk-002, and hspa5-201, were DE following BaP exposure in zebrafish embryos (Supplementary Table 4). Functional annotation with DAVID showed that LOC566022 and qk are involved in RNA binding and processing, Hspa5 is involved in stress response, and elovl4a is an integral membrane protein. Thus, expression changes in these genes may affect embryonic development.
Alternative Exon Usage in 3.3 hpf Zebrafish Embryos After BaP Exposure
To study BaP effects on alternative splicing in 3.3 hpf zebrafish embryos, DEXseq analysis was performed on the RNA-Seq data. In total, 67 exons were DE following BaP exposure (Supplementary Table 5). Expression was up- and down-regulated in 54 and 13 exons in the BaP samples when compared with the controls, respectively. These exons correspond to 51 unique genes, and DAVID annotation on these genes revealed that they were enriched in the cell morphogenesis and chromosome condensation pathways. DEU genes involved in these pathways include als2a, cep70, and mycbp2.
Differential Gene Expression in 96 hpf Zebrafish Larvae After BaP Exposure
Constitutively, our analysis found that gene expression was vastly different between 3.3 and 96 hpf zebrafish (data not shown). The constitutive changes of many metabolic and developmental genes identified by RNA-Seq are consistent with the changes in our qPCR results from zebrafish samples collected at the same time-points (Supplementary Table 3) (Corrales et al., 2014b; Fang et al., 2013b).
In 96 hpf larvae, DE analysis with EdgeR revealed that 446 and 484 genes were significantly up- and downregulated, respectively, by BaP exposure (Supplementary Table 6). The scatter plot of gene expression (log(read counts per million) (logCPM)) versus fold change (log(fold change) (logFC)) is shown in Figure 2A. PCA analysis indicated that the first principal component (90.7%) separates the 96 hpf control and BaP samples into the 2 sides of x = 0, indicating that the 2 groups are very different. The second component (7.8%) analysis showed that there are small divergences between individual samples (Fig. 2C). Expression changes of cyb1b1, gstp1, sult6b1, and cyp3a65 were confirmed by qPCR (Table 1) (Corrales et al., 2014b).
FIG. 2.

BaP induced DE of genes and transcripts in zebrafish larvae. Smear plots show relative expression of genes (A) or transcripts (B) in BaP-treated zebrafish larvae compared with control at 96 hpf. X-axis is the log2 value of read counts per million (CPM). Y-axis is log2 fold change (FC). The blue horizontal lines indicate 2- or −2-fold. Black dots represent non-significant genes/transcripts, whereas red dots indicate significant DE genes/transcripts (P < .05). (C) PCA was performed on the RNA-Seq data from 96 hpf zebrafish samples. The percent variability attributed to the first 2 principal components is displayed on the X and Y-axes. Full color version available online
TABLE 1.
DE genes in 96 hpf larvae confirmed by qPCR
| Symbol | Fold change (RNA-Seq)a | Fold change (qPCR) |
|---|---|---|
| Gstp1 | 2.84 | 2.03b |
| Cyp1b1 | 11.85 | 15.59b |
| Cyp3a65 | 2.75 | 2.94c |
| Sult6b1 | 3.56 | 3.73c |
| Gstal | 2.00 | 1.90 |
aFold change refers to gene expression in the 96 hpf BaP-treated samples compared with control samples.
bCited from Corrales et al. (2014b) (n = 3).
cP < 0.05 by qPCR (n = 3).
We also performed DE analysis at the transcript level and found that 739 transcripts were DE (Supplementary Table 6). Of these DE transcripts, 386 were up-regulated and 353 were downregulated. The scatter plot of transcript expression (logCPM) versus fold change (logFC) is shown in Figure 2B.
In total, 1153 unique genes were altered in expression either at the gene or transcript level, and these genes were designated as DE genes. The Diseases and Bio Functions analysis by IPA on DE genes predicted that disease pathways including organismal death, bleeding, congenital heart diseases, growth failure, and abnormal morphology of head were in an activated state (Table 2 and Supplementary Table 7). BaP may inhibit the activities of transforming growth factor (tgf) beta, bone morphogenetic protein 2 (bmp2), and growth differentiation factor 2 (gdf2), leading to downregulation of gene expression and activation of organismal death (Fig. 3). In contrast, pathways including neuritogenesis, fertility, learning, cognition, and size of body were deactivated by BaP (Table 2 and Supplementary Table 7). Representative pathways including neuritogenesis, fertility, atrial septal defect, and bleeding are shown in Figure 4. These predictions are consistent with our observations in BaP-exposed zebrafish that manifest increased mortality, delayed hatching, reduced body length, cardiac abnormalities, and head deformity (Supplementary Fig. 1) (Corrales et al., 2014a, b).
TABLE 2.
Predicted activation or suppression of functions and disease pathways in 96 hpf larvae by BaP
| Category | Diseases or functionsa | P-value | Predicted activation state | Activation z-score | Number of molecules |
|---|---|---|---|---|---|
| Organismal survival | Organismal death | 7.67E−20 | Increased | 5.241 | 212 |
| Drug metabolism | Conjugation of glutathione | 9.14E−09 | Increased | 2.973 | 9 |
| Organismal injury and abnormalities | Bleeding | 8.84E−08 | Increased | 2.691 | 44 |
| Congenital heart anomaly | Congenital heart disease | 1.73E−01 | Increased | 2.439 | 10 |
| Developmental disorder | Growth failure | 4.50E−04 | Increased | 2.283 | 48 |
| Organismal development | Abnormal morphology of head | 9.93E−11 | Increased | 2.228 | 82 |
| Liver necrosis/cell death | Cell death of liver cells | 1.00E00 | Increased | 2.201 | 7 |
| Tissue morphology | Abnormal morphology of embryonic tissue | 2.27E−04 | Increased | 2.121 | 46 |
| Cardiovascular disease | Atrial septal defect | 1.84E−04 | Increased | 2.000 | 7 |
| Cardiac dilation | Dilation of left ventricle | 2.16E−02 | Increased | 2.000 | 5 |
| Tissue morphology | Quantity of cells | 4.61E−07 | Decreased | −2.091 | 127 |
| Tissue development | Neuritogenesis | 6.29E−08 | Decreased | −2.172 | 49 |
| Tissue development | Adhesion of blood platelets | 3.22E−04 | Decreased | −2.236 | 8 |
| Nervous system development and function | Long-term potentiation of synapse | 6.22E−05 | Decreased | −2.312 | 17 |
| Cellular development | Differentiation of cells | 1.02E−07 | Decreased | −2.556 | 143 |
| Reproductive system development and function | Fertility | 3.24E−04 | Decreased | −2.558 | 31 |
| Hepatocellular carcinoma | Incidence of hepatocellular carcinoma | 1.51E−03 | Decreased | −2.619 | 7 |
| Tissue development | Synaptogenesis | 9.63E−08 | Decreased | −2.801 | 24 |
| Behavior | Learning | 3.64E−05 | Decreased | −2.928 | 35 |
| Behavior | Cognition | 5.32E−05 | Decreased | −2.969 | 36 |
| Gene expression | Transactivation of RNA | 3.08E−05 | Decreased | −3.339 | 48 |
| Organismal development | Size of body | 6.47E−08 | Decreased | −3.757 | 78 |
aDE genes were analyzed by the Diseases and Bio Functions module in IPA, which predicts activation or suppression of biological processes based on gene expression results.
FIG. 3.

Predicted mechanisms by which BaP leads to activation of organismal death. IPA on gene expression results from 96 hpf zebrafish predicted that early life BaP exposure activated organismal death via transforming growth factor beta (tgf beta; A), bone morphogenetic protein 2 (bmp2; B), and growth differentiation factor 2 (gdf2; C). Red or green indicates genes were up- or down-regulated by BaP, respectively. Orange or blue indicates pathways or interactions that were predicted to be activated or deactivated, respectively, by BaP. Yellow lines indicate where our data were inconsistent with IPA predictions. Full color version available online
FIG. 4.

Predicted mechanisms by which BaP leads to inhibited neuritogenesis, reduced body size, and cardiovascular defects. IPA on gene expression results from 96 hpf zebrafish larvae predicted that early life BaP exposure inhibited neuritogenesis via transforming growth factor beta-1 (tgfb1) (A) and reduced the size of body via apolipoprotein E (apoe) (B). BaP was predicted to activate the pathways of atrial septal defect (C) and bleeding (D). Full color version available online
At the molecular level, IPA analysis revealed that BaP altered many canonical pathways (Table 3 and Supplementary Table 7), including the aryl hydrocarbon receptor (AHR) signaling (Fig. 5), which is a signature pathway for BaP exposure. The interaction between BaP and AHR upregulated the expression of genes including cyp1a1, cyp1a2, cyp1b1, cyp3a4, gsta1, gsta5, and NAD(P)H dehydrogenase, quinone 1 (nqo1). The DE genes involved in the AHR signaling are listed in Table 4. BaP also affected xenobiotic metabolism signaling (Supplementary Fig. 2) and NRF2-mediated oxidative stress response (Supplementary Fig. 3).
TABLE 3.
Top 20 most significantly altered canonical pathways in 96 hpf larvae by BaP
| Ingenuity canonical pathwaysa | −log (P-value) | Ratio (%)b |
|---|---|---|
| Xenobiotic metabolism signaling | 11 | 12.8 |
| NRF2-mediated oxidative stress response | 10.5 | 14.9 |
| Glutathione-mediated detoxification | 8.64 | 25.0 |
| Superpathway of melatonin degradation | 7.48 | 17.3 |
| AHR signaling | 7.23 | 12.3 |
| Melatonin degradation I | 7.06 | 19.7 |
| PXR/RXR activation | 6.83 | 15.2 |
| Clathrin-mediated endocytosis signaling | 5.2 | 10.6 |
| Epithelial adherens junction signaling | 5.04 | 11.7 |
| LPS/IL-1 mediated inhibition of RXR function | 5.0 | 9.4 |
| The visual cycle | 4.99 | 21.4 |
| Leukocyte extravasation signaling | 4.74 | 10.0 |
| Actin cytoskeleton signaling | 4.72 | 9.1 |
| Tyrosine degradation I | 4.56 | 26.7 |
| Estrogen biosynthesis | 4.17 | 16.3 |
| TR/RXR activation | 3.49 | 10.1 |
| Sertoli cell-sertoli cell junction signaling | 3.44 | 8.6 |
| FAK signaling | 3.4 | 10.4 |
| eNOS signaling | 3.39 | 9.0 |
| Signaling by Rho family GTPases | 3.22 | 7.4 |
aDE genes were analyzed by the Canonical Pathways module in IPA, which identifies the impacted molecular pathways based on the uploaded gene list.
bPercent of genes in the pathway that were changed in expression.
FIG. 5.

BaP effects on the expression of BaP marker genes and genes involved in the AHR signaling pathway. IPA revealed that BaP exposure in zebrafish during early development altered the expression of known marker genes of BaP exposure, including cyp1a1, cyp1a2, cyp1b1, and nqo1. AHR was predicted to be activated by BaP and influence the expression of AHR-responsive genes, including cyp1a1, cyp1a2, cyp1b1, cyp3a4, gsta1, gsta5, and nqo1. Full color version available online
TABLE 4.
DE genes in the AHR signaling pathways affected by BaP treatment
| Symbol | Transcript | Fold changea | FDR |
|---|---|---|---|
| cyp1a | cytochrome P450, family 1, subfamily A, polypeptide 1 | 47.82b,c | 3.49E−145 |
| cyp1b1 | cytochrome P450, family 1, subfamily B, polypeptide 1 | 11.85b,c | 5.09E−31 |
| dct | dopachrome tautomerase | 2.39b,c | 1.18E−06 |
| gsto1 | glutathione S-transferase omega 1 | 2.08b,c | 2.10E−02 |
| gsto2 | glutathione S-transferase omega 2 | 2.20b,c | 1.75E−06 |
| gstp1 | glutathione S-transferase pi 1 | 2.84b,c | 9.30E−14 |
| gstal | glutathione S-transferase, alpha-like; zgc:173962; zgc:173961 | 2.00b,c | 5.75E−05 |
| zgc:173961 | glutathione S-transferase, alpha-like; zgc:173962; zgc:173961 | 1.81b,c | 9.82E−03 |
| nqo1 | NAD(P)H dehydrogenase, quinone 1 | 1.57b,c | 2.98E−02 |
| gstt1 | glutathione S-transferase theta 1 | 1.89b | 1.45E−02 |
| aldh1a1 | aldehyde dehydrogenase 1 family, member A1 | 1.74c | 9.09E−03 |
| gstt2/gstt2b(zgc:66350; zgc:66382; zgc:66430) | glutathione S-transferase theta 2 | 1.75b,c | 4.46E−04 |
| ncoa2 | nuclear receptor coactivator 2 | −1.81b,c | 2.54E−02 |
| nfia | nuclear factor I/A | −1.98b | 4.65E−02 |
| nfixb | nuclear factor I/X (CCAAT-binding transcription factor) | −2.52b,c | 1.82E−02 |
| rxrb | retinoid X receptor, beta | −3.14c | 3.11E−02 |
| nfe2l2b | nuclear factor, erythroid 2-like 2 | 2.71b,c | 3.14E−03 |
aFold change refers to expression in the BaP-treated samples compared with control samples.
bExpression was changed at the gene level.
cExpression was changed at the transcript level.
Moreover, IPA analysis predicted activation or inhibition of important upstream regulators by BaP, including transcription factors, ligand-dependent nuclear receptors, enzymes, and miRNAs, even though these regulators may not necessarily be altered by BaP at the transcription level (Table 5 and Supplementary Table 7). The predictive effects of BaP on the upstream gene regulators may be responsible for the actual expression changes of the genes identified in 96 hpf zebrafish larvae. These results also predict that the BaP marker genes, including cyp1a1, glutathione S-transferases (gsta, gaso, gstp, gstt), nqo1, and UDP-glucuronosyltransferase 1A (ugt1a6, ugt1a9) are subjected to multiple layers of regulation (Supplementary Table 7). Representative genes altered by the predicted upstream regulators are shown in Figure 6.
TABLE 5.
Predicted activation or suppression of upstream regulators in 96 hpf larvae by BaP
| Upstream regulatora | Fold changeb | Molecule type | Predicted activation state | Activation z-score | P-value of overlap |
|---|---|---|---|---|---|
| NFE2L2b; NFE2L2a | 2.71; 10.15 | Transcription regulator | Activated | 3.025 | 3.39E−10 |
| HNF1A | – | Transcription regulator | Activated | 2.360 | 6.49E−05 |
| PPARGC1A | –2.56 | Transcription regulator | Activated | 3.151 | 6.79E−05 |
| SMAD7 | – | Transcription regulator | Activated | 3.053 | 2.73E−04 |
| HNF4A | – | Transcription regulator | Activated | 2.250 | 3.41E−04 |
| SPDEF | – | Transcription regulator | Activated | 2.058 | 4.78E−04 |
| HOXA9 | – | Transcription regulator | Activated | 2.000 | 3.18E−02 |
| ETS2 | – | Transcription regulator | Activated | 2.190 | 4.74E−02 |
| AHR | – | Ligand-dependent nuclear receptor | Activated | 2.865 | 2.00E−10 |
| RXRA | – | Ligand-dependent nuclear receptor | Activated | 2.964 | 8.58E−04 |
| NR5A2 | – | Ligand-dependent nuclear receptor | Activated | 2.906 | 1.29E−03 |
| ESRRA | – | Ligand-dependent nuclear receptor | Activated | 2.335 | 7.43E−03 |
| PPARG | – | Ligand-dependent nuclear receptor | Activated | 2.324 | 7.92E−03 |
| PXR ligand-PXR-Retinoic acid-RXRα | – | Complex | Activated | 3.095 | 7.38E−07 |
| ACOX1 | 1.91 | Enzyme | Activated | 2.035 | 1.51E−08 |
| MGEA5 | – | Enzyme | Activated | 2.183 | 1.39E−03 |
| miR-29b-3p (and other miRNAs w/seed AGCACCA) | – | Mature microRNA | Activated | 2.403 | 1.50E−02 |
| let-7 | – | microRNA | Activated | 2.739 | 3.11E−02 |
| APOE | – | Transporter | Inhibited | −2.441 | 6.22E−03 |
| TGFB1 | – | Growth factor | Inhibited | −3.260 | 8.81E−13 |
| BMP2 | – | Growth factor | Inhibited | −2.138 | 3.22E−04 |
| GDF2 | – | Growth factor | Inhibited | −2.138 | 8.19E−03 |
| CTGF | – | Growth factor | Inhibited | −2.395 | 4.45E−02 |
| ALDH2 | – | Enzyme | Inhibited | −2.433 | 4.90E−05 |
| GNA12 | – | Enzyme | Inhibited | −2.138 | 2.54E−03 |
| Tgf beta | – | Group | Inhibited | −2.263 | 1.85E−03 |
| ADRB | – | Group | Inhibited | −2.180 | 6.49E−03 |
aDE genes were analyzed by the Upstream Regulator module in IPA, which predicts upstream molecules that may be responsible for the observed gene expression changes.
bFold change refers to expression in the BaP-treated samples compared with control samples.
FIG. 6.

Upstream regulators that were predicted to be activated by BaP. IPA predicted that BaP activated hepatocyte nuclear factor 1-alpha (hnf1a) (A), nuclear factor, erythroid 2-like 2 (nfe2l2; B), peroxisome proliferator-activated receptor gamma, coactivator 1 alpha (ppargc1a) (C), and PXR ligand-PXR-Retinoic acid RXRα complex (D) in 96 hpf zebrafish larvae, which may be causing the observed gene expression changes. Full color version available online.
Network Analysis by IPA indicated that BaP inhibited the Notch signaling pathway, which is related to organismal survival, cancer, and hematological disease (Supplementary Fig. 4A and Supplementary Table 7). In contrast, BaP activated the glutathione pathway, which is involved in drug metabolism, glutathione depletion in liver, and protein synthesis (Supplementary Fig. 4B and Supplementary Table 7).
Alternative Exon Usage in 96 hpf Zebrafish Larvae After BaP Exposure
For alternative splicing, further analysis by DEXseq identified 176 exons that were differentially used/expressed in 96 hpf larvae (Supplementary Table 8). Expression was up-regulated in 35 exons and downregulated in 141 exons in the BaP samples when compared with the controls. These exons correspond to 159 different genes, which are designated as DEU genes. DAVID annotation identified 13 DEU genes that are involved in development (Table 6). Representative developmental genes with DEU, including llgl2 (skin development), myhb (chordate development), tnc (neuron and mesenchyme development), and skiv2i2 (fin development), are shown in Figure 7. IPA analysis of the DEU genes revealed that many canonical, functional, and disease pathways were altered, including melatonin degradation, xenobiotic metabolism signaling, hepatic fibrosis, and heart septal defect pathways (Table 7 and Supplementary Table 9). Notably, many AHR-responsive genes had DEU after BaP treatment (Fig. 8A). The genes involved in development of body axis were also affected in splicing by BaP (Fig. 8B). Furthermore, Network Analysis on DEU genes by IPA generated gene networks that are related to cardiovascular system development and function, embryonic development, organ development, connective tissue disorders, and organismal injury and abnormalities (Supplementary Table 9).
TABLE 6.
Developmental genes that exert DEU following BaP treatment in 96 hpf zebrafish larvae
| Symbol | Gene name | Exon(s) | Fold changea | FDR | Roles in developmentb |
|---|---|---|---|---|---|
| naa35 | MAK10 homolog, N(alpha)-acetyltransferase 35, NatC auxiliary subunit | 8 | −1.58 | 0.027 | Vasculature and chordate embryonic development |
| rbfox1 | RNA binding protein, fox-1 homolog (ataxin 2-binding protein 1) | 21 | −1.50 | 0.018 | Diencephalon, limbic system, hypothalamus, forebrain |
| cad | Carbamoyl-phosphate synthetase 2, aspartate Transcarbamylase, and dihydroorotase | 1 | 2.01 | 0.047 | Eye, sensory organ |
| lama5 | Laminin, alpha 5 | 36 | −1.85 | 0.004 | Fin |
| llgl2 | Lethal giant larvae homolog 2 | 29 | −1.64 | 0.030 | Skin |
| notch2 | Notch homolog 2 | 14 | −2.09 | 0.020 | Liver |
| lamb2 | Laminin, beta 2 (similar to LOC494988 protein) | 34,36 | −1.79; −2.43 | 0.028; 0.046 | Skeletal muscle |
| myhz1.1 | Myosin, heavy polypeptide 1.1, skeletal muscle | 41 | −3.78 | 0.035 | Chordate embryonic development |
| myhb | myosin, heavy chain b | 37,38 | −2.00; −2.74 | 0.007; 0.015 | Chordate embryonic development |
| tnc | Tenascin C | 29 | −1.56 | 0.005 | Neuron and mesenchyme |
| spna2 | Spectrin alpha 2 | 12 | −1.89 | 0.024 | Neuron |
| skiv2l2 | Superkiller viralicidic activity 2-like 2 | 3 | −1.64 | 0.013 | Fin |
| ttnb | Titin b | 33 | −1.78 | 0.016 | Striated muscle |
aDEU analysis was performed with R package DEXSeq to identify changes in the relative usage of each exon following BaP exposure. Fold change is the expression of an individual exon in the BaP samples compared with its expression in the control samples.
bDevelopmental genes were identified by functional annotation using the DAVID.
FIG. 7.

DEU in developmental genes. DEXseq analysis on RNA-Seq data revealed that early life BaP exposure significantly altered exon usage of llgl2 (A), myhb (B), Tnc (C), and skiv2l2 (D) in 96 hpf zebrafish larvae. The y-axis represents normalized read counts of exons (exon usage), and the x-axis shows individual exons within a gene. The bars below the x-axis represent exons, and the lines between the bars represent introns. The numbers at the bottom are genomic locations of the gene. Exons highlighted in purple had a FDR < 0.05 in the DEU analysis of BaP and control samples. Red arrows indicate the significant DEU exons that had a FDR < 0.05 and an absolute fold change > 1.5. The fold change is the individual exon expression in BaP samples verses the control expression. Full color version available online.
TABLE 7.
Top 20 most significant canonical pathways identified from the DEU genes in 96 hpf zebrafish larvae exposed to BaP
| Ingenuity canonical pathwaysa | −log (P-value) | Ratio (%)b |
|---|---|---|
| Actin cytoskeleton signaling | 4.45 | 5.37 |
| Thyroid hormone metabolism II (via conjugation and/or degradation) | 3.88 | 9.43 |
| EIF2 signaling | 3.79 | 5.47 |
| ILK signaling | 3.73 | 5.37 |
| Hepatic fibrosis / hepatic stellate cell activation | 3.45 | 5.81 |
| Serotonin degradation | 3.42 | 7.69 |
| Epithelial adherens junction signaling | 3.29 | 5.84 |
| Atherosclerosis signaling | 3.16 | 5.76 |
| Agranulocyte adhesion and diapedesis | 3.15 | 5.21 |
| Intrinsic prothrombin activation pathway | 3.04 | 10.80 |
| Melatonin degradation I | 2.77 | 7.58 |
| Regulation of EIF4 and P70S6K signaling | 2.62 | 4.57 |
| Superpathway of melatonin degradation | 2.6 | 6.17 |
| RhoA signaling | 2.48 | 5.47 |
| Xenobiotic metabolism signaling | 2.41 | 3.82 |
| Axonal guidance signaling | 2.05 | 2.87 |
| Glycogen degradation II | 1.99 | 12.50 |
| Circadian rhythm signaling | 1.8 | 7.89 |
| Retinol biosynthesis | 1.76 | 6.67 |
| Protein kinase A signaling | 1.74 | 2.93 |
aDEU genes induced by BaP were analyzed by the Canonical Pathways module in IPA, which identifies the impacted molecular pathways based on the uploaded gene list.
bPercent of genes in the pathway that were changed in expression.
FIG. 8.

IPA identified pathways affected by abnormal alternative splicing. IPA analysis on genes with DEU revealed that the AHR signaling (A) and development of body axis (B) pathways were affected by BaP exposure in 96 hpf zebrafish larvae.
Overlap of DE and DEU Genes
We compared the genes affected by altered splicing and the genes that were DE in the 96 hpf samples and found that 71 (44.7%) of DEU genes overlapped with DE genes (Fig. 9A and Supplementary Table 10). This indicates that BaP-induced alterations in gene expression and splicing may affect the same signaling pathways. IPA analysis on the 71 overlap ping genes indicated that they were enriched in the canonical pathways, including melatonin degradation and xenobiotic metabolism signaling (Fig. 9B and Supplementary Table 10). IPA predicted that the top affected biological functions included drug metabolism, behavior, embryonic development, and development and function of the nervous, reproductive, and cardiovascular systems (Fig. 9C and Supplementary Table 10). The predicted top diseases included connective tissue disorders, cancer, hepatic system disease, organismal injury and abnormalities, and metabolic disease (Fig. 9D and Supplementary Table 10). Interestingly, several AHR-responsive genes, including col5A2, col6A1, col11A1, ugt1a6, and ugt1a1 were affected in gene expression and splicing (Fig. 9E). The distribution of DE genes and DEU genes across chromosomes is shown in Figure 9F. Chromosomes 2, 5, 15, and 16 had the highest percentage of DE genes, whereas chromosomes 9 and 25 had the greatest number of DEU genes.
FIG. 9.

Overlap of DEU and differential expressed (DE) genes. Venn-diagrams show the overlap of genes affected by expression and/or splicing between BaP and control zebrafish larvae (96 hpf; A). IPA was used to identify the canonical pathways (B), top functions (C), and top disease pathways (D) that are affected by BaP at splicing and expression levels. In panel B, bars represent the percentage of overlaping genes (in black) within a pathway. Dots indicate the negative log10 of the P-values. Larger −log(P-value) means that the pathway is more significant. The threshold for significance is marked in the graph as a dotted-line at 1.3 (−log(0.05)). In panels C and D, bars represent −log(P-value), and dotted-lines indicate the significance threshold at 1.3 (−log(0.05)). Eight AHR-responsive genes were affected by splicing and expression with BaP treatment (E). Distribution of DE and DEU genes across zebrafish chromosomes is shown in (F). Full color version available online.
DISCUSSION
BaP is a ubiquitous organic pollutant that adversely affects embryonic development, and early life BaP exposure has acute, long-term, and transgenerational effects on the offspring (Corrales et al., 2014a; Fang et al., 2013a; Wang et al., 2010). BaP exerts its toxic effects by disrupting normal gene expression, and early studies have identified biomarker genes, e.g., cyp1a, cyp1b, and cyp1c, that are inducible after BaP exposure (Wang et al., 2006). Recent studies have applied microarray technology to simultaneously examine the expression of thousands of genes in BaP-treated cells/animals and have identified more BaP-sensitive genes during tumorigenesis (Hockley et al., 2009; Labib et al., 2013). More recently, RNA-Seq technology has been developed to quantitate the expression of all transcripts and their variants in a more sensitive and accurate manner than microarray (van Delft et al., 2012). Using RNA-Seq, a recent study detected 20% more DE genes and pathways than by microarray in BaP-treated HepG2 cells (van Delft et al., 2012). Microarray studies of transcriptional responses to other PAHs have been done in developing zebrafish (Goodale et al., 2013). In addition, Jayasundara et al. (2015) recently described effects of BaP exposure alone and in the presence of fluoranthene on cardiac function and found that toxicity is dependent on the AHR2 and the most significant changes in gene expression were Ca2+ and muscle contraction genes. However, transcriptomic profiling has not been done in BaP-exposed embryos by RNA-Seq, which is limiting our understanding of BaP-induced developmental toxicities. In this study, with Illumina mRNA-Seq, the zebrafish transcriptome at the gene, transcript variant, and exon levels were quantitated, and novel genes and biological processes that were compromised by parental and continued embryonic waterborne BaP exposure in zebrafish offspring were identified. These altered genes and pathways may inform the mechanisms that mediate the BaP effects on immediate and long-term phenotypic changes.
Zebrafish usually spawn every 1–6 days, and thus parental zebrafish were exposed to BaP for at least 7 days before egg collection to cover their spermatogenesis and oogenesis periods. Embryos were raised in BaP or control water until 3.3 hpf, which is the mid-blastula stage in zebrafish (Kimmel et al., 1995). This stage marks the initiation of the zygote genome activation; i.e., transcription (Aanes et al., 2011). At 3.3 hpf, BaP exposure only altered the expression of 4 genes and 7 transcripts including a stress response gene hspa5 and 2 RNA processing genes LOC566022 and qk. The conventional biomarkers for BaP exposure were not induced at this time-point, which is consistent with our previous qPCR results that found low and unaffected expression of BaP marker genes cyp1b1, gstp1, and nqo1 in 3.3 hpf embryos exposed to BaP (Corrales et al., 2014b). The fact that very few genes were affected in 3.3 hpf embryos indicates that parental BaP exposure had little effect on the loading of maternal RNAs into oocyte. At 3.3 hpf, zygotic transcription has just begun, and many genes may be silenced at this stage and not be easily altered in expression. Our previous studies did not find significant changes in global DNA methylation levels in 3.3 hpf zebrafish embryos by BaP exposure (Corrales et al., 2014b; Fang et al., 2013a), which may contribute to BaP not eliciting gene expression changes at this stage.
Even though there were few transcriptional changes in 3.3 hpf embryos by BaP, we observed abnormal alternative splicing in 51 genes, indicating that splicing of these genes is sensitive to acute exposure to BaP or BaP metabolites. Among these DEU genes, mycbp2, als2a, and cep70 are related to cell morphogenesis. In particular, mycbp2 is involved in axonogenesis and neuron development, als2a regulates muscle development, and cep70 determines left/right symmetry (DAVID functional annotation). Therefore, these splicing changes during early embryogenesis may adversely influence embryo morphogenesis.
Following fertilization to 6 hpf, genomic DNA undergoes rapid genome-wide demethylation and re-methylation in zebrafish (Jiang et al., 2013; Lee et al., 2015; Potok et al., 2013), which is a process vulnerable to environmental stressors. Our previous study found that the global DNA methylation levels are decreased in 96 hpf zebrafish larvae following waterborne BaP exposure in offspring alone (from ∼2 to 96 hpf) or in both parents and offspring (same as this study) (Corrales et al., 2014b; Fang et al., 2013a). Here, we found altered expression of several DNA methylation enzymes, including glycine N-methyltransferase (gnmt) and TET methylcytosine dioxygenases (tet1 and tet3). GNMT removes the methyl group of methyl donor S-adenosylmethionine and thus reduces the methylation capacity of methyltransferases including DNMTs. Consistent with our previous reports, BaP increased gnmt mRNA expression (Fang et al., 2010a, b), which may contribute to the BaP-induced global demethylation in zebrafish larvae. TETs facilitate the DNA demethylation by catalyzing the conversion of 5-methylcytosine to 5-hydroxymethylcytosine (Inoue and Zhang, 2011). We found that BaP down-regulated the expression of tet1 and tet3, which may modulate methylation at specific CpG sites.
It is known that altered DNA methylation patterns lead to abnormal gene expression, and indeed we detected many DE genes in 96 hpf zebrafish larvae. The classic BaP marker genes, e.g., cyp1a (41.9-fold), cyp1b1 (11.9-fold), cyp1c1 (8.17-fold), cyp1c2 (3.68-fold), were strongly induced by BaP via the AHR pathway (Fig. 5). Based on the gene expression changes, IPA predicted that many disease and functional pathways were either activated or deactivated, which were consistent with the developmental toxicities observed after BaP exposure. For instance, BaP activated the pathways, including organismal death, growth failure, congenital heart disease, bleeding, and abnormal morphology of head, and we have found increased mortality, delayed hatching, tube heart, cardiac edema, and head abnormality in BaP-exposed zebrafish larvae (Corrales et al., 2014b). BaP also deactivated the pathways for size of body, neuritogenesis, learning and cognition, and fertility, which are consistent with studies that find BaP exposure at a young age to be linked to shortened gestation (Choi et al., 2008), decreased body length (Corrales et al., 2014b), impaired brain development (Perera et al., 2012), and decreased fertility in humans and animals (Corrales et al., 2014b; Perera et al., 2005). Therefore, our data can be informative in predicting adverse outcomes following BaP exposure and identifying genes that may be responsible for these abnormalities. Further studies can be devoted to the causal relationship between the DE genes and phenotypic changes. Some DE genes may be causally related to the BaP exposure and effects, whereas others may be a secondary consequence of the BaP-induced deformities.
Consistent with previous findings on the mechanisms of BaP toxicity, we found that BaP impaired the canonical pathways including xenobiotic metabolism signaling (Wang et al., 2006), Nrf2-mediated oxidative stress response (Niestroy et al., 2011), glutathione-mediated detoxification (Kirby et al., 1990), AHR signaling (Okey et al., 1994), PXR/RXR activation (Luckert et al., 2013), and estrogen biosynthesis pathways (Kummer et al., 2008). These results indicate that the conventional pathways associated with BaP exposure in other organisms/tissues such as in mammals are conserved in BaP-exposed zebrafish larvae.
Our results also provided new insights on BaP mechanisms by identifying new genes and pathways that were influenced by BaP. For example, this is the first study to find that the melatonin degradation pathway was activated by BaP, implying that BaP decreases the endogenous melatonin level. Administration of melatonin suppresses BaP-induced carcinogenesis (Murawska-Cialowicz et al., 2011); therefore, reduced melatonin concentrations by BaP may be an additional mechanism contributing to BaP toxicity. Another example is apolipoprotein E (ApoE). A previous study found that compared with wild-type mice, BaP enhanced lipid peroxidation-induced DNA damage and caused larger atherosclerotic plaques in ApoE knockout mice, who had deficiency in regulating cholesterol metabolism (Meir and Leitersdorf, 2004). Here, in zebrafish larvae, ApoE activity was predicted to be suppressed based on gene expression results; moreover, BaP decreased the expression of apoe receptor (apoer) by −3.33-fold. Therefore, like in ApoE knockout mice, BaP may exert cardiovascular toxicity in zebrafish larvae via reduced ApoE activity and ApoE receptor level. Further studies are needed to explore the BaP effects on the melatonin and ApoE pathways.
To our knowledge, this is the first study to find that the Notch signaling pathway (notch1b, notch2, notch3) is suppressed by BaP during development (Supplementary Fig. 4A). The impacts of this on embryonic development may be substantial because Notch signaling plays a very important role in embryogenesis and development of the nervous, cardiac, and endocrine systems (Bolos et al., 2007). It is also interesting that BaP inhibited the expression of several collagen genes (col4a1, col4a2, col6a1, col6a3, col11a1, col27a1). Collagens are components of the extracellular matrix that are essential to form primary embryonic tissues (von der Mark et al., 1976). IPA analysis predicted growth failure, abnormal morphology of embryonic tissue, connective tissue disorder, and tumor development in zebrafish larvae, in part due to reduced expression of collagen genes.
IPA analysis also predicted upstream regulators that were modulated by BaP and could cause the observed changes in the expression of downstream genes. In particular, our data indicated that the up-regulation of conventional marker genes of BaP, including cyp1, gst, nqo1, and ugt, may be regulated by multiple upstream regulators. These results provide new insights into the complex and interconnected gene networks by which BaP modulates gene expression and bioprocesses. The activation of detoxification enzymes by BaP may protect the larvae against BaP toxicities. However, an imbalance in this intrinsic gene network of detoxifying enzymes must exist leading to the adverse health effects in 96 hpf larvae. It is worth noting that the zebrafish DE genes were converted to human orthologs before being analyzed with the IPA database, which is built from the knowledge of mammalian models. Thus, the effects of upstream regulators on gene expression need further confirmation in the zebrafish model.
Alternative splicing is the main mechanism for generation of transcript isoforms, and DEU is important for complex genomes to control gene function (Anders et al., 2012). It is known that BaP causes abnormal alternative splicing of several genes in HeLa cells (Yan et al., 2010). In this study, we identified changes in exon usage of 51 and 159 genes in BaP-exposed 3.3 and 96 hpf zebrafish, respectively. At 96 hpf, similar to DE genes, the canonical pathways, including melatonin degradation I and xenobiotic metabolism signaling, were significantly affected for DEU genes. Many AHR-responsive genes and developmental genes had DEU following BaP exposure. For instance, BaP affected exon usage in myosin heavy chain b (myhb) and myosin, heavy polypeptide 1.1, skeletal muscle (myhz1.1), which are fast skeletal muscles involved in somite specification and chordate embryonic development. The abnormal splicing in these genes may be implicated in BaP-induced growth deficits. In addition, 71 genes were altered both in expression and splicing levels by BaP. These genes are predominantly involved in the pathways closely related to the phenotypic changes induced by BaP. Several collagen genes and metabolic enzymes were affected by expression and splicing, indicating that they may have abnormal function or activity in the BaP-exposed larvae. Current knowledge on the biological significance of alternative splicing in these DEU genes is still limited; therefore, further investigation is needed to confirm the DEU changes by other assays and to illustrate if DEU affects their function.
DNA methylation may play a role in regulating constitutive changes in gene expression. We found that the transcription profiles between 3.3 and 96 hpf control zebrafish were very different, and when we compared the methylation and gene expression changes between 3.3 and 96 hpf, we noticed that promoter DNA methylation was inversely associated with gene expression in dazl, vasa, cdh2, bdnf, cdkn1a, and c-fos (Table 8) (Corrales et al., 2014b; Fang et al., 2013b). Alternatively, in BaP exposed 96 hpf larvae, there was gene induction but hypermethylation of promoters of the DE genes nqo1 (+28.1%), gstp1 (+25.7%), and cyp1b1 (+24.7%) (Corrales et al., 2014b). Further studies are needed to confirm the causal relationship between promoter methylation and expression in these genes, and whole-genome methylation analyses will be useful to explore the intricate interactions between methylome and transcriptome both during normal embryogenesis and following BaP exposure.
TABLE 8.
Gene expression versus DNA methylation changes during zebrafish development
| Gene symbol | Name | Methylation change | Location of methylation | qPCR | RNA-Seq |
|---|---|---|---|---|---|
| dazl | Deleted in azoospermia-like | 309.9a | Promoter | −132.0a | −333.3 |
| vasa | DEAD (Asp-Glu-Ala-Asp) box polypeptide 4 | 16.0b | Promoter | −454.3b | −184.7 |
| sox2 | Sex determining region Y-box 2 | −0.8a | 1st exon | 1070.0a | 288.9 |
| cdh2 | Cadherin-2 | −5.0a | Promoter | –c | 27.4 |
| bdnf | Brain-derived neurotrophic factor | −5.3a | Promoter | – | 5.5 |
| c-myca | V-Myc avian myelocytomatosis viral oncogene homolog alpha | −7.1b | 1st exon | 5.8b | 9.1 |
| cdkn1a | Cyclin-dependent kinase inhibitor 1A or p21 | −28.1a | Promoter | – | 25.2 |
| c-fos | FBJ murine osteosarcoma viral oncogene homolog | −30.4a | Promoter | 141.0a | 182.6 |
| nqo1 | NAD(P)H dehydrogenase quinone 1 | 122.0a | 1st exon | 4.4a | 7.1 |
| sox3 | Sex determining region Y-box 3 | 51.8a | 1st exon | 22.1a | 2.6 |
| cyp1b1 | Cytochrome P450, family 1, subfamily B, polypeptide 1 | 48.4a | Promoter | 28.8a | 5.1 |
| gstp1 | Glutathione S-transferase pi 1 | 30.8a | 1st exon | 1.8a | 1.8 |
| apc | Adenomatous polyposis coli | −0.3a | Promoter | – | −1.9 |
| brca1 | Breast cancer 1 | −1.4a | 1st exon | – | NSd |
| h-ras | Harvey rat sarcoma virus oncogene1 | −1.6a | Promoter | – | −1.6 |
| msh3 | Glutathione S-transferase pi 1 | −1.9a | Promoter | – | −6.0 |
| nos2b | Nitric oxide synthase b | −3.3a | Promoter | – | NS |
| drd2l | Dopamine receptor D2 like | −6.3a | Promoter | – | NS |
| p53 | Tumor protein 53 | −7.9a | Promoter | – | −2.2 |
aCited from Corrales et al. (2014a).
bCited from Fang et al. (2013b).
cData were not collected.
dChange is not statistically significant.
One limitation of the study is that only 2 biological replicates were sequenced for the 96 hpf samples. However, the expression changes of 5 DE genes were measured by qPCR with N = 3 biological replicates (Table 1) and many genes that are known to be affected in expression by BaP, including cyp1a, cyp1b, cyp1c, nqo1, gnmt, gst genes, etc were identified. While these confirmations add confidence to the RNASeq results, further studies can be done to validate expression changes of target genes by additional qPCR or Western blotting.
Overall, this is one of the first studies to comprehensively examine the effects of early life BaP exposure on the zebrafish transcriptome at early developmental stages. We show that BaP exposure alters gene expression and exon usage in zebrafish embryos and larvae, with more marked changes in the larval stage. These newly identified target genes, pathways, and gene networks provide a greater biological depth in understanding the mechanisms leading to BaP-related birth defects. In-depth functional studies are needed to further characterize these new findings.
SUPPLEMENTARY DATA
Supplementary data are available online at http://toxsci.oxfordjournals.org/.
FUNDING
National Institute of Environmental Health Sciences of the National Institutes of Health [grant numbers R21ES019940 and R03ES018962].
Supplementary Material
ACKNOWLEDGMENTS
We thank Frank Booc, Hallie Freyaldenhoven, Mallory White, Daniel Purdy, and Courtney Johnson for their critical role in assisting with fish husbandry, BaP exposure, and sample collection. We also thank Dr. Julia Gohlke (Univ. Alabama-Birmingham) for helpful comments on the manuscript.
REFERENCES
- Aanes H., Winata C. L., Lin C. H., Chen J. P., Srinivasan K. G., Lee S. G., Lim A. Y., Hajan H. S., Collas P., Bourque G., et al. (2011). Zebrafish mRNA sequencing deciphers novelties in transcriptome dynamics during maternal to zygotic transition. Genome Res. 21, 1328–1338. [DOI] [PMC free article] [PubMed] [Google Scholar]
- Ali S., Champagne D. L., Alia A., Richardson M. K. (2011). Large-scale analysis of acute ethanol exposure in zebrafish development: a critical time window and resilience. PLoS One 6, e20037. [DOI] [PMC free article] [PubMed] [Google Scholar]
- Anders S., Reyes A., Huber W. (2012). Detecting differential usage of exons from RNA-seq data. Genome Res. 22, 2008–2017. [DOI] [PMC free article] [PubMed] [Google Scholar]
- Blankenberg D., Von Kuster G., Coraor N., Ananda G., Lazarus R., Mangan M., Nekrutenko A., Taylor J. (2010). Galaxy: a web-based genome analysis tool for experimentalists. Curr. Protoc. Mol. Biol. Chapter 19, Unit 19.10.1–21. [DOI] [PMC free article] [PubMed] [Google Scholar]
- Bolos V., Grego-Bessa J., de la Pompa J. L. (2007). Notch signaling in development and cancer. Endoc. Rev. 28, 339–363. [DOI] [PubMed] [Google Scholar]
- Chen C., Tang Y., Jiang X., Qi Y., Cheng S., Qiu C., Peng B., Tu B. (2012). Early postnatal benzo(a)pyrene exposure in Sprague–Dawley rats causes persistent neurobehavioral impairments that emerge postnatally and continue into adolescence and adulthood. Toxicol. Sci. 125, 248–261. [DOI] [PubMed] [Google Scholar]
- Choi H., Rauh V., Garfinkel R., Tu Y., Perera F. P. (2008). Prenatal exposure to airborne polycyclic aromatic hydrocarbons and risk of intrauterine growth restriction. Environ. Health Perspect. 116, 658–665. [DOI] [PMC free article] [PubMed] [Google Scholar]
- Corrales J., Thornton C., White M., Willett K. L. (2014a). Multigenerational effects of benzo[a]pyrene exposure on survival and developmental deformities in zebrafish larvae. Aquat. Toxicol. 148, 16–26. [DOI] [PMC free article] [PubMed] [Google Scholar]
- Corrales J., Fang X., Thornton C., Mei W., Barbazuk W. B., Duke M., Scheffler B. E., Willett K. L. (2014b). Effects on specific promoter DNA methylation in zebrafish embryos and larvae following benzo[a]pyrene exposure. Comp. Biochem. Physiol. Toxicol. Pharmacol 163, 37–46. [DOI] [PMC free article] [PubMed] [Google Scholar]
- Duarte-Salles T., Mendez M. A., Meltzer H. M., Alexander J., Haugen M. (2013). Dietary benzo(a)pyrene intake during pregnancy and birth weight: associations modified by vitamin C intakes in the Norwegian Mother and Child Cohort Study (MoBa). Environ. Int. 60, 217–223. [DOI] [PubMed] [Google Scholar]
- Fang X., Dong W., Thornton C., Scheffler B., Willett K. L. (2010a). Benzo(a)pyrene induced glycine N-methyltransferase messenger RNA expression in Fundulus heteroclitus embryos. Mar. Environ. Res. 69(Suppl), S74–S76. [DOI] [PMC free article] [PubMed] [Google Scholar]
- Fang X., Dong W., Thornton C., Willett K. L. (2010b). Benzo[a]pyrene effects on glycine N-methyltransferase mRNA expression and enzyme activity in Fundulus heteroclitus embryos. Aquat. Toxicol. 98, 130–138. [DOI] [PMC free article] [PubMed] [Google Scholar]
- Fang X., Thornton C., Scheffler B. E., Willett K. L. (2013a). Benzo[a]pyrene decreases global and gene specific DNA methylation during zebrafish development. Environ. Toxicol. Pharmacol. 36, 40–50. [DOI] [PMC free article] [PubMed] [Google Scholar]
- Fang X., Corrales J., Thornton C., Scheffler B. E., Willett K. L. (2013b). Global and gene specific DNA methylation changes during zebrafish development. Comp. Biochem. Physiol. B Biochem. Mol. Biol. 166, 99–108. [DOI] [PMC free article] [PubMed] [Google Scholar]
- Fang X., Mei W., Barbazuk W. B., Rivkees S. A., Wendler C. C. (2014). Caffeine exposure alters cardiac gene expression in embryonic cardiomyocytes. Am. J. Physiol.. Regul. Integr. Comp. Physiol., 15, 1471–1487. [DOI] [PMC free article] [PubMed] [Google Scholar]
- Goodale B. C., Tilton S. C., Corvi M. M., Wilson G. R., Janszen D. B., Anderson K. A., Waters K. M., Tanguay R. L. (2013). Structurally distinct polycyclic aromatic hydrocarbons induce differential transcriptional responses in developing zebrafish. Toxicol. Appl. Pharmacol. 272, 656–670. [DOI] [PMC free article] [PubMed] [Google Scholar]
- Herbstman J. B., Tang D., Zhu D., Qu L., Sjodin A., Li Z., Camann D., Perera F. P. (2012). Prenatal exposure to polycyclic aromatic hydrocarbons, benzo[a]pyrene-DNA adducts, and genomic DNA methylation in cord blood. Environ. Health Perspect. 120, 733–738. [DOI] [PMC free article] [PubMed] [Google Scholar]
- Hockley S. L., Mathijs K., Staal Y. C., Brewer D., Giddings I., van Delft J. H., Phillips D. H. (2009). Interlaboratory and interplatform comparison of microarray gene expression analysis of HepG2 cells exposed to benzo(a)pyrene. Omics 13, 115–125. [DOI] [PubMed] [Google Scholar]
- Huang da W., Sherman B. T., Lempicki R. A. (2009). Systematic and integrative analysis of large gene lists using DAVID bioinformatics resources. Nat. Protoc. 4, 44–57. [DOI] [PubMed] [Google Scholar]
- Huang L., Gao D., Zhang Y., Wang C., Zuo Z. (2014). Exposure to low dose benzo[a]pyrene during early life stages causes symptoms similar to cardiac hypertrophy in adult zebrafish. J. Hazard. Mater. 276, 377–382. [DOI] [PubMed] [Google Scholar]
- Inoue A., Zhang Y. (2011). Replication-dependent loss of 5-hydroxymethylcytosine in mouse preimplantation embryos. Science 334, 194. [DOI] [PMC free article] [PubMed] [Google Scholar]
- Jayasundara N., Van Tiem Garner L., Meyer J. N., Erwin K. N., Di Giulio R. T. (2015). AHR2-mediated transcriptomic responses underlying the synergistic cardiac developmental toxicity of PAHs. Toxicol. Sci. 143, 469–481. [DOI] [PMC free article] [PubMed] [Google Scholar]
- Jiang L., Zhang J., Wang J. J., Wang L., Zhang L., Li G., Yang X., Ma X., Sun X., Cai J., et al. (2013). Sperm, but not oocyte, DNA methylome is inherited by zebrafish early embryos. Cell 153, 773–784. [DOI] [PMC free article] [PubMed] [Google Scholar]
- Jules G. E., Pratap S., Ramesh A., Hood D. B. (2012). In utero exposure to benzo(a)pyrene predisposes offspring to cardiovascular dysfunction in later-life. Toxicology 295, 56–67. [DOI] [PMC free article] [PubMed] [Google Scholar]
- Kimmel C. B., Ballard W. W., Kimmel S. R., Ullmann B., Schilling T. F. (1995). Stages of embryonic development of the zebrafish. Dev. Dyn. 203, 253–310. [DOI] [PubMed] [Google Scholar]
- Kirby G. M., Bend J. R., Smith I. R., Hayes M. A. (1990). The role of glutathione S-transferases in the hepatic metabolism of benzo[a]pyrene in white suckers (Catostomus commersoni) from polluted and reference sites in the Great Lakes. Comp. Biochem. Physiol.. C Comp. Pharmacol. Toxicol. 95, 25–30. [DOI] [PubMed] [Google Scholar]
- Kristensen P., Eilertsen E., Einarsdottir E., Haugen A., Skaug V., Ovrebo S. (1995). Fertility in mice after prenatal exposure to benzo[a]pyrene and inorganic lead. Environ. Health Perspect. 103, 588–590. [DOI] [PMC free article] [PubMed] [Google Scholar]
- Kummer V., Maskova J., Zraly Z., Neca J., Simeckova P., Vondracek J., Machala M. (2008). Estrogenic activity of environmental polycyclic aromatic hydrocarbons in uterus of immature Wistar rats. Toxicol. Lett. 180, 212–221. [DOI] [PubMed] [Google Scholar]
- Labib S., Guo C. H., Williams A., Yauk C. L., White P. A., Halappanavar S. (2013). Toxicogenomic outcomes predictive of forestomach carcinogenesis following exposure to benzo(a)pyrene: relevance to human cancer risk. Toxicol. Appl. Pharmacol. 273, 269–280. [DOI] [PubMed] [Google Scholar]
- Lee H. J., Lowdon R. F., Maricque B., Zhang B., Stevens M., Li D., Johnson S. L., Wang T. (2015). Developmental enhancers revealed by extensive DNA methylome maps of zebrafish early embryos. Nat. Commun. 6, 6315. [DOI] [PMC free article] [PubMed] [Google Scholar]
- Luckert C., Ehlers A., Buhrke T., Seidel A., Lampen A., Hessel S. (2013). Polycyclic aromatic hydrocarbons stimulate human CYP3A4 promoter activity via PXR. Toxicol. Lett. 222, 180–188. [DOI] [PubMed] [Google Scholar]
- MacKenzie K. M., Angevine D. M. (1981). Infertility in mice exposed in utero to benzo(a)pyrene. Biol. Reprod. 24, 183–191. [DOI] [PubMed] [Google Scholar]
- Madhavan N. D., Naidu K. A. (1995). Polycyclic aromatic hydrocarbons in placenta, maternal blood, umbilical cord blood and milk of Indian women. Hum. Exp. Toxicol. 14, 503–506. [DOI] [PubMed] [Google Scholar]
- Maunakea A. K., Chepelev I., Cui K., Zhao K. (2013). Intragenic DNA methylation modulates alternative splicing by recruiting MeCP2 to promote exon recognition. Cell Res. 23, 1256–1269. [DOI] [PMC free article] [PubMed] [Google Scholar]
- Meir K. S., Leitersdorf E. (2004). Atherosclerosis in the apolipoprotein-E-deficient mouse: a decade of progress. Arterioscler. Thromb. Vasc. Biol. 24, 1006–1014. [DOI] [PubMed] [Google Scholar]
- Mohamed el S. A., Song W. H., Oh S. A., Park Y. J., You Y. A., Lee S., Choi J. Y., Kim Y. J., Jo I., Pang M. G. (2010). The transgenerational impact of benzo(a)pyrene on murine male fertility. Hum. Reprod. 25, 2427–2433. [DOI] [PubMed] [Google Scholar]
- Murawska-Cialowicz E., Jethon Z., Magdalan J., Januszewska L., Podhorska-Okolow M., Zawadzki M., Sozanski T., Dziegiel P. (2011). Effects of melatonin on lipid peroxidation and antioxidative enzyme activities in the liver, kidneys and brain of rats administered with benzo(a)pyrene. Exp. Toxicol. Pathol. 63, 97–103. [DOI] [PubMed] [Google Scholar]
- Niestroy J., Barbara A., Herbst K., Rode S., van Liempt M., Roos P. H. (2011). Single and concerted effects of benzo[a]pyrene and flavonoids on the AhR and Nrf2-pathway in the human colon carcinoma cell line Caco-2. Toxicol. in vitro 25, 671–683. [DOI] [PubMed] [Google Scholar]
- Okey A. B., Riddick D. S., Harper P. A. (1994). Molecular biology of the aromatic hydrocarbon (dioxin) receptor. Trends Pharmacol. Sci. 15, 226–232. [DOI] [PubMed] [Google Scholar]
- Ortiz L., Nakamura B., Li X., Blumberg B., Luderer U. (2014). Reprint of “In utero exposure to benzo[a]pyrene increases adiposity and causes hepatic steatosis in female mice, and glutathione deficiency is protective". Toxicol. Lett. 230, 314–321. [DOI] [PubMed] [Google Scholar]
- Perera F. P., Rauh V., Whyatt R. M., Tang D., Tsai W. Y., Bernert J. T., Tu Y. H., Andrews H., Barr D. B., Camann D. E., et al. (2005). A summary of recent findings on birth outcomes and developmental effects of prenatal ETS, PAH, and pesticide exposures. Neurotoxicology 26, 573–587. [DOI] [PubMed] [Google Scholar]
- Perera F. P., Tang D., Wang S., Vishnevetsky J., Zhang B., Diaz D., Camann D., Rauh V. (2012). Prenatal polycyclic aromatic hydrocarbon (PAH) exposure and child behavior at age 6–7 years. Environ. Health Perspect. 120, 921–926. [DOI] [PMC free article] [PubMed] [Google Scholar]
- Potok M. E., Nix D. A., Parnell T. J., Cairns B. R. (2013). Reprogramming the maternal zebrafish genome after fertilization to match the paternal methylation pattern. Cell 153, 759–772. [DOI] [PMC free article] [PubMed] [Google Scholar]
- Revil T., Gaffney D., Dias C., Majewski J., Jerome-Majewska L. A. (2010). Alternative splicing is frequent during early embryonic development in mouse. BMC Genomics 11, 399. [DOI] [PMC free article] [PubMed] [Google Scholar]
- Robinson M. D., McCarthy D. J., Smyth G. K. (2010). edgeR: a bioconductor package for differential expression analysis of digital gene expression data. Bioinformatics 26, 139–140. [DOI] [PMC free article] [PubMed] [Google Scholar]
- Sadikovic B., Haines T. R., Butcher D. T., Rodenhiser D. I. (2004). Chemically induced DNA hypomethylation in breast carcinoma cells detected by the amplification of intermethylated sites. Breast Cancer Res. 6, R329–R337. [DOI] [PMC free article] [PubMed] [Google Scholar]
- Sadikovic B., Rodenhiser D. I. (2006). Benzopyrene exposure disrupts DNA methylation and growth dynamics in breast cancer cells. Toxicol. Appl. Pharmacol. 216, 458–468. [DOI] [PubMed] [Google Scholar]
- Turusov V. S., Nikonova T. V., Parfenov Yu D. (1990). Increased multiplicity of lung adenomas in five generations of mice treated with benz(a)pyrene when pregnant. Cancer Lett. 55, 227–231. [DOI] [PubMed] [Google Scholar]
- van Delft J., Gaj S., Lienhard M., Albrecht M. W., Kirpiy A., Brauers K., Claessen S., Lizarraga D., Lehrach H., Herwig R., et al. (2012). RNA-Seq provides new insights in the transcriptome responses induced by the carcinogen benzo[a]pyrene. Toxicol. Sci. 130, 427–439. [DOI] [PubMed] [Google Scholar]
- von der Mark H., von der Mark K., Gay S. (1976). Study of differential collagen synthesis during development of the chick embryo by immunofluorescence. I. Preparation of collagen type I and type II specific antibodies and their application to early stages of the chick embryo. Dev. Biol. 48, 237–249. [DOI] [PubMed] [Google Scholar]
- Wang L., Camus A. C., Dong W., Thornton C., Willett K. L. (2010). Expression of CYP1C1 and CYP1A in Fundulus heteroclitus during PAH-induced carcinogenesis. Aquat. Toxicol. 99, 439–447. [DOI] [PMC free article] [PubMed] [Google Scholar]
- Wang G. S., Cooper T. A. (2007). Splicing in disease: disruption of the splicing code and the decoding machinery. Nat. Rev. Genetics 8, 749–761. [DOI] [PubMed] [Google Scholar]
- Wang L., Scheffler B. E., Willett K. L. (2006). CYP1C1 messenger RNA expression is inducible by benzo[a]pyrene in Fundulus heteroclitus embryos and adults. Toxicol. Sci. 93, 331–340. [DOI] [PMC free article] [PubMed] [Google Scholar]
- Weigt S., Huebler N., Strecker R., Braunbeck T., Broschard T. H. (2011). Zebrafish (Danio rerio) embryos as a model for testing proteratogens. Toxicology 281, 25–36. [DOI] [PubMed] [Google Scholar]
- Wislocki P. G., Bagan E. S., Lu A. Y., Dooley K. L., Fu P. P., Han-Hsu H., Beland F. A., Kadlubar F. F. (1986). Tumorigenicity of nitrated derivatives of pyrene, benz[a]anthracene, chrysene and benzo[a]pyrene in the newborn mouse assay. Carcinogenesis 7, 1317–1322. [DOI] [PubMed] [Google Scholar]
- Wu J., Hou H., Ritz B., Chen Y. (2010). Exposure to polycyclic aromatic hydrocarbons and missed abortion in early pregnancy in a Chinese population. Sci. Total Environ. 408, 2312–2318. [DOI] [PMC free article] [PubMed] [Google Scholar]
- Yan C., Wu W., Li H., Zhang G., Duerksen-Hughes P. J., Zhu X., Yang J. (2010). Benzo[a]pyrene treatment leads to changes in nuclear protein expression and alternative splicing. Mutat. Res. 686, 47–56. [DOI] [PubMed] [Google Scholar]
- Zenzes M. T., Puy L. A., Bielecki R. (1998). Immunodetection of benzo[a]pyrene adducts in ovarian cells of women exposed to cigarette smoke. Mol. Hum. Reprod. 4, 159–165. [DOI] [PubMed] [Google Scholar]
Associated Data
This section collects any data citations, data availability statements, or supplementary materials included in this article.