

Abstract
Purpose
The neuroendocrine (NE) phenotype is associated with the development of metastatic castration-resistant prostate cancer (CRPC). Our objective was to characterize the molecular features of the NE phenotype in CRPC.
Experimental Design
Expression of chromogranin A (CHGA), synaptophysin (SYP), androgen receptor (AR), and prostate-specific antigen (PSA) was analyzed by immunohistochemistry (IHC) in 155 CRPC metastases from 50 patients and in 24 LuCaP prostate cancer patient-derived xenografts (PDX). Seventy-one of 155 metastases and the 24 LuCaP xenograft lines were analyzed by whole genome microarrays. REST splicing was verified by PCR.
Results
Co-expression of CHGA and SYP in >30% of cells was observed in 22 of 155 metastases (9 patients); 11 of the 22 metastases were AR+/PSA+ (6 patients), 11/22 were AR−/PSA− (4 patients), and 4/24 LuCaP PDXs were AR−/PSA−. By IHC, of the 71 metastases analyzed by whole genome microarrays, 5 metastases were CHGA+/SYP+/AR− and 5 were CHGA+/SYP+/AR+. Only CHGA+/SYP+ metastases had a NE transcript signature. The neuronal transcriptional regulator SRRM4 transcript was associated with the NE signature in CHGA+/SYP+ metastases and all CHGA+/SYP+ LuCaP xenografts. Additionally, expression of SRRM4 in LuCaP NE xenografts correlated with a splice variant of REST that lacks the transcriptional repressor domain.
Conclusions
(a) metastatic NE status can be heterogeneous in the same patient, (b) the CRPC NE molecular phenotype can be defined by CHGA+/SYP+ dual positivity, (c) the NE phenotype is not necessarily associated with the loss of AR activity, and (d) the splicing of REST by SRRM4 could promote the NE phenotype in CRPC.
Keywords: Prostate cancer, Neuroendocrine, SRRM4
Introduction
It is widely believed that prostate neuroendocrine (NE) cells act in a secretory and autocrine/paracrine fashion, that NE cells of varying number are present in a significant proportion of primary prostate cancers (PCa), and, importantly, that NE cells do not express the androgen receptor (AR) (1, 2). The role that these NE cells play in PCa tumorigenesis is unknown but appears to be gaining increasing importance in clinical progression after therapy with the new hormonal agents, enzalutamide and abiraterone. Morphologically, some PCa cells with NE differentiation may eventually become malignant NE cells (3), but others may remain similar to adenocarcinoma, and only methods targeting NE markers can identify these cells (4). While uncommon in primary PCa, neuroendocrine (NE) tumors appear to be more prevalent in castration-resistant PCa (CRPC) (5–8).
Initially PCa is almost always hormone sensitive and responds to androgen deprivation therapy (ADT) however the majority of patients eventually progress to CRPC. It has been hypothesized that the NE differentiated population of cells in CRPC disease stimulate tumor growth and cell proliferation in an autocrine-paracrine fashion in an altered microenvironment with very low to no androgen levels (3, 9). It is further suggested that the newly acquired NE phenotype in adenocarcinoma represents a mechanism through which hormone sensitive PCa develops resistance to ADT (10). Thus, the population of cells with NE differentiation might be an important therapeutic target that could prevent the transformation of hormone sensitive PCa to CRPC. Currently however, there is no effective treatment for PCa with NE differentiation. This is most likely due to our limited knowledge of the NE phenotype in PCa.
In this study, tissue markers (chromogranin A (CHGA) and synaptophysin (SYP) for NE differentiation, and androgen receptor (AR) were evaluated in conjunction with gene expression profiling to determine the prevalence and molecular profile of the NE phenotype in CRPC metastases and NE LuCaP PDXs. We determined that these three tissue markers are sufficient to identify CRPC metastases with a NE molecular phenotype. Based on our findings we speculate on the possible roles of serine/arginine repetitive matrix 4 (SRRM4) and RE1-silencing transcription factor (REST) neural specific regulators of transcription in the emergence of the NE phenotype in CRPC (11, 12).
Materials and Methods
Reagents
The antibodies used in this study are listed in Supplemental Table 1.
Tissue acquisition
Samples were obtained from patients who died of metastatic CRPC and who signed written informed consent for a rapid autopsy performed within 6 hours of death, under the aegis of the Prostate Cancer Donor Program at the University of Washington (13). The Institutional Review Boards of the University of Washington and of the Fred Hutchinson Cancer Research Center approved this study. Visceral metastases were identified at the gross level, bone biopsies were obtained according to a template from 20 different sites and metastases identified at a histological level. LuCaP xenograft lines were established from specimens acquired at either radical prostatectomy or at autopsy, implanted, and maintained by serial passage in intact immune compromised male mice (14).
Tissue microarray construction
One hundred and fifty-five PCa metastases (including 73 visceral metastases and 82 bone metastases) from 50 autopsy patients (up to 4 sites per patient) were fixed in buffered formalin (bone metastases were decalcified in 10% formic acid) and embedded in paraffin. A tissue microarray (TMA) was made using duplicate 1 mm diameter cores from these tissues. A second TMA using duplicate 1 mm diameter cores from each of 24 LuCaP xenograft lines was also constructed.
RNA Isolation
Total RNA was isolated from 71 CRPC metastases frozen in Optimal Cutting Temperature compound (OCT; Tissue-Tek) from 47 patients. Eight-micron thick sections from visceral metastases (n=54) were cut using a Leica CM3050S cryostat, collected on PEN Membrane Frame Slides (Life Technologies) and immediately fixed in 95% ethanol. Sections were briefly stained with hematoxylin then dehydrated in 100% ethanol. 5,000–10,000 tumor cells per sample were laser capture microdissected with an Arcturus Veritas instrument and collected on CapSure® Macro LCM Caps (Life Technologies). Digital photographs were taken of tissue sections before, during, and after LCM and assessed by a pathologist to confirm the tumor content. RNA was isolated using the Arcturus PicoPure RNA Isolation Kit and the samples were DNAse treated using the Qiagen RNase-Free DNase Set. RNA was amplified for two rounds using the Ambion MessageAmp aRNA Kit. The bone metastases (n=17), which were frozen in OCT blocks were sampled using 1 mm diameter tissue punch in a −20°C cryostat. The sample was obtained from the region of the block where there was tumor based upon a section of an adjacent decalcified FFPE block. RNA was isolated from the tissue cores using RNeasy Plus Micro Kit (Qiagen Inc.). Tissue cores were placed in the kit’s Buffer RLT Plus, to which β-mercaptoethanol had been added, and homogenized with a disposable hard tissue homogenizer tip (Omni International). Flash frozen LuCaP PCa xenograft tissue was histologically evaluated for regions of viable tumor. RNA was isolated from 15, 10-micron sections from xenografts with ≥80% tumor content. For xenografts with <80% tumor, stroma and necrotic tissue were removed using an 18-guage needle prior to sectioning. RNA was extracted using the Qiagen RNeasy Kit, (Qiagen Inc.), according to the manufacturer's protocol. On-column DNase digestion was performed. RNA was quantified using a Nanodrop 1000 (Thermo Scientific) and quality was assessed via Agilent Bioanalyzer 2100 (Agilent Technologies).
RNA amplification and microarray hybridization
Agilent 44K whole human genome expression oligonucleotide microarrays (Agilent Technologies, Inc.) were used to profile the PCa xenograft lines and CRPC metastases. Total RNA from xenograft tissue was amplified one round; patient samples were amplified two rounds as described previously (15). Probe labeling and hybridization followed Agilent protocols. Fluorescent array images were digitized using the Agilent DNA microarray scanner G2565BA. Data was loess normalized within arrays (normexp background correction with offset 50) and quantile normalized between arrays in R using the Limma Bioconductor package. Control probes were removed, duplicate probes averaged, and spots flagged by Agilent Feature Extraction software as being foreground feature nonuniformity or population outliers were assigned a value of "NA". Data was normalized separately for LuCaP xenografts and CRPC metastases. CRPC metastases were subject to an additional normalization step to remove systematic batch effects by application of the ComBat function within the sva Bioconductor package to the log2 Cy3 signal intensities. http://www.ncbi.nlm.nih.gov/geo/query/acc.cgi?token=ghylcmeynpslhel&acc=GSE66187
Gene Set Enrichment Analysis
Gene expression results were ranked by their SAM t-test score and used to conduct Gene Set Enrichment Analysis (GSEA) (16) to determine patterns of pathway activation in different phenotypic groups. We used the curated pathways from the Transcription Factor database (TF) and Gene Ontology (GO) as gene sets from MSigDBv4.0.
Immunohistochemistry
Five-micron thick sections of the TMAs were deparaffinized and rehydrated in sequential xylene and graded ethanol. Antigen retrieval was performed in 10 mM citrate buffer (pH 6.0) in a pressure cooker. Endogenous peroxidase and avidin/biotin were blocked respectively (Vector Laboratories Inc.). Sections were then incubated with 5% normal goat-horse-chicken serum, incubated with primary antibody (Supplemental Table 1), incubated with biotinylated secondary antibody (Vector Laboratories Inc.), followed by ABC reagent (Vector Laboratories Inc.), and stable DAB (Invitrogen Corp.). All sections were lightly counterstained with hematoxylin and mounted with Cytoseal XYL (Richard Allan Scientific). Mouse or rabbit IgG were used as negative controls.
Immunohistochemical assessment
Immunostaining was assessed using a quasi-continuous scoring system, created by multiplying each optical density level (“0” for no stain, “1” for faint/equivocal stain, and “2” for definitive stain) by the percentage of cells at each staining level. The sum of the 3 multiplicands provided a final score for each sample (score range was 0 to 200). The score for each sample was the average of the scores of each duplicate. Cytoplasm and nuclei were evaluated separately. The scores were categorized as “none” (score range: 0), “weak” (score range: 0~70), “moderate” (score range: 70~140) and “intense” (score range: 140~200). Samples with missing or damaged cores were excluded from analysis.
Western analysis
LuCaP xenografts were manually homogenized in RIPA buffer containing 2M Urea and protease inhibitors (Fisher Scientific). The homogenates were sonicated and centrifuged to remove insoluble material. Ten-micrograms of total protein lysate was electrophoresed on 4–12% Bis-Tris gels (Invitrogen) with MES buffer. The gels were transferred to nitrocellulose and blocked with 5% BSA in PBS/0.1% Tween-20 and subsequently probed with 1:1000 dilution of anti-SRRM4 antibody (HPA052783; Atlas Antibodies AB) or 1:2000 dilution of anti-GAPDH (GT239; Genetex). Protein was visualized using Supersignal West Femto Chemiluminescent Substrate (Thermo Scientific).
PCR
RNA for PCR was extracted using Stat-60 RNA isolation reagent (Tel Test Inc), according to the manufacturer's instructions. First-strand cDNA synthesis was performed with 1 µg of RNA using an Advantage RT-for-PCR Kit (Clontech Laboratories Inc.). Real-time PCR was performed using Platinum SYBR Green qPCR SuperMix-UDG (Invitrogen) on a Rotor-Gene Q (Qiagen). PCR primers (Integrated DNA Technologies) specific for SRRM4 were designed to span an intron-exon boundary. Primers for REST and SNAP25 were adapted from Raj et al., 2011 (11). Primers are listed in Supplemental Table 2. Four-microliters of cDNA was used per reaction with 0.2 µM primers, and Platinum SYBR Green qPCR SuperMix-UDG (Invitrogen). The PCR reaction parameters were as follows: 50°C for 2 minutes and 95°C for 2 minutes (one cycle), followed by 40 cycles at 95°C for 10 seconds, annealing/extension at T(m) for 30 seconds, and 72°C for 30 seconds; the final extension was 72°C for 7 minutes. Standard curves for each amplicon were generated from a four-fold dilution series of C4-2BE cDNA run in duplicate (all standard curves had r > 0.99). Reactions were carried out in duplicate, and expression levels were calculated from a standard curve. Amplicon product was confirmed by melt curve analysis. Threshold cycle of amplification (Ct) value for each gene was normalized to a housekeeping gene, ACTB. Fold change in mRNA expression level was calculated by the comparative Ct method using the formula ΔΔCt. REST and REST4 PCR products were visualized after electrophoresis on a 1.2% agarose gel.
Hierarchical Clustering
Genes between CHGA− vs. CHGA+/SYP+ were compared and considered differentially expressed when SAM score was >3 or <−3 and p< 0.005. The resulting 155 genes were hierarchically clustered (centroid linkage) using open source clustering software Cluster 3.0 (http://bonsai.hgc.jp/~mdehoon/software/cluster/software.htm) and the resulting heatmap was viewed using Java TreeView (http://jtreeview.sourceforge.net).
Statistical analysis
Statistical Analysis of Microarray (SAM) program (http://www-stat.stanford.edu/~tibs/SAM/) was used to analyze expression differences between the groups. Unpaired, t-tests were calculated for all probes passing filters and controlled for multiple testing by estimation of q-values using the false discovery rate (FDR) method (17). Significance of differences for the IHC analyses were calculated using a student’s t- test, with p values ≤ 0.05 indicating statistical significance.
Results
Patient demographics, treatments, and prevalence of CRPC metastases
Patient demographics and clinical data are summarized in Supplemental Table 3. All patients received ADT; mean treatment duration was 5.6 years (range 1.5–20.3 years). Bone, lymph nodes, and liver were the most frequent sites of metastasis.
Characterization of NE carcinoma and adenocarcinoma with NE differentiation in metastatic CRPC
Using a TMA of 155 CRPC metastases from 50 patients we assessed tumor cell expression of CHGA, SYP, AR, and PSA (Figure 1A). Among 50 patients, 29 patients had at least one metastasis with CHGA stained cells and 11 patients had at least 1 metastasis with SYP stained cells. Co-expression of CHGA and SYP in the same metastasis was only observed in 9 patients (Figure 1B). Additionally, there were 6 patients with at least 1 metastasis that expressed neither AR nor PSA (Figure 1B). Of the 155 metastases, 63 expressed CHGA and 42 expressed SYP. Since NE cells are normally present in most organs in small numbers, a minor population of CHGA and/or SYP positive cells is not unexpected. In order to show more distinct molecular-biological differences of those metastatic CRPC with NE differentiation we arbitrarily used >30% CHGA+ and SYP+ (CHGA+/SYP+) cells as a cutoff to define the CRPC sites with significant NE differentiation. We considered a tumor with >30% CHGA+/SYP+ a significant population that could represent (1) a mixed population of NE cells and adenocarcinoma where NE cells were scattered throughout the tumor, or (2) the development of a NE derivative where all of the NE cells were only within a specific region of the tumor.
Figure 1.

IHC expression profile in CRPC metastases. (A) Distribution of CHGA, SYP, AR, and PSA expression in visceral and bone CRPC metastases (n=155); (B) The number of patients who have at least one metastasis with corresponding marker(s) expression; (C) The number of metastases with corresponding marker(s) expression.
Staining by IHC demonstrated little to no adenocarcinoma mixed with NE carcinoma (only 1 site with >30% CHGA and SYP showed a scattered population with adenocarcinoma in this study), expression contained within a region of the tumor was more prevalent (Supplemental Figure 1). By the criteria noted above, of 155 metastases, 53 (34%) were CHGA+, 27 (17%) were SYP+, and 22 (14%) co-expressed CHGA and SYP (Figure 1C). The majority of metastases with a population containing >30% CHGA+/SYP+ stained with 100% positivity (Supplemental Figure 1B and C).
In our study, 11/155 metastases (4 patients) had extensive CHGA+/SYP+/AR− expression. After carefully reviewing hematoxylin and eosin stained sections, we found that these metastases histologically represented the classically defined NE carcinoma/small cell carcinoma (Figure 1C). In this group, cancer cells were uniformly similar to each other but dramatically different from the conventional adenocarcinoma as illustrated by cell size, shape, nuclear-to-cytoplasmic ratio, and the lack of typical glandular structure (Supplemental Figure 1A). All metastases that were CHGA+/SYP+/AR− were also PSA−. The 11 CHGA+/SYP+/AR+ metastases (6 patients) were morphologically indistinguishable from the surrounding adenocarcinoma, and these tumors were defined as adenocarcinoma with NE differentiation (Supplemental Figure 1A). All metastases that were CHGA+/SYP+/AR+ were also PSA+. We also determined in patients with CHGA+/SYP+ sites how many sites were not CHGA+/SYP+ (Supplemental Table 4). The molecular profiles of 71 out of the 155 CRPC metastases were available for gene expression analysis. The 71 metastases were categorized by IHC into three groups: CHGA− (n=51), CHGA+/SYP+ (n=10), and CHGA+/SYP− (n=10). The CHGA+/SYP+ metastases (14% total) had a distinct molecular signature when compared to the other two groups (Figure 2).
Figure 2.

Agilent™ oligo array expression analysis of the top and bottom 25 neuroendocrine/neuronal-associated genes in CRPC metastases. Categories (CHGA−, CHGA+/SYP+, CHGA+/SYP−) are based on the IHC results for CHGA and SYP on paraffin embedded tissue from the same metastases. Mean-centered ratios of genes are colored according to scale (Supplemental Figure 2).
Gene set enrichment analysis (GSEA) clearly demonstrated that the CHGA+/SYP+ metastases had a NE gene expression signature showing enrichment of central nervous system development (p<0.001), transmission of nerve impulse (p<0.001), synaptic transmission (p<0.001), nervous system development (p<0.001), regulation of neurogenesis (p=0.009), and synaptic vesicle (p=0.004) in the CHGA+/SYP+ metastases. Additional GSEA comparison of metastases displaying the classic CHGA+/SYP+/AR− NE phenotype vs CHGA+/SYP− and CHGA− metastases using Gene Ontology (GO) terms showed enrichment of central nervous system development (p<0.001), transmission of nerve impulse (p<0.001), synaptic transmission (p<0.001), nervous system development (p<0.001), regulation of neurogenesis (p=0.01), and synaptic vesicle (p=0.038) in the CHGA+/SYP+/AR− metastases. In addition, notably the transcription factor (TF) database revealed that genes with promoter regions [−2kb,2kb] around transcription start sites containing REST, were the most differentially enriched between the CHGA+/SYP+/AR− metastases and all other metastases (p<0.001). Comparing CHGA+/SYP+/AR+ vs CHGA− and CHGA+/SYP− metastases in GO, neuronal gene sets were enriched in the CHGA+/SYP+/AR+ metastases including but not limited to nervous system development (p<0.001), synaptic vesicle (p=0.029), neuron development (p=0.038), neuron differentiation (p=0.024), and neurogenesis (p=0.008). Results of a TF database search showed that the most differentially expressed genes were enriched for the REST binding motif in their promoter regions (p<0.001). Genes defining this subpopulation of metastases cluster into a defined CHGA+/SYP+ group (Supplemental Figure 2). This led us to conclude that the CRPC NE molecular phenotype defined by CHGA+/SYP+ dual positivity as detected by IHC, is more common in CRPC than historically noted in hormone sensitive primary disease (7), and that CHGA+/SYP+/AR− metastases expressed additional neuronal-associated genes when compared to CHGA+/SYP+/AR+ metastases.
The NE molecular profile in CRPC metastases is mitigated by androgen receptor expression
From 10 CHGA+/SYP+ metastases, 5 metastases from 4 patients were AR+ and 5 metastases from 2 patients were AR−. To further define the molecular profile of the CHGA+/SYP+ metastases, we compared the gene expression profiles of the 10 CHGA+/SYP+/AR+ and CHGA+/SYP+/AR− metastases. We focused on prostate epithelial-associated transcriptional regulators, known NE transcription factors and regulators, and downstream NE associated genes (Figure 3). CHGA+/SYP+/AR+ metastases expressed NKX3.1 and REST. CHGA+/SYP+/AR− metastases had a decrease in NKX3.1 with one patient, exhibiting a decrease in REST expression and the other patient displaying no change in REST expression relative to adenocarcinoma (Figure 3). A number of other transcription factors have been associated with NE gene expression (NKX2.1, LMO3, HOXB5, FOXA2, HES6, HES1, and ASCL1) (18–26) (Supplemental Figure 3A). We observed an increase in all of these transcription factors (except HES1 which as expected decreased) in the CHGA+/SYP+/AR− metastases relative to the CHGA+/SYP+/AR+ metastases. This suggests that these NE-associated transcription factors are repressed in the AR expressing cells. However, the expression of downstream well known NE genes including but not limited to ELAVL4, SCG3, SNAP25, CHGA, SYP, and SRRM4 were increased in both CHGA+/SYP+/AR− and CHGA+/SYP+/AR+ metastases relative to the CHGA− and CHGA+/SYP− metastases. These data imply that there are two phenotypes within the CHGA+/SYP+ metastases. A Venn diagram comparing genes with SAM score >2.5 in CHGA+/SYP+/AR+ metastases and CHGA+/SYP+/AR− metastases vs CHGA+/SYP− and CHGA− metastases respectively shows that the latter displayed more differentially expressed genes (598 vs 61). Thirty-seven genes were common to all CHGA+/SYP+ metastases with SAM score >2.5 relative to the CHGA− and CHGA+/SYP− metastases (Supplemental Figure 3B). Notably, these genes included SRRM4 and SNAP25, which is directly repressed by REST (Supplemental Figure 4) (11).
Figure 3.
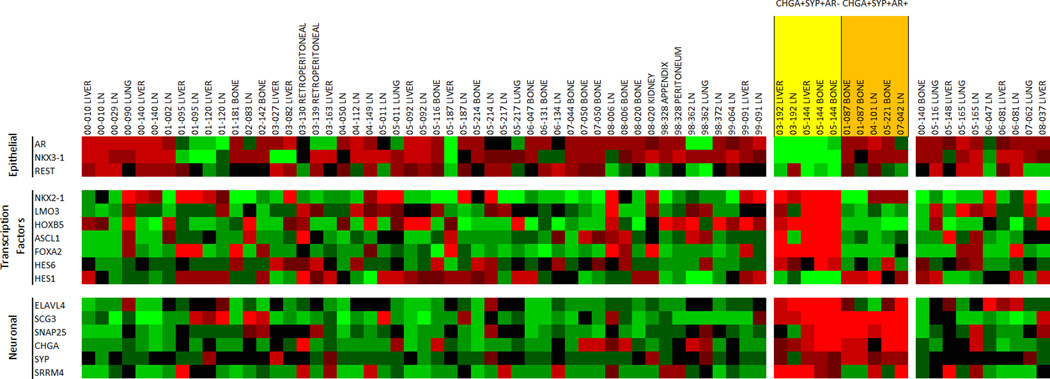
Agilent™ oligo array expression analysis of relevant prostate epithelial, transcription factor, and neuroendocrine/neuronal-associated genes that differentiate neuronal AR+ and AR− metastases in CRPC. NE tumors are highlighted in orange (AR+) and yellow (AR−). Mean-centered ratios of genes are colored according to scale (Supplemental Figure 2).
Expression of NKX-homeodomain factors are altered with NE differentiation in CRPC
Thyroid transcription factor 1 (TTF-1), the gene product of NKX2-1, was significantly higher as detected by IHC in CHGA+/SYP+/AR− metastases compared to CHGA− or CHGA+/SYP− metastases (p<0.001). TTF-1 was not significantly different in CHGA+/SYP+/AR+ metastases compared to CHGA− or CHGA+/SYP− metastases (Figure 4A). NKX3-1 protein nuclear localization was completely lost in CHGA+/SYP+/AR− metastases (p<0.001), while maintained in CHGA+/SYP+/AR+ metastases (Figure 4B).
Figure 4.

IHC analysis of (A) TTF-1, (B) NKX3.1, (C) SCG3, and (D) HuD in CRPC metastases (n=155). We observed increased expression TTF-1 in NE CRPC, a loss of NKX3.1 expression in AR− NE CRPC, increased expression of SCG3 in NE CRPC, and an increase in expression of HuD in AR− NE CRPC. The difference in the expression of each of these proteins underlines the biology associated with AR+ and AR− neuronal phenotype in CRPC metastases. Representative pictures of stained metastases are shown. TTF-1 and NKX3-1 staining was mainly nuclear (A, a–d) and (B, a–d) respectively. SCG3 was cytoplasmic with various staining patterns: sporadic intensely stained single cells (C, a); an apocrine pattern, with positive stained cytoplasmic membrane-bound vesicles budding in the lumen (C, b); a mixture of apocrine pattern with cytoplasmic positivity (C, c); and a homogeneous cytoplasmic staining pattern (C, d). HuD staining was mainly nuclear (D, a–d).
Secretogranin III (SCG3) as a potential NE marker
Our analyses showed that SCG3 was the most up-regulated gene in CHGA+/SYP+ metastases relative to all other metastases (Figure 2). SCG3 protein was also significantly higher by IHC relative to CHGA− and CHGA+/SYP− metastases (p<0.001) (Figure 4C). While highly expressed in both, SCG3 was higher in the CHGA+/SYP+/AR− NE metastases relative to the CHGA+/SYP+/AR+ metastases (p<0.01). SCG3 immuno-reactivity was cytoplasmic with various staining patterns, including sporadic intensely stained single cells, an apocrine pattern with positively stained cytoplasmic membrane-bound vesicles budding in the lumen, a mixture of apocrine pattern with cytoplasmic positivity, and a homogeneous cytoplasmic staining pattern (Figure 4C; a through d).
HuD expression is determined by AR expression in NE CRPC metastases
HuD (ELAVL4) was stained in 22.4% of all metastatic CRPC in the nucleus and/or cytoplasm. CHGA+/SYP+/AR− metastases had the highest protein level among the 3 subgroups (p<0.001) suggesting it is preferentially expressed by CHGA+/SYP+ tumors when AR is absent (Figure 4D).
Gene expression analysis of AR-negative NE LuCaP PDX models reveals a similar signature to AR-negative NE metastases from patients
We used four NE AR-negative NE LuCaP PDXs for our analyses. LuCaP 49 (27), LuCaP 93, LuCaP 145.1, and LuCaP 145.2. The gene expression profiles of these NE PDX models were compared to 20 LuCaP adenocarcinoma PDX models. All NE LuCaP xenografts were AR− (Supplemental Figures 6 and 7). Gene expression analysis looking at NKX3-1 and REST reveal results concordant with the results in the CRPC CHGA+/SYP+/AR− metastases (Figure 5). NKX2-1, LMO3, HOXB5, ASCL1, FOXA2, HES6, HES1, ELAVL4, SCG3, SNAP25, CHGA, SYP, and SRRM4 all had a similar pattern of expression to the CRPC CHGA+/SYP+/AR− metastases (Figure 5). It is important to note LuCaP 145.1 and 145.2 were derived from two different metastases from patient 05–144 on the gene expression array.
Figure 5.

Agilent™ oligo array expression analysis of relevant prostate epithelial, transcription factor, and neuroendocrine/neuronal-associated genes that differentiate neuronal LuCaP xenografts. AR− NE xenografts are highlighted in yellow. Mean-centered ratios of genes are colored according to scale (Supplemental Figure 2).
IHC of proteins identified by gene expression analysis in AR-negative NE LuCaP PDX models
The 4 NE LuCaP PDX models share common biological features, including expression of CHGA (only observed in this study by gene expression analysis in LuCaP 49), SYP, and downregulation of AR and PSA (Supplemental Figure 6A and B). TTF-1, NKX3-1, SCG3, and HuD expression at the transcript and protein levels were similar to those observed in CHGA+/SYP+/AR− metastases (Supplemental Figure 6A).
SRRM4 is expressed and may promote the NE phenotype in NE metastatic tissues and NE LuCaP PDX Models
SRRM4 promotes alternative splicing and inclusion of neural-specific exons (11, 28). We identified SRRM4 as a gene expressed in NE patient tissues and LuCaP PDX models (Figures 4 and 6). SRRM4 splices a 62bp exon into REST (11). Using PCR primers designed to identify the splicing-in event between exon 3–4 in the REST mRNA, we observed two bands, one at approximately 124bp and another at approximately 186bp in two androgen receptor negative and two androgen receptor positive patients with a NE phenotype (Figure 6A). Suggesting the splicing of REST occurs in neuroendocrine metastases. We then went on to determine whether this event could also be observed in the neuroendocrine LuCaP PDX models. Western blot analysis showed that SRRM4 was upregulated in all four NE LuCaP PDX models when compared to four randomly selected adenocarcinoma LuCaP PDX models (Figure 6B). As mentioned previously for the neuroendocrine patient metastases, using PCR primers designed to identify the splicing-in event between exon 3–4 in the REST mRNA, we observed two bands, one at approximately 124bp and another at approximately 186bp in all four NE LuCaP models. Only one 124bp band was observed in the 4 adenocarcinoma LuCaP models (Figure 6C), suggesting 62bp’s were inserted into REST producing REST4 in the LuCaP NE xenografts. The same samples were used to determine SRRM4, REST and SNAP25 expression by qPCR (Figure 6D). The average ddCT was −3.5 for total REST, 7.4 for SRRM4, and 11.3 for SNAP25 in LuCaP NE xenografts vs LuCaP adenocarcinoma. The increase in SRRM4 expression, splicing in of 62bp into REST, the loss of REST expression and increase in SNAP25 expression implies SRRM4 is promoting the NE phenotype in LuCaP NE xenografts.
Figure 6.

SRRM4 expression and REST splicing in patient metastases and LuCaP xenografts. (A) PCR demonstrating REST is spliced inserting a 62 bp exon producing REST4 (indicated by arrow) in AR− and AR+ metastatic sites from each of four patients. LuCaP 145.1 (neuroendocrine, splicing control); LuCaP 73 (adenocarcinoma, no splicing control). (B) Western analysis of SRRM4 in adenocarcinoma and neuronal xenografts, (C) PCR demonstrating REST is spliced producing REST4 (indicated by arrow) in the 4 neuronal LuCaP PDX lines, and (D) qPCR of REST, SRRM4, and SNAP25 (a gene repressed by REST) expression with actin as a reference in neuronal and adenocarcinoma LuCaP PDX lines. Transcript levels are defined relative to LuCaP 96 (an adenocarcinoma).
Discussion
It has been proposed that prostate adenocarcinoma cells are able to ‘transdifferentiate’ into NE cells under certain pathological circumstances, including ADT. The transdifferentiating cells acquire the ability to express NE associated proteins while some of these cells still maintain epithelial characteristics (9). The NE cells in CRPC most likely have multiple origins, morphologies, and molecular phenotypes (29–32). In our study we identified patients and metastases that have NE features based on IHC analysis and associated gene expression signatures. There is suggestive evidence from our study that support the hypothesis that NE tumors can develop from adenocarcinoma in response to ADT: (1) the greater number of patients with NE disease in CRPC relative to hormone naïve patients, (2) the presence of metastases with adenocarcinoma and other metastases with NE features in the same patient, (3) the presence of metastases with a mix of cells with both adenocarcinoma and NE features at the same site, and (4) the presence of metastases with NE features that are AR+.
This study highlights the findings that the use of a limited number of biomarkers to define the NE phenotype in CRPC could be somewhat misleading. For example, if CHGA was the only marker used to define NE cells our data would suggest that up to a third of all of the metastases in our cohort would be considered to be NE metastases. Additionally, it appears that rather than transforming into the NE phenotype based on CHGA and SYP positivity, NE AR+ cells can take on the appearance of a NE cell while retaining aspects of their original lineage. Based on our detailed analysis of clinical specimens and PDX models the co-expression of SYP is required before a metastasis has a discernable NE molecular phenotype with the loss of AR expression leading to a more succinct NE phenotype. Our study highlights the fact that only CHGA+/SYP+/AR− CRPC metastases had a molecular signature associated with the neuroendocrine phenotype, while CHGA+/SYP+/AR+ metastases had a signature associated with the loss of REST activity. Our analyses also provide additional biomarkers that may further distinguish the NE phenotype in CRPC (Supplemental Figure 5).
As stated previously, our analysis identified CHGA+/SYP+/AR+ cells having aspects of both a NE and an adenocarcinoma phenotype, expressing genes that are associated with a NE phenotype and genes downstream of the AR. Furthermore, the identification of CHGA+/SYP+/AR+ cells with apocrine expression of secreted proteins (e.g. SCG3) suggests that the cells are retaining a polarized secretory phenotype, while secreting NE secretory products in addition to PSA, etc. We hypothesize that the expression of active SRRM4 could be sufficient to promote this phenotype by blocking the activity of REST. This raises the question: Is the CHGA+/SYP+/AR+ phenotype a sheep in wolfs’ clothing i.e. since genes downstream of the AR are present in these cells, it is possible that these cells will still respond to ADT? This still remains to be elucidated.
Based on the GSEA, similar to the CHGA+/SYP+/AR+ phenotype, the CHGA+/SYP+/AR− phenotype expressed genes are usually repressed by REST. However, a considerable number of additional transcription factors and downstream genes were transcribed in the AR− phenotype. This indicates that these tumors will not respond to ADT and further suggests that these tumors have a more NE-like phenotype.
With the advent of total androgen blockade for the treatment of metastatic PCa the suggestion has been made that there could be a significant increase in the number of patients with NE disease (32). The biospecimens used from 50 patients in our study were from 1998–2008. Even during this time period with the limited repertoire of primary and secondary hormonal treatments, we see the emergence of the NE phenotype in these patients. Whether longer and more aggressive hormonal therapy will lead to a greater propensity for the evolution of NE tumors from adenocarcinoma with a greater proportion of NE metastases in a patient remains to be seen. However, it should be recognized that some patients who have metastases with the CHGA+/SYP+/AR+ phenotype may still respond to ADT. Moreover, while a patient may have a population of CHGA+/SYP+/AR− metastasis, it cannot be assumed that all metastases in that patient are CHGA+/SYP+/AR−.
It has been suggested for some time that REST plays a role in the emergence of the NE phenotype in CRPC. However, while the loss of REST has been associated with the loss of AR activity, hypoxia, and IL6 expression (33–35), this was not always evident in our sample-set given the continued expression of REST in some NE tumors (36). SRRM4 promotes alternative splicing and inclusion of neural-specific exons (11). We have shown that the expression of SRRM4 is associated with the NE phenotype in CRPC metastases, and that the splicing of REST occurs in our AR− NE PDX models. The splicing in of 62bp into REST mRNA thereby inactivating REST could explain our results but it does not preclude the fact that in some cases the loss of REST activity alone (through repression, methylation, mutation, genomic rearrangement, or loss), rather than the expression of SRRM4 in CRPC could result in development of the NE phenotype.
We are aware of limitations to our study, including small sample size and a lack of functional data to show that SRRM4 can drive CHGA and SYP expression in CRPC metastases. Additionally, based on our analyses we cannot make any conclusions as to why there is a loss of AR in some CHGA+/SYP+ metastases and not others. Finally, we arbitrarily classified tumors as NE if the metastasis had >30% CHGA and SYP positive cells. It has been suggested that the presence of NE cells can affect tumor biology and outcomes (37). Therefore, it is possible that in those metastases where NE cells were present, but the percentage of cells was <30%, secretion of NE factors into the microenvironment could influence the behavior of the cells with an adenocarcinoma phenotype.
In conclusion, we hypothesize that the evolution of adenocarcinoma from a hormone-sensitive state to a castration-resistant NE phenotype is associated with the loss of REST or of REST repressor activity due to alternate splicing by SRRM4. Yet unknown, is whether AR+ NE metastases will respond to new androgen deprivation therapies and what triggers the loss of AR expression in NE tumors.
Supplementary Material
Translational Relevance.
With the advent of total androgen blockade for the treatment of metastatic prostate cancer (PCa) there could be a significant increase in the number of patients with neuroendocrine (NE) disease. To treat patients with NE disease we need to understand the molecular basis for the emergence of NE disease in castrate resistant prostate cancer (CRPC), and identify targets associated with NE disease. This study highlights: (1) an increase in the NE phenotype in CRPC relative to primary PCa, (2) that chromogranin A and synaptophysin positive CRPC metastases can be androgen receptor positive and androgen receptor negative, representing different molecular phenotypes, and (3) that patients can have metastases with NE features and adenocarcinoma. Furthermore, our findings suggest that the evolution of adenocarcinoma from a hormone-sensitive state to a castration-resistant NE phenotype is associated with the loss of REST or of REST repressor activity due to alternate splicing by SRRM4.
Acknowledgements
We would like to thank the patients and their families who were willing to participate in the Prostate Cancer Donor Program, for without them research of this nature would not be possible. We would also like to thank Khanhthy Doan, Jennifer Noteboom, Roger Coleman, Belinda Nghiem, Funda Vakar-Lopez, Beatrice Knudsen, Evan Yu, Elahe Mostaghel, Heather Cheng and the rapid autopsy teams in the Urology Department at the University of Washington.
Funding: This material is the result of work supported by resources from the VA Puget Sound Health Care System, Seattle, Washington (RLV is a Research Career Scientist, PHL is a Staff Physician), the Institute for Prostate Cancer Research, the Pacific Northwest Prostate Cancer SPORE (P50CA97186), the NIH grant (PO1CA085859), the Richard M. LUCAS Foundation and the Prostate Cancer Foundation. CM is a recipient of a Career Development Award from Jim and Cathrine Allchin.
Footnotes
Conflicts of Interest: None
Reference List
- 1.Aprikian AG, Cordon-Cardo C, Fair WR, Reuter VE. Characterization of neuroendocrine differentiation in human benign prostate and prostatic adenocarcinoma. Cancer. 1993;71:3952–3965. doi: 10.1002/1097-0142(19930615)71:12<3952::aid-cncr2820711226>3.0.co;2-x. [DOI] [PubMed] [Google Scholar]
- 2.Vashchenko N, Abrahamsson PA. Neuroendocrine differentiation in prostate cancer: implications for new treatment modalities. Eur Urol. 2005;47:147–155. doi: 10.1016/j.eururo.2004.09.007. [DOI] [PubMed] [Google Scholar]
- 3.Abrahamsson PA. Neuroendocrine cells in tumour growth of the prostate. Endocr Relat Cancer. 1999;6:503–519. doi: 10.1677/erc.0.0060503. [DOI] [PubMed] [Google Scholar]
- 4.di Sant'Agnese PA. Neuroendocrine cells of the prostate and neuroendocrine differentiation in prostatic carcinoma: a review of morphologic aspects. Urology. 1998;51:121–124. doi: 10.1016/s0090-4295(98)00064-8. [DOI] [PubMed] [Google Scholar]
- 5.Komiya A, Yasuda K, Watanabe A, Fujiuchi Y, Tsuzuki T, Fuse H. The prognostic significance of loss of the androgen receptor and neuroendocrine differentiation in prostate biopsy specimens among castration-resistant prostate cancer patients. Mol Clin Oncol. 2013;1:257–262. doi: 10.3892/mco.2013.69. [DOI] [PMC free article] [PubMed] [Google Scholar]
- 6.McWilliam LJ, Manson C, George NJ. Neuroendocrine differentiation and prognosis in prostatic adenocarcinoma. Br J Urol. 1997;80:287–290. doi: 10.1046/j.1464-410x.1997.00300.x. [DOI] [PubMed] [Google Scholar]
- 7.di Sant'Agnese PA, Cockett AT. Neuroendocrine differentiation in prostatic malignancy. Cancer. 1996;78:357–361. doi: 10.1002/(SICI)1097-0142(19960715)78:2<357::AID-CNCR27>3.0.CO;2-U. [DOI] [PubMed] [Google Scholar]
- 8.Aprikian AG, Cordon-Cardo C, Fair WR, Zhang ZF, Bazinet M, Hamdy SM, et al. Neuroendocrine differentiation in metastatic prostatic adenocarcinoma. J Urol. 1994;151:914–919. doi: 10.1016/s0022-5347(17)35121-2. [DOI] [PubMed] [Google Scholar]
- 9.Perrot V. Neuroendocrine differentiation in the progression of prostate cancer: an update on recent developments. Open Journal of Urology. 2012;2:173–182. [Google Scholar]
- 10.Nelson EC, Cambio AJ, Yang JC, Ok JH, Lara PN, Jr, Evans CP. Clinical implications of neuroendocrine differentiation in prostate cancer. Prostate Cancer Prostatic Dis. 2007;10:6–14. doi: 10.1038/sj.pcan.4500922. [DOI] [PubMed] [Google Scholar]
- 11.Raj B, O'Hanlon D, Vessey JP, Pan Q, Ray D, Buckley NJ, et al. Cross-regulation between an alternative splicing activator and a transcription repressor controls neurogenesis. Mol Cell. 2011;43:843–850. doi: 10.1016/j.molcel.2011.08.014. [DOI] [PubMed] [Google Scholar]
- 12.Bruce AW, Donaldson IJ, Wood IC, Yerbury SA, Sadowski MI, Chapman M, et al. Genome-wide analysis of repressor element 1 silencing transcription factor/neuron-restrictive silencing factor (REST/NRSF) target genes. Proc Natl Acad Sci U S A. 2004;101:10458–10463. doi: 10.1073/pnas.0401827101. [DOI] [PMC free article] [PubMed] [Google Scholar]
- 13.Morrissey C, Roudier MP, Dowell A, True LD, Ketchanji M, Welty C, et al. Effects of androgen deprivation therapy and bisphosphonate treatment on bone in patients with metastatic castration-resistant prostate cancer: results from the University of Washington Rapid Autopsy Series. J Bone Miner Res. 2013;28:333–340. doi: 10.1002/jbmr.1749. [DOI] [PMC free article] [PubMed] [Google Scholar]
- 14.Corey E, Quinn JE, Buhler KR, Nelson PS, Macoska JA, True LD, et al. LuCaP 35: a new model of prostate cancer progression to androgen independence. Prostate. 2003;55:239–246. doi: 10.1002/pros.10198. [DOI] [PubMed] [Google Scholar]
- 15.Sharma A, Yeow WS, Ertel A, Coleman I, Clegg N, Thangavel C, et al. The retinoblastoma tumor suppressor controls androgen signaling and human prostate cancer progression. J Clin Invest. 2010;120:4478–4492. doi: 10.1172/JCI44239. [DOI] [PMC free article] [PubMed] [Google Scholar]
- 16.Subramanian A, Tamayo P, Mootha VK, Mukherjee S, Ebert BL, Gillette MA, et al. Gene set enrichment analysis: a knowledge-based approach for interpreting genome-wide expression profiles. Proc Natl Acad Sci U S A. 2005;102:15545–15550. doi: 10.1073/pnas.0506580102. [DOI] [PMC free article] [PubMed] [Google Scholar]
- 17.Tusher VG, Tibshirani R, Chu G. Significance analysis of microarrays applied to the ionizing radiation response. Proc Natl Acad Sci U S A. 2001;98:5116–5121. doi: 10.1073/pnas.091062498. [DOI] [PMC free article] [PubMed] [Google Scholar]
- 18.Goulburn AL, Alden D, Davis RP, Micallef SJ, Ng ES, Yu QC, et al. A targeted NKX2.1 human embryonic stem cell reporter line enables identification of human basal forebrain derivatives. Stem Cells. 2011;29:462–473. doi: 10.1002/stem.587. [DOI] [PubMed] [Google Scholar]
- 19.Isogai E, Ohira M, Ozaki T, Oba S, Nakamura Y, Nakagawara A. Oncogenic LMO3 collaborates with HEN2 to enhance neuroblastoma cell growth through transactivation of Mash1. PLoS One. 2011;6:e19297. doi: 10.1371/journal.pone.0019297. [DOI] [PMC free article] [PubMed] [Google Scholar]
- 20.Zhu J, Garcia-Barcelo MM, Tam PK, Lui VC. HOXB5 cooperates with NKX2-1 in the transcription of human RET. PLoS One. 2011;6:e20815. doi: 10.1371/journal.pone.0020815. [DOI] [PMC free article] [PubMed] [Google Scholar]
- 21.Clegg N, Ferguson C, True LD, Arnold H, Moorman A, Quinn JE, et al. Molecular characterization of prostatic small-cell neuroendocrine carcinoma. Prostate. 2003;55:55–64. doi: 10.1002/pros.10217. [DOI] [PubMed] [Google Scholar]
- 22.Ball DW. Achaete-scute homolog-1 and Notch in lung neuroendocrine development and cancer. Cancer Lett. 2004;204:159–169. doi: 10.1016/S0304-3835(03)00452-X. [DOI] [PubMed] [Google Scholar]
- 23.Gupta A, Yu X, Case T, Paul M, Shen MM, Kaestner KH, et al. Mash1 expression is induced in neuroendocrine prostate cancer upon the loss of Foxa2. Prostate. 2013;73:582–589. doi: 10.1002/pros.22598. [DOI] [PMC free article] [PubMed] [Google Scholar]
- 24.Mirosevich J, Gao N, Gupta A, Shappell SB, Jove R, Matusik RJ. Expression and role of Foxa proteins in prostate cancer. Prostate. 2006;66:1013–1028. doi: 10.1002/pros.20299. [DOI] [PubMed] [Google Scholar]
- 25.Hu Y, Wang T, Stormo GD, Gordon JI. RNA interference of achaete-scute homolog 1 in mouse prostate neuroendocrine cells reveals its gene targets and DNA binding sites. Proc Natl Acad Sci U S A. 2004;101:5559–5564. doi: 10.1073/pnas.0306988101. [DOI] [PMC free article] [PubMed] [Google Scholar]
- 26.Somasundaram K, Reddy SP, Vinnakota K, Britto R, Subbarayan M, Nambiar S, et al. Upregulation of ASCL1 and inhibition of Notch signaling pathway characterize progressive astrocytoma. Oncogene. 2005;24:7073–7083. doi: 10.1038/sj.onc.1208865. [DOI] [PubMed] [Google Scholar]
- 27.True LD, Buhler K, Quinn J, Williams E, Nelson PS, Clegg N, et al. A neuroendocrine/small cell prostate carcinoma xenograft-LuCaP 49. Am J Pathol. 2002;161:705–715. doi: 10.1016/S0002-9440(10)64226-5. [DOI] [PMC free article] [PubMed] [Google Scholar]
- 28.Calarco JA, Superina S, O'Hanlon D, Gabut M, Raj B, Pan Q, et al. Regulation of vertebrate nervous system alternative splicing and development by an SR-related protein. Cell. 2009;138:898–910. doi: 10.1016/j.cell.2009.06.012. [DOI] [PubMed] [Google Scholar]
- 29.Epstein JI, Amin MB, Beltran H, Lotan TL, Mosquera JM, Reuter VE, et al. Proposed morphologic classification of prostate cancer with neuroendocrine differentiation. Am J Surg Pathol. 2014;38:756–767. doi: 10.1097/PAS.0000000000000208. [DOI] [PMC free article] [PubMed] [Google Scholar]
- 30.Zhang T, Armstrong AJ. Clinical phenotypes of castration-resistant prostate cancer. Clin Adv Hematol Oncol. 2013;11:707–718. [PubMed] [Google Scholar]
- 31.Terry S, Beltran H. The Many Faces of Neuroendocrine Differentiation in Prostate Cancer Progression. Front Oncol. 2014;4:60. doi: 10.3389/fonc.2014.00060. [DOI] [PMC free article] [PubMed] [Google Scholar]
- 32.Beltran H, Tomlins S, Aparicio A, Arora V, Rickman D, Ayala G, et al. Aggressive variants of castration-resistant prostate cancer. Clin Cancer Res. 2014;20:2846–2850. doi: 10.1158/1078-0432.CCR-13-3309. [DOI] [PMC free article] [PubMed] [Google Scholar]
- 33.Svensson C, Ceder J, Iglesias-Gato D, Chuan YC, Pang ST, Bjartell A, et al. REST mediates androgen receptor actions on gene repression and predicts early recurrence of prostate cancer. Nucleic Acids Res. 2014;42:999–1015. doi: 10.1093/nar/gkt921. [DOI] [PMC free article] [PubMed] [Google Scholar]
- 34.Liang H, Studach L, Hullinger RL, Xie J, Andrisani OM. Down-regulation of RE-1 silencing transcription factor (REST) in advanced prostate cancer by hypoxia-induced miR-106b~25. Exp Cell Res. 2014;320:188–199. doi: 10.1016/j.yexcr.2013.09.020. [DOI] [PMC free article] [PubMed] [Google Scholar]
- 35.Zhu Y, Liu C, Cui Y, Nadiminty N, Lou W, Gao AC. Interleukin-6 induces neuroendocrine differentiation (NED) through suppression of RE-1 silencing transcription factor (REST) Prostate. 2014 doi: 10.1002/pros.22819. [DOI] [PubMed] [Google Scholar]
- 36.Lapuk AV, Wu C, Wyatt AW, McPherson A, McConeghy BJ, Brahmbhatt S, et al. From sequence to molecular pathology, and a mechanism driving the neuroendocrine phenotype in prostate cancer. J Pathol. 2012;227:286–297. doi: 10.1002/path.4047. [DOI] [PMC free article] [PubMed] [Google Scholar]
- 37.Krauss DJ, Hayek S, Amin M, Ye H, Kestin LL, Zadora S, et al. Prognostic significance of neuroendocrine differentiation in patients with Gleason score 8–10 prostate cancer treated with primary radiotherapy. Int J Radiat Oncol Biol Phys. 2011;81:e119–e125. doi: 10.1016/j.ijrobp.2010.12.064. [DOI] [PubMed] [Google Scholar]
Associated Data
This section collects any data citations, data availability statements, or supplementary materials included in this article.