

Summary
Autism (ASD) is vastly heterogeneous, particularly in early language development. While ASD language trajectories in the first years of life are highly unstable, by early childhood these trajectories stabilize and are predictive of longer-term outcome. Early neural substrates that predict/precede such outcomes are largely unknown but could have considerable translational and clinical impact. Pre-diagnosis fMRI response to speech in ASD toddlers with relatively good language outcome was highly similar to non-ASD comparison groups and robustly recruited language-sensitive superior temporal cortices. In contrast, language-sensitive superior temporal cortices were hypoactive in ASD toddlers with poor language outcome. Brain-behavioral relationships were atypically reversed in ASD and a multimodal combination of pre-diagnostic clinical behavioral measures and speech-related fMRI response showed the most promise as an ASD prognosis classifier. Thus, before ASD diagnoses and outcome become clinically clear, distinct functional neuroimaging phenotypes are already present that can shed insight on an ASD toddler’s later outcome.
Introduction
There is an absence of neurobiological explanations for why infants and toddlers with autism spectrum disorders (ASD) can have strikingly different clinical outcomes. One primary reason for this absence is the large degree of heterogeneity manifested in both the early clinical phenotype and in the likely underlying causes for different subtypes of autism (Geschwind and Levitt, 2007). Underscoring phenotypic behavioral heterogeneity in early development, there is no better example than variability in early language development (Anderson et al., 2007; Kjelgaard and Tager-Flusberg, 2001; Pickles et al., 2014). Some individuals with ASD are minimally verbal throughout life and display high levels of symptom severity and poor clinical outcome (Tager-Flusberg and Kasari, 2013). In contrast, others display delayed or typical early language development and may have relatively more positive clinical outcome (Fein et al., 2013). The neurodevelopmental bases for this variability in clinical outcomes are unknown. Differences in treatment quantity have not accounted for such variability. For example, in one of the first studies of applied behavioral analysis (ABA) intervention where treatment quantity and type were largely standardized across participants, 50% of individuals achieved typical school placement and IQ scores within the normal range following treatment, while the remainder did not (Lovaas, 1987). Overall, variable response to treatment has been reported for all evidence-based approaches available for ASD children (Bacon et al., 2014). While pre-treatment language (Perry et al., 2011), and other nonverbal cognitive abilities (McEachin et al., 1993) are often predictors of treatment success, this relationship is not always straightforward (Eapen et al., 2013). Lord and colleagues (Lord et al., 2012) recently concluded that ‘intrinsic’ biological factors (i.e. different biological factors underlying ASD subgroups with different clinical course) might better explain variable clinical change, although such biological explanations have yet to be identified.
Given both the widespread heterogeneity in early language development (Anderson et al., 2007; Kjelgaard and Tager-Flusberg, 2001; Pickles et al., 2014) and its importance in relation to core trajectories of symptom severity (Gotham et al., 2012), alongside the predictive power of early language levels on later outcomes (Bennett et al., 2008; Billstedt et al., 2005; Gillberg and Steffenburg, 1987; Gotham et al., 2012; Howlin, 2003; Howlin et al., 2000; Howlin et al., 2014; Szatmari et al., 2009; Szatmari et al., 2003; Szatmari et al., 2000; Ventner et al., 1992), it is important for the field to develop ways in which the ASD population could be stratified into plausible and clinically-relevant neurodevelopmental subtypes. Taking this stratification approach would help to accelerate the translational process from discovery of novel biological markers to ways in which better treatments could be developed and individualized to specific phenotypes (Kapur et al., 2012).
No developmental studies of biomarkers for early language heterogeneity in ASD have been designed to address this major issue. Existing natural sleep fMRI studies have found that 2 to 3 year old ASD toddlers as a whole differ on average from TD toddlers in atypical speech-related lateralization of superior temporal cortex (Eyler et al., 2012; Redcay and Courchesne, 2008) and reduced inter-hemispheric synchrony (Dinstein et al., 2011). While these early studies established the potential power of natural sleep fMRI to pinpoint early speech-related processing differences in superior temporal cortical regions, they fall short in addressing critical questions about heterogeneity within ASD with regard to early language development and outcome. That is, past studies have not employed analyses and designs capable of detecting different neural subtypes within ASD that underlie and help explain differing developmental language trajectories and outcomes. Past studies have also not studied predictive power at the individual level with respect to prognosis and have not systematically studied how such individual level variation in large-scale speech-related neural systems response varies with an individual’s level of change in early developing language ability. Finally, existing work has not yet tested whether any such neurofunctional abnormalities within ASD are specific to an ASD subtype or whether they are shared by a non-ASD clinical comparison group with significant early language or general developmental delays.
In the present study we have gone further to address each of these critical questions. We combined both (a) prospective fMRI measurement of neural systems response to speech during our natural sleep fMRI language paradigm (Eyler et al., 2012; Redcay and Courchesne, 2008) at the earliest ages at which risk for ASD can be clinically detected in the general pediatric population with (b) contemporaneous and comprehensive longitudinal diagnostic and clinical assessments to evaluate diagnostic outcome and characterize language level by 3–4 years of age. Infants and toddlers were recruited using a combination of the 1-Year-Well-Baby Check-Up approach (Pierce et al., 2011) as well as community referral. The natural sleep fMRI language paradigm employed in this study was identical to that used in our previously published studies (Eyler et al., 2012; Redcay and Courchesne, 2008) and used three types of stimuli (i.e. complex forward speech, simple forward speech, and backward speech) including rest blocks, to reduce habituation (more information on the procedure for sleep-fMRI scanning as well as data acquisition and analysis details can be found in the Supplemental Materials). Cohorts of age- and sex-matched infants and toddlers (aged 12–48 months) with ASD (n=60), non-ASD language/developmentally delayed individuals (LD/DD; n=19) and typically developing individuals (TD; n=24) participated. Early language development was characterized longitudinally approximately every 6 months from clinical intake, and outcome was determined from a follow-up assessment in early childhood, on-average 1 year after the original fMRI scanning session. Within the ASD group, we identified individuals with poor language outcome in early childhood (‘ASD Poor’, n=24) who had outcome receptive (RL) and expressive (EL) language T-scores on the Mullen Scales of Early Learning that were below 1 standard deviation of the norm (i.e. T<40). A second subgroup was identified that had relatively better language outcome in early childhood (‘ASD Good’, n=36) with EL or RL scores at outcome greater than 1 standard deviation below the norm (i.e. T ≥ 40). See Table S1 and Supplementary Methods for more on characterization of the sample.
Results
Behavioral Characterization of Development
Longitudinal assessments of language, non-verbal, and autism symptom development were made approximately every 6 months from initial clinical intake to an individual’s last outcome assessment. Developmental trajectories were characterized at the group level after taking into account individual-level effects using linear mixed-effect models. Across T-scores for Mullen EL and RL subscales, we observed null or trend-level main effects for Age (EL: F = 0.0803, p = 0.77; RL: F = 3.38, p = 0.06), but found highly significant main effects of Group (EL: F = 39.01, p < 0.0001; RL: F = 26.72, p < 0.0001) and significant or trend-level Group x Age interactions (EL: F = 8.43, p = 0.0042; RL: F = 3.71, p = 0.055). Bonferroni-corrected post-hoc comparisons showed that the main effects of Group were driven by differentiation on every pairwise comparison, where a gradient across groups was observed of TD with the best language scores, followed by ASD Good, LD/DD, and ASD Poor. An exception to this was similar RL levels for LD/DD and ASD Good. For both EL and RL, the Group x Age interactions were solely driven by ASD Poor’s declining trajectory differing from all other groups, though the statistical significance for RL was at a nominally significant level (e.g., p<0.02) (Table S2, Fig 1A–B). Because we are using Mullen T-scores, declining trajectories in ASD Poor should be interpreted as individuals falling further and further behind age-appropriate norms, rather than as loss of skills over development.
Fig. 1. Developmental trajectories for language, non-verbal cognitive, or autism symptom measures.

This figure shows developmental trajectories for all groups (TD, red; LD/DD, green; ASD Good, blue; ASD Poor, purple) on the Mullen expressive language (EL) (A), receptive language (RL) (B), visual reception (VR) (C) subscales, and the Autism Diagnostic Observation Schedule (ADOS). Plots show the group-level trajectory (solid line) estimated from mixed-effect modeling after taking into account individual-level trajectories (dotted lines, unfilled circles). The colored bands indicate the 95% confidence band around the group-level trajectory.
In terms of trajectories of autism symptom severity measured by the ADOS, we found a main effect of Group (F = 11.35, p = 0.0011), but no main effect of Age (F = 0.536, p = 0.46) or Group x Age interaction (F = 1.75, p = 0.18). Bonferroni-corrected post-hoc comparisons showed that all groups were differentiated from each other, with a gradient of ASD Poor with the most elevated ADOS scores, followed by ASD Good, LD/DD, and TD. Furthermore, the LD/DD group showed a decreasing trajectory over time, and this decreasing slope was significantly different from all other groups, where the trajectories were relatively stable or slightly increasing over time (Table S2, Fig 1D).
Similar types of results were also observed on the non-verbal subscales of the Mullen (i.e. visual reception, fine motor) and the Vineland Adaptive Behavior Scales; a parental clinical interview measure of abilities in everyday settings (Fig 1C, Table S2, Fig S1). This is expected, given past research documenting correlations between early developmental clinical assessment measures for autism such as the Mullen, Vineland, and ADOS (Ellis Weismer et al., 2010). In this study we replicated this correlational structure at intake and outcome time-points (Fig S2). Furthermore, with longitudinal data, we additionally found that individual-level trajectories over development were substantially correlated within and to a lesser degree, across measures such as the Mullen and Vineland. However, ADOS trajectories were largely not associated with trajectories on the Mullen or Vineland (Fig S2).
Neuroimaging Results
Given the behavioral evidence for early differentiation of ASD Good versus Poor subgroups, we next asked the question of whether the neural systems responsible for early language development would show any differentiation in response to speech stimulation. The canonical neural systems responsible for language in the typically developing brain are well known in adulthood (Hickok and Poeppel, 2007) and are also observed in infancy and toddlerhood (Dehaene-Lambertz et al., 2002; Dehaene-Lambertz et al., 2006). To illustrate these ‘canonical’ neural systems, we extracted a meta-analysis map from the NeuroSynth database (www.neurosynth.org) (Yarkoni et al., 2011) of 725 studies associated with the feature ‘language’ (Fig 2E). This map shows involvement primarily within large clusters in bilateral lateral frontal and superior temporal cortex. Visually, the within-group all speech vs rest activation maps from all groups except ASD Poor appear very similar to the NeuroSynth language map, particularly in temporal and parietal cortex. TD, ASD Good and LD/DD groups showed activation broadly distributed across perisylvian temporo-parietal areas such as planum polare, planum temporale, anterior, middle and posterior superior temporal sulcus and gyrus, Heschl’s gyrus, middle temporal gyrus, and inferior temporal sulcus as well as in angular gyrus, supramarginal gyrus, intraparietal sulcus, and inferior parietal lobule/parietal operculum (Fig 2E). In contrast, the ASD Poor group showed no left hemisphere recruitment and within right hemisphere recruited patches mainly in inferior parietal lobule, planum temporale/Heschl’s gyrus, intraparietal sulcus, and superior and lateral occipital cortex (Fig 2E). At very liberal whole-brain uncorrected thresholds (p<0.05), the only activation within ASD Poor left hemisphere superior temporal cortex was a small cluster overlapping with primary auditory cortex (Fig S3).
Fig. 2. Functional neural abnormalities in autism with poor language outcome and development.

Panels A–D show the difference in BOLD percent signal change for the contrast of all speech conditions versus rest for meta-analytically defined canonical neural systems for language. Errorbars represent 95% confidence intervals. Panel E (top row) shows the full spatial extent of the NeuroSynth ‘language’ meta-analysis map along with activation observed at a whole-brain corrected level (FDR q<0.05) within each group individually. The second to last row of panel E shows the whole-brain analysis for the specific contrast of All Other Groups > ASD Poor. The last row of panel E shows the conjunction overlap between the NeuroSynth ‘language’ map and the whole-brain contrast of All Other Groups > ASD Poor. In all panels the coloring across groups is red = TD, green = LD/DD, blue = ASD Good, and purple = ASD Poor.
In order to test for between-group differences in activation strength within canonical neural systems for language we first looked specifically at the lateral frontal and temporal cortex regions defined by the NeuroSynth ‘language’ meta-analysis map. ANCOVAs, covarying for mean framewise displacement (Yan et al., 2013) and age at scanning, revealed significant group-differences only within left hemisphere superior temporal cortex (F(3,97) = 4.88, p = 0.003, partial η2 = 0.131) (Fig 2A), although the effect size in right hemisphere superior temporal cortex (F(3,97) = 2.43, p = 0.069, partial η2 = 0.07) (Fig 2B) suggests a similar trend. In contrast, no between-group difference was apparent in frontal cortex either in the right (F(3,97) = 1.94, p = 0.12, partial η2 = 0.057) or left hemisphere (F(3,97) = 0.37, p = 0.76, partial η2 = 0.012) (Fig 2C–D). Dot plots showing individual data points are presented in Fig S4A–D. Bonferroni-corrected post-hoc comparisons decomposing the between-group difference in left hemisphere temporal cortex clearly showed hypoactivation in ASD Poor compared to all other groups (TD vs ASD Poor: Cohen’s d = 0.85, p = 0.014; ASD Good vs ASD Poor: Cohen’s d = 0.94, p = 0.016; LD/DD vs ASD Poor: Cohen’s d = 1.04, p = 0.011; all other comparisons: Cohen’s d < 0.14, p = 1). Confirming that these results are specific to language outcome as the critical variable, we re-ran ANCOVAs while also covarying for Mullen VR scores in order to control for general non-verbal cognitive deficits in the ASD Poor group, and found similar results (F(3,93) = 3.84, p = 0.012, partial η2 = 0.11; TD vs ASD Poor: p = 0.073; ASD Good vs ASD Poor: p = 0.047; LD/DD vs ASD Poor: p = 0.01). All other ROIs remained non-significant after including Mullen VR as a covariate (Table S3). These results also remain the same in further motion control analyses where no individual exhibited mean framewise displacement greater than 0.1mm (Table S3 and Fig S5). Finally, we additionally ran Welch’s ANOVAs to guard against violations of homogeneity of variance, which were present only for RH temporal (Levene’s Test, F(3,99) = 3.19, p = 0.02) and RH frontal cortex (Levene’s Test, F(3,99) = 3.21, p = 0.02). The effect in RH temporal cortex became statistically significant (F(3,44.72) = 3.17, p = 0.03), while the RH frontal cortex showed a trend level effect (F(3,48.30) = 2.58, p = 0.06).
Further confirmation of hypoactivation in the ASD Poor subgroup comes from whole-brain between-group analyses. Bilateral temporal cortex was significantly hypoactive in ASD Poor compared to all other groups (LH cluster: MNI x = −54, y = −33, z = 4, t(97) = 4.52, pFDR = 0.011, k = 645; RH cluster: MNI x = 42, y = −41, z = 8, t(97) = 3.57, pFDR = 0.056, k = 374) and these clusters spanned language-related perisylvian areas such as planum polare, planum temporale, anterior, middle and posterior superior temporal sulcus and gyrus, Heschl’s gyrus, middle temporal gyrus, and inferior temporal sulcus (Fig 2E). The conjunction overlap (Nichols et al., 2005) of this whole-brain analysis with the NeuroSynth ‘language’ meta-analysis map was considerable in bilateral superior temporal cortex (Fig 2E). Further whole-brain analyses specifically comparing TD, ASD Good, and LD/DD groups against each other yielded no significant differences.
Next, we quantitatively assessed multi-voxel pattern similarity (Kriegeskorte et al., 2008a; Kriegeskorte et al., 2008b) for two specific aims. First we wanted to assess how similar were each group’s second-level activation maps to each other. These analyses show that TD, ASD Good, and LD/DD activation maps are all markedly similar within voxels defined by the NeuroSynth language map. In contrast, ASD Poor stands alone with markedly less similarity to all other groups (all p < 5.63 × 10⁻¹⁴) (Fig 3A, Table S4). This separation between ASD Poor and all other groups can be better visualized in Fig 3B after multidimensional scaling.
Fig. 3. Multi-Voxel Pattern Similarity Analyses.

Panels A and B show pattern similarity analyses comparing each group’s second-level group activation maps (i.e. t-statistic maps) with all other groups. These analyses were conducted only on voxels defined based on the NeuroSynth language map (i.e. voxels that passed FDR q<0.01). Panel A shows the similarity matrix (i.e. Pearson correlations) comparing each group’s second-level activation map with every other group. Higher values closer to 1 indicate more pattern similarity, while values closer to 0 indicate no pattern similarity across voxels. The correlation matrix in panel A was converted into a dissimilarity matrix (i.e. 1-r) and entered into canonical multidimensional scaling to reduce the matrix to 2-dimensions (i.e. MDS1 and MDS2) for the purposes of visualization of the separation between ASD Poor and all other groups (panel B). Panels C and D show results of analyses comparing individual subject activation maps (i.e. t-statistic maps) to specific NeuroSynth maps for either ‘Language AND Speech’ or ‘Auditory AND NOT (Language OR Speech)’. Errorbars represent 95% confidence intervals. In all panels the coloring across groups is red = TD, green = LD/DD, blue = ASD Good, and purple = ASD Poor.
Second, because some studies report processing abnormalities in primary auditory pathways in ASD (Dinstein et al., 2012; Haigh et al., 2014), we assessed whether the activation patterns observed across individuals in this study were similar to meta-analytically defined activation patterns that are characteristic for general auditory processing outside the domain of language or speech, or for activation patterns that are associated with language and speech. To meta-analytically isolate activation patterns for each, we used NeuroSynth to retrieve and run a meta-analysis on studies associated with specific queries. For general auditory processing outside the domain of language or speech, we retrieved all studies associated with the term ‘auditory’, and excluded any studies that were associated with ‘language’ or ‘speech’ (e.g., ‘Auditory AND NOT (Language OR Speech)’; n = 601 studies). For activation patterns that are associated specifically with language and speech, we ran a meta-analysis on all studies in NeuroSynth associated with both the terms ‘language’ and ‘speech’ (e.g., ‘Language AND Speech’; n = 145 studies). By assessing pattern similarity with these two NeuroSynth maps, we could evaluate the hypothesis of whether any such abnormalities in ASD Poor are common to general auditory and language/speech processing, or whether their abnormalities are specific to either. For ‘Language AND Speech’ we found markedly less similarity in ASD Poor compared to all other groups (F(3,97) = 3.71, p = 0.014, partial η2 = 0.10) (Fig 3C). TD, LD/DD and ASD Good all showed pattern similarity significantly above 0 (TD, t(23) = 3.34, p = 0.002, Cohen’s d = 0.68; LD/DD, t(18) = 3.34, p = 0.003, Cohen’s d = 0.78; ASD Good, t(35) = 4.71, p = 3.76 × 10⁻⁵, Cohen’s d = 0.78), whereas ASD Poor shows no sign of statistically significant similarity with the Language AND Speech meta-analysis map (t(23) = −0.39, p = 0.69, Cohen’s d = 0.08). In contrast, for activation patterns for general auditory processing outside the domain of language or speech (e.g., Auditory AND NOT (Language OR Speech)), we find no group-differentation in terms of pattern similarity (F(3,97) = 0.10, p = 0.95, partial η2 = 0.003 (Fig 3D). All groups show statistically significant similarity with these meta-analytically defined activation patterns for general auditory processing, and with ASD Poor possessing the biggest effect size (TD, t(23) = 3.15, p = 0.004, Cohen’s d = 0.64; LD/DD, t(18) = 3.22, p = 0.004, Cohen’s d = 0.73; ASD Good, t(35) = 5.13, p = 1.05 × 10⁻⁵, Cohen’s d = 0.85; ASD Poor, t(23) = 4.43, p = 0.0001, Cohen’s d = 0.90). Dot plots showing individual data points are shown in Fig S4E–F. These results show that activation patterns linked back to general auditory processing are intact across all groups including ASD Poor. In contrast, for activation patterns characteristic of language and speech, there is little multi-voxel pattern similarity on-average at the group level in ASD Poor and their pattern similarity was markedly reduced compared to all other groups.
Further analysis on the topic of general auditory processing was done by specifically examining activation response within a primary auditory cortex ROI. Here we did not find any significant differences between-groups in an ANCOVA (F(3,97) = 0.89, p = 0.44, partial η2 = 0.027). TD, LD/DD, and ASD Good all showed sizeable effect sizes for non-zero activation in this region (e.g., Cohen’s d > 0.54, one-tailed p < 0.006). For ASD Poor, a one-sample t-test shows that there is weak group-level activation at trend-level significance for being different from 0 (t(23) = 1.67, one-tailed p = 0.054, Cohen’s d = 0.33) (Fig S3; Table S4). Montages of single-subject analyses in ASD Poor, thresholded at liberal uncorrected levels in order to show any subtle extent of activation, demonstrate however, that this effect is not particularly robust at the level of individuals (Fig S3).
In contrast to analyses comparing all speech conditions to rest, we also compared forward versus backwards speech as a further higher-level contrast specific to intelligible speech processing. All analyses on this forward versus backward contrast yielded no significant differences in canonical neural systems for language processing (i.e. NeuroSynth temporal and frontal ROIs), either at the within-group or between-group level. Furthermore, whole-brain analyses additionally showed no evidence for differentiation of forward from backward speech in temporal or frontal areas. Rather, whole-brain analyses showed that only the TD group recruited areas in thalamus, retrosplenial, and occipital cortex significantly more for forward compared to backward speech. The sole recruitment of these areas in the TD group was also manifested in a significant between-group whole-brain analysis showing increased activation in TD compared all other groups (Table S3, Fig S6).
Multivariate Brain-Behavior Relationships at Intake and Outcome
Next, we looked at brain-behavior relationships between language-related behavioral measures (e.g., Mullen EL and RL subscales and the Vineland Communication subscale) at both intake and outcome time-points and neural contrast measured from the all speech vs rest contrast. To achieve these aims we used partial least-squares correlation (PLSC) analyses (Krishnan et al., 2011; McIntosh and Lobaugh, 2004). PLSC analysis is most appropriate for this particular aim, as the two datasets (i.e. brain and language-related behavioral measures) are both multivariate and show high degrees of correlation. For such situations, PLSC finds latent variable (LV) brain-behavioral pairings that maximally covary and which are uncorrelated with other brain-behavior LV pairs. PLSC also assesses the null hypothesis of whether the observed strength of brain-behavior relationships, noted by the singular value (d) for each LV pair, would emerge frequently under chance conditions (i.e. permutation test, 10,000 iterations) and can descriptively unveil how such multivariate brain-behavior relationships manifest as covariation patterns of distributed neural response and multivariate behavioral patterns (see (Krishnan et al., 2011) for primer on PLSC applied to neuroimaging).
PLSC highlighted one significant brain-behavior LV pair (LV1: d = 73.90, p = 0.031) which accounted for 29.60% of the covariance in the data. Brain regions that make the strongest contributions toward LV1 (Fig 4C–D) are split into two types. The first are regions shown in hot colors in Fig 4C–D and are generally located within ‘language’-related superior and inferior temporal cortices, anterior lateral and medial prefrontal cortex, subcortical regions in amygdala, hippocampus, and ventral striatum, as well as anterior cingulate and insular cortices. These brain regions all show a directionality of brain-behavioral correlations shown in Fig 4A; that is, gradient descent in correlation strength across groups, from robust positive correlations in TD, to less strong positive correlations in LD/DD, followed by weak negative correlations in ASD Good, and robust negative correlations in ASD Poor. The second set of regions shown in cool colors in Fig 4C–D are generally located within frontal and temporally-connected segments of the thalamus (Behrens et al., 2003), somatomotor-connected segments of cerebellar regions Crus IV and V (Buckner et al., 2011), supplementary and pre-supplementary motor areas (SMA; pre-SMA), motor and premotor cortices, and primary visual cortex. These brain regions all show a directionality of brain-behavioral correlations shown in Fig. 4B, which are the direct opposite of that shown in Fig 4A; that is, gradient ascent from robust negative correlations in TD, to weak negative correlations in LD/DD, followed by weak positive correlations in ASD Good, and robust positive correlations in ASD Poor. It is clear from these plots that there is a reversal in the directionality of brain-behavioral correlations in ASD subgroups compared to TD, with the strongest and most pervasive reversal apparent in the ASD Poor group. In ASD Good however, this atypical reversal was less severe when assessing the brain-outcome behavioral relationship and this may be indicative of a different developmental process emerging in ASD Good that allows such brain-behavioral relationships to approach those seen in LD/DD.
Fig. 4. Multivariate brain-behavioral relationship analyses.

This figure shows large-scale neural systems where all speech vs rest fMRI response covaries with multivariate behavioral patterns of variation in language ability measured at intake and outcome time-points. Partial least squares correlation analysis highlighted one significant brain-behavioral latent variable pair (LV1; d = 73.90, p = 0.031; 29.60% covariance explained) and the strength of brain-behavioral relationships for LV1 are shown in panels A–B, while the voxels that most robustly express such relationships are shown in panels C–D. Panel A depicts the directionality of brain-behavioral relationships for hot colored brain regions in panels C–D, while panel B depicts the directionality of brain-behavioral correlations for cool colored brain regions in panels C–D. Within the bar plots in panels A–B, bars are stratified by language measure (Mullen Expressive (EL) or Receptive (RL) language or Vineland Communication), and by the developmental time-point at which they were measured (e.g., intake or outcome assessment). Error bars indicate the 95% confidence intervals estimated from bootstrapping (10,000 resamples). The coloring of the bars indicate different groups (red = TD; green = LD/DD; blue = ASD Good; purple = ASD Poor). Stars above specific bars indicate where the brain-behavioral relationship is non-zero (i.e. 95% CIs do not encompass 0) and these are specific relationships that reliably contribute to the overall PLS relationship for LV1. The coloring in panels C–D reflect the bootstrap ratio (BSR) which is analogous to a pseudo z-statistic and can be interpreted accordingly. Only voxels in panels C–D with BSR values greater than 1.96 or less than −1.96 are shown, as these are the primary voxels showing the biggest contributions to the overall pattern being expressed by LV1. Abbreviations: BSR = bootstrap ratio; EL, Mullen Expressive Language; RL Mullen Receptive Language; ASD, autism spectrum disorder; TD, typical development; LD/DD, language/developmental delay.
Predicting Poor versus Good Language Prognosis within ASD
Finally, we asked the important clinical question of how information from behavioral and functional neuroimaging measures at pre-diagnostic ages (i.e. the earliest clinical intake time-point) could be used in the context of predicting poor versus good language prognosis within ASD. Our primary aim in this analysis was to assess the predictive power that fMRI data has at an individual level for classifying ASD Poor vs ASD Good compared to other early clinical behavioral measures or whether a multimodal combination of early clinical behavioral and fMRI data could provide a potentially more promising prognostic classifier. Here we used a partial least squares linear discriminant classifier with 5-fold cross validation to obtain estimates of performance when using various types of features, such as the ADOS at intake alone, clinical measures at intake alone (Mullen + Vineland + ADOS), fMRI alone (e.g., speech-related activation from the left hemisphere superior temporal cortex ROI derived from NeuroSynth), or a multimodal combination of clinical intake measures and fMRI. Comparing these different classifiers based on AUC values, we find that the multimodal combination of clinical intake measures plus left hemisphere superior temporal cortex activation outperformed all other classifiers (AUC = 81). Classifiers that used either ADOS alone, clinical intake measures alone, or fMRI alone performed similarly in terms of near identical AUC values (AUC ranging from 67 to 70) (see Fig 5).
Fig. 5. Prognostic classifier performance within ASD for models using clinical behavioral data, fMRI data or both at pre-diagnostic ages.
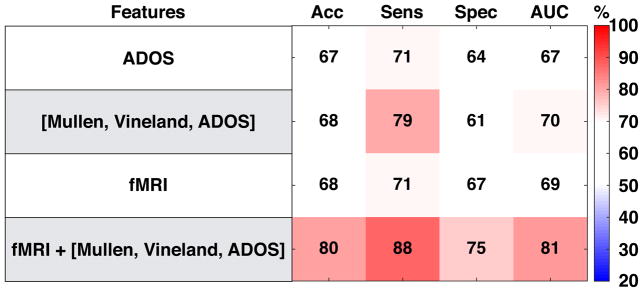
This figure shows the performance of 4 classifier models (i.e. partial least squares linear discriminant analyses) using different features for the purpose of distinguishing the ASD Poor from the ASD Good subgroup. All models using behavioral data (e.g., ADOS, Mullen, Vineland) utilize such information from the earliest clinical intake time-point. Information input into the fMRI classifier are percent signal change estimates from the all speech vs rest from all voxels within the NeuroSynth left hemisphere superior temporal cortex ROI. Abbreviations: Acc = Accuracy; Sens, Sensitivity; Spec, Specificity; AUC, area under the curve; ADOS, Autism Diagnostic Observation Schedule.
Discussion
In this study we discovered functional neuroimaging biomarkers underlying one of the theoretically and clinically most important areas of developmental heterogeneity in autism: early language development. Prior to this work, neurobiological explanations were lacking for why clinical courses in toddlers and young children with ASD are so heterogeneous, with some worsening and others improving with development. Here we have shown that subgrouping the ASD population based on early childhood language outcome represents a developmentally and neurobiologically meaningful way to parse this phenotypic heterogeneity and identify meaningful biological subtypes. Moreover, leveraging a rare and large sample size of toddlers from the general population, our study, for the first time, finds a strong relationship between levels of aberrance in speech-activation in language-critical superior temporal cortex and actual real-world language ability in ASD toddlers.
Developmentally, ASD subgroups defined in this study showed differential behavioral developmental trajectories of language growth over the first 4 years of life. ASD Poor individuals arrive at their poor outcome levels at 3–4 years through developmental trajectories from 12 months of age that indicative of fall further and further behind what is considered age-appropriate developmental progress. In contrast, ASD Good shows steady age-appropriate progress and slight improvement in language ability over time. These results are well aligned with other clinical studies looking at a much larger age range that show that >50% of ASD individuals have poor long-term language outcomes, while the remaining individuals have better long-term language outcomes (Anderson et al., 2007; Gotham et al., 2012; Pickles et al., 2014).
Neurally, ASD individuals with good language development and clinical outcome alongside typically developing and non-ASD language/developmentally delayed individuals, all showed intact speech-related response of language-relevant superior temporal cortical areas and in terms of multi-voxel activation patterning were also very similar. In striking contrast, ASD individuals with poor language development and outcome showed a lack functional differentiation in superior temporal cortex to speech stimuli and showed markedly less similarity in activation patterning compared to all other groups. Furthermore, in terms of activation patterning, ASD Poor showed relatively intact activation patterning related to general auditory processing, but showed much less activation pattern similarity that was specifically related to language and speech. This result point towards the interpretation that neural systems for general auditory processing are relatively intact in ASD Poor and that the abnormalities observed here are specific to language and speech-related neural systems dysfunction. Thus, the neural functional substrates of early language presentation and development in ASD are different for those with good vs poor outcome and this very early effect points to distinctly different neural developmental subtypes of ASD. These neural functional findings will accelerate translational progress on important questions and topics related to the mechanisms (e.g., molecular, cellular, neural systems, cognitive, social/environmental) that lead to such differentiation in the early phenotype of ASD. At the molecular and cellular levels, prior work has shown that prenatal periods of brain development are important in ASD (Baron-Cohen et al., 2014; Courchesne et al., 2011; Parikshak et al., 2013; Stoner et al., 2014; Willsey et al., 2013), and so genomic and stem cell methodologies could be used to investigate whether these ASD Good and Poor neural subtypes reflect different timing and/or manifestation of etiological mechanisms.
Further underscoring the importance of these different neural substrates to early language progress and outcome, we also found in ASD highly atypical relationships between language development and neural response to speech. Two major systems were highlighted in these analyses. First, canonical language areas, the default mode network, and subcortical regions involved in reward, emotion, and memory (e.g., hot colored regions in Fig 4C–D) appear to be normatively (i.e. in the typically developing group) recruited more in individuals with better language, while other large scale systems (e.g., cool coloted regions in Fig 4C–D) were recruited less by individuals with the best language ability (i.e. somatomotor cerebellar areas, thalamus, motor, premotor, and primary visual areas). This trade-off between these two large-scale sets of neural systems is insightful on its own about typical language development and the neural systems that are modulated as a function of an individual’s early language ability. However, the additional and perhaps more striking insight for autism is that these brain-behavioral relationships reverse in directionality, with ASD Poor being most prominent in showing these atypically reversals that persist across early intake and outcome time-points. In contrast to ASD Poor, ASD Good toddlers (who had improving language development), started with intake brain-behavioral relationships that were atypically reversed, but showed brain-behavior relationships at clinical outcome that began to approach the TD and LD/DD groups. The mechanism(s) involved in this atypical directionality reversal of how brain function is relevant to language-related behavioral variation in the early development of ASD is unknown. One possibility is that because social interactions are critically important for early language development, early social deficits common to all ASD toddlers may delay early language learning in ASD Good toddlers despite their good neural activation to speech. Another non-mutually exclusive explanation could be boiled down to unique genomic mechanisms for a particular subgroup that are integrally related with variation in these neural systems.
Our results also suggest that information encoded in neural responses to speech at very young ages might provide important predictive information about a child’s likely later language capabilities. We found that early neural and behavioral information provide joint pieces of information that, when combined, provided a particularly strong classifier of poor versus improving language outcome in ASD, and that such a multimodal classifier outperformed classifiers that only used clinical or fMRI information alone. Future work integrating information from other imaging methods like ERP/EEG, MEG, and fNIRS may be helpful (Kuhl et al., 2013; Lloyd-Fox et al., 2013; Seery et al., 2013) as additional sources of information and collected under different contexts such as language/speech processing in awake states. In general, these classifier analyses show a proof-of-concept for potential future development of a prognosis classifier that may combine evidence from both fMRI and early clinical behavioral assessment information. If such a clinically useful classifier could be developed in the future, this would clearly have impact for aiding clinical judgments such as potentially informing future treatment decisions and personalizing early intervention. Future work along these lines would require much larger sample sizes, accurate prevalence estimates of such subgroups in the context of a first-tier population screen, as well as stringent tests against a variety of non-ASD groups that might fail first-tier screens. Future work might also consider utilizing separate global developmental delay and language delay contrast groups instead of combining toddlers from within these groups, as was done in the current study. In this way, unique contributions of global delay on the specialization of superior temporal cortex for language, and how this may be similar or different to ASD, could be more easily gleaned from the data.
Our work represents one of the first attempts of using fMRI to define a neurofunctional biomarker of a subtype in very young ASD toddlers. Such subtypes may give insight into an array of translational goals such as highlighting novel etiological and developmental mechanisms or informing clinical practice regarding early interventions that could be developed and/or modified to be more effective and personalized to a child’s needs. Understanding how these different subtypes respond to different types of treatment would also allow for insight into understanding how and why treatments are effective for some but not all individuals on the autism spectrum. Finally, this work provides an example of how we may be able to start effectively mapping multiple behaviorally manifested phenotypes more directly onto underlying neurobiological substrates and thus better account for the substantial heterogeneity inherent in the early development of ASD.
Experimental Procedures
For a full description of all experimental procedures, analysis details, etc, please see the Supplementary Information. This study was approved by the University of California, San Diego, Institutional Review Board. Parents provided written informed consent according to the Declaration of Helsinki and were paid for their participation. A total of 103 infants/toddlers participated in this study (24 ASD Poor, 36 ASD Good, 24 TD, 19 LD/DD). All individuals were recruited via either a general community referral and/or a population-based screening method called the 1-Year Well-Baby Check-Up Approach (Pierce et al., 2011). All infants were tracked from an intake assessment around 12 months until 3 to 4 years of age. fMRI scanning sessions typically occurred within 3 months of the intake assessment time-point, though this was not the case for all individuals. The ASD Poor subgroup was defined based on the criteria of having both Mullen EL and RL T-scores more than 1 standard deviation below the norm of 50 (i.e. T<40) at the outcome assessment. ASD Good was defined by having outcome Mullen EL or RL T-scores greater than or equal to 40. All individuals were followed longitudinally approximately every 6 months from intake with evaluations on the three initial modules of the Autism Diagnostic Observation Schedule (toddler, 1, or 2) (Lord et al., 2000; Luyster et al., 2009), the Mullen Scales for Early Learning (Mullen, 1995), and the Vineland Scales of Adaptive Behavior (Sparrow et al., 1984).
fMRI Data Acquisition and Task Design
The fMRI task was identical to that used in our previously published studies (Eyler et al., 2012; Redcay and Courchesne, 2008; Redcay et al., 2008) and consisted of three types of speech stimuli (complex forward speech, simple forward speech and backward speech) to forestall possible habituation across blocks; blocks were 20 seconds. All speech conditions were created using the same female speaker. Two contrasts of interest were analyzed in this study: all speech conditions vs rest and forward [simple + complex] vs backward speech. At early language learning ages, when neonates, infants and toddlers are not yet experts at language, forward and backward speech both activate language-relevant temporal areas, and thus, specific comparisons between them tend to be non-significant (Dehaene-Lambertz et al., 2002; Redcay et al., 2008). Thus, forward and backward speech stimuli appear to both be effective in stimulating language-sensitive cortices, perhaps both being treated as potentially language-relevant by the language-inexperienced infant and toddler brain. Therefore, although we have specifically analyzed both contrasts, because of this age-related caveat for forward vs backward speech, our main contrast of interest was all speech vs rest.
Imaging data was collected on a 1.5 Tesla General Electric MRI scanner during natural sleep at night; no sedation was used. High-resolution T1-weighted anatomical scans were collected for warping fMRI data into standard atlas space. Blood oxygenation level-dependent (BOLD) signal was measured across the whole brain with echoplanar imaging during the language paradigm (echo time = 30 ms, repetition time = 2500 ms, flip angle = 90°, bandwidth = 70 kHz, field of view = 25.6 cm, in-plane resolution = 4 × 4 mm, slice thickness = 4 mm, 31 slices).
Behavioral Trajectory Analyses
All behavioral analyses employ mixed-effect analyses (modeling random slopes and intercepts) in order to model within-individual trajectories and group-level trajectories and were implemented in the R nlme package with the function lme (http://cran.r-project.org/web/packages/nlme/index.html).
fMRI Data Analyses
fMRI data preprocessing was implemented within the Analysis of Functional NeuroImages (AFNI) software package (http://afni.nimh.nih.gov). First-level and second-level mass-univariate whole-brain activation analyses were modeled with the general linear model (GLM) in SPM8 (http://www.fil.ion.ucl.ac.uk/spm/). Events in first-level models were modeled using the canonical hemodynamic response function and its temporal derivative. All first-level GLMs included motion parameters as covariates of no interest. High-pass temporal filtering was applied with a cutoff of 0.0078 Hz (1/128 seconds) in order to remove low frequency drift in the time-series. Within second-level analyses, we covaried for age at fMRI scan and mean framewise displacement. For all second-level whole-brain analyses we used a cluster-forming threshold of p<0.025 and corrected for multiple comparisons at the cluster-level to obtain an FDR q<0.05 (Chumbley et al., 2010). For ROI analyses, we used independent functionally-defined ROIs related to language processing by extracting bilateral frontal and temporal cortex clusters from a meta-analysis map downloaded from www.neurosynth.org (Yarkoni et al., 2011) of 725 studies associated with the feature ‘language’ (see top of Fig 2E).
Multi-Voxel Pattern Similarity Analyses
Two separate multi-voxel pattern similarity analyses were conducted. The first assessed similarity between each group’s second-level activation map (i.e. t-statistic map), masked for only voxels within the NeuroSynth language map. The resulting correlation matrix was converted into a dissimilarity matrix (i.e. 1-r) and entered into canonical multidimensional scaling to reduce dimensionality down to a 2-dimensions for visualization of the separation between ASD Poor and all other groups. The second analysis compared individual subject’s activation maps (i.e. first-level t-statistic maps) with specific NeuroSynth feature maps constructed specifically for the purposes of testing similarity with meta-analytic knowledge about neural systems for general auditory processing outside the domain of language and speech or for meta-analytic knowledge about neural systems that are specific to language and speech (see Supplementary Information for more details).
Brain-Behavior Relationship Analysis
Brain-behavior relationships were assessed with the multivariate technique of partial least squares correlation (PLSC) analysis (Krishnan et al., 2011; McIntosh and Lobaugh, 2004). All PLSC analyses were implemented with the plsgui Matlab toolbox (www.rotman-baycrest.on.ca/pls/). The number of permutations and bootstrap resamples were each set to 10,000 (see Supplementary Information for more details).
Classifier Analyses
Classifier analyses used partial least squares linear discriminant analyses with 5-fold cross validation implemented with the Matlab toolbox libPLS (http://www.libpls.net). Features for the classifiers consisted of behavioral measures taken from the earliest clinical intake time-point or using fMRI speech-related activation (i.e. percent signal chance for all speech vs. rest) from all voxels extracted from the NeuroSynth defined left hemisphere superior temporal cortex ROI. The distinction being made in each classifier was the distinction between ASD Poor versus ASD Good. Receiver operating characteristic (ROC) curves and area under the curve (AUC) values were computed for each classifier in order to determine which of the four classifiers performed best, and accuracy, sensitivity, and specificity were also computed as measures of classifier performance.
Supplementary Material
Acknowledgments
This work was supported by NIMH Autism Center of Excellence grant P50-MH081755 (EC), NIMH R01-MH080134 (KP), NFAR grant (KP), NIMH R01- MH036840 (EC), and fellowships from Jesus College, Cambridge and the British Academy (MVL). We thank Richard Znamirowski, Maisi Mayo and Julia Young for help with data collection, Stuart Spendlove and Melanie Weinfeld for assistance with clinical characterization of subjects.
Footnotes
Publisher's Disclaimer: This is a PDF file of an unedited manuscript that has been accepted for publication. As a service to our customers we are providing this early version of the manuscript. The manuscript will undergo copyediting, typesetting, and review of the resulting proof before it is published in its final citable form. Please note that during the production process errors may be discovered which could affect the content, and all legal disclaimers that apply to the journal pertain.
References
- Anderson DK, Lord C, Risi S, DiLavore PS, Shulman C, Thurm A, Welch K, Pickles A. Patterns of growth in verbal abilities among children with autism spectrum disorder. J Consult Clin Psychol. 2007;75:594–604. doi: 10.1037/0022-006X.75.4.594. [DOI] [PubMed] [Google Scholar]
- Bacon EC, Dufek S, Schreibman L, Stahmer AC, Pierce K, Courchesne E. Measuring outcome in an early intervention program for toddlers with autism spectrum disorder: use of a curriculum-based assessment. Autism research and treatment. 2014;2014:964704. doi: 10.1155/2014/964704. [DOI] [PMC free article] [PubMed] [Google Scholar]
- Baron-Cohen S, Auyeung B, Nørgaard-Pedersen B, Hougaard D, Abdallah M, Melgaard L, Cohen AS, Chakrabarti B, Ruta L, Lombardo MV. Elevated fetal steroidogenic activity in autism. Molecular psychiatry. 2014 doi: 10.1038/mp.2014.48. [DOI] [PMC free article] [PubMed] [Google Scholar]
- Behrens TE, Johansen-Berg H, Woolrich MW, Smith SM, Wheeler-Kingshott CA, Boulby PA, Barker GJ, Sillery EL, Sheehan K, Ciccarelli O, et al. Non-invasive mapping of connections between human thalamus and cortex using diffusion imaging. Nature neuroscience. 2003;6:750–757. doi: 10.1038/nn1075. [DOI] [PubMed] [Google Scholar]
- Bennett T, Szatmari P, Bryson S, Volden J, Zwaigenbaum L, Vaccarella L, Duku E, Boyle M. Differentiating autism and Asperger syndrome on the basis of language delay or impairment. J Autism Dev Disord. 2008;38:616–625. doi: 10.1007/s10803-007-0428-7. [DOI] [PubMed] [Google Scholar]
- Billstedt E, Gillberg IC, Gillberg C. Autism after adolescence: population-based 13- to 22-year follow-up study of 120 individuals with autism diagnosed in childhood. J Autism Dev Disord. 2005;35:351–360. doi: 10.1007/s10803-005-3302-5. [DOI] [PubMed] [Google Scholar]
- Buckner RL, Krienen FM, Castellanos A, Diaz JC, Yeo BT. The organization of the human cerebellum estimated by intrinsic functional connectivity. Journal of neurophysiology. 2011;106:2322–2345. doi: 10.1152/jn.00339.2011. [DOI] [PMC free article] [PubMed] [Google Scholar]
- Chumbley J, Worsley K, Flandin G, Friston K. Topological FDR for neuroimaging. Neuroimage. 2010;49:3057–3064. doi: 10.1016/j.neuroimage.2009.10.090. [DOI] [PMC free article] [PubMed] [Google Scholar]
- Courchesne E, Mouton PR, Calhoun ME, Semendeferi K, Ahrens-Barbeau C, Hallet MJ, Barnes CC, Pierce K. Neuron number and size in prefrontal cortex of children with autism. JAMA : the journal of the American Medical Association. 2011;306:2001–2010. doi: 10.1001/jama.2011.1638. [DOI] [PubMed] [Google Scholar]
- Dehaene-Lambertz G, Dehaene S, Hertz-Pannier L. Functional neuroimaging of speech perception in infants. Science (New York, NY. 2002;298:2013–2015. doi: 10.1126/science.1077066. [DOI] [PubMed] [Google Scholar]
- Dehaene-Lambertz G, Hertz-Pannier L, Dubois J, Meriaux S, Roche A, Sigman M, Dehaene S. Functional organization of perisylvian activation during presentation of sentences in preverbal infants. Proceedings of the National Academy of Sciences of the United States of America. 2006;103:14240–14245. doi: 10.1073/pnas.0606302103. [DOI] [PMC free article] [PubMed] [Google Scholar]
- Dinstein I, Heeger DJ, Lorenzi L, Minshew NJ, Malach R, Behrmann M. Unreliable evoked responses in autism. Neuron. 2012;75:981–991. doi: 10.1016/j.neuron.2012.07.026. [DOI] [PMC free article] [PubMed] [Google Scholar]
- Dinstein I, Pierce K, Eyler L, Solso S, Malach R, Behrmann M, Courchesne E. Disrupted neural synchronization in toddlers with autism. Neuron. 2011;70:1218–1225. doi: 10.1016/j.neuron.2011.04.018. [DOI] [PMC free article] [PubMed] [Google Scholar]
- Eapen V, Crncec R, Walter A. Exploring Links between Genotypes, Phenotypes, and Clinical Predictors of Response to Early Intensive Behavioral Intervention in Autism Spectrum Disorder. Front Hum Neurosci. 2013;7:567. doi: 10.3389/fnhum.2013.00567. [DOI] [PMC free article] [PubMed] [Google Scholar]
- Ellis Weismer S, Lord C, Esler A. Early language patterns of toddlers on the autism spectrum compared to toddlers with developmental delay. J Autism Dev Disord. 2010;40:1259–1273. doi: 10.1007/s10803-010-0983-1. [DOI] [PMC free article] [PubMed] [Google Scholar]
- Eyler LT, Pierce K, Courchesne E. A failure of left temporal cortex to specialize for language is an early emerging and fundamental property of autism. Brain : a journal of neurology. 2012;135:949–960. doi: 10.1093/brain/awr364. [DOI] [PMC free article] [PubMed] [Google Scholar]
- Fein D, Barton M, Eigsti IM, Kelley E, Naigles L, Schultz RT, Stevens M, Helt M, Orinstein A, Rosenthal M, et al. Optimal outcome in individuals with a history of autism. J Child Psychol Psychiatry. 2013;54:195–205. doi: 10.1111/jcpp.12037. [DOI] [PMC free article] [PubMed] [Google Scholar]
- Geschwind DH, Levitt P. Autism spectrum disorders: developmental disconnection syndromes. Current opinion in neurobiology. 2007;17:103–111. doi: 10.1016/j.conb.2007.01.009. [DOI] [PubMed] [Google Scholar]
- Gillberg C, Steffenburg S. Outcome and prognostic factors in infantile autism and similar conditions: a population-based study of 46 cases followed through puberty. J Autism Dev Disord. 1987;17:273–287. doi: 10.1007/BF01495061. [DOI] [PubMed] [Google Scholar]
- Gotham K, Pickles A, Lord C. Trajectories of autism severity in children using standardized ADOS scores. Pediatrics. 2012;130:e1278–1284. doi: 10.1542/peds.2011-3668. [DOI] [PMC free article] [PubMed] [Google Scholar]
- Haigh SM, Heeger DJ, Dinstein I, Minshew N, Behrmann M. Cortical Variability in the Sensory-Evoked Response in Autism. J Autism Dev Disord. 2014 doi: 10.1007/s10803-014-2276-6. [DOI] [PMC free article] [PubMed] [Google Scholar]
- Hickok G, Poeppel D. The cortical organization of speech processing. Nature reviews Neuroscience. 2007;8:393–402. doi: 10.1038/nrn2113. [DOI] [PubMed] [Google Scholar]
- Howlin P. Outcome in high-functioning adults with autism with and without early language delays: implications for the differentiation between autism and Asperger syndrome. J Autism Dev Disord. 2003;33:3–13. doi: 10.1023/a:1022270118899. [DOI] [PubMed] [Google Scholar]
- Howlin P, Mawhood L, Rutter M. Autism and developmental receptive language disorder--a follow-up comparison in early adult life. II: Social, behavioural, and psychiatric outcomes. J Child Psychol Psychiatry. 2000;41:561–578. doi: 10.1111/1469-7610.00643. [DOI] [PubMed] [Google Scholar]
- Howlin P, Savage S, Moss P, Tempier A, Rutter M. Cognitive and language skills in adults with autism: a 40-year follow-up. J Child Psychol Psychiatry. 2014;55:49–58. doi: 10.1111/jcpp.12115. [DOI] [PubMed] [Google Scholar]
- Kapur S, Phillips AG, Insel TR. Why has it taken so long for biological psychiatry to develop clinical tests and what to do about it? Molecular psychiatry. 2012;17:1174–1179. doi: 10.1038/mp.2012.105. [DOI] [PubMed] [Google Scholar]
- Kjelgaard MM, Tager-Flusberg H. An Investigation of Language Impairment in Autism: Implications for Genetic Subgroups. Language and cognitive processes. 2001;16:287–308. doi: 10.1080/01690960042000058. [DOI] [PMC free article] [PubMed] [Google Scholar]
- Kriegeskorte N, Mur M, Bandettini P. Representational similarity analysis - connecting the branches of systems neuroscience. Front Syst Neurosci. 2008a;2:4. doi: 10.3389/neuro.06.004.2008. [DOI] [PMC free article] [PubMed] [Google Scholar]
- Kriegeskorte N, Mur M, Ruff DA, Kiani R, Bodurka J, Esteky H, Tanaka K, Bandettini PA. Matching categorical object representations in inferior temporal cortex of man and monkey. Neuron. 2008b;60:1126–1141. doi: 10.1016/j.neuron.2008.10.043. [DOI] [PMC free article] [PubMed] [Google Scholar]
- Krishnan A, Williams LJ, McIntosh AR, Abdi H. Partial Least Squares (PLS) methods for neuroimaging: a tutorial and review. Neuroimage. 2011;56:455–475. doi: 10.1016/j.neuroimage.2010.07.034. [DOI] [PubMed] [Google Scholar]
- Kuhl PK, Coffey-Corina S, Padden D, Munson J, Estes A, Dawson G. Brain responses to words in 2-year-olds with autism predict developmental outcomes at age 6. PLoS One. 2013;8:e64967. doi: 10.1371/journal.pone.0064967. [DOI] [PMC free article] [PubMed] [Google Scholar]
- Lloyd-Fox S, Blasi A, Elwell CE, Charman T, Murphy D, Johnson MH. Reduced neural sensitivity to social stimuli in infants at risk for autism. Proc Biol Sci. 2013;280:20123026. doi: 10.1098/rspb.2012.3026. [DOI] [PMC free article] [PubMed] [Google Scholar]
- Lord C, Luyster R, Guthrie W, Pickles A. Patterns of developmental trajectories in toddlers with autism spectrum disorder. J Consult Clin Psychol. 2012;80:477–489. doi: 10.1037/a0027214. [DOI] [PMC free article] [PubMed] [Google Scholar]
- Lord C, Risi S, Lambrecht L, Cook EH, Jr, Leventhal BL, DiLavore PC, Pickles A, Rutter M. The autism diagnostic observation schedule-generic: a standard measure of social and communication deficits associated with the spectrum of autism. J Autism Dev Disord. 2000;30:205–223. [PubMed] [Google Scholar]
- Lovaas OI. Behavioral treatment and normal educational and intellectual functioning in young autistic children. J Consult Clin Psychol. 1987;55:3–9. doi: 10.1037//0022-006x.55.1.3. [DOI] [PubMed] [Google Scholar]
- Luyster R, Gotham K, Guthrie W, Coffing M, Petrak R, Pierce K, Bishop S, Esler A, Hus V, Oti R, et al. The Autism Diagnostic Observation Schedule-toddler module: a new module of a standardized diagnostic measure for autism spectrum disorders. J Autism Dev Disord. 2009;39:1305–1320. doi: 10.1007/s10803-009-0746-z. [DOI] [PMC free article] [PubMed] [Google Scholar]
- McEachin JJ, Smith T, Lovaas OI. Long-term outcome for children with autism who received early intensive behavioral treatment. Am J Ment Retard. 1993;97:359–372. discussion 373–391. [PubMed] [Google Scholar]
- McIntosh AR, Lobaugh NJ. Partial least squares analysis of neuroimaging data: applications and advances. Neuroimage. 2004;23(Suppl 1):S250–263. doi: 10.1016/j.neuroimage.2004.07.020. [DOI] [PubMed] [Google Scholar]
- Mullen EM. Mullen scales of early learning. Circle Pine, MN: American Guidance Service, Inc; 1995. [Google Scholar]
- Nichols T, Brett M, Andersson J, Wager TD, Poline JB. Valid conjunction inference with the minimum statistic. Neuroimage. 2005;25:653–660. doi: 10.1016/j.neuroimage.2004.12.005. [DOI] [PubMed] [Google Scholar]
- Parikshak NN, Luo R, Zhang A, Won H, Lowe JK, Chandran V, Horvath S, Geschwind DH. Integrative functional genomic analyses implicate specific molecular pathways and circuits in autism. Cell. 2013;155:1008–1021. doi: 10.1016/j.cell.2013.10.031. [DOI] [PMC free article] [PubMed] [Google Scholar]
- Perry A, Cummings A, Geier JD, Freeman NL, Hughes S, Managhan T, Reitzel J, Williams J. Predictors of outcome for children receiving intensive behavioral intervention in a large, community-based program. Res Autism Spectr Disord. 2011;5:592–603. [Google Scholar]
- Pickles A, Anderson DK, Lord C. Heterogeneity and plasticity in the development of language: a 17-year follow-up of children referred early for possible autism. J Child Psychol Psychiatry. 2014;55:1354–1362. doi: 10.1111/jcpp.12269. [DOI] [PubMed] [Google Scholar]
- Pierce K, Carter C, Weinfeld M, Desmond J, Hazin R, Bjork R, Gallagher N. Detecting, studying, and treating autism early: the one-year well-baby check-up approach. J Pediatr. 2011;159:458–465. e451–456. doi: 10.1016/j.jpeds.2011.02.036. [DOI] [PMC free article] [PubMed] [Google Scholar]
- Redcay E, Courchesne E. Deviant functional magnetic resonance imaging patterns of brain activity to speech in 2–3-year-old children with autism spectrum disorder. Biol Psychiatry. 2008;64:589–598. doi: 10.1016/j.biopsych.2008.05.020. [DOI] [PMC free article] [PubMed] [Google Scholar]
- Redcay E, Haist F, Courchesne E. Functional neuroimaging of speech perception during a pivotal period in language acquisition. Developmental science. 2008;11:237–252. doi: 10.1111/j.1467-7687.2008.00674.x. [DOI] [PubMed] [Google Scholar]
- Seery AM, Vogel-Farley V, Tager-Flusberg H, Nelson CA. Atypical lateralization of ERP response to native and non-native speech in infants at risk for autism spectrum disorder. Dev Cogn Neurosci. 2013;5:10–24. doi: 10.1016/j.dcn.2012.11.007. [DOI] [PMC free article] [PubMed] [Google Scholar]
- Sparrow S, Balla D, Cicchetti D. Vineland Scales of Adaptive Behavior: Interview edition, survey form manual. Circle Pines, MN: American Guidance Service; 1984. [Google Scholar]
- Stoner R, Chow ML, Boyle MP, Sunkin SM, Mouton PR, Roy S, Wynshaw-Boris A, Colamarino SA, Lein ES, Courchesne E. Patches of disorganization in the neocortex of children with autism. N Engl J Med. 2014;370:1209–1219. doi: 10.1056/NEJMoa1307491. [DOI] [PMC free article] [PubMed] [Google Scholar]
- Szatmari P, Bryson S, Duku E, Vaccarella L, Zwaigenbaum L, Bennett T, Boyle MH. Similar developmental trajectories in autism and Asperger syndrome: from early childhood to adolescence. J Child Psychol Psychiatry. 2009;50:1459–1467. doi: 10.1111/j.1469-7610.2009.02123.x. [DOI] [PubMed] [Google Scholar]
- Szatmari P, Bryson SE, Boyle MH, Streiner DL, Duku E. Predictors of outcome among high functioning children with autism and Asperger syndrome. J Child Psychol Psychiatry. 2003;44:520–528. doi: 10.1111/1469-7610.00141. [DOI] [PubMed] [Google Scholar]
- Szatmari P, Bryson SE, Streiner DL, Wilson F, Archer L, Ryerse C. Two-year outcome of preschool children with autism or Asperger’s syndrome. The American journal of psychiatry. 2000;157:1980–1987. doi: 10.1176/appi.ajp.157.12.1980. [DOI] [PubMed] [Google Scholar]
- Tager-Flusberg H, Kasari C. Minimally verbal school-aged children with autism spectrum disorder: the neglected end of the spectrum. Autism Res. 2013;6:468–478. doi: 10.1002/aur.1329. [DOI] [PMC free article] [PubMed] [Google Scholar]
- Ventner A, Lord C, Schopler E. A follow-up study of high-functioning autistic children. J Child Psychol Psychiatry. 1992;33:489–507. doi: 10.1111/j.1469-7610.1992.tb00887.x. [DOI] [PubMed] [Google Scholar]
- Willsey AJ, Sanders SJ, Li M, Dong S, Tebbenkamp AT, Muhle RA, Reilly SK, Lin L, Fertuzinhos S, Miller JA, et al. Coexpression networks implicate human midfetal deep cortical projection neurons in the pathogenesis of autism. Cell. 2013;155:997–1007. doi: 10.1016/j.cell.2013.10.020. [DOI] [PMC free article] [PubMed] [Google Scholar]
- Yan CG, Cheung B, Kelly C, Colcombe S, Craddock RC, Di Martino A, Li Q, Zuo XN, Castellanos FX, Milham MP. A comprehensive assessment of regional variation in the impact of head micromovements on functional connectomics. Neuroimage. 2013;76:183–201. doi: 10.1016/j.neuroimage.2013.03.004. [DOI] [PMC free article] [PubMed] [Google Scholar]
- Yarkoni T, Poldrack RA, Nichols TE, Van Essen DC, Wager TD. Large-scale automated synthesis of human functional neuroimaging data. Nat Methods. 2011;8:665–670. doi: 10.1038/nmeth.1635. [DOI] [PMC free article] [PubMed] [Google Scholar]
Associated Data
This section collects any data citations, data availability statements, or supplementary materials included in this article.