

Abstract
Having regulatory T cells with the same antigen specificity as the responding conventional T cells is thought to be important in maintaining peripheral tolerance. It has been demonstrated that during experimental autoimmune encephalomyelitis (EAE) there are MOG-specific Tregs that infiltrate into the central nervous system (CNS). However the affinity of naturally occurring polyclonal Tregs for any self-antigen let alone MOG has not been analyzed in the periphery or at the site of autoimmune disease. Utilizing the highly sensitive micropipette adhesion frequency assay, which allows one to determine on a single cell basis the affinity and frequency of polyclonal antigen-specific T cells directly ex vivo, we demonstrate that at peak disease MOG-specific Tregs were progressively enriched in the draining cervical lymph nodes and CNS as compared to spleen. These frequencies were greater than the frequencies measured by tetramer analysis indicative of the large fraction of lower affinity T cells that comprise the MOG specific Tconv and Treg response. Of interest, the self-reactive CD4+ Tconvs and Tregs displayed overlapping affinities for MOG in the periphery, yet in the CNS, the site of neuroinflammation, Tconvs skew towards higher affinities. The majority of the MOG-specific Tregs in the CNS possessed the methylation signature associated with thymic derived Tregs. These findings indicate that tTreg affinity range matches that of their Tconvs in the periphery and suggest a change in TCR affinity as a potential mechanism for autoimmune progression and escape from immune regulation.
Introduction
A constant challenge for the immune system is balancing clearance of foreign pathogens while remaining tolerant of self. To limit overt auto-reactivity, central tolerance restricts the number of self-specific cells by the process of negative selection in the thymus, although it has been demonstrated that this process is imperfect (1). In the periphery self-reactivity can be limited in several different ways including but not limited to anergy, inability to access antigen and suppression by Tregs. One of the earliest examples of regulatory T cells was demonstrated by pivotal work showing that depletion of CD4+ CD25+ T cells in mice lead to systemic autoimmunity (2). Later it was determined that Foxp3 is a key transcription factor expressed by Tregs and mutations in this transcription factor lead to multi-organ autoimmunity (3, 4).
Tregs arise in vivo by thymic selection (tTregs) or peripheral induction (pTregs). TCR affinity for self peptide major histocompatibility complexes (pMHCs) during thymic education is thought to dictate the fate of developing thymocytes toward naïve CD4+ T conventional (Tconv) or regulatory T (Treg) cells, with the strongest interactions preferentially giving rise to Tregs. Early models of tTreg selection were based on the requirement of a strong interaction of the developing thymocyte with self-antigen serving as an alternative to death via negative selection (5, 6). This implied that tTregs are higher affinity than Tconvs for the same self-antigen, although tTreg selection is influenced by many additional factors including the selecting niche size and availability of co-factors (7–10). But how these data translate to polyclonal responses has not been addressed to date since there is a dearth of information on naturally occurring tTreg TCRs with known self antigen specificities.
Even in TCR transgenic mice, the antigen specificity that allowed for selection in the thymus may not be the same recognized in the periphery (11, 12). It has been shown that thymocytes are able to develop into both Tregs and Tconvs by selecting on the same self peptide using the identical TCR (13). The limitations imposed by the selecting size niche did replicate when TCRs from three different tTreg cells were used to make retrogenic mice (7). When these TCRs were present at low clonal frequencies then they more efficiently developed into Tregs, although to date their antigen specificities remain elusive. If tTregs are enriched for self-reactivity, then identifying their specificities could prove difficult using current techniques like pMHC tetramers. We and others have demonstrated that tetramers can greatly underestimate the frequency of self-specific T cells (14–17).
It has been shown that there are MOG-specific Tregs that traffic to the CNS during experimental autoimmune encephalomyelitis (EAE) (18). They are still capable of suppressing; however the conventional T cells in the CNS have become refractory to the Tregs. The authors demonstrated that this similar ignorance of suppression could be achieved using naïve Tconv cells with exogenous IL-6 and TNF-α added to the co-culture (18). In a study of relapsing and remitting multiple sclerosis patients, there was a significant correlation between the level of IL-6Rα expression and the ability of the Tconv cells to escape suppression by Tregs (19). In addition to the Tconv cells escaping regulation by Tregs, the presence of proinflammatory cytokines can actively recruit DNA methyltransferases to the Treg-specific demethylated region (TSDR) leading to de novo methylation at this site (20). The reintroduction of methyl groups at these CpGs makes Foxp3 expression less stable and impairs its inheritability upon division into daughter cells (21). By BrdU labeling, it has been demonstrated that Tregs in the CNS during EAE are capable of dividing, so this could support a conversion of Tregs into memory-like effector T cells (18, 22).
Using Foxp3 reporter mice to discern the contributions of Tregs from Tconvs, we expanded on our previous studies demonstrating autoimmunity is dominated by low-affinity T cells (14). Only approximately ten and thirty percent of Tregs and Tconvs were antigen reactive in the CNS by tetramer and cytokine production respectively during EAE. However when using the same pMHC monomer that is used for the tetramer, greater than 80% of the Tregs and Tconvs from the CNS are MOG-specific when measured by the micropipette adhesion frequency assay. Further, this assay allowed the identification of how many MOG-specific Tregs were in the spleen, cervical lymph nodes (CLN), and CNS defining enrichment of MOG-specific Foxp3+ T cells that have infiltrated into the CNS. All T cell responses are comprised of TCRs that span a range from lower to higher affinities. The overall affinity ranges in the periphery are similar between Tregs and Tconvs with an enrichment of higher affinity Tconvs in the CNS. Based on a methylation signature and Helios expression, the Tregs in the CNS are likely derived from tTregs. Thus, the micropipette adhesion frequency assay allows one to define for the first time the distribution and affinity of polyclonal Tregs during autoimmune disease revealing new insight into autoimmune disease progression and potential mechanisms of Treg development.
Materials and Methods
Mice
B6.Cg-Foxp3tm2Tch/J (Foxp3 GFP) mice were obtained from Jackson Laboratory and were bred in the Emory University Division of Animal Resources facility (23). C57Bl/6 mice were obtained from NCI. All experiments were approved by the Institutional Animal Care and Use Committee at Emory University.
EAE induction and isolation of cells
EAE was induced in 6–10 week old male or female mice by injecting subcutaneously 200 μg of MOG35-55 emulsified in CFA containing 5 mg/ml heat-inactivated M. tuberculosis (H37 RA, Difco) on days 0 and 7 and intraperitoneally with 250 ng of pertussis toxin (List biologicals) on days 0 and 2 as described (24). Mice are scored and weighed daily starting at day 7 post induction using a 5 point scale, where 0 is no signs of disease, 1 limp tail, 2 hind limb weakness, 3 hind limb paralysis, 4 forelimb weakness and 5 moribund.
Reagents
Cell culture media was composed of RPMI-1640 (Cellgro) supplemented with 10% heat inactivated FBS (Gibco), 4 mM L-Glutamine (Cellgro), 0.01 M HEPES (Cellgro), 100 μg/ml gentamicin (Cellgro) and 20 μM 2-ME (Sigma Aldrich). Phenol red-free reagents (RPMI-1640 and HBSS) were used in some experiments because phenol red containing reagents can decrease eGFP fluorescence by FACS and fluorescent microscopy (25). Experimental additive solution 45 (EAS45) was made as described previously (26). All EAS45 compounds were from Sigma Aldrich except dibasic sodium phosphate which was from Fisher Scientific. EAS45 was then further supplemented with 1% BSA (Sigma Aldrich). FACS wash consisted of 0.1% BSA and 0.05% Sodium Azide in PBS.
Isolation of CNS-infiltrating cells
Mice were sacrificed using CO2 inhalation and were perfused with 1X DPBS (Cellgro) via the left ventricle after the inferior vena cava was cut. For each mouse, the spinal cord and brain were combined and a single cell suspension was obtained by pushing cells through a 100 μm cell-strainer. Cells were collected from the interface of a 27%:63% discontinuous gradient of Percoll (GE healthcare), washed two times with R10 and then counted on a hemocytometer to obtain the number of infiltrating cells.
Flow cytometry
Staining of Helios and Foxp3 was accomplished using the Foxp3 staining buffer set from Ebioscience according to their protocol. For intracellular cytokine staining, cells were stimulated with PMA and ionomycin for 4 hours in the presence of Brefeldin A, as described previously and then after staining surface markers, the cells were fixed and permeablized using the BD Cytofix/Cytoperm kit (BD Biosciences) followed by intracellular staining for cytokines (27). Tetramer frequencies were determined by staining cells with MOG38-48:IAb or hCLIP:IAb for at least 6 hours at 37°C in complete media as described previously (28). Data were collected on a LSRII (BD Biosciences) and then analyzed in FlowJo (Tree Star). Monomer-coated RBCs and T cells were stained to determine the absolute numbers of pMHC and TCR, respectively, on their surfaces using PE Quantibrite beads (BD Biosciences) as described previously (29). The following antibodies (clones) were purchased from a variety of vendors (BD Biosciences, Ebioscience, Biolegend): Helios (22F6); Foxp3 (FJK-16s); CD8α (53–6.7); CD3ε (145-2C11); CD4 (RM4-5); CD11b (M1/70); CD11c (HL3); CD19 (1D3); CD45.2 (104); TCRβ (H57-597); IA/IE (M5/114.15.2); IFNγ (XMG1.2); IL-17 (eBio17B7); and IL-10 (JES5-16E3).
Micropipette adhesion frequency assay
To determine the two-dimensional (2D) affinities and frequencies of MOG-specific cells, the micropipette adhesion frequency assay was conducted as previously described (14, 15, 27, 29–33). Human red blood cells (RBCs) were coated with biotinylated pMHC monomers (NIH Tetramer Core Facility). Binding events are scored manually by visualizing distension of the RBC membrane upon retraction of the T cell. After 25 or 50 touches, average adhesion frequencies are calculated and cells are considered to be antigen-specific above the background of 0.1 binding frequency. The background binding frequency was set by using hCLIP:IAb coated RBCs as a nonspecific binding control for the cells that had also been tested for binding to MOG:IAb. RBC pMHC density is manipulated to obtain adhesion frequencies between 0.1 and 1.0 which could be used to calculate an affinity. For example, cells that had an adhesion frequency of one were tested with a second RBC coated with a lower density of MOG:IAb to decrease the adhesion frequency and allow for measurement of the affinity. The number of antigen-specific cells divided by the total number of cells tested gives the frequency of MOG-specific cells. Effective 2D affinities (AcKa) are calculated using the following equation:
where Pa is the adhesion frequency measured at an equilibrium contact time (≥2 seconds contact time), mr and ml are the densities of TCR and pMHC ligands respectively. TCR densities are calculated for each T cell individually using the TCR level for the population, as determined by flow cytometry, and that cell’s diameter, measured during the micropipette assay. For each independent experiment at least 14 cells were tested.
Bisulfite sequencing
Cells from male mice were used for methylation studies to avoid confounding results due to random X inactivation since Foxp3 is an X-linked gene. CD4+ Tconv and CD4+ Foxp3+ Treg cells were sorted from the indicated sources on a FACS ARIA II (BD Biosciences). DNA was extracted from cell pellets and bisulfite-converted using DNeasy Blood and Tissue kit (Qiagen) followed by EpiTect Bisulfite kit (Qiagen) or with the EZ DNA Methylation-Direct kit (Zymo Research) as per the manufacturers’ protocols. Regions of interest were amplified using published primers and JumpStart Taq Ready Mix (Sigma-Aldrich) to determine the tTreg-ME signature (34).
Gel-purified PCR products were subcloned using the TOPO TA cloning kit (Invitrogen), followed by blue/white screening with X-gal. Single pass DNA sequencing was done by Beckman Coulter Genomics. Sequences were aligned with their in silico bisulfite-converted genomic sequences using a custom R script in Bioconductor Biostrings R package and only those that contained all of the CpGs and had a bisulfite conversion rate of greater than 95% were included in the results (35).
Statistical analysis
Prism version 6 (GraphPad Software Inc.) was used for T-Tests and all ANOVAs with multiplicity adjusted p values. Testing of normality via Q-Q plots, Shapiro-Wilk and Jarque-Bera normality tests and comparison of affinity distributions using Kolmogorov-Smirnov were done using R script. Two-sided Fisher’s exact test was used to determine significance in the methylation patterns.
Results
Enrichment of MOG-specific Tregs and Tconvs in the CNS
At the peak of myelin destruction during EAE (day 21), approximately one in five CNS infiltrating CD4+ T cells express Foxp3, the transcription factor that marks Tregs. This frequency is increased as compared to the Foxp3+ frequencies found in the draining CLN and SPL (Figure 1A, 14% each). Although a 1.5-fold enrichment in the frequency of Tregs from CNS over periphery occurred, this increase reflects changes in the total Treg population and not the frequency of MOG-specific Tregs. In addition, there was a slight increase in the frequency of Tregs in the CLN and SPL during EAE compared to age-matched naïve controls. Since antigen-specific Tregs are more effective than polyclonal Tregs at suppression, we sought to reveal the frequency of MOG-specific Tregs (36, 37).
Figure 1.

Enrichment of MOG-specific Foxp3+ Tregs in the CNS during EAE. (A) Frequency of Foxp3-expressing CD4+ cells in various organs from naïve mice (open box plots) and at peak disease (filled box plots) (CNS – central nervous system, CLN – cervical lymph node, SPL – spleen). Data are from five experiments, one-way repeated measures ANOVA ** p <0.01 (CNS vs. CLN p = 0.0070, CNS vs. SPL p = 0.0051), ns – not significant, n.d. – not determined. (B) Tetramer staining frequencies by organ during peak EAE for Tconv and Tregs, with representative FACS plots shown in Supplemental Figure 1. Data from at least 5 independent experiments, two-way ANOVA repeated measures **** p < 0.0001. (C) Representative adhesion frequencies for individual CNS cells for MOG:IAb and hCLIP:IAb coated RBCs. All cells were tested for binding to both antigens and data are from two independent experiments, with ten cells per each experiment tested. (D) MOG:IAb adhesion frequencies for T cells isolated from indicated organs at peak EAE, where each dot represents an individual cell tested. Number of cells tested: CNS Tconv – 65; CNS Treg – 107; CLN Tconv – 41; CLN Treg – 40; SPL Tconv – 55; SPL Treg – 55. (E) Overall frequency of cells that recognize MOG from the indicated organs. (D-E) Data from eight, three, and four experiments for CNS, CLN and SPL respectively, (E) two-way ANOVA comparing means for indicated cell-type between tissues, **** p < 0.0001 (CNS Tconv vs SPL Treg, CNS Tconv vs SPL Tconv, CNS Treg vs SPL Treg, CNS Treg vs SPL Tconv, CLN Treg vs SPL Treg), *** p < 0.001 (CLN Tconv vs SPL Treg p = 0.0004 and CLN Treg vs SPL Treg p = 0.0003), ** CLN Tconv vs SPL Tconv p = 0.0025, ns (Tconv: CNS vs. CLN; Treg: CNS vs. CLN). (F) The frequency of MOG-specific Tregs as a percent of total CD4+ cells was determined by multiplying the %MOG-specific by the average frequency of Foxp3+ cells in each location, one-way ANOVA, **** p < 0.0001 (CNS vs. SPL), ** p < 0.01 (CNS vs. CLN p = 0.0078, CLN vs. SPL p = 0.0020). Box plots with min to max whiskers for all panels except C and D where each dot represents an individual cell and for CLN in E and F where each dot represents an individual experiment because n = 3.
In order to identify antigen-specific cells, pMHC tetramers were used to stain cells from Foxp3 GFP reporter mice that were sick with EAE. We observed approximately four and eight percent of the Tconv and Treg cells respectively staining with tetramer in the CNS compared to one percent or less in the CLN and SPL at peak disease (Supplemental Figure 1 and Fig. 1B). On average MOG:IAb tetramers only detected less than ten percent of the cells infiltrating the CNS as being specific for the inducing antigen (14, 18, 28). Another more sensitive method to enumerate polyclonal MOG-specific Tconv and Treg cells is the micropipette adhesion frequency assay. Individual cells within the polyclonal response were interrogated for their ability to specifically bind MOG:IAb coated RBCs while not binding hCLIP:IAb coated RBCs from the CNS of sick mice. Adhesion frequencies for MOG:IAb ranged from 0.1 to 1.0. However an adhesion frequency of 100% (1.0) cannot be used to derive affinity from the equation so those T cells must be retested on RBCs coated with progressively lower antigen densities.
The adhesion frequency assay demonstrates specificity for the target antigen as none of the cells that bound MOG:IAb displayed any adhesion above 0.1 for hCLIP:IAb (Fig. 1C). Our previous work with monoclonal and polyclonal T cells has defined the 0.1 frequency as an operational cutoff for nonspecific binding and it is considered the background level of the assay (14, 29, 32). Analysis of several tissues for antigen specific T cells revealed similar adhesion frequencies and ranges in those frequencies for Tconvs and Tregs in the same tissue (Fig. 1D). Based on the adhesion frequencies, 80% of the CNS infiltrating CD4+ Foxp3+ T cells were specific for MOG, while the draining CLN and SPL displayed 70% and 15% reactivity for MOG respectively (Fig. 1E). We also observed similar frequencies of MOG specific Tconvs in the same tissues. These data demonstrate an additional specificity control of the assay as not all T cells are able to interact with the MOG:IAb coated RBCs (Fig. 1D).
These results parallel the increased numbers of antigen reactive T cells that one would identify with specific tetramer but inclusive of the lower affinity T cells missed by all MHC class II tetramers (18). As measured by the micropipette assay there are eight-fold more cells that are capable of recognizing MOG:IAb. The frequency of MOG-specific Tregs as a percent of the total CD4+ T cell compartment revealed a striking difference among the tissues with MOG specific Foxp3+ cells comprising ~18%, 11% and 2% within CNS, CLN and SPL respectively (Fig. 1F). As expected from other reports, the intracellular cytokine assay also greatly underestimated the number of antigen reactive T cells (Figure 2) (14, 15, 38–41).
Figure 2.

Production of cytokines by Tconv and Treg cells during EAE. (A) Representative flow plots showing IL-17A and IFNγ production by CNS Tconv cells. (B) Frequencies of single and double cytokine producing Tconv cells in various organs at peak EAE upon stimulation with PMA and ionomycin. Data are from at least 5 independent experiments. (C) Percent of Tregs producing IL-10 or IFNγ in the various organs in response to PMA/Ionomycin stimulation. Data are from three independent experiments, except for SPL which is from two experiments.
Tregs and Tconvs have overlapping ranges of affinity for MOG but unique distributions in the CNS
We next determined how Treg affinities for MOG compared to Tconv. In the CLN the geometric mean 2D affinities of Tconvs and Tregs were the same (Fig. 3A, CLN Tconv – 1.446 (0.04940 to 11.42) and Treg – 1.349 (0.04670 to 14.35) × 10−5 μm4 (range minimum to maximum)). The range in affinities was more than 100 fold for both cell types in the CLN. The greatest range in affinities was in the CNS with 560 and 2,450 fold for Tconvs and Tregs respectively (Fig. 3A). This increased breadth in the CNS populations is due to enrichment of higher affinity cells. The CNS Tregs had a similar geometric mean affinity as the CLN cells, but the CNS showed enrichment for higher affinity cells as depicted by the increase in range (1.204 (0.09270 to 227.1) × 10−5). Even though the CLN and CNS Tregs had the same mean affinity, the presence of high affinity MOG specific Tregs in the CNS was countered by an increase in low affinity cells. However the CNS Tconvs had a significant increase in the mean 2D affinity (4.631 (0.2159 to 121) × 10−5)) compared to CNS Tregs and cells in the periphery. Thus in the CNS at peak disease, Tconv affinity is increased compared to CNS Tregs and peripheral MOG-specific Tconvs and Tregs.
Figure 3.
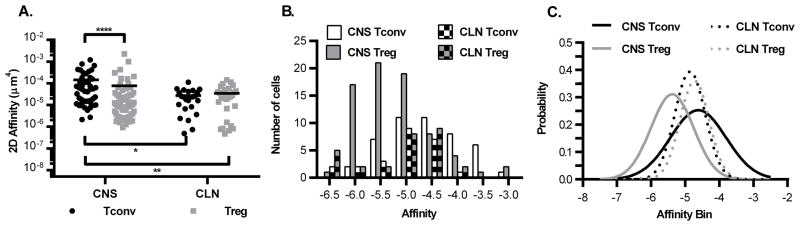
Tregs and Tconvs have overlapping ranges of affinity for MOG but unique distributions in the CNS. (A) The effective 2D affinities were derived from the adhesion frequencies for Tconv and Treg from figure 1D, as described in the methods. Two-way ANOVA on geometric mean affinities, **** p < 0.001 CNS Tconv vs. CNS Treg, ** p = 0.0083 CNS Tconv vs CLN Treg, * p = 0.0222 CNS Tconv vs CLN Tconv. Number of affinities: CNS Tconv – 46; CNS Treg – 73; CLN Tconv – 24; CLN Treg – 28. (B) Frequency distributions and (C) Gaussian curves were fitted to the affinity data from panel A. Number of independent experiments by organ: CNS - eight, CLN - three, SPL - four.
Frequency distributions of the affinities were plotted and Gaussian curves fitted for CNS and CLN cells (Fig. 3B and 3C). The data fit to Gaussian curves which could indicate that they are normally distributed. To determine if the data are normally distributed, Q-Q plots were used to compare the experimental affinity distributions against a theoretical normal distribution with the same corresponding mean and standard deviation. If the data are sampled from a normally distributed population, then the points should fall along the plotted 45-degree reference line and normality tests will have a p-value > 0.05. CNS Tconv affinities appear to be sampled from a normally distributed population as supported by Shapiro-Wilk and Jarque-Bera normality tests (p-values of 0.2839 and 0.4397, respectively, Fig. 4A). The distribution of peripheral affinities also displayed the skewing and kurtosis expected of normal distributions as determined by the Jarque-Bera test (CLN Tconv p = 0.1484, Treg p = 0.1971). However they do deviate from normality as can be seen by the data on either end of the range not falling on the line in the Q-Q plots (Fig. 4C and D, Shapiro-Wilk CLN Tconv p = 0.02409, Treg p = 0.002664). Of interest, the CNS Treg affinity distribution deviated from normality as the corresponding Q-Q plot shows that the CNS Tregs are right-skewed (Fig. 4B) with poor Shapiro-Wilk and Jarque-Bera p-values (p-values of 0.002404 and 0.005418, respectively). Although we do not know the mechanism for this difference in Treg distribution at this time, it is interesting to speculate that Treg affinities are skewed at the site of active autoimmune disease.
Figure 4.

CNS Tconv cells are normally distributed unlike CNS Tregs and cells in periphery. (A–D) Q-Q plots were generated for (A) CNS Tconv, (B) CNS Treg, (C) CLN Tconv and (D) CLN Treg using the data from Figure 3A. Comparisons of the distributions of Tconv to Treg in the (E) CNS and (F) CLN were done by Q-Q plots.
To determine how similar two distributions are to each other, the Kolmogorov-Smirnov test can be used along with Q-Q plots. Comparison of Tconv and Treg distributions from the CNS using the Kolmogorov-Smirnov test, demonstrated a significant difference (p-value = 6.978 × 10⁻⁵) that can be visualized in the Q-Q plot where none of the points fall on the line (Fig. 4E). This shift is seen in the Gaussian curves where the CNS Treg curve is shifted to the left of the CNS Tconv curve (Fig. 3C). Although the CNS Treg affinity range is as wide as the CNS Tconv range, their distributions are significantly different (Fig. 3A and 4E). This difference in distribution for Tconv and Treg was specific to the CNS, as the same comparison of the peripheral CLN populations revealed overlapping distributions (p-value = 0.7724, Fig. 4F).
CNS Tregs are of thymic origin
We next wanted to determine the developmental origins of the CNS Tregs at peak disease. It has been published that adoptive transfer of highly purified naïve Tconv cells from Foxp3 GFP reporter mice followed by EAE induction lead to no pTregs generated (18). Helios was used as a marker of tTregs since it has been shown to be highly expressed by Foxp3+ recent thymic emigrants while pTregs induced during oral tolerance lack Helios (42). Our data show greater than 90% of the Foxp3+ Tregs expressed Helios in the CNS (Fig. 5A and B). It has been reported that Helios expression can be induced under certain circumstances (43, 44), however we did not observe any ex vivo staining of Tconv cells above six percent in any organ during EAE (Supplemental Figure 2). To provide further evidence of the CNS Tregs being of thymic origin a tTreg-methylation (tTreg-Me) signature was used. This methylation signature consists of key regions in foxp3, tnfrsf18, ctla4, and ikzf4 which are hypomethylated in tTregs compared to naïve Tconvs (34). Ohkura et al. and others have demonstrated that this methylation signature was not induced merely by the expression of Foxp3, since TGF-β induced Tregs (iTregs) failed to demethylate these regions and their methylation were consistent with Tconvs (34, 45–49).
Figure 5.

CNS Tregs are of thymic origin. (A) Representative flow plot for Helios expression by Treg cells, related to Supplemental Figure 2 showing Helios by Foxp3 expression for CD4+ T cells. (B) Average frequency with SEM of Helios expression in Foxp3+ CD4+ cells in various organs at peak disease, Data from seven independent experiments. One-way repeated ANOVA *** p < 0.001 (CNS vs. CLN p = 0.0003, CNS vs. SPL p = 0.0002). (C–F) The methylation status within each gene region was determined for the tTreg-Me signature genes for CD4+ Tconv and Treg from (C, D) splenocytes of naïve mice or (E, F) CNS-infiltrating cells from EAE mice. In panels C and E, each column represents an individual CpG within the region of interest and each row is an individual clone sequenced, where a filled black circle is a methylated CpG and an open circle is a demethylated CpG. Representative data from a single experiment is shown, and below is pie charts to indicate the methylation frequency at that CpG within each of the two experiments. Panels D and F are the total level of methylation for the CpGs for all clones and CpGs across that gene region. Data are from two independent experiments, with at least nine clones sequenced per gene per experiment, except for d21 CNS Treg Foxp3 and CD25 which had at least 4 clones sequenced.
We observed hypomethylation of these regions in Tregs but not Tconvs when cells from spleens of naïve mice were analyzed (Fig. 5C–D and Supplemental Table I). Since our data validated the tTreg-Me signature, we assessed the methylation status of the CNS infiltrating Tregs during EAE. We observed the same pattern of significant demethylation for the CNS CD4+ Foxp3+ Tregs while CNS Tconvs were mostly methylated (Fig. 5E–F and Supplemental Table I). As an internal control for each experiment, CD25 intron 1a was included since in resting Tconv cells that lack CD25 expression this region is methylated and it is demethylated in cells that express CD25 like Tregs and activated Tconvs (34). As expected CD25 was mostly methylated for Tconvs from naïve mice, while this region was predominately demethylated for Tregs (naïve and EAE mice) and Tconvs from the CNS of EAE mice (Fig. 5C–F). Based on these methylation data, we conclude that the majority of the Tregs in the CNS at peak EAE are of thymic origin. The region in foxp3 analyzed was the Treg specific demethylated region (TSDR) that is required for stable foxp3 expression and maintenance upon cell division (21). We observed high levels of methylation at the TSDR in the CNS Tregs (Fig 5E–F, foxp3). There was still a significant difference in the methylation pattern of the TSDR between the CNS Tconv and CNS Treg cells (Supplemental Table I).
Discussion
For EAE, tetramers and cytokines greatly underrepresented the frequency of MOG specific Tconv and Treg cells present in the CNS when compared to the ability of those cells to specifically bind MOG:IAb coated RBCs in a micropipette adhesion frequency assay. We and others have demonstrated that especially for self-specific CD4+ T cells in multiple autoimmune models, tetramers miss the majority of the antigen specific cells (14–17, 33). If the cells have low affinity for their cognate pMHC, then they are unlikely to interact with tetramer. For example we have shown that 2D2 transgenic cells do not stain with MOG:IAb tetramer due to their extremely low affinity (15). Cytokine production in response to cognate peptide is able to identify more antigen-specific cells than tetramer (14, 16, 17, 33). In a parallel comparison, we showed that there are approximately 2.4 fold more CNS Tconv cells capable of producing cytokines (IFNγ and TNFα) in response to MOG35-55 peptide compared to tetramer staining (14). During viral infection we also demonstrated that sorted tetramer negative CD44+ T cells could produce cytokines after stimulation with the same antigen specificity as was in the tetramer (14). However it is known that even cytokine production does not faithfully identify all of the antigen specific cells as has been shown with cell lines and transgenic cells (38–41).
Therefore to better assess the total number of antigen specific cells in a polyclonal response, a more sensitive assay like the micropipette adhesion frequency assay is needed. This assay allows for the biophysical interactions of proteins of interest to be measured as the probability of an adhesion event occurring when the receptor and ligand are allowed to interact (29, 30). Unlike surface Plasmon resonance, which is considered a three-dimensional measure of affinity, two-dimensional measures like the micropipette adhesion frequency assay were shown to better correlate with functional data (29, 50). Another advantage of the micropipette assay is the ability to rapidly measure the antigen specificity of a polyclonal response directly ex vivo, since intact T cells can be used to probe various pMHC monomer coated RBCs. As shown in figure 1C, all of the cells that bound MOG:IAb did not have any adhesions for hCLIP specificity control demonstrating the exquisite discrimination of antigens in this assay. Additionally, analysis of a polyclonal response provides an internal control for antigen specificity in that not all of the cells tested will in fact bind the pMHC of interest, especially in sites such as the spleen which contain a diverse repertoire of antigen specificities.
The advantages of the 2D micropipette assay are multiple and greatly explain its increased sensitivity for identification of antigen specific T cells. Many incorrectly assume that the RBC provides a simple increase in avidity extrapolating from work with pMHC tetramers. However in the case of the RBC, it is not a measure of avidity but an increase of valency (density of proteins) presented in their proper membrane context that increase the sensitivity of the assay. Avidity requires one binding event to alter the kinetic rates of subsequent binding events as occurs with pMHC tetramers and antibodies. But the increased number of pMHC molecules on the RBC only increases the probability of a binding event occurring, as demonstrated by multiple pMHC densities yielding different adhesion frequencies but the same affinity (29). Using monoclonal cells, it has been shown that when multiple densities of ligands are used for the same density of receptor, plots confirm that the assay is measuring interactions between a single receptor and ligand (29–31). This monovalent interaction measured by the micropipette assay has been observed for Fcγ receptors with IgG, TCR with pMHC, and CD8 with pMHC. It should also be noted that SPR based assays that measure affinity of purified proteins (3D measurements) requires the measurement of multiple molecules interacting to detect their signal and is not considered to be an avidity interaction. In order to solve for 2D affinity the adhesion frequency must be measured at an equilibrium time point. The time required to reach equilibrium is determined by generating a curve where adhesion frequency is plotted against time. As time increases, the probability of binding events also increases before attaining a plateau level. The equilibrium frequency at the plateau level allows for derivation of the 2D affinity as the equation is defined by the adhesion frequency at equilibrium, density of the TCR, density of the pMHC and surface area of the interaction (see methods). All parameters except the surface contact area can be accurately measured. Since one cannot get an accurate assessment of the contact area, we report our data as relative 2D affinities that contain the contact area term. The density of the TCR takes into account differences in TCR numbers and cell size that may differ among responding cells at distinct point in their cell cycle, allowing measure of the base 2D affinity for the TCR.
As most would expect, there were fewer MOG specific cells in the spleen, with increased frequencies in the draining cervical lymph nodes for Tconv and Treg cells. We also determined that the majority of the CNS infiltrating T cells (~80%) were in fact specific for MOG:IAb, in contrast to less than half and about ten percent by cytokine and tetramer staining respectively (Figs 1E, 1B, and 2), which emphasizes the matched antigen specificities between Tregs and Tconvs. There were significantly more Tregs than Tconv that stained with tetramer in the CNS, which could result from differences in the clustering or kinetics of TCR reorganization between Tregs and Tconvs. Since tetramer is an avidity-based reagent, these differences could greatly affect staining. We have shown using bulk polyclonal cells that there appears to be an affinity cut-off that allows for tetramer staining, however future studies will be needed to determine if these boundaries are different for Tregs and Tconvs or other T helper cell subsets (14). In fact we would argue that even a higher percentage of the CNS T cells are MOG specific, given that the micropipette assay will also miss extremely low affinity cells represented by the 2D2 TCR Tg (15). The high frequency of MOG-specific cells in the CNS is not surprising since it is the site of antigen expression and inflammation. Similarly, the CLN collects APCs loaded with CNS antigens to prime T cell responses (51). Although these data cannot completely rule out the possibility of epitope spread, it would comprise a relatively small number of T cells at peak disease. We have also recently shown in a relapsing remitting secondary progressive EAE model in NOD mice that >70% of the CD4+ T cells are still specific for the inducing antigen (27). Again, suggesting that additional antigen specificities are not a required factor for chronicity.
Based on the methylation signature and Helios expression, we would contend that the CNS Tregs are of thymic origin. They had similar hypomethylation of key regions previously identified to be only demethylated in tTregs and not in Tconv or iTregs (34). This conclusion is also supported by the inability to identify pTregs generated during EAE (18). The TSDR region was mostly methylated in the CNS Tregs compared to naïve Tregs, however all other gene regions were still hypomethylated. There is the possibility that these cells could be pTregs, however the origin of Tregs, whether thymic or peripherally induced, is a difficult question to answer and to date there has not been a discriminating difference identified that faithfully and consistently discerns this distinction. It has been shown that in the presence of proinflammatory cytokines, STAT6 and STAT3 bind to the TSDR recruiting DNA methyltransferases to this region, which could explain the high levels of methylation that we observed (20). During acute EAE, the TSDR is demethylated during disease recovery when the inflammatory milieu would be weaning which could provide further support for the reason we saw methylation of this region during peak response in the chronic model (52).
One possible consequence of the TSDR being remethylated is lineage instability leading to the generation of pathogenic ex-Foxp3 cells (22). Mice that lack this region of DNA develop thymic Tregs that are capable of preventing the overt autoimmunity seen in mice deficient in Foxp3, however upon transfer to a lymphopenic host and subsequent homeostatic proliferation lose Foxp3 expression (21). It has been demonstrated that Tregs in the CNS are capable of proliferation on the basis of Brdu incorporation (18). But it was recently shown that the lineage instability due to lacking the TSDR requires multiple rounds of division before the loss of Foxp3 expression (20). Therefore if the cells are not actively dividing, then they still could be stable and upon the withdrawal of the inflammatory cytokines the TSDR could become demethylated again. In fact a recent publication showed that the TSDR is actively demethylated in Foxp3+ Treg thymocytes even in the presence of a late G1 inhibitor, which would allow for non-dividing Tregs to demethylate this region to maintain lineage stability (53). To rule out the possibility of misidentification of Tregs due to differences in protein turnover for Foxp3 and GFP in the reporter mice, we repeated the experiments using antibody staining for Foxp3 to separate Tregs from Tconvs and obtained similar results. Future work will be done to determine the extent of any contribution to affinity by ex-Foxp3.
At peak disease, there is a 1.5 fold enrichment of Tregs present in the CNS compared to peripheral sites. In addition there was an increase in the overall frequency of Tregs present in the periphery of EAE mice compared to age-matched naïve control mice. This result is consistent with a report that showed that peptide immunization could lead to de novo tTreg development of MBP-specific TCR Tg mice on a RAG-deficient background, which normally lack Tregs (54). It was shown that if the mice were thymectomized prior to peptide administration, then there was only a slight delay in disease kinetics and the generation of Tregs was greatly impaired. Therefore during EAE induction, it is possible that the MOG peptide required to induce disease is also leading to de novo tTreg development. The authors did note that when two doses of pertussis toxin were given, there was a marked decrease in the numbers of Tregs generated in their Tg RAG−/− mice, which were not sufficient for disease prevention. When the frequency of MOG-specific Tregs as a percent of total CD4+ T cells is calculated, there is an enrichment of MOG-specific Tregs in the draining lymph node and at the site of autoimmunity, which is not appreciated when just the total percentage of Foxp3+ cells.
This study is the first to report the affinities of tTreg cells for a self-antigen. The CNS Tregs had the largest range of affinity for MOG, but on average it was lower than CNS Tconv cells. It is intriguing to speculate that this deviation in affinities between Tconv and Treg at the site of tissue inflammation is causative for chronic disease and escape from Treg mechanisms of peripheral tolerance. Although it has been hypothesized that antigen specific tTregs would have high affinity for their cognate antigen, this question is extremely difficult to answer (5, 6, 55–58). The reason for this is the uncertainty of whether the self-specific Treg that developed in the thymus selected on the same cognate antigen. For a cytochrome-c specific Tg, a positive selecting ligand has been identified and based on the fact that it is unable to induce proliferation of mature T cells on its own we would assume that it is lower affinity than the cognate agonist (12). While we don’t know the selecting peptide for the MOG reactive T cells, the outcome is Tregs and Tconvs spanning an entire range of affinities. The concept that higher affinity TCRs are selected and survive to become tTregs for each self selecting peptide is possible, but the identification of lower affinity TCRs for MOG and the wide range in affinity raises questions to this model of tTreg selection. Proof would have to come from analysis of polyclonal populations of T cells for which the self selecting peptides are known which is currently not possible. What we can take from these studies is that for the same self-antigen, Tconv and Treg cells have a range of affinities comprised of predominately low affinity cells below the detection level of pMHC class II tetramers.
In conclusion these data are the first to identify the frequency and affinity of Tregs for an endogenous self-antigen during autoimmune disease. We show that antigen specific Tregs span a range of affinities for self that overlaps with Tconvs in the periphery although in the CNS at the site of autoimmune disease the two populations have unique affinity distributions shifted to favor high affinity Tconvs. The functional consequences for higher and lower affinity TCRs on Tregs need to be determined, but the altered Treg distribution pattern in the CNS potentially suggests mismatched TCR affinities as a mechanism for disease progression.
Supplementary Material
Acknowledgments
We would like to acknowledge the NIH Tetramer Core Facility for supplying the monomers. The authors would like to thank: Dr. JW Austin for training in bisulfite sequencing, BA Barwick for supplying the custom R script, LA Lawrence for maintaining our mouse colony, and all the members of the Evavold lab for their critical reading of this manuscript. We would also like to acknowledge the Emory School of Medicine and Emory Children’s Pediatric Flow cores for the sorts, especially RE Karaffa and AJ Rae.
This work was supported in part by NIH R01 awards NS071518 and AI110113 (BDE), and an NIH training grant T32 AI007610 and NIH F31 DK089932 (JDH).
Abbreviations used in this article
- pMHC
peptide MHC
- 2D
two-dimensional
- Tconv
T conventional cell
- Treg
regulatory T cell
- MOG
myelin oligodendrocyte glycoprotein
- tTreg
thymic derived Treg
- pTreg
peripheral induced Treg
- EAE
experimental autoimmune encephalomyelitis
- CNS
central nervous system
- CLN
cervical lymph node
- SPL
spleen
- tTreg-Me
tTreg-methylation
- TSDR
Treg specific demethylated region
References
- 1.Danke NA, Koelle DM, Yee C, Beheray S, Kwok WW. Autoreactive T cells in healthy individuals. J Immunol. 2004;172:5967–5972. doi: 10.4049/jimmunol.172.10.5967. [DOI] [PubMed] [Google Scholar]
- 2.Sakaguchi S, Sakaguchi N, Asano M, Itoh M, Toda M. Immunologic self-tolerance maintained by activated T cells expressing IL-2 receptor alpha-chains (CD25). Breakdown of a single mechanism of self-tolerance causes various autoimmune diseases. J Immunol. 1995;155:1151–1164. [PubMed] [Google Scholar]
- 3.Brunkow ME, Jeffery EW, Hjerrild KA, Paeper B, Clark LB, Yasayko SA, Wilkinson JE, Galas D, Ziegler SF, Ramsdell F. Disruption of a new forkhead/winged-helix protein, scurfin, results in the fatal lymphoproliferative disorder of the scurfy mouse. Nat Genet. 2001;27:68–73. doi: 10.1038/83784. [DOI] [PubMed] [Google Scholar]
- 4.Bennett CL, Christie J, Ramsdell F, Brunkow ME, Ferguson PJ, Whitesell L, Kelly TE, Saulsbury FT, Chance PF, Ochs HD. The immune dysregulation, polyendocrinopathy, enteropathy, X-linked syndrome (IPEX) is caused by mutations of FOXP3. Nat Genet. 2001;27:20–21. doi: 10.1038/83713. [DOI] [PubMed] [Google Scholar]
- 5.Jordan MS, Boesteanu A, Reed AJ, Petrone AL, Holenbeck AE, Lerman MA, Naji A, Caton AJ. Thymic selection of CD4+CD25+ regulatory T cells induced by an agonist self-peptide. Nat Immunol. 2001;2:301–306. doi: 10.1038/86302. [DOI] [PubMed] [Google Scholar]
- 6.Kawahata K, Misaki Y, Yamauchi M, Tsunekawa S, Setoguchi K, Miyazaki J, Yamamoto K. Generation of CD4(+)CD25(+) regulatory T cells from autoreactive T cells simultaneously with their negative selection in the thymus and from nonautoreactive T cells by endogenous TCR expression. J Immunol. 2002;168:4399–4405. doi: 10.4049/jimmunol.168.9.4399. [DOI] [PubMed] [Google Scholar]
- 7.Bautista JL, Lio CW, Lathrop SK, Forbush K, Liang Y, Luo J, Rudensky AY, Hsieh CS. Intraclonal competition limits the fate determination of regulatory T cells in the thymus. Nat Immunol. 2009;10:610–617. doi: 10.1038/ni.1739. [DOI] [PMC free article] [PubMed] [Google Scholar]
- 8.Leung MW, Shen S, Lafaille JJ. TCR-dependent differentiation of thymic Foxp3+ cells is limited to small clonal sizes. J Exp Med. 2009;206:2121–2130. doi: 10.1084/jem.20091033. [DOI] [PMC free article] [PubMed] [Google Scholar]
- 9.Burchill MA, Yang J, Vang KB, Moon JJ, Chu HH, Lio CW, Vegoe AL, Hsieh CS, Jenkins MK, Farrar MA. Linked T cell receptor and cytokine signaling govern the development of the regulatory T cell repertoire. Immunity. 2008;28:112–121. doi: 10.1016/j.immuni.2007.11.022. [DOI] [PMC free article] [PubMed] [Google Scholar]
- 10.Lio CW, Hsieh CS. A two-step process for thymic regulatory T cell development. Immunity. 2008;28:100–111. doi: 10.1016/j.immuni.2007.11.021. [DOI] [PMC free article] [PubMed] [Google Scholar]
- 11.Pacholczyk R, Kern J, Singh N, Iwashima M, Kraj P, Ignatowicz L. Nonself-antigens are the cognate specificities of Foxp3+ regulatory T cells. Immunity. 2007;27:493–504. doi: 10.1016/j.immuni.2007.07.019. [DOI] [PMC free article] [PubMed] [Google Scholar]
- 12.Lo WL, Felix NJ, Walters JJ, Rohrs H, Gross ML, Allen PM. An endogenous peptide positively selects and augments the activation and survival of peripheral CD4+ T cells. Nat Immunol. 2009;10:1155–1161. doi: 10.1038/ni.1796. [DOI] [PMC free article] [PubMed] [Google Scholar]
- 13.Wojciech L, Ignatowicz A, Seweryn M, Rempala G, Pabla SS, McIndoe RA, Kisielow P, Ignatowicz L. The same self-peptide selects conventional and regulatory CD4(+) T cells with identical antigen receptors. Nat Commun. 2014;5:5061. doi: 10.1038/ncomms6061. [DOI] [PMC free article] [PubMed] [Google Scholar]
- 14.Sabatino JJ, Huang J, Zhu C, Evavold BD. High prevalence of low affinity peptide–MHC II tetramer–negative effectors during polyclonal CD4+ T cell responses. The Journal of Experimental Medicine. 2011;208:81–90. doi: 10.1084/jem.20101574. [DOI] [PMC free article] [PubMed] [Google Scholar]
- 15.Rosenthal KM, Edwards LJ, Sabatino JJ, Jr, Hood JD, Wasserman HA, Zhu C, Evavold BD. Low 2-dimensional CD4 T cell receptor affinity for myelin sets in motion delayed response kinetics. PLoS One. 2012;7:e32562. doi: 10.1371/journal.pone.0032562. [DOI] [PMC free article] [PubMed] [Google Scholar]
- 16.Falta MT, Fontenot AP, Rosloniec EF, Crawford F, Roark CL, Bill J, Marrack P, Kappler J, Kotzin BL. Class II major histocompatibility complex-peptide tetramer staining in relation to functional avidity and T cell receptor diversity in the mouse CD4(+) T cell response to a rheumatoid arthritis-associated antigen. Arthritis Rheum. 2005;52:1885–1896. doi: 10.1002/art.21098. [DOI] [PubMed] [Google Scholar]
- 17.Gebe JA, Falk BA, Rock KA, Kochik SA, Heninger AK, Reijonen H, Kwok WW, Nepom GT. Low-avidity recognition by CD4+ T cells directed to self-antigens. Eur J Immunol. 2003;33:1409–1417. doi: 10.1002/eji.200323871. [DOI] [PubMed] [Google Scholar]
- 18.Korn T, Reddy J, Gao W, Bettelli E, Awasthi A, Petersen TR, Backstrom BT, Sobel RA, Wucherpfennig KW, Strom TB, Oukka M, Kuchroo VK. Myelin-specific regulatory T cells accumulate in the CNS but fail to control autoimmune inflammation. Nat Med. 2007;13:423–431. doi: 10.1038/nm1564. [DOI] [PMC free article] [PubMed] [Google Scholar]
- 19.Schneider A, Long SA, Cerosaletti K, Ni CT, Samuels P, Kita M, Buckner JH. In active relapsing-remitting multiple sclerosis, effector T cell resistance to adaptive T(regs) involves IL-6-mediated signaling. Sci Transl Med. 2013;5:170ra115. doi: 10.1126/scitranslmed.3004970. [DOI] [PubMed] [Google Scholar]
- 20.Feng Y, Arvey A, Chinen T, van der Veeken J, Gasteiger G, Rudensky AY. Control of the inheritance of regulatory T cell identity by a cis element in the Foxp3 locus. Cell. 2014;158:749–763. doi: 10.1016/j.cell.2014.07.031. [DOI] [PMC free article] [PubMed] [Google Scholar]
- 21.Zheng Y, Josefowicz S, Chaudhry A, Peng XP, Forbush K, Rudensky AY. Role of conserved non-coding DNA elements in the Foxp3 gene in regulatory T-cell fate. Nature. 2010;463:808–812. doi: 10.1038/nature08750. [DOI] [PMC free article] [PubMed] [Google Scholar]
- 22.Bailey-Bucktrout SL, Martinez-Llordella M, Zhou X, Anthony B, Rosenthal W, Luche H, Fehling HJ, Bluestone JA. Self-antigen-driven activation induces instability of regulatory T cells during an inflammatory autoimmune response. Immunity. 2013;39:949–962. doi: 10.1016/j.immuni.2013.10.016. [DOI] [PMC free article] [PubMed] [Google Scholar]
- 23.Haribhai D, Lin W, Relland LM, Truong N, Williams CB, Chatila TA. Regulatory T cells dynamically control the primary immune response to foreign antigen. J Immunol. 2007;178:2961–2972. doi: 10.4049/jimmunol.178.5.2961. [DOI] [PubMed] [Google Scholar]
- 24.Ford ML, Evavold BD. Regulation of polyclonal T cell responses by an MHC anchor-substituted variant of myelin oligodendrocyte glycoprotein 35–55. J Immunol. 2003;171:1247–1254. doi: 10.4049/jimmunol.171.3.1247. [DOI] [PubMed] [Google Scholar]
- 25.Gilbert PA, Garnier A, Jacob D, Kamen A. On-line measurement of green fluorescent protein (GFP) fluorescence for the monitoring of recombinant adenovirus production. Biotechnology Letters. 2000;22:561–567. [Google Scholar]
- 26.Dumaswala UJ, Wilson MJ, Jose T, Daleke DL. Glutamine- and phosphate-containing hypotonic storage media better maintain erythrocyte membrane physical properties. Blood. 1996;88:697–704. [PubMed] [Google Scholar]
- 27.Kersh AE, Edwards LJ, Evavold BD. Progression of relapsing-remitting demyelinating disease does not require increased TCR affinity or epitope spread. J Immunol. 2014;193:4429–4438. doi: 10.4049/jimmunol.1401456. [DOI] [PMC free article] [PubMed] [Google Scholar]
- 28.Sabatino JJ, Jr, Shires J, Altman JD, Ford ML, Evavold BD. Loss of IFN-gamma enables the expansion of autoreactive CD4+ T cells to induce experimental autoimmune encephalomyelitis by a nonencephalitogenic myelin variant antigen. J Immunol. 2008;180:4451–4457. doi: 10.4049/jimmunol.180.7.4451. [DOI] [PubMed] [Google Scholar]
- 29.Huang J, V, Zarnitsyna I, Liu B, Edwards LJ, Jiang N, Evavold BD, Zhu C. The kinetics of two-dimensional TCR and pMHC interactions determine T-cell responsiveness. Nature. 2010;464:932–936. doi: 10.1038/nature08944. [DOI] [PMC free article] [PubMed] [Google Scholar]
- 30.Chesla SE, Selvaraj P, Zhu C. Measuring two-dimensional receptor-ligand binding kinetics by micropipette. Biophys J. 1998;75:1553–1572. doi: 10.1016/S0006-3495(98)74074-3. [DOI] [PMC free article] [PubMed] [Google Scholar]
- 31.Huang J, Edwards LJ, Evavold BD, Zhu C. Kinetics of MHC-CD8 interaction at the T cell membrane. J Immunol. 2007;179:7653–7662. doi: 10.4049/jimmunol.179.11.7653. [DOI] [PubMed] [Google Scholar]
- 32.Jiang N, Huang J, Edwards LJ, Liu B, Zhang Y, Beal CD, Evavold BD, Zhu C. Two-stage cooperative T cell receptor-peptide major histocompatibility complex-CD8 trimolecular interactions amplify antigen discrimination. Immunity. 2011;34:13–23. doi: 10.1016/j.immuni.2010.12.017. [DOI] [PMC free article] [PubMed] [Google Scholar]
- 33.Schubert DA, Gordo S, Sabatino JJ, Jr, Vardhana S, Gagnon E, Sethi DK, Seth NP, Choudhuri K, Reijonen H, Nepom GT, Evavold BD, Dustin ML, Wucherpfennig KW. Self-reactive human CD4 T cell clones form unusual immunological synapses. J Exp Med. 2012;209:335–352. doi: 10.1084/jem.20111485. [DOI] [PMC free article] [PubMed] [Google Scholar]
- 34.Ohkura N, Hamaguchi M, Morikawa H, Sugimura K, Tanaka A, Ito Y, Osaki M, Tanaka Y, Yamashita R, Nakano N, Huehn J, Fehling HJ, Sparwasser T, Nakai K, Sakaguchi S. T cell receptor stimulation-induced epigenetic changes and Foxp3 expression are independent and complementary events required for Treg cell development. Immunity. 2012;37:785–799. doi: 10.1016/j.immuni.2012.09.010. [DOI] [PubMed] [Google Scholar]
- 35.Scharer CD, Barwick BG, Youngblood BA, Ahmed R, Boss JM. Global DNA methylation remodeling accompanies CD8 T cell effector function. J Immunol. 2013;191:3419–3429. doi: 10.4049/jimmunol.1301395. [DOI] [PMC free article] [PubMed] [Google Scholar]
- 36.Tang Q, Henriksen KJ, Bi M, Finger EB, Szot G, Ye J, Masteller EL, McDevitt H, Bonyhadi M, Bluestone JA. In vitro-expanded antigen-specific regulatory T cells suppress autoimmune diabetes. J Exp Med. 2004;199:1455–1465. doi: 10.1084/jem.20040139. [DOI] [PMC free article] [PubMed] [Google Scholar]
- 37.Tarbell KV, Yamazaki S, Olson K, Toy P, Steinman RM. CD25+ CD4+ T cells, expanded with dendritic cells presenting a single autoantigenic peptide, suppress autoimmune diabetes. J Exp Med. 2004;199:1467–1477. doi: 10.1084/jem.20040180. [DOI] [PMC free article] [PubMed] [Google Scholar]
- 38.Weaver CT, Saparov A, Kraus LA, Rogers WO, Hockett RD, Bucy RP. Heterogeneity in the clonal T cell response. Implications for models of T cell activation and cytokine phenotype development. Immunol Res. 1998;17:279–302. doi: 10.1007/BF02786452. [DOI] [PubMed] [Google Scholar]
- 39.Bettelli E, Carrier Y, Gao W, Korn T, Strom TB, Oukka M, Weiner HL, Kuchroo VK. Reciprocal developmental pathways for the generation of pathogenic effector TH17 and regulatory T cells. Nature. 2006;441:235–238. doi: 10.1038/nature04753. [DOI] [PubMed] [Google Scholar]
- 40.Whitmire JK, Benning N, Whitton JL. Precursor frequency, nonlinear proliferation, and functional maturation of virus-specific CD4+ T cells. J Immunol. 2006;176:3028–3036. doi: 10.4049/jimmunol.176.5.3028. [DOI] [PubMed] [Google Scholar]
- 41.Williams MA, Ravkov EV, Bevan MJ. Rapid culling of the CD4+ T cell repertoire in the transition from effector to memory. Immunity. 2008;28:533–545. doi: 10.1016/j.immuni.2008.02.014. [DOI] [PMC free article] [PubMed] [Google Scholar]
- 42.Thornton AM, Korty PE, Tran DQ, Wohlfert EA, Murray PE, Belkaid Y, Shevach EM. Expression of Helios, an Ikaros transcription factor family member, differentiates thymic-derived from peripherally induced Foxp3+ T regulatory cells. J Immunol. 2010;184:3433–3441. doi: 10.4049/jimmunol.0904028. [DOI] [PMC free article] [PubMed] [Google Scholar]
- 43.Akimova T, Beier UH, Wang L, Levine MH, Hancock WW. Helios expression is a marker of T cell activation and proliferation. PLoS One. 2011;6:e24226. doi: 10.1371/journal.pone.0024226. [DOI] [PMC free article] [PubMed] [Google Scholar]
- 44.Gottschalk RA, Corse E, Allison JP. Expression of Helios in peripherally induced Foxp3+ regulatory T cells. J Immunol. 2012;188:976–980. doi: 10.4049/jimmunol.1102964. [DOI] [PubMed] [Google Scholar]
- 45.Cheng C, Wang S, Ye P, Huang X, Liu Z, Wu J, Sun Y, Xie A, Wang G, Xia J. ‘Default’ generated neonatal regulatory T cells are hypomethylated at conserved non-coding sequence 2 and promote long-term cardiac allograft survival. Immunology. 2014;143:618–630. doi: 10.1111/imm.12343. [DOI] [PMC free article] [PubMed] [Google Scholar]
- 46.Vahl JC, Drees C, Heger K, Heink S, Fischer JC, Nedjic J, Ohkura N, Morikawa H, Poeck H, Schallenberg S, Riess D, Hein MY, Buch T, Polic B, Schonle A, Zeiser R, Schmitt-Graff A, Kretschmer K, Klein L, Korn T, Sakaguchi S, Schmidt-Supprian M. Continuous T cell receptor signals maintain a functional regulatory T cell pool. Immunity. 2014;41:722–736. doi: 10.1016/j.immuni.2014.10.012. [DOI] [PubMed] [Google Scholar]
- 47.Waight JD, Hofmeister R, Wilson NS. Response to comment on “cutting edge: epigenetic regulation of Foxp3 defines a stable population of CD4+ regulatory T cells in tumors from mice and humans”. J Immunol. 2015;194:3533–3534. doi: 10.4049/jimmunol.1500367. [DOI] [PubMed] [Google Scholar]
- 48.Waight JD, Takai S, Marelli B, Qin G, Hance KW, Zhang D, Tighe R, Lan Y, Lo KM, Sabzevari H, Hofmeister R, Wilson NS. Cutting edge: epigenetic regulation of Foxp3 defines a stable population of CD4+ regulatory T cells in tumors from mice and humans. J Immunol. 2015;194:878–882. doi: 10.4049/jimmunol.1402725. [DOI] [PMC free article] [PubMed] [Google Scholar]
- 49.Yamazaki S, Nishioka A, Kasuya S, Ohkura N, Hemmi H, Kaisho T, Taguchi O, Sakaguchi S, Morita A. Homeostasis of thymus-derived Foxp3+ regulatory T cells is controlled by ultraviolet B exposure in the skin. J Immunol. 2014;193:5488–5497. doi: 10.4049/jimmunol.1400985. [DOI] [PubMed] [Google Scholar]
- 50.Huppa JB, Axmann M, Mortelmaier MA, Lillemeier BF, Newell EW, Brameshuber M, Klein LO, Schutz GJ, Davis MM. TCR-peptide-MHC interactions in situ show accelerated kinetics and increased affinity. Nature. 2010;463:963–967. doi: 10.1038/nature08746. [DOI] [PMC free article] [PubMed] [Google Scholar]
- 51.Hatterer E, Touret M, Belin MF, Honnorat J, Nataf S. Cerebrospinal fluid dendritic cells infiltrate the brain parenchyma and target the cervical lymph nodes under neuroinflammatory conditions. PLoS One. 2008;3:e3321. doi: 10.1371/journal.pone.0003321. [DOI] [PMC free article] [PubMed] [Google Scholar]
- 52.O’Connor RA, Floess S, Huehn J, Jones SA, Anderton SM. Foxp3(+) Treg cells in the inflamed CNS are insensitive to IL-6-driven IL-17 production. Eur J Immunol. 2012;42:1174–1179. doi: 10.1002/eji.201142216. [DOI] [PubMed] [Google Scholar]
- 53.Toker A, Engelbert D, Garg G, Polansky JK, Floess S, Miyao T, Baron U, Duber S, Geffers R, Giehr P, Schallenberg S, Kretschmer K, Olek S, Walter J, Weiss S, Hori S, Hamann A, Huehn J. Active demethylation of the Foxp3 locus leads to the generation of stable regulatory T cells within the thymus. J Immunol. 2013;190:3180–3188. doi: 10.4049/jimmunol.1203473. [DOI] [PubMed] [Google Scholar]
- 54.Zelenay S, Bergman ML, Paiva RS, Lino AC, Martins AC, Duarte JH, Moraes-Fontes MF, Bilate AM, Lafaille JJ, Demengeot J. Cutting edge: Intrathymic differentiation of adaptive Foxp3+ regulatory T cells upon peripheral proinflammatory immunization. J Immunol. 2010;185:3829–3833. doi: 10.4049/jimmunol.1001281. [DOI] [PubMed] [Google Scholar]
- 55.Apostolou I, Sarukhan A, Klein L, von Boehmer H. Origin of regulatory T cells with known specificity for antigen. Nat Immunol. 2002;3:756–763. doi: 10.1038/ni816. [DOI] [PubMed] [Google Scholar]
- 56.Relland LM, Mishra MK, Haribhai D, Edwards B, Ziegelbauer J, Williams CB. Affinity-based selection of regulatory T cells occurs independent of agonist-mediated induction of Foxp3 expression. J Immunol. 2009;182:1341–1350. doi: 10.4049/jimmunol.182.3.1341. [DOI] [PMC free article] [PubMed] [Google Scholar]
- 57.Walker LS, Chodos A, Eggena M, Dooms H, Abbas AK. Antigen-dependent proliferation of CD4+ CD25+ regulatory T cells in vivo. J Exp Med. 2003;198:249–258. doi: 10.1084/jem.20030315. [DOI] [PMC free article] [PubMed] [Google Scholar]
- 58.Moran AE, Holzapfel KL, Xing Y, Cunningham NR, Maltzman JS, Punt J, Hogquist KA. T cell receptor signal strength in Treg and iNKT cell development demonstrated by a novel fluorescent reporter mouse. J Exp Med. 2011;208:1279–1289. doi: 10.1084/jem.20110308. [DOI] [PMC free article] [PubMed] [Google Scholar]
Associated Data
This section collects any data citations, data availability statements, or supplementary materials included in this article.