

Abstract
Mass cytometry was used to investigate the effect of CMV reactivation on lymphocyte reconstitution in hematopoietic cell transplant patients. For eight transplant recipients, four CMV negative and four CMV positive, we studied peripheral blood mononuclear cells (PBMC) obtained six months after unrelated donor hematopoietic cell transplantation (HCT). Forty cell-surface markers, distinguishing all major leukocyte populations in PBMC, were analyzed by mass cytometry. These included 34 NK cell markers. Compared to healthy controls, transplant recipients had higher HLA-C expression on CD56−CD16+ NK cells, B cells, CD33bright myeloid cells and CD4CD8 T cells. The increase in HLA-C expression was greater for CMV-positive HCT recipients than CMV negative recipients. Present in CMV-positive HCT recipients, but not in CMV-negative HCT recipients or controls, is a population of KIR-expressing CD8 T cells not previously described. These CD8 T cells co-express CD56, CD57 and NKG2C. The HCT recipients also have a population of CD57+NKG2A+ NK cells that preferentially express KIR2DL1. An inverse correlation was observed between the frequencies of CD57+NKG2C+ NK cells and CD57+NKG2A+ NK cells. Although CD57+NKG2A+ NK cells are less abundant in CMV-positive recipients, their phenotype is of a more activated cell than the CD57+NKG2A+ NK cells of controls and CMV-negative HCT recipients. These data demonstrate that HCT and CMV reactivation are associated with an increased expression of HLA-C. This could influence NK cell education during lymphocyte reconstitution. The increased inhibitory KIR expression by proliferating CMV-specific CD8 T cells suggests regulatory interactions between HLA-C and KIR might promote GVL effects following transplantation.
Introduction
Natural Killer (NK) cells recognize and kill infected, transformed and allogeneic cells with a diversity of activating and inhibitory cell-surface receptors (1–3). These receptors recognize epitopes on major histocompatibility complex class I and class I-like molecules, costimulatory ligands, stress-related molecules, and cytokines (4–6). In humans, the HLA class I receptors include Killer cell Ig-like receptors (KIR) that recognize epitopes of HLA-A, -B and –C (A3/11, Bw4, C1 and C2) (7) and CD94:NKG2A heterodimers that recognize HLA-E (8). Among the receptors expressed by NK cells, the natural cytotoxicity receptors (NKp30, NKp44 and NKp46), NKG2D and CD16 can all activate a functional response on binding ligand (2), although CD16 is the only one that directly triggers cytotoxicity in the absence of cytokines or secondary signaling (9, 10). Following therapeutic hematopoietic cell transplantation (HCT) for myeloid leukemia, NK cells are the first lymphocyte population to reconstitute from the graft and enter the circulation. They are believed to play a pivotal role in promoting GVL effects (11, 12).
Human cytomegalovirus (CMV) infection has direct effects on NK cells. One is an increased abundance of NK cells expressing the NKG2C receptor in the peripheral blood (13), that is maintained throughout life. NKG2C is expressed by very few NK cells in the peripheral blood of CMV uninfected individuals (14). CMV reactivation is reported to reduce the risk of early leukemic relapse for patients receiving allogeneic HCT as treatment for AML (15). Previously, we studied CMV reactivation in AML patients following allogeneic HCT, observing the maturation of NKG2C+ NK cells that preferentially express KIR2DL2/3 and have enhanced capacity to produce IFN-γ in response to HLA class I-deficient target cells (16). These adaptive NKG2C+ NK cells can also exert cytolytic function as well as CD16-mediated ADCC (17). We and others have shown that the NKG2C–expressing NK cells of healthy CMV-positive individuals preferentially express KIR that recognize self HLA-C epitopes: C1, C2 or C1 and C2 (17–20).
HLA-C is crucial for educating many NK cells. We found that HCT recipients having one or two C1+HLA-C allotypes experience enhanced protection from AML relapse when the donor has KIR B/x genotype and there is an HLA-C mismatch between donor and recipient (21). C2-specific KIR2DS1 can also provide protection against leukemia relapse in an HLA-C-dependent manner (22). Grafts from KIR2DS1+, C1 homozygous donors provided greater protection against relapse than grafts from donors who lack KIR2DS1 or have KIR2DS1 in combination with C2 (22). Consistent with these clinical observations, is the demonstration in vitro that KIR2DS1-expressing NK cells from HLA-C2 homozygous individuals exhibit weak cytotoxic responses (23). Although CMV infection of human cells does not alone enhance their expression of HLA-C (24), the combined effects of HCT and CMV on HLA-C have yet to be studied.
Previously, we used mass cytometry to explore the diversity of expression of 34 NK cell markers in the NK cell populations of a panel of healthy donors (19). This study demonstrated a strong genetic regulation of the inhibitory receptors that recognize HLA class I ligands (KIR, CD94:NKG2A and LILRB1). In contrast, the activating receptors, which recognize other ligands, appeared more sensitive to environmental factors (19). In the investigation reported here, we used mass cytometry to study the NK cell and T cell populations of patients who received a hematopoietic cell transplant (HCT) as treatment for AML. In particular, we explored the effect of CMV reactivation during lymphocyte reconstitution following HCT.
MATERIAL AND METHODS
Patients and samples
Peripheral blood mononuclear cells (PBMC) were either obtained from HCT patients, six months after transplantation, or from healthy controls and cryopreserved (Fig. 1). These samples were the source for the NK cells analyzed. Transplantations were performed at the University of Minnesota. Patients were monitored weekly for CMV reactivation, by quantitative PCR performed in the clinical virology laboratory. When it occurs, CMV reactivation is detected between days 14 and 57 post-transplantation. CMV viremia (>100 copies per ml of blood) was treated with an eight-week course of Ganciclovir. Blood samples from the transplanted patients were collected after obtaining informed consent and approval from the University of Minnesota Institutional Review Board according to the declaration of Helsinki. PBMC from sixty-four healthy individuals were isolated from leukocyte reduction system (LRS) chambers through Ficoll density-gradient centrifugation. LRS chambers were purchased from the Stanford Blood Center.
Figure 1. HCT recipient characteristics.
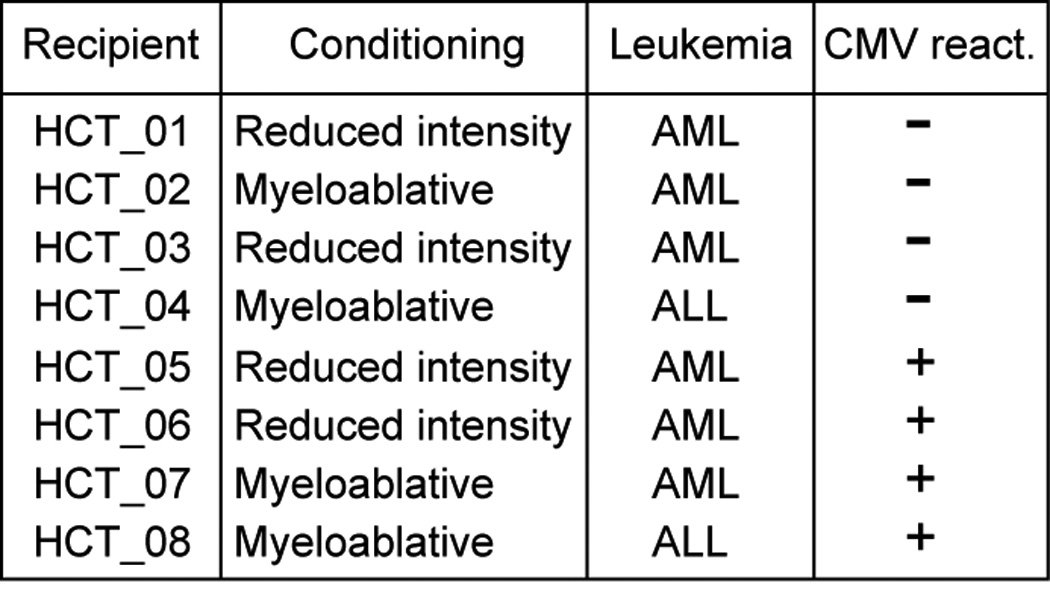
A list of HCT recipients including information on conditioning regime, type of leukemia and CMV status. HCT recipients were aged 28–61, median age, 44.
KIR and HLA Genotyping and CMV serology
In a previous study (16), the eight HCT recipients were typed for HLA-A, -B and –C alleles and for the presence or absence of KIR genes using the PCR-SSOP method. Serological typing for CMV infection was obtained per the University of Minnesota standard of care practices (25, 26). Serological CMV typing and HLA class I genotyping of the sixty-four controls were determined at the Stanford Blood Center. Both HLA-A, -B and –C genotypes and the presence or absence of NK cell ligands are shown in Figure 2.
Figure 2. HLA genotyping for CMV-negative controls and HCT recipients.
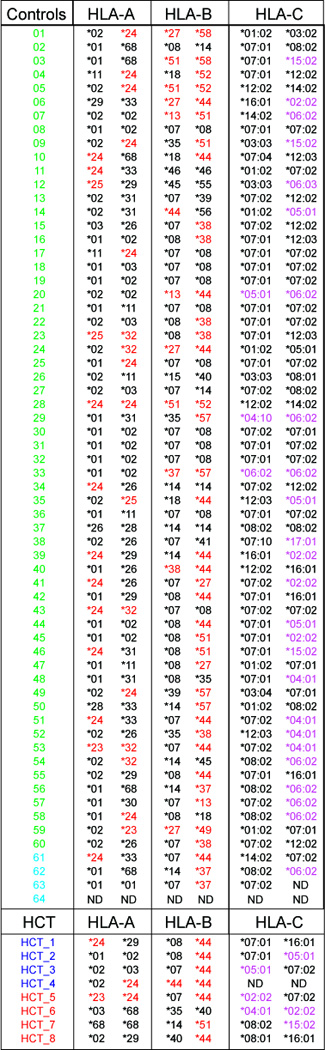
Genotypes for HLA-A, -B and –C are provided for sixty CMV-negative controls (green font), four CMV seropositive controls (light blue font), four CMV seronegative (dark blue font) and four CMV-positive (red font) HCT recipients. HLA-A and –B alleles listed in red font indicate expression of the Bw4 epitope. HLA-C allotypes in purple font indicate expression of the C2 epitope.
Functional assays
Two assays of NK cell function were performed. In the first test, the NK cell response to missing-self was assayed after challenge and culture of NK cells with class I-deficient K562 cells. The second test measured the ADCC response of NK cells after challenge and culture with Raji cells coated with anti-CD20 antibody. PBMC (5 × 10⁵) were mixed with K562 or Raji cells at a ratio of 10:1 in V-bottom 96-well plates, centrifuged at 1,000 rpm for 3 minutes and incubated at 37°C for 5 hours. Brefeldin A and monensin (both from BD Biosciences) were added to cultures after 1 hour. For K562 stimulation, PBMC cultured in complete medium and nothing else were used as a negative control. For ADCC assays, 2 × 10⁶/ml Raji cells were pre-coated with either Rituximab (Genentech) at 10 µg/ml or with murine IgG at 10 µg/ml for 30 minutes. Raji cells were washed in RPMI/10% FBS and then mixed with PBMC.
Cell-staining, data acquisition, and data analysis
PBMC samples were thawed and washed with RPMI-1640 (Corning Cellgro) containing 10% fetal bovine serum (heat-inactivated), 2mM L-Glutamine and antibiotics (penicillin [100 units/ml] and streptomycin [100mg/ml]) (Gibco BRL/Life technologies) and incubated at 37°C in 5% CO2 for 4 hours. Two million PBMC were stained for mass cytometry analysis, which was performed as described (19) using the 39 antibodies listed in Table S1, as well as cisplatin (used as a cell viability reagent). Following the extracellular antibody staining in functional assays, the cells were fixed, permeabilized and stained for intracellular IFN-γ and MIP-1β. Staining for CD107a was integrated in the extracellular staining panel as a surrogate measure of cytotoxicity. NK cells were identified with a serial gating strategy (Fig. S1) allowing the frequency of NK cells expressing each receptor to be measured (Figure 3). The data were acquired with a CyTOF 2® instrument (Fluidigm) in the Stanford Shared FACS Facility (purchase of this instrument was supported by grant NIH S10OD016318-01). Data were analyzed using FlowJo software v9.4.8 (Treestar, Inc). Analysis by spanning-tree progression of density normalized events (SPADE) was as described (19, 27).
Figure 3. Comparing NK cell receptor expression on NK cells between controls and HCT recipients.

NK cells were defined by a gating strategy described in Fig. S1. Six patterns of perturbations in receptor expression between healthy controls and HCT recipients were observed and are labeled Group 1–6. CMV-neg Controls, Healthy CMV seronegative individuals; CMV-pos Controls, Healthy CMV seropositive individuals; CMV-negative, HCT recipients that are CMV seronegative; CMV-positive, HCT recipients seropositive with reactivated CMV; ns, not significant. Data represent means (± SE).
Antibody Conjugation
Antibodies were purchased from the companies specified in Table S1 and labeled using Maxpar-X8 labeling reagent kits (DVS Sciences) according to the manufacturer’s instructions and as previously reported (19).
Statistical Analysis
Statistical analyses were performed using Excel (Microsoft Corp), Prism v5 (GraphPad Software, Inc.) and the Open Source statistical package R www.r-project.org; ISBN 3–900051-07-0). Fold change differences in frequencies of adaptive NKG2A+ and NKG2C+ NK cells shown in Fig. 4C were calculated by dividing the larger frequency by the smaller frequency, so that the magnitude of change would be the same in both directions. The values were then displayed as a heat map.
Figure 4. Comparison of phenotypes and function of adaptive CD57+NKG2C+ and CD57+NKG2A+ NK cells.
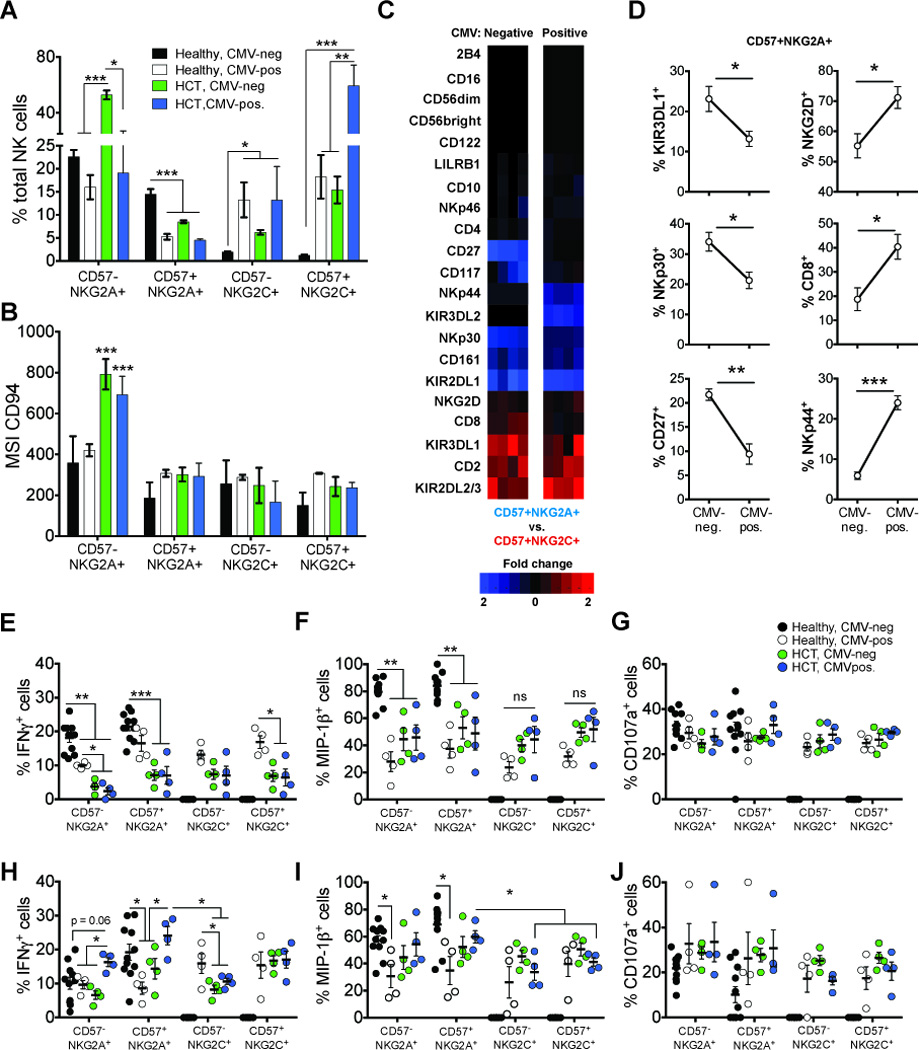
(A) The frequency of total NK cells that are CD57−NKG2A+, CD57+NKG2A+, CD57−NKG2C+ and CD57+NKG2C+ and (B) mean signal intensity (MSI) of CD94 expression within each population from CMV-negative controls (black bars; N=40), CMV-positive controls (white bars; N=4), CMV-negative (green bars; N=4) and CMV-positive (blue bars; N=4) HCT recipients. (C) Heat maps comparing fold change in frequency of each receptor between CD57+NKG2A+ and CD57+NKG2C+ NK cells in CMV-negative (left column) and CMV-positive (right column) HCT recipients. Shaded boxes represent increased fold change differences biased towards CD57+NKG2C+ (red) and CD57+NKG2A+ (blue). (D) Frequencies of CD57+NKG2A+ NK cells expressing receptors shown to decrease (left column) or increase (right column) in CMV-positive HCT recipients compared to CMV-negative HCT recipients. (E–J) PBMC from CMV-negative (black circles) and CMV-positive (white circles) controls and from CMV-negative (green circles) and CMV- positive (blue circles) HCT recipients were challenged with (E–G) K562 target cells or with (H–J) Raji cells pre-treated with anti-human CD20 antibody. Graphs show the frequencies of NK cell subsets positive for intracellular IFN-γ (E and H), MIP-1β (F and I) and CD107a (G and J). The bars in the dot plots represent mean (± SE). The p values are derived from unpaired Mann Whitney tests. *p<0.05, **p<0.005, ***p<0.0001.
RESULTS
CMV reactivation affects the NK cell repertoire in HCT recipients
To understand better the effects of CMV reactivation in HCT, we used mass cytometry to determine high-resolution NK cell phenotypes. Here we will alternatively describe the patients with reactivated CMV as CMV-positive. We compared CMV-negative HCT recipients and CMV-positive HCT recipients with healthy CMV-negative and CMV-positive healthy controls. Our gating strategy for mass cytometry is shown in representative two-dimensional CyTOF plots (Figs. S1A and S1B). The NK cell receptor staining profiles of the controls exhibited a range of frequency and surface density as measured by the mean signal intensity (MSI) (data not shown). The transplant recipients have NK cell phenotypes that are different from those of the controls. Six trends were observed (Fig. 3): 1) decreased frequencies of receptors for all HCT recipients (KIR3DL2, CD27, and CD56dim); 2) decreased frequency of a receptor only in CMV-reactivated HCT recipients (NKp30); 3) elevated receptor frequencies in all HCT recipients (NKp44, CD56neg(CD16+), CD122 and NKG2D); 4) elevated receptor frequencies only in CMV-negative HCT recipients (CD2, CD94:NKG2A, and CD56bright); 5) elevated receptor frequencies only in CMV-positive HCT recipients (KIR2DL2/3, CD8, CD57, CD94:NKG2C); and 6) no change between controls and HCT recipients (15 of 34 receptors). Mann Whitney tests were performed to compare the frequency of NK cells expressing each receptor between controls and HCT recipients.
Associated with CMV reactivation is a subset of CD57+NKG2A+ NK cells having similarity to adaptive CD57+NKG2C+ NK cells
CMV reactivation is associated with adaptive CD57+NKG2C+ NK cells (15). We compared the size of this NK cell subpopulation in patients, with and without CMV reactivation, and compared them to controls. We first compared the frequencies of NKG2A+ and NKG2C+ NK cells, with and without co-expression of CD57 (Fig. 4A; (CD57−NKG2A+, CD57+NKG2A+, CD57−NKG2C+, CD57+NKG2C+)). Consistent with other reports (16, 28, 29), we observe a significant increase in frequencies of CD57−NKG2A+ NK cells in CMV-negative HCT recipients (p<0.0001), whereas the frequencies in CMV-positive HCT recipients were comparable to controls. These observations contrast with the increase in frequency of NKG2C+ NK cells in HCT recipients, with the highest frequencies being seen after CMV reactivation. Frequencies of CD57+NKG2A+ NK cells were highest in CMV-negative controls and 3 fold lower in CMV-positive HCT recipients (p<0.0001). The frequencies of the CD57+NKG2A+ NK cells were shown to be inversely proportional to the frequencies of the CD57+NKG2C+ NK cells. Thus the CD57+NKG2C+ NK cells were at highest frequency in CMV-positive HCT recipients (mean ~60%) but infrequent in the controls (mean < 3%) (p<0.0001). The CD57+NKG2C+ NK cells from CMV-positive controls and CMV-negative HCT recipients ranged widely in frequency (mean ~15%, range 7–23%).
Because CD94 associates with NKG2A and NKG2C, we used a CD94 specific antibody to quantitate and compare the expression of CD94-associated receptors on different NK cell subpopulations (Fig. 4B). For all HCT recipients, the CD57−NKG2A+ NK cells had significantly higher CD94 expression (p<0.0001) than the other three subpopulations. In no other NK cell subpopulation was there a significant difference in the level of CD94 between HCT recipients and controls. The expression levels detected with anti-NKG2A and anti-NKG2C were comparable to that with anti-CD94, consistent with the well-established stoichiometry of the two receptors (data not shown). In conclusion, these results demonstrate that the majority of NKG2A+ NK cells in HCT recipients have higher CD94 and NKG2A cell surface expression than is seen when is co-expressed with NKG2C. And that CD94 and NKG2A, when expressed on CD57+ NK cells are both expressed at similar levels to those observed for adaptive CD57+NKG2C+ NK cells.
Differential expression of KIR2DL1 and KIR2DL2/3 by CD57+ NK cell subsets in HCT recipients
We next evaluated the frequencies of expression of other markers by CD57+NKG2A+ and CD57+NKG2C+ NK cells in the CMV-negative and CMV-positive HCT recipients. The differences in the frequencies are shown in Figure 4C. Shaded boxes represent expression biased towards CD57+NKG2C+ NK cells (red) and CD57+NKG2A+ NK cells (blue). This analysis revealed a bias in KIR2DL1 and KIR2DL2/3 expression. Thus CD57+NKG2A+ NK cells from HCT recipients preferentially express KIR2DL1, whereas the CD57+NKG2C+ NK cells preferentially express KIR2DL2/3. Although CD57+NKG2C+ NK cells in all HCT recipients express KIR2DL1 (mean (CMV-negative) = 19%; mean (CMV-positive) = 12.7%), the frequencies were substantially higher for the CD57+NKG2A+ NK cells (mean (CMV-negative) = 41.8%; mean (CMV-positive) = 43.7%). Similarly, the CD57+NKG2A+ NK cells of all HCT recipients express KIR2DL2/3 (mean (CMV-negative) = 34.7%; mean (CMV-positive) = 27%), but it is expressed at higher frequency by the CD57+NKG2C+ NK cells (mean (CMV-negative) = 65.2%; mean (CMV-positive) = 72.4%). These data demonstrate an increased frequency of KIR2DL2/3 on CMV-specific CD57+NKG2C+ NK cells and a similar preference for expression of KIR2DL1 on CD57+NKG2A+ NK cells in HCT recipients.
Reduced CD57+NKG2A+ NK cell frequencies in CMV-positive HCT recipients correlate with activated phenotype
To investigate further the reduction in frequencies of CD57+NKG2A+ NK cells in HCT recipients, we determined whether the approximately two-fold frequency difference between the CD57+NKG2A+ NK cells of CMV-positive and CMV-negative HCT recipients correlated with other changes in phenotype resulting from CMV reactivation. We performed an analysis similar to that shown in Fig. 4C. For the CD57+NKG2A+ NK cell subset of CMV-negative and CMV-positive HCT recipients, we compared each NK cell receptor’s frequency of expression (Fig. 4D). In the CD57+NKG2A+ NK cell population from CMV-positive HCT recipients, the number of cells expressing KIR3DL1, NKp30 and CD27 is consistently less than in the CMV-negative recipients. Conversely, CD57+NKG2A+ NK cells expressing NKG2D, CD8 and NKp44 are more numerous in the CMV-positive than in the CMV-negative HCT recipients. The CD57+NKG2A+ population of NK cells was smaller in CMV-positive recipients, but exhibits a surface phenotype that is characteristic of activated cells.
We next measured the capacity of NK cells to mount a missing-self response and mediate antibody-dependent cellular cytotoxicity (ADCC). In the missing-self assay, NK cells were challenged with K562 target cells that lack HLA class I (Fig. 4E–G); in the ADCC assay, NK cells were challenged with Raji cells coated with anti-CD20 antibody (Fig. 4H–J). In the response to K562 cells, NK cells from controls and HCT recipients gave a similar cytotoxic response, as assessed by degranulation, but differed in their cytokine response. NKG2A+ NK cells from CMV-negative controls produced significantly more IFN-γ (Fig. 4E) and MIP-1β (Fig. 4F) compared to NKG2A+ or NKG2C+ NK cells from either CMV-positive controls or the HCT recipients. NKG2A+ and NKG2C+ NK cells from CMV-positive controls produced more IFN-γ than the same NK cell subsets from HCT recipients. Conversely, NKG2A+ and NKG2C+ NK cells from HCT recipients produced more MIP-1β than these cells from CMV-positive controls. The biggest difference in response was between CMV-positive HCT recipients and CMV-positive controls, although not statistically significant. Similar comparisons could not be made for NKG2C+ NK cells, because there were insufficient numbers of these cells in the CMV-negative controls (Fig. 4G).
The ADCC assay showed a frequency of IFN-γ+ NKG2A+ NK cells in the CMV-positive HCT recipients comparable to that in the CMV-negative controls (Fig. 4H). The frequency of IFN-γ+ CD57+NKG2A+ cells (Fig. 4H) and MIP-1β+ CD57+NKG2A+ cells (Fig. 4I) in CMV-positive HCT patients compared with that of NKG2C+ NK cells in CMV-positive HCT recipients. All NK cell subsets degranulated to similar levels in the ADCC assay (Fig. 4J).
Inhibitory receptors are differentially expressed by T cells in CMV-positive HCT recipients
Previous studies demonstrated expression of inhibitory KIR on subsets of CD4 and CD8 T cells, for which KIR expression is associated with regulatory functions (30–34). Here, we evaluated expression of KIR2DL1, KIR2DL2/3, KIR3DL1, KIR3DL2, NKG2A and LILRB1 on the CD3+ T cells from controls and HCT recipients (Fig. 5A). In CMV-positive HCT recipients, we observed significant elevation (p<0.0001) in the frequencies of T cells expressing KIR2DL1, KIR2DL2/3 and KIR3DL2 and a modest increase in the frequency KIR3DL1+ T cells. Thus, on T cells there was upregulation of inhibitory receptors in the context of CMV reactivation. Conversely, the frequencies of LILRB1+ T cells were significantly reduced (p=0.03) in CMV-positive HCT recipients, and frequencies of NKG2A+ T cells varied among the controls and the HCT recipients regardless of CMV status or HCT. We next compared the proportion of KIR+, NKG2A+ and LILRB1+ T cells in the CD4 and CD8 T cell subpopulations (Fig. 5B). In the CMV-negative controls and the CMV-negative HCT recipients the CD4 T cells expressing inhibitory KIR, NKG2A or LILRB1 were more numerous than the CD8 T cells expressing these receptors. In contrast, in the CMV-reactivated HCT recipients there was an increase in the CD8 T cells expressing NK cell receptors. CMV-seropositive controls had elevated numbers of CD8 T cells expressing NKG2A and LILRB1, but still there were proportionally more CD4 T cells expressing NKG2A and LILRB1.
Figure 5. Expression of inhibitory KIR and NKG2A across T cell subsets.
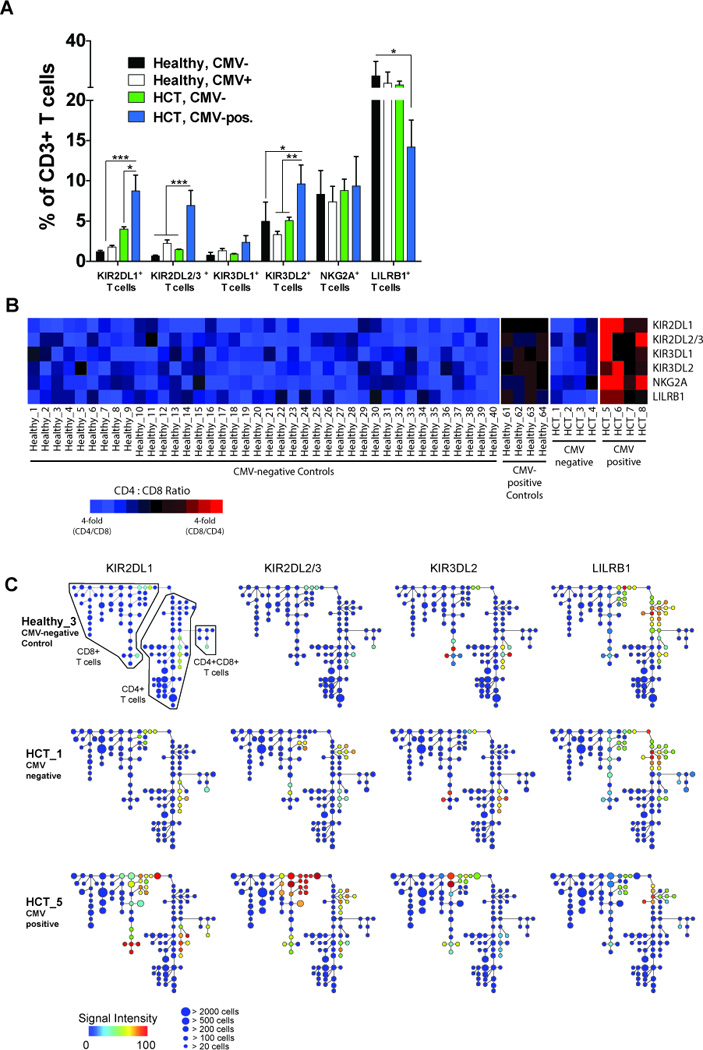
(A) The frequency of CD3+ T cells expressing KIR2DL1, KIR2DL2/3, KIR3DL1, KIR3DL2, NKG2A or LILRB1 in CMV-negative (black bars; N=40) and CMV-positive (white bars; N=4) controls and in CMV-negative (green bars; N=4) and CMV-positive (blue bars; N=4) HCT recipients. Data represent means (± SE). The p values are derived from unpaired Mann Whitney tests. *p<0.05, **p<0.005, ***p<0.0001. (B) Heat map summarizing the proportion of KIR+, NKG2A+ and LILRB1+ T cells that are skewed towards CD4 (blue boxes), CD8 (red bars) or balanced between CD4 and CD8 (black boxes) T cells in CMV-negative and seropositive controls and in CMV-negative and CMV-positive HCT recipients. (C) Spanning-tree Progression Analysis of Density-normalized Events (SPADE) for 3 representative samples (CMV-negative control, CMV-negative and CMV-positive HCT recipients) evaluating distribution of KIR2DL1 (left column), KIR2DL2/3 (second column from left), KIR3DL2 (third column from left) and LILRB1 (right column) expression on CD4, CD8 and CD4CD8 T cells. Node color represents signal intensity and size represents frequency. A SPADE analysis evaluating distribution of all other measured receptors is shown in Figs. S2 and S3.
To visualize the distribution and expression levels of the 39 cell surface markers by PBMC from the groups of HCT recipients and controls, we performed a hierarchical clustering analysis, Spanning-tree Progression Analysis of Density-normalized Events (SPADE) (19, 27, 35) (Fig. 5C, Fig. 7C). Inhibitory NK receptor expression, with the exception of LILRB1, was in all individuals restricted to T cells and NK cells (data not shown). We extracted the nodes from the T cell arm of the SPADE trees (Fig. 5C) and dissected the expression of inhibitory receptors. The analysis identified clusters of T cells in controls and CMV-negative recipients expressing combinations of the six inhibitory receptors, whereas in CMV-positive recipients we found a greater number of T cells that co-express all inhibitory receptors. For instance, a significant proportion of the KIR2DL1+ CD8 T cells also co-express KIR2DL2/3, KIR3DL1, KIR3DL2, NKG2A, and LILRB1. In the CD4 T cell arm of all HCT recipients, there was a second set of clusters that uniquely contain KIR2DL2/3 and LILRB1 but none of the other inhibitory receptors. Whereas LILRB1 is co-expressed with other inhibitory receptors by CD4 and CD8 T cells, it is predominantly expressed on CD4 T cells that express KIR2DL2/3 as their only inhibitory receptor. These data demonstrate a dynamic expression of inhibitory receptors on CD4 and CD8 T cells that appears to be influenced by transplantation (as exemplified by KIR2DL2/3 and LILRB1 expression) as well as by CMV reactivation (as exhibited by all inhibitory receptors).
Figure 7. Expression of HLA-C across major cell lineages in peripheral blood associates with HLA-C allotype but also with CMV reactivation following transplantation.
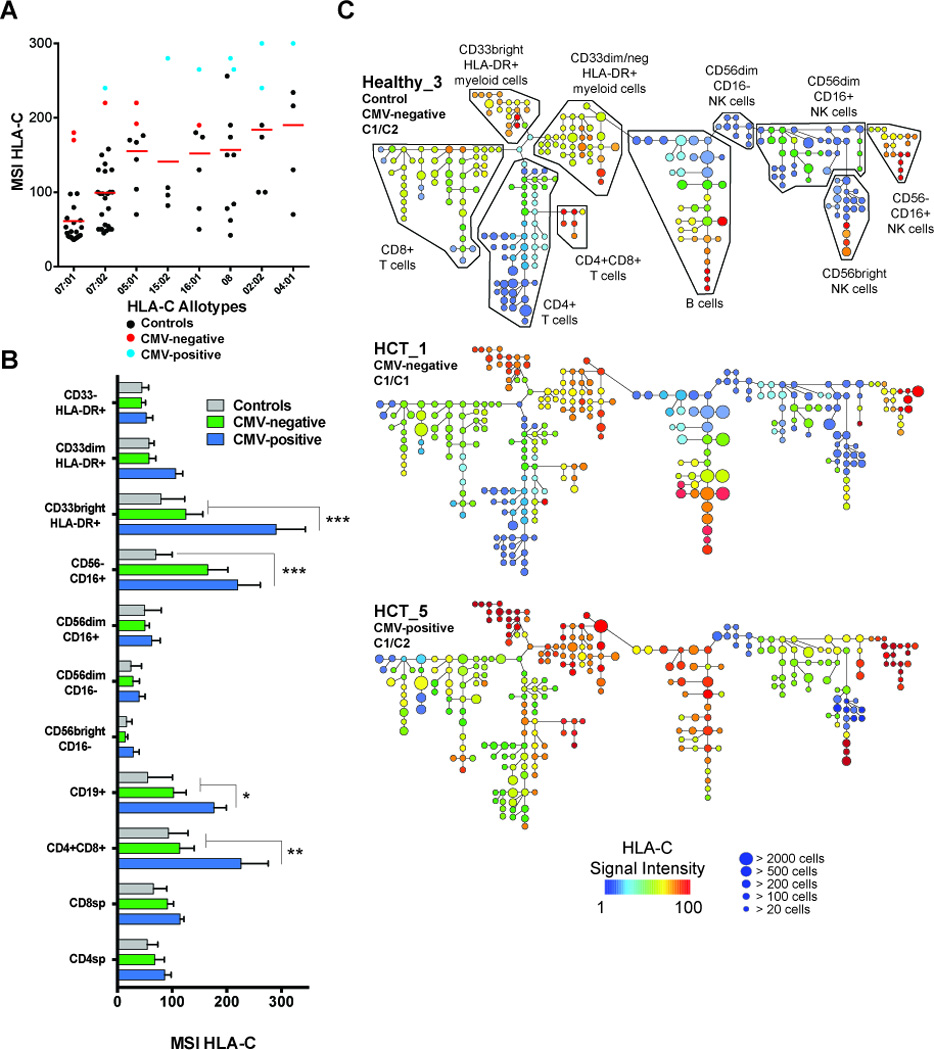
PBMC from controls (N=60), CMV-negative (N=4) and CMV-positive (N=4) HCT recipients were stained ex vivo and analyzed for expression of HLA-C. (A) Mean Signal intensity (MSI) of HLA-C from PBMC is plotted twice for each sample (once for each HLA-C allele). There is strong correlation between expression level of HLA-C and HLA-C allotypes in analysis of variance (p <0.0001). MSI HLA-C from CMV-negative (red circles) and CMV-positive HCT recipients (blue circles) is compared to healthy cmv-negative controls (black circles) matched for HLA-C gene content. (B) Histogram measuring MSI HLA-C on all major cell lineages from CMV-negative controls (grey bars), CMV-negative (green bars) and CMV-positive (blue bars) HCT recipients. Data represent means (± SE). The p values are derived from unpaired Mann Whitney tests. **p<0.005, ***p<0.0001. (C) SPADE clustering analysis for the same 3 representative samples used in Fig. 5 (Controls, CMV-negative and CMV-positive HCT recipients) for evaluating distribution of HLA-C expression across major cell lineages. Node color represents HLA-C signal intensity and size represents frequency.
SPADE analysis identified numerous subsets of CD4 and CD8 T cells that express activating NK cell receptors (Fig. S2 and S3). In controls, expression of activating NK cell receptors was mostly restricted to the same subsets of CD4 and CD8 T cells that express inhibitory receptors in HCT recipients. Thus, subsets of CD4 and CD8 T cells expressing combinations of inhibitory KIR, NKG2A and LILRB1 in HCT recipients are also phenotypically similar to NK cells in expression of activating receptors. Specific to CMV reactivation, the expression of NKG2C was most pronounced on CD8 T cells. NKG2C was also expressed on the CD4 T cells co-expressing inhibitory receptors. Virtually all NKG2C–expressing CD8 T cells co-express CD57, which is also expressed on most CD8 T cells in controls. In the controls and the CMV-negative recipients most CD4 T cells do not express CD57. In CMV-positive recipients, however, CD57 expression on CD4 T cells is enhanced.
CD56+ T cells expressing inhibitory KIR in CMV-positive HCT recipients are functionally competent
From the same experiments reported in Figs. 4E and 4F, we determined the functional capacity of T cells as a measure of secondary activation in response to HLA class I-deficient K562 target cells. Recent reports from our group (36) and others (37) demonstrate T cell expression of KIR is predominantly restricted to CD56-expressing cells. Here, we find no significant difference in the frequencies of CD56+CD3+T cells in HCT recipients and controls (Fig. 6A). As shown in Figure 5, a larger proportion of CD56+ T cells express inhibitory receptors in HCT recipients (Fig. 6B). Of the CD56+ T cells staining negative for inhibitory KIR, NKG2A or LILRB1 (Null), we observed strong activation as measured by the frequency of CD56+ T cells producing IFN-γ (circles) or expressing CD107a (squares) (Fig. 6C). We observed no differences in CD107a expression for HCT recipients and controls. There was a trend for higher production of IFN-γ by Null CD56+ T cells in HCT recipients than controls, but the differences were not statistically significant. While the frequencies of CD107a+ Null CD56+ T cells were comparable for controls and HCT recipients, the activation of Null CD56+ T cells in controls was biased towards degranulation and away from IFN-γ production.
Figure 6. Comparing the functions between Null CD56+ T cells and CD56+ T cells expressing inhibitory NK receptors.
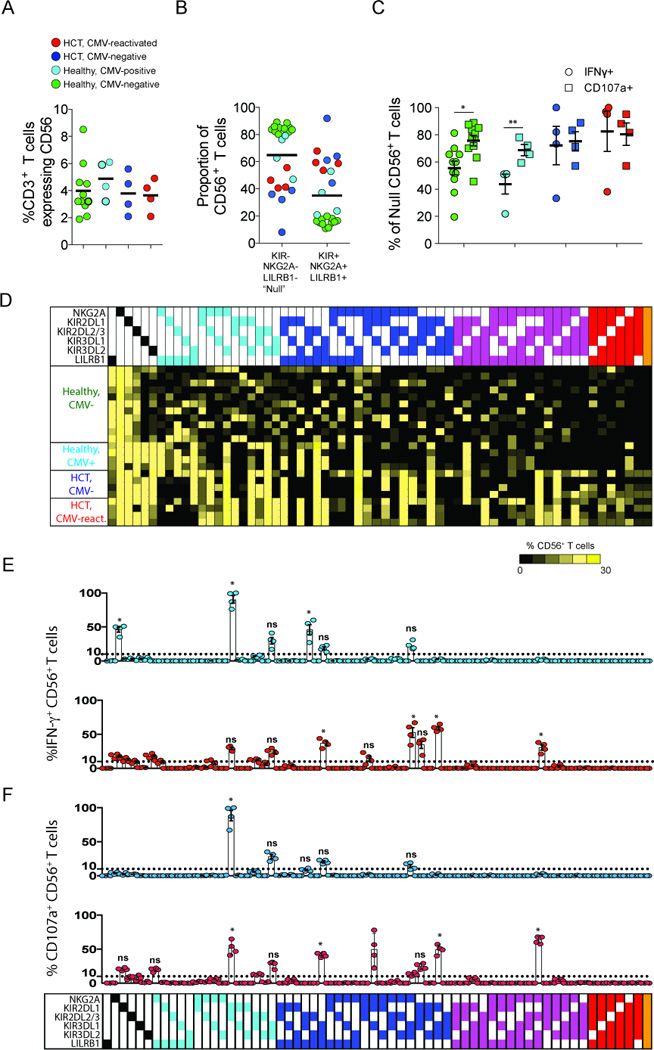
PBMC from CMV-negative controls (green), CMV-seropositive controls (light blue), CMV-negative (dark blue) and CMV-positive (red) HCT recipients were incubated with K562 cells. (A) Comparing the frequency of CD3 T cells expressing CD56 in controls and in HCT recipients. (B) Comparing the proportion of CD56+ T cells that stain positive or negative for inhibitory KIR, NKG2A or LILRB1 (Null). (C) Comparing the frequency of Null CD3 T cells producing IFN-γ (circles) or expressing CD107a (squares) in controls and in HCT recipients. (D) Heatmap summary for Boolean gating analysis of inhibitory KIR, NKG2A and LILRB1 expression on CD56+ T cells resulting in sixty-four possible subsets. Each subset is grouped and color-coded according to the number of inhibitory receptors expressed. The color of each box ranges from black to yellow (range: 0–30%) according to the scale bar beneath the heatmap. (E and F) The frequency of each CD56+ T cell subset producing IFN-γ (E) and expressing CD107a (F) in CMV-negative (light blue circles) and CMV-positive (red circles) HCT recipients. The bars underneath the dot plots represent mean (± SE). The p values are derived from unpaired Mann Whitney tests. *p<0.05, **p<0.005.
We next performed Boolean gating analysis on all CD56+ T cells expressing inhibitory KIR, NKG2A or LILRB1. This analysis defined sixty-four potential CD56+ T cell subsets (Fig. 6D). In the figure, each subset is organized and color-coded according to the number of inhibitory receptors expressed. We observed a broad range in the frequency of cells within each subset (range: 0–30%) of CD56+ T cells. Complementing the SPADE analysis in Fig. 5C, Boolean gating identified in HCT recipients a greater number of CD56+ T cell subsets, expressing three to six inhibitory receptors than in controls. In controls, the majority of CD56+ T cells express one or two inhibitory receptors, regardless of CMV status. We then assessed the 64 subsets of CD56+ T cells for the presence of IFN-γ (Fig. 6E) and CD107a (Fig. 6F). These markers of function were essentially absent when CD56+ T cells of controls were challenged with K562 target cells (data not shown). Statistical significance was determined for each IFN-γ+ or CD107a+ CD56+ T cell subset present at ≥10% CD56+ T cells in HCT recipients by comparing the mean frequency to that of the corresponding subset in controls. Conversely, subsets of CD56+ T cells expressing inhibitory receptors from HCT recipients are functionally competent. Of the 64 CD56+ T cell subsets in CMV-positive HCT recipients, 14 (21.9%) produced IFN-γ at a frequency of ≥10% CD56+ T cells compared to six subsets (9.4%) in CMV-negative HCT recipients (p=0.03) and one subset (1.6%) in CMV-positive controls (p<0.0001) (data not shown).
Eleven of the 64 subsets (17.2%) in CMV-positive HCT recipients expressed CD107a at frequencies ≥10% CD56+ T cells in response to K562 stimulation and all of these subsets were IFN-γ+ as well. Compared to CMV-positive HCT recipients, only four subsets (6.3%) in CMV-negative HCT recipients expressed CD107a (p<0.0001) and one subset (1.6%) in CMV-negative and in CMV-seropositive controls (p<0.0001) (data not shown). Activated CD56+ T cell subsets in HCT recipients expressed between one and three inhibitory receptors. Unique to CMV-positive HCT recipients, was a subset of IFN-γ+CD107a+ CD56+ T cells that expresses four inhibitory receptors: NKG2A, KIR2DL2/3, KIR3DL2 and LILRB1.
HLA-C expression differs among major lineages of peripheral blood leukoctyes and is elevated in HCT recipients
HLA class I genotypes (Fig. 2) and surface expression of HLA-C were determined for controls (Fig. S1C) and HCT recipients (Fig. 7A). In general, HLA-C allotypes are distinguished by their levels of surface expression (38). Independently of these allotype differences, HLA-C is consistently expressed at higher levels in HCT recipients (Mean MSI: 236 ± 11.4) than in controls (Mean MSI: 114 ± 5.5). This difference is statistically significant (p <0.0001). In the CMV-positive HCT recipients HLA-C expression was higher (Mean MSI: 274 ± 7) than in the CMV-negative recipients (Mean MSI: 197 ± 9.2) (p <0.0001). Thus most of the difference in HLA-C expression is a consequence of transplantation, but this is further augmented by CMV reactivation.
We investigated if HLA-C expression induced by transplantation and CMV reactivation differed among the major leukocyte populations. Three subsets of myeloid accessory cells (CD33brightHLA-DR+, CD33dimHLA-DR+, CD33−HLA-DR+), CD19+ B cells, CD3+ T cells (CD4, CD8, CD4CD8), and four NK cell subsets (CD56brightCD16−, CD56dimCD16−, CD56dimCD16+, CD56−CD16+) were defined (Fig. S1A) and their levels of HLA-C determined by mass cytometry (Fig. 7B). In controls, HLA-C expression by the ten leukocyte subpopulations varied by 77 MSI (range, 16–93), whereas the range was wider for the HCT recipients. The MSI range was 15–167 for the CMV-negative recipients and 30–291 for the CMV-positive recipients. HLA-C expression was increased most on CD56−CD16+ NK cells in CMV-negative HCT recipients (p=0.03) and on CD33brightHLA-DR+ monocytes and myeloid DCs (p<0.0001) in CMV-positive HCT recipients. HLA-C expression was also significantly higher on CD19+ B cells (p=0.03), CD56−CD16+ NK cells (p<0.0001) and CD4CD8 T cells (p<0.0001) in CMV-positive HCT recipients compared to CMV-negative controls and HCT recipients. The CD4 and CD8 T cells of CMV-positive HCT recipients had comparable HLA-C expression to the T cells of CMV-negative HCT recipients and controls. These data indicate that the highly resolved analysis of HLA-C expression on leukocyte subsets yields a very different outcome than when analyzing expression on bulk PBMC or CD3 T cells. Thus CMV reactivation most significantly influences HLA-C expression on CD33brightHLA-DR+ monocytes and myeloid DCs and on CD19+ B cells and CD4CD8 T cells in the peripheral blood.
The ten leukocyte populations analyzed for HLA-C expression (Fig. 7B) were clearly identified in SPADE analysis (Fig. 7C). HLA-C expression varied within subsets of CD4 T cells, B cells, CD56dimCD16+ NK cells and CD56brightCD16− NK cells. The variation was seen as bifurcated patterns, with around one half of the cells expressing HLA-C at low level and the other half at much higher level. The cells with highest expression were the subsets of myeloid accessory cells and B cells, CD4CD8 T cells and CD56−CD16+ NK cells. This was the case for controls and CMV-negative recipients. The analysis emphasizes the specific increase in cell-surface HLA-C surface by CMV-positive HCT recipients. For instance, where we observe a bifurcated expression profile in the CD4 T cell arm in controls and in CMV-negative HCT recipients, the minimally staining nodes show increased expression in CMV-positive HCT recipients, though not at the highest levels. We confirmed the presence of these patterns of HLA-C expression in HLA-C homozygous control individuals (data not shown). Thus bifurcated expression of HLA-C in CD4 T cells is not due to HLA-C polymorphism but reflects the presence of numerous subsets of CD4 T cells, among which some T cell subsets express HLA-C at lower levels and others at higher levels. Based on the panel of markers used in this analysis, the CD4 T cells that increase expression of HLA-C in CMV-positive recipients are phenotypically distinctive based on the co-expression of CCR7 and CD27 and specifically lack expression of any inhibitory receptor. These data further illustrate the potential impact of transplantation and/or CMV reactivation on expression of HLA-C in peripheral blood.
DISCUSSION
In this study we used mass cytometry to explore how CMV reactivation might affect the reconstitution of blood NK cell and T cell repertoires following allogeneic transplantation. HCT recipients were either CMV-negative or CMV-positive; the latter having reactivated the virus soon after transplantation. The small number of CMV positive HCT recipients studied limits the strength of the conclusions that can be drawn regarding individual correlates of CMV-mediated protection following transplantation. However, the data points to a variety of differences in the phenotypes induced by HCT and CMV reactivation which should be further evaluated in future study of larger cohorts of CMV positive and CMV negative transplant recipients.
CMV reactivation, when caused by allogeneic transplantation, is hallmarked by expansion in the peripheral blood of adaptive NKG2C–expressing NK cells (16) and effector memory CD8 T cells (39, 40). Comparing the expression of 40 markers by PBMC from HCT recipients and 64 healthy controls allowed us to identify NK cell and T cell phenotypes associated with transplantation and/or with CMV reactivation. We find an association between CMV reactivation and increased HLA-C surface expression on CD33brightHLA-DRbright monocytes and myeloid DCs, as well as on subsets of B cells, CD4CD8 T cells and CD56negCD16+ NK cells. Previous studies have rarely measured surface expression of HLA-C on primary cells of the peripheral blood. HLA-C is the dominant KIR ligand, as it is the only polymorphic HLA class I molecule for which all the allotypes are potential KIR ligands. The two groups of HLA-C allotypes, defined by the C1 and C2 epitopes have different capacities for NK-cell education. C1 allotypes are stronger NK-cell educators than C2 allotypes (41), despite their overall lower levels of cell surface expression (38). In this study, we demonstrate that enhanced expression of HLA-C on PBMC in HCT recipients is significantly influenced by transplantation with a further significant increase on subsets of leukocytes associated with CMV reactivation.
CMV reactivation and increased HLA-C surface expression also associate with increased expression of inhibitory KIR (and reduced expression of LILRB1) on CD8 T cells having an effector memory phenotype. This increase was greatest for KIR2DL1 and KIR2DL2/3. Preferential expansion of KIR2DL2/3+ CD8 T cells in CMV-reactivated HCT recipients has been reported by our group (36) and others (34). To our knowledge, these studies are the first accounts of a surface phenotype directly reflecting CMV reactivation. In CMV-reactivated HCT recipients, there is a restricted repertoire of inhibitory KIR-expressing CD8 T cells, in which a greater proportion of individual CD8 T cells express all inhibitory KIR. In contrast, for CMV-negative HCT recipients we observed many different combinations of inhibitory KIR expressed on CD4 T cells and also in controls. These data indicate dynamic differences between CD4 and CD8 T cells in the expression of inhibitory receptors. Further, while we observed very few KIR-expressing CD57+CD8 T cells in healthy controls (and in CMV-negative HCT recipients), they usually expressed a single KIR receptor, as previously reported for healthy individuals (33).
Little is known of the interactions between cells expressing HLA-C and KIR-expressing effector memory CD8 T cells following allogeneic transplantation and CMV reactivation. HLA class I type has no detectable effect on the selectivity of KIR receptors expressed by CD8 T cells in healthy individuals (33) or in HCT recipients. However, CMV infection in the healthy, aging population results in the expansion of CD8 T cells (42–46) that express memory phenotypes and become senescent (44, 47–50). These studies point to a regulatory role for inhibitory KIR when expressed on CD8 T cells.
Our data demonstrate that KIR-expressing effector memory CD8 T cells are capable of mounting a functional response to HLA Class I-deficient target cells although limited primarily to subsets expressing one to three inhibitory receptors. That we observe in CMV-positive HCT recipients an expansion of CD56+ T cell subsets expressing 4–6 inhibitory receptors that are not activated may suggest a threshold effect for increased regulation of effector memory CD8 T cells. CD8 T cell function was measured in bulk PBMC rather than in isolation. It is likely that activation of KIR-expressing CD8 T cells in HCT recipients reflects signaling through cytokine receptors rather than direct engagement of the T cell receptor. A limitation of this study was the small number of available patient samples. Consequently, an evaluation of the effects of TCR signaling on KIR-expressing CD8 T cells was not possible.
Future studies should evaluate the relationship between KIR-expression by CD8 T cells and their alloreactive response to missing self HLA class I. Such as occurs for certain leukemias (51) as well as during lytic stage EBV infection (52), where controlled reactivation of EBV associates with improved survival following allogeneic transplantation (53). In settings of CMV reactivation and allogeneic transplantation, it will also be of value to measure the impact of expanding KIR-expressing CD8 T cells on the education of reconstituting NK cells, because the two types of cytotoxic lymphocyte could compete for binding to HLA class I ligands. If competition between KIR-expressing CD8 T cells and NK cells does occur, it will be relevant to investigate potential associations with the onset of autoimmune diseases post-transplantation (54). A longitudinal study evaluating phenotype and function of KIR-expressing CD8 T cells in a large cohort of HCT recipients is currently underway.
HLA-C influences the expansion of adaptive NKG2C–expressing cells during infection with CMV, a setting where these cells preferentially express KIR that recognize self MHC class I (17–20). In this study, we hypothesized that adaptive NK cell responses to CMV reactivation subdivide into helper (enhanced IFN-γ production) and effector (enhanced cytotoxicity) arms, and questioned whether NKG2A plays a role. Support for this hypothesis comes from two recent studies: the first demonstrates that CD94dimCD56dim NK cells exhibit greater cytolysis than either CD94brightCD56dim or CD94brightCD56bright NK cells (55); the second shows that CD94:NKG2A educates KIR-expressing NK cells for cytolysis but not for cytokine production (56). Here, we observed a population of CD57+CD56dim NK cells that express CD94:NKG2A at significantly lower levels than CD57−CD56dim NK cells. While at lowest frequencies in CMV-reactivated HCT recipients, these CD57+NKG2A+ NK cells display a strongly activated effector phenotype (increased expression of CD8, NKG2D and NKp44) not seen in controls and that are significantly less activated in CMV-negative HCT recipients. Our data argue for transplantation and CMV-reactivation potentiating this population of NK cells by inducing phenotypes more reflective of effector functions. Our recent demonstration that CMV reactivation caused by transplantation selects for expansion of CD57+NKG2C+ NK cells with enhanced IFN-γ or helper function (16) suggests there are two distinctive arms of adaptive CD57+ NK cells. However, when we measured and compared the functional capacities of adaptive CD57+NKG2C+ and CD57+NKG2A+ NK cells in response to missing self-antigen, we observed no significant differences in IFN-γ, MIP-1β and CD107a expression between NKG2A and NKG2C–expressing NK subsets. Only in CMV-reactivated HCT recipients in response to ADCC, we observed a marginal increase in IFN-γ and MIP-1β expression on NKG2A–expressing cells compared to NKG2C–expressing NK cells.
EBV infection influences the maturation and expansion of CD57+NKG2A+ NK cells in CMV-positive healthy individuals (57). Unlike CMV, which selects for expansion of NKG2C+ NK cells expressing self-reactive KIR, EBV does not affect KIR expression. Although EBV infection was not investigated here, we found no affect of either HLA class I or CMV on the expression of inhibitory KIR by CD57+NKG2A+ NK cells. However, on comparing the expression of inhibitory KIR by CD57+NKG2A+ and CD57+NKG2C+ NK cells in HCT recipients, we found KIR2DL1 is preferentially expressed on CD57+NKG2A+ NK cells. To our knowledge, this is the first account where KIR2DL1, independent of its C2 ligand, is preferentially expressed by NKG2A–educated NK cells.
In summary, the results of this investigation suggest that CMV-reactivation caused by allogeneic transplantation induces increased expression of HLA-C on CD33brightHLA-DRbright monocytes and myeloid DCs, as well as on subsets of B cells, CD4CD8 T cells and on CD56negCD16+ NK cells, which may serve roles for regulating NK cell and CD8 T cell cytolysis during hematopoietic reconstitution. Increased expression of HLA-C by specialized subsets of lymphocytes and antigen-presenting cells (APC) may indirectly reflect their activation status. Because the expression of KIR ligands is increased after transplant-induced CMV reactivation, it will be important to determine if enhanced IFN-γ production by adaptive CD57+NKG2C+ NK cells expressing self-reactive KIR represents an activating response to secondary APC-derived cytokines (58), rather than recognition of a human CMV-specific ligand, such as m157 protein expressed on CMV-infected cells in mice (59–62). CMV reactivation correlates with a modest decrease in early leukemic relapse in a cohort of transplant recipients most of whom received HLA matched allografts (83%) (15). For future studies evaluating HLA-C mismatched transplantations for CMV reactivation, it will be important to determine whether the rapidly expanding KIR-expressing memory CD8 T cells are senescent. This is observed during the normal course of CMV infection. Alternatively, function may be restored to these cells due to the absence of cognate HLA-C ligand or to amplification of inflammatory cytokines. It will also be important to evaluate the therapeutic potential of CD57+NKG2A+ NK cells for optimizing a cytolytic response to residual tumors in settings of allogeneic transplantation.
Supplementary Material
ACKNOWLEDGMENTS
We thank Julie Curtsinger and The Translational Therapy Core at the University of Minnesota for providing samples and phenotype data for this study. We thank Branden Carter and Marty Bigos at the Stanford Shared FACS Facility Center at Stanford University for their services in maintaining the CyTOF 2 machine (NIH_S10OD016318-01). We thank Lewis Lanier for kindly providing DX31 antibody. We thank Richard Apps and Mary Carrington for providing DT9 antibody.
Footnotes
This study was funded by NIH grants P01 CA111412 and P01 65493 (J.S.M. and S.C.), and NIH grants P01 CA111412 and R01 AI22039 (A.H., L.A.G., and P.P.)
REFERENCES
- 1.Moretta A, Bottino C, Vitale M, Pende D, Biassoni R, Mingari MC, Moretta L. Receptors for HLA class-I molecules in human natural killer cells. Annu Rev Immunol. 1996;14:619–648. doi: 10.1146/annurev.immunol.14.1.619. [DOI] [PubMed] [Google Scholar]
- 2.Moretta A, Bottino C, Massimo V, Pende D, Cantoni C, Mingari MC, Biassoni R, Moretta L. Activating receptors and coreceptors involved in human natural killer cell-mediated cytolysis. Annu Rev Immunol. 2001;19:197–223. doi: 10.1146/annurev.immunol.19.1.197. [DOI] [PubMed] [Google Scholar]
- 3.Lanier LL. NK CELL RECEPTORS. Annu. Rev. Immunol. 1998;16:359–393. doi: 10.1146/annurev.immunol.16.1.359. [DOI] [PubMed] [Google Scholar]
- 4.Ljunggren HG, Kärre K. In search of the “missing self”: MHC molecules and NK cell recognition. Immunol Today. 1990;11:237–244. doi: 10.1016/0167-5699(90)90097-s. [DOI] [PubMed] [Google Scholar]
- 5.Lanier LL, Corliss B, Phillips JH. Arousal and inhibition of human NK cells. Immunol. Rev. 1997;155:145–154. doi: 10.1111/j.1600-065x.1997.tb00947.x. [DOI] [PubMed] [Google Scholar]
- 6.Vivier E, Raulet DH, Moretta A, Caligiuri MA, Zitvogel L, Lanier LL, Yokoyama WM, Ugolini S. Innate or Adaptive Immunity? The Example of Natural Killer Cells. Science. 2011;331:44–49. doi: 10.1126/science.1198687. [DOI] [PMC free article] [PubMed] [Google Scholar]
- 7.Parham P. MHC class I molecules and KIRs in human history, health and survival. Nat Rev Immunol. 2005;5:201–214. doi: 10.1038/nri1570. [DOI] [PubMed] [Google Scholar]
- 8.Braud VM, Allan DSJ, O’Callaghan CA, Söderström K, D’Andrea A, Ogg GS, Lazetic S, Young NT, Bell JI, Phillips JH, Lanier LL, McMichael AJ. HLA-E binds to natural killer cell receptors CD94/NKG2A, B and C. Nature. 1998;391:795–799. doi: 10.1038/35869. [DOI] [PubMed] [Google Scholar]
- 9.Bryceson YT, March ME, Ljunggren HG, Long EO. Synergy among receptors on resting NK cells for the activation of natural cytotoxicity and cytokine secretion. Blood. 2006;107:159–166. doi: 10.1182/blood-2005-04-1351. [DOI] [PMC free article] [PubMed] [Google Scholar]
- 10.Bryceson YT, March ME, Ljunggren HG, Long EO. Activation, coactivation, and costimulation of resting human natural killer cells. Immunol Rev. 2006;214:73–91. doi: 10.1111/j.1600-065X.2006.00457.x. [DOI] [PMC free article] [PubMed] [Google Scholar]
- 11.Ruggeri L, Capanni M, Urbani E, Perruccio K, Shlomchik WD, Tosti A, Posati S, Rogaia D, Frassoni F, Aversa F, Martelli MF, Velardi A. Effectiveness of donor natural killer cell alloreactivity in mismatched hematopoietic transplants. Science. 2002;295:2097–2100. doi: 10.1126/science.1068440. [DOI] [PubMed] [Google Scholar]
- 12.Miller JS, Warren EH, van den Brink MR, Ritz J, Shlomchik WD, Murphy WJ, Barrett AJ, Kolb HJ, Giralt S, Bishop MR, Blazar BR, Falkenburg JH. NCI First International Workshop on The Biology, Prevention, and Treatment of Relapse After Allogeneic Hematopoietic Stem Cell Transplantation: Report from the Committee on the Biology Underlying Recurrence of Malignant Disease following Allogeneic HSCT: Graft-versus-Tumor/Leukemia Reaction. Biol Blood Marrow Transplant. 2010;16:565–586. doi: 10.1016/j.bbmt.2010.02.005. [DOI] [PMC free article] [PubMed] [Google Scholar]
- 13.Gumá M, Angulo A, Vilches C, Gómez-Lozano N, Malats N, López-Botet M. Imprint of human cytomegalovirus infection on the NK cell receptor repertoire. Blood. 2004;104:3664–3671. doi: 10.1182/blood-2004-05-2058. [DOI] [PubMed] [Google Scholar]
- 14.Guma M, Budt M, Sáez A, Brckalo T, Hengel H, Angulo A, López-Botet M. Expansion of CD94/NKG2C+ NK cells in response to human cytomegalovirus-infected fibroblasts. Blood. 2006;107:3624–3631. doi: 10.1182/blood-2005-09-3682. [DOI] [PubMed] [Google Scholar]
- 15.Green ML, Leisenring WM, Xie H, Walter RB, Mielcarek M, Sandmaier BM, Riddell SR, Boeckh M. CMV reactivation after allogeneic HCT and relapse risk: evidence for early protection in acute myeloid leukemia. Blood. 2013;122:1316–1324. doi: 10.1182/blood-2013-02-487074. [DOI] [PMC free article] [PubMed] [Google Scholar]
- 16.Foley B, Cooley S, Verneris MR, Pitt M, Curtsinger J, Luo X, Lopez-Vergès S, Lanier LL, Weisdorf D, Miller JS. Cytomegalovirus reactivation after allogeneic transplantation promotes a lasting increase in educated NKG2C+ natural killer cells with potent function. Blood. 2012;119:2665–2674. doi: 10.1182/blood-2011-10-386995. [DOI] [PMC free article] [PubMed] [Google Scholar]
- 17.Béziat V, Dalgard O, Asselah T, Halfon P, Bedossa P, Boudifa A, Hervier B, Theodorou I, Martinot M, Debré P, Björkström NK, Malmberg K-J, Marcellin P, Vieillard V. CMV drives clonal expansion of NKG2C+ NK cells expressing self-specific KIRs in chronic hepatitis patients. Eur. J. Immunol. 2011;42:447–457. doi: 10.1002/eji.201141826. [DOI] [PubMed] [Google Scholar]
- 18.Béziat V, Liu L, Malmberg J-A, Ivarsson MA, Sohlberg E, Björklund AT, Retière C, Sverremark-Ekström E, Traherne J, Ljungman P, Schaffer M, Price DA, Trowsdale J, Michaelsson J, Ljunggren H-G, Malmberg K-J. NK cell responses to cytomegalovirus infection lead to stable imprints in the human KIR repertoire and involve activating KIRs. Blood. 2013;121:2678–2688. doi: 10.1182/blood-2012-10-459545. [DOI] [PMC free article] [PubMed] [Google Scholar]
- 19.Horowitz A, Strauss-Albee DM, Leipold M, Kubo J, Nemat-Gorgani N, Dogan OC, Dekker CL, Mackey S, Maecker H, Swan GE, Davis MM, Norman PJ, Guethlein LA, Desai M, Parham P, Blish CA. Genetic and Environmental Determinants of Human NK Cell Diversity Revealed by Mass Cytometry. Science Trans Med. 2013;5:208ra145. doi: 10.1126/scitranslmed.3006702. [DOI] [PMC free article] [PubMed] [Google Scholar]
- 20.Djaoud Z, David G, Bressollette C, Willem C, Rettman P, Gagne K, Legrand N, Mehlal S, Cesbron A, Imbert-Marcille BM, Retière C. Amplified NKG2C+ NK cells in cytomegalovirus (CMV) infection preferentially express killer cell Ig-like receptor 2DL: functional impact in controlling CMV-infected dendritic cells. J Immunol. 2013;191:2708–2716. doi: 10.4049/jimmunol.1301138. [DOI] [PubMed] [Google Scholar]
- 21.Cooley S, Weisdorf DJ, Guethlein LA, Klein JP, Wang T, Marsh SG, Spellman S, Haagenson MD, Saeturn K, Ladner M, Trachtenberg E, Parham P, Miller JS. Donor killer cell Ig-like receptor B haplotypes, recipient HLA-C1, and HLA-C mismatch enhance the clinical benefit of unrelated transplantation for acute myelogenous leukemia. J Immunol. 2014;192:4592–4600. doi: 10.4049/jimmunol.1302517. [DOI] [PMC free article] [PubMed] [Google Scholar]
- 22.Venstrom JM, Pittari G, Gooley TA, Chewning JH, Spellman S, Haagenson MD, Gallagher MM, Malkki M, Petersdorf E, Dupont B, Hsu KC. HLA-C-dependent prevention of leukemia relapse by donor activating KIR2DS1. N. Engl. J. Med. 2012;367:805–816. doi: 10.1056/NEJMoa1200503. [DOI] [PMC free article] [PubMed] [Google Scholar]
- 23.Fauriat C, Ivarsson MA, Ljunggren H-G, Malmberg K-J, Michaelsson J. Education of human natural killer cells by activating killer cell immunoglobulin-like receptors. Blood. 2010;115:1166–1174. doi: 10.1182/blood-2009-09-245746. [DOI] [PubMed] [Google Scholar]
- 24.Tomasec P, Braud VM, Rickards C, Powell MB, McSharry BP, Gadola S, Cerundolo V, Borysiewicz LK, McMichael AJ, Wilkinson GW. Surface expression of HLA-E, an inhibitor of natural killer cells, enhanced by human cytomegalovirus gpUL40. Science. 2000;287:1031. doi: 10.1126/science.287.5455.1031. [DOI] [PubMed] [Google Scholar]
- 25.Verneris MR, Brunstein CG, Barker J, MacMillan ML, DeFor T, McKenna DH, Burke MJ, Blazar BR, Miller JS, McGlave PB, Weisdorf DJ, Wagner JE. Relapse risk after umbilical cord blood transplantation: enhanced graft-versus-leukemia effect in recipients of 2 units. Blood. 2009;114:4293–4299. doi: 10.1182/blood-2009-05-220525. [DOI] [PMC free article] [PubMed] [Google Scholar]
- 26.Brunstein CG, Barker JN, Weisdorf DJ, DeFor TE, Miller JS, Blazar BR, McGlave PB, Wagner JE. Umbilical cord blood transplantation after nonmyeloablative conditioning: impact on transplantation outcomes in 110 adults with hematologic disease. Blood. 2007;110:3064–3070. doi: 10.1182/blood-2007-04-067215. [DOI] [PMC free article] [PubMed] [Google Scholar]
- 27.Qiu P, Simonds EF, Bendall SC, Gibbs KD, Bruggner RV, Linderman MD, Sachs K, Nolan GP, Plevritis SK. Extracting a cellular hierarchy from high-dimensional cytometry data with SPADE. Nat. Biotechnol. 2011;29:886–891. doi: 10.1038/nbt.1991. [DOI] [PMC free article] [PubMed] [Google Scholar]
- 28.Foley B, Cooley S, Verneris MR, Curtsinger J, Luo X, Waller EK, Anasetti C, Weisdorf DJ, Miller JS. Human cytomegalovirus (CMV)-induced memory-like NKG2C(+) NK cells are transplantable and expand in vivo in response to recipient CMV antigen. J. Immunol. 2012;189:5082–5088. doi: 10.4049/jimmunol.1201964. [DOI] [PMC free article] [PubMed] [Google Scholar]
- 29.Lopez-Vergès S, Milush JM, Schwartz BS, Pando MJ, Jarjoura J, York VA, Houchins JP, Miller S, Kang S-M, Norris PJ, Nixon DF, Lanier LL. Expansion of a unique CD57+NKG2Chi natural killer cell subset during acute human cytomegalovirus infection. Proc. Natl. Acad. Sci. U.S.A. 2011;108:14725–14732. doi: 10.1073/pnas.1110900108. [DOI] [PMC free article] [PubMed] [Google Scholar]
- 30.van Bergen J, Thompson A, van der Slik A, Ottenhoff TH, Gussekloo J, Koning F. Phenotypic and functional characterization of CD4 T cells expressing killer Ig-like receptors. J Immunol. 2004;173:6719–6726. doi: 10.4049/jimmunol.173.11.6719. [DOI] [PubMed] [Google Scholar]
- 31.Anfossi N, Doisne JM, Peyrat MA, Ugolini S, Bonnaud O, Bossy D, Pitard V, Merville P, Moreau JF, Delfraissy JF, Dechanet-Merville J, Bonneville M, Venet A, Vivier E. Coordinated expression of Ig-like inhibitory MHC class I receptors and acquisition of cytotoxic function in human CD8+ T cells. J Immunol. 2004;173:7223–7229. doi: 10.4049/jimmunol.173.12.7223. [DOI] [PubMed] [Google Scholar]
- 32.van der Veken LT, Diez Campelo M, van der Hoorn MA, Hagedoorn RS, van Egmond HM, van Bergen J, Willemze R, Falkenburg JH, Heemskerk MH. Functional analysis of killer Ig-like receptor-expressing cytomegalovirus-specific CD8+ T cells. J Immunol. 2009;182:92–101. doi: 10.4049/jimmunol.182.1.92. [DOI] [PubMed] [Google Scholar]
- 33.Björkström NK, Béziat V, Cichocki F, Liu LL, Levine J, Larsson S, Koup RA, Anderson SK, Ljunggren H-G, Malmberg K-J. CD8 T cells express randomly selected KIRs with distinct specificities compared with NK cells. Blood. 2012;120:3455–3465. doi: 10.1182/blood-2012-03-416867. [DOI] [PMC free article] [PubMed] [Google Scholar]
- 34.Multiplex and genome-wide analyses reveal distinctive properties of KIR+ and CD56+ T cells in human Blood. 2013;191:1625–1636. doi: 10.4049/jimmunol.1300111. [DOI] [PMC free article] [PubMed] [Google Scholar]
- 35.Bendall SC, Simonds EF, Qiu P, Amir E-AD, Krutzik PO, Finck R, Bruggner RV, Melamed R, Trejo A, Ornatsky OI, Balderas RS, Plevritis SK, Sachs K, Pe’er D, Tanner SD, Nolan GP. Single-cell mass cytometry of differential immune and drug responses across a human hematopoietic continuum. Science. 2011;332:687–696. doi: 10.1126/science.1198704. [DOI] [PMC free article] [PubMed] [Google Scholar]
- 36.Davis ZB, Cichocki F, Felices M, Wangen R, DeFor TE, Cooley SA, Bryceson YT, Diamond DJ, Brunstein C, Blazar BR, Wagner JE, Weisdorf DJ, Horowitz A, Guethlein LA, Parham P, Verneris MR, Miller JS. Clonal Expansion of Adaptive NK Cells and NKG2C+CD57+ KIR-Expressing T Cells from Sibling, but Not Umbilical Cord Blood, Grafts Is Induced By Recipient Latent CMV and Is Associated with Protection Against CMV Reactivation. Blood. 2014;124:181–181. [Google Scholar]
- 37.ChanK. WK, Rujkijyanont P, Neale G, Yang J, Bari R, Das Gupta N, Holladay M, Rooney B, Leung W. Multiplex and genome-wide analyses reveal distinctive properties of KIR+ and CD56+ T cells in human blood. J Immunol. 2013;191:1625–1636. doi: 10.4049/jimmunol.1300111. [DOI] [PMC free article] [PubMed] [Google Scholar]
- 38.Apps R, Qi Y, Carlson JM, Chen H, Gao X, Thomas R, Yuki Y, Del Prete GQ, Goulder P, Brumme ZL, Brumme CJ, John M, Mallal S, Nelson G, Bosch R, Heckerman D, Stein JL, Soderberg KA, Moody MA, Denny TN, Zeng X, Fang J, Moffett A, Lifson JD, Goedert JJ, Buchbinder S, Kirk GD, Fellay J, McLaren P, Deeks SG, Pereyra F, Walker B, Michael NL, Weintrob A, Wolinsky S, Liao W, Carrington M. Influence of HLA-C expression level on HIV control. Science. 2013;340:87–91. doi: 10.1126/science.1232685. [DOI] [PMC free article] [PubMed] [Google Scholar]
- 39.Würsch AM, Gratama JW, Middeldorp JM, Nissen C, Gratwohl A, Speck B, Jansen J, D’Amaro J, The TH, De Gast GC. The effect of cytomegalovirus infection on T lymphocytes after allogeneic bone marrow transplantation. Clin Exp Immunol. 1985;62:278–287. [PMC free article] [PubMed] [Google Scholar]
- 40.Lugthart G, van Ostaijen-Ten Dam MM, Jol-van der Zijde CM, van Holten TC, Kester MG, Heemskerk MH, Bredius RG, van Tol MJ, Lankester AC. Early cytomegalovirus reactivation leaves a specific and dynamic imprint on the reconstituting T cell compartment long-term after hematopoietic stem cell transplantation. Biol Blood Marrow Transplant. 2014;20:655–661. doi: 10.1016/j.bbmt.2014.01.018. [DOI] [PubMed] [Google Scholar]
- 41.Yawata M, Yawata N, Draghi M, Partheniou F, Little A-M, Parham P. MHC class I-specific inhibitory receptors and their ligands structure diverse human NK-cell repertoires toward a balance of missing self-response. Blood. 2008;112:2369–2380. doi: 10.1182/blood-2008-03-143727. [DOI] [PMC free article] [PubMed] [Google Scholar]
- 42.Chidrawar S, Khan N, Wei W, McLarnon A, Smith N, Nayak L, Moss P. Cytomegalovirus-seropositivity has a profound influence on the magnitude of major lymphoid subsets within healthy individuals. Clin Exp Immunol. 2009;155:423–432. doi: 10.1111/j.1365-2249.2008.03785.x. [DOI] [PMC free article] [PubMed] [Google Scholar]
- 43.Derhovanessian E, Maier AB, Beck R, Jahn G, Hähnel K, Slagboom PE, J. A, de Craen AJ, Westendorp RG, Pawelec G. Hallmark features of immunosenescence are absent in familial longevity. J immunol. 2010;185:4618–4624. doi: 10.4049/jimmunol.1001629. [DOI] [PubMed] [Google Scholar]
- 44.Pawelec G, Derhovanessian E, Larbi A, Strindhall J, Wikby A. Cytomegalovirus and human immunosenescence. Rev Med Virol. 2009;19:47–56. doi: 10.1002/rmv.598. [DOI] [PubMed] [Google Scholar]
- 45.Kern F, Khatamzas E, Surel I, Frömmel C, Reinke P, Waldrop SL, Picker LJ, Volk HD. Distribution of human CMV-specific memory T cells among the CD8pos. subsets defined by CD57, CD27, and CD45 isoforms. Eur J Immunol. 1999;29:2908–2915. doi: 10.1002/(SICI)1521-4141(199909)29:09<2908::AID-IMMU2908>3.0.CO;2-8. [DOI] [PubMed] [Google Scholar]
- 46.Lidehall AK, Sund F, Lundberg T, Eriksson BM, Tötterman TH, Korsgren O. T cell control of primary and latent cytomegalovirus infections in healthy subjects. J Clin Immunol. 2005;25:473–481. doi: 10.1007/s10875-005-5372-8. [DOI] [PubMed] [Google Scholar]
- 47.Grubeck-Loebenstein B1, Della Bella S, Iorio AM, Michel JP, Pawelec G, Solana R. Immunosenescence and vaccine failure in the elderly. Aging Clin Exp Res. 2009;21:201–209. doi: 10.1007/BF03324904. [DOI] [PubMed] [Google Scholar]
- 48.Koch S, Larbi A, Ozcelik D, Solana R, Gouttefangeas C, Attig S, Wikby A, Strindhall J, Franceschi C, Pawelec G. Cytomegalovirus infection: a driving force in human T cell immunosenescence. Ann N Y Acad Sci. 2007;1114:23–35. doi: 10.1196/annals.1396.043. [DOI] [PubMed] [Google Scholar]
- 49.Olsson J, Wikby A, Johansson B, Löfgren S, Nilsson BO, Ferguson FG. Age-related change in peripheral blood T-lymphocyte subpopulations and cytomegalovirus infection in the very old: the Swedish longitudinal OCTO immune study. Mech Ageing Dev. 2000;121:187–201. doi: 10.1016/s0047-6374(00)00210-4. [DOI] [PubMed] [Google Scholar]
- 50.Wikby A, Johansson B, Olsson J, Löfgren S, Nilsson BO, Ferguson F. Expansions of peripheral blood CD8 T-lymphocyte subpopulations and an association with cytomegalovirus seropositivity in the elderly: the Swedish NONA immune study. Exp Gerantol. 2002;37:445–453. doi: 10.1016/s0531-5565(01)00212-1. [DOI] [PubMed] [Google Scholar]
- 51.Majumder D, Bandyopadhyay D, Chandra S, Mukhopadhayay A, Mukherjee N, Bandyopadhyay SK, Banerjee S. Analysis of HLA class Ia transcripts in human leukaemias. Immunogenetics. 2005;57:579–589. doi: 10.1007/s00251-005-0018-9. [DOI] [PubMed] [Google Scholar]
- 52.Chijioke O, Müller A, Feederle R, Barros MH, Krieg C, Emmel V, Marcenaro E, Leung CS, Antsiferova O, Landtwing V, Bossart W, Moretta A, Hassan R, Boyman O, Niedobitek G, Delecluse HJ, Capaul R, Münz C. Human natural killer cells prevent infectious mononucleosis features by targeting lytic epstein-barr virus infection. Cell reports. 2013;5:1489–1498. doi: 10.1016/j.celrep.2013.11.041. [DOI] [PMC free article] [PubMed] [Google Scholar]
- 53.Auger S, Orsini M, Céballos P, Fegueux N, Kanouni T, Caumes B, Klein B, Villalba M, Rossi JF. Controlled Epstein-Barr virus reactivation after allogeneic transplantation is associated with improved survival. Eur J Haematol. 2014;92:421–428. doi: 10.1111/ejh.12260. [DOI] [PubMed] [Google Scholar]
- 54.Daikeler T, Labopin M, Ruggeri A, Crotta A, Abinun M, Hussein AA, Carlson K, Cornillon J, Diez-Martin JL, Gandemer V, Faraci M, Lindemans C, O’Meara A, Mialou V, Renard M, Sedlacek P, Sirvent A, Socié G, Sora F, Varotto S, Sanz J, Voswinkel J, Vora A, Yesilipek MA, Herr AL, Gluckman E, Farge D, Rocha V. New autoimmune diseases after cord blood transplantation: a retrospective study of EUROCORD and the Autoimmune Disease Working Party of the European Group for Blood and Marrow Transplantation. Blood. 2013;121:1059–1064. doi: 10.1182/blood-2012-07-445965. [DOI] [PubMed] [Google Scholar]
- 55.Yu J, Mao HC, Wei M, Hughes T, Zhang J, Park IK, Liu S, McClory S, Marcucci G, Trotta R, Caligiuri MA. CD94 surface density identifies a functional intermediary between the CD56bright and CD56dim human NK-cell subsets. Blood. 2010;115:274–281. doi: 10.1182/blood-2009-04-215491. [DOI] [PMC free article] [PubMed] [Google Scholar]
- 56.Foley B, Cooley S, Verneris MR, Curtsinger J, Luo X, Waller EK, Weisdorf DJ, Miller JS. NK cell education after allogeneic transplantation: dissociation between recovery of cytokine-producing and cytotoxic functions. Blood. 2011;118:2784–2792. doi: 10.1182/blood-2011-04-347070. [DOI] [PMC free article] [PubMed] [Google Scholar]
- 57.Hendricks DW, Balfour HH, Jr, Dunmire SK, Schmeling DO, Hogquist KA, Lanier LL. Cutting edge: NKG2C(hi)CD57+ NK cells respond specifically to acute infection with cytomegalovirus and not Epstein-Barr virus. J Immunol. 2014;192:4492–4496. doi: 10.4049/jimmunol.1303211. [DOI] [PMC free article] [PubMed] [Google Scholar]
- 58.Cooper MA, Elliott JM, Keyel PA, Yang L, Carrero JA, Yokoyama WM. Cytokine-induced memory-like natural killer cells. Proc. Natl. Acad. Sci. U.S.A. 2009;106:1915–1919. doi: 10.1073/pnas.0813192106. [DOI] [PMC free article] [PubMed] [Google Scholar]
- 59.Arase H, Mocarski ES, Campbell AE, Hill AB, Lanier LL. Direct recognition of cytomegalovirus by activating and inhibitory NK cell receptors. Science. 2002;296:1323–1326. doi: 10.1126/science.1070884. [DOI] [PubMed] [Google Scholar]
- 60.Brown MG, Dokun AO, Heusel JW, Smith HR, Beckman DL, Blattenberger EA, Dubbelde CE, Stone LR, Scalzo AA, Yokoyama WM. Vital Involvement of a Natural Killer Cell Activation Receptor in Resistance to Viral Infection. Science. 2001;292:934–937. doi: 10.1126/science.1060042. [DOI] [PubMed] [Google Scholar]
- 61.Daniels KA, Devora G, Lai WC, O’Donnell CL, Bennett M, Welsh RM. Murine cytomegalovirus is regulated by a discrete subset of natural killer cells reactive with monoclonal antibody to Ly49H. J Exp Med. 2001;194:29–44. doi: 10.1084/jem.194.1.29. [DOI] [PMC free article] [PubMed] [Google Scholar]
- 62.Smith HR, Heusel JW, Mehta IK, Kim S, Dorner BG, Naidenko OV, Iizuka K, Furukawa H, Beckman DL, Pingel JT, Scalzo AA, Fremont DH, Yokoyama WM. Recognition of a virus-encoded ligand by a natural killer cell activation receptor. Proc Natl Acad Sci. 2002;99:8826–8831. doi: 10.1073/pnas.092258599. [DOI] [PMC free article] [PubMed] [Google Scholar]
Associated Data
This section collects any data citations, data availability statements, or supplementary materials included in this article.