

Abstract
Background & Aims
The inflammasome is a well-characterized inducer of inflammation in ASH. Inflammasome activation requires two signals for mature interleukin (IL)-1β production. Here we asked whether metabolic danger signals trigger inflammasome activation in ASH.
Methods
Wild-type mice, ATP receptor 2×7 (P2rx7)-KO mice, or mice overexpressing uricase were fed Lieber-DeCarli ethanol or control diet. We also implemented a pharmacological approach in which mice were treated with probenecid or allopurinol.
Results
The sterile danger signals, ATP and uric acid, were increased in the serum and liver of alcohol-fed mice. Depletion of uric acid or ATP, or lack of ATP signaling attenuated ASH and prevented inflammasome activation and its major downstream cytokine, IL-1β. Pharmacological depletion of uric acid with allopurinol provided significant protection from alcohol-induced inflammatory response, steatosis and liver damage, and additional protection was achieved in mice treated with probenecid, which depletes uric acid and blocks ATP-induced P2rx7 signaling. We found that alcohol-damaged hepatocytes released uric acid and ATP in vivo and in vitro and that these sterile danger signals activated the inflammasome in LPS-exposed liver mononuclear cells.
Conclusions
Our data indicate that the second signal in inflammasome activation and IL-1β production in ASH results from the endogenous danger signals, uric acid and ATP. Inhibition of signaling triggered by uric acid and ATP may have therapeutic implications in ASH.
Keywords: alcoholic steatohepatitis, inflammasome, sterile inflammatory response, damage-associated molecular patterns, pathogen-associated molecular patterns, determinants of liver inflammation
Introduction
In the pathogenesis of alcoholic liver disease (ALD), liver inflammation drives the progression of steatosis to steatohepatitis, fibrosis and cirrhosis [1]. Liver inflammation in alcoholic steatohepatitis (ASH) results from exposure of liver immune cells to exogenous and endogenous triggers. Exogenous triggers are represented by the gut-derived bacterial endotoxin (LPS), whereas the nature of endogenous, sterile, triggers of inflammation in ASH has not been fully elucidated.
We have previously shown that inflammation in ASH requires inflammasome activation, a cytoplasmic protein complex needed for processing and release of mature IL-1β, a cytokine that activates liver immune cells, kills hepatocytes and promotes fibrosis [2–4]. Activation of the inflammasome and IL-1β is a process that requires two signals. Signal one, typically mediated by TLR signaling involving LPS, up-regulates inflammasome components and pro-IL-1b gene. Signal two, an endogenous, sterile, ligand is required to activate Caspase-1 (Casp-1), the effector molecule of inflammasome, to convert pro-IL-1β into a biologically active IL-1β [5].
A wide spectrum of endogenous ligands represent sterile danger signals for inflammasome activation [5]. However, a subset of inflammasome activators is related to mitochondrial function [6] and to catabolism of purine nucleotides, both of which are deranged in individuals drinking ethanol, resulting in altered ATP/ADP ratio and accumulation of uric acid [7]. ATP and uric acid are well-defined activators of inflammasome and release of IL-1β, however their role in alcohol-induced liver inflammation is not known.
Here we show that uric acid and ATP are required for activation of the inflammasome, IL-1β production and the development of liver inflammation in ASH. We also demonstrate that pharmacologic targeting or uric acid and ATP may have potential therapeutic benefit in ASH.
Experimental procedures
Animal studies
6- to 8-week-old female C57Bl/6 wild-type (WT) (Jackson Laboratory, Bar Harbor, ME), P2rx7-KO mice (Jackson Laboratory), transgenic mice for secretory uricase (ssUOX-Tg) or intracellular uricase (intUOX-Tg) (a kind gift of Dr. Kenneth Rock, University of Massachusetts Medical School) [8], all on C57Bl/6 background, were used. Some animals were fed with the Lieber-DeCarli ad libitum diet (Bioserv, Frenchtown, NJ, USA) with 5% vol/vol ethanol (36% derived calories); pair-fed control mice matched the alcohol-derived calories with dextran-maltose. Specifically, mice received fresh Lieber-DeCarli diet in 50-mL feeders daily between 7 pm and 8 pm. At the conclusion of the experiment, we collected blood and harvested livers between 8 am and 9 am [2]. Serum ethanol levels did not significantly differ between the genotypes. The evolution of body weight is shown in Supplementary Tables 1–3. The average amount of intake of alcohol-containing diet is shown in Supplementary Tables 4–6. Some animals received daily intragastric doses of 100 mg/kg allopurinol or probenecid (Sigma, St. Louis, MO, USA). All animals received proper care in agreement with animal protocols approved by the Institutional Animal Use and Care Committee of the University of Massachusetts Medical School.
In vitro experiments with murine cells
Primary murine hepatocytes were cultured in Waymouth’s medium supplemented with 10% fetal bovine serum and 1% insulin, transferrin, selenium solution. Primary hepatocytes were seeded in collagen-coated plates (Biocoat, Becton Dickinson, Bedford, MA). Before starting stimulation experiments, hepatocytes were rested for 4 hours. Subsequently culture media was replaced, and stimulation was performed as indicated in the figure legends. Primary liver mononuclear cells were seeded in 96-well plates and cultured in Dulbecco’s Modified Eagle Medium with 10% fetal bovine serum.
Confocal Microscopy
Cell viability
Cell viability was determined using LIVE/DEAD Cell Imaging Kit (488/570), (Molecular Probes, NY, USA), according to manufacturer’s specifications. Immunofluorescence: LMNCs were fixed, permeabilized and incubated with anti-ASC #sc-22514-R, anti-cleaved Casp1p20 sc-22165 primary antibodies (Santa Cruz Biotechnology); Alexa Fluor 488 anti goat #A11008, and Alexa Fluor 555 anti-goat #A21431 (Molecular Probes) secondary antibodies. Images were acquired using Leica TCS SP5 II Laser Scanning Confocal Microscope. Mean fluorescence intensity was quantified with Leica Application Suite (LAS) AF software.
Biochemical assays
Serum alanine aminotransferase (ALT) was determined using a kinetic method (D-Tek LLC., Bensalem, PA). Colorimetric assays were used to measure serum uric acid (Abcam, Cambridge, MA, USA), liver triglycerides (Wako Chemicals, VA, USA) and LDH activity in cell culture supernatants (Abcam, Cambridge, MA, USA). Chemiluminescent assay was used to measure ATP in the serum or in cell culture supernatants (CellTiter-Glo, Promega Corp., Madison, WI).
Cytokine measurement
TNF-α and MCP-1 were measured using specific anti-mouse ELISA from Biolegend (San Diego, CA, USA). IL-1β was measured using specific anti-mouse ELISA from R&D (R&D systems, Inc., Minneapolis, MN) that recognizes both pro-IL-1β and cleaved IL-1β.
Protein quantification
Liver whole-cell lysates were extracted as described previously [2, 3]. Equal amounts of proteins were separated on polyacrylamide gel, and transferred to a nitrocellulose membrane. Target proteins were detected by western blot and immunostaining with specific primary antibody, followed by horseradish peroxidase-labeled secondary antibody. The specific immunoreactive bands of interest were detected by chemiluminescence (Amersham, Piscataway, NJ). Digital system (ImageQuant™ LAS 4000, GE Healthcare, Uppsala, Sweden) was used for image acquisition. Blots labeled as “short exposure” and “long exposure” in figures were exposed for one or 10 minutes, respectively. Antibodies specific for total Caspase-1 and the cleaved p10 fragment of Caspase-1 (catalog No. M20, sc-514, used in Fig. 2 and 3), and antibody specific for the cleaved p20 fragment of Caspase-1 (catalog No. M-19, sc-1218), used in Fig. 4) were from Santa Cruz (Santa Cruz Biotechnology, Santa Cruz, CA). Beta-actin and beta-tubulin antibodies were from Abcam (Cambridge, MA, USA).
Fig. 2. ATP signaling is required for inflammasome activation and increased TNF-α in ASH.
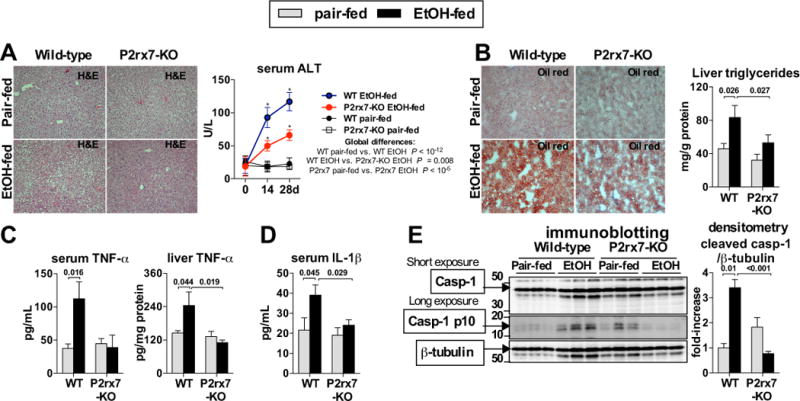
WT or P2rx7-KO mice were fed control (pair-fed) or Lieber-DeCarli alcohol diet. After 4 weeks, liver damage was assessed by liver histology (H&E) and serum ALT (A). Oil-red-O staining was performed and liver triglycerides were measured to evaluate steatosis (B). We evaluated levels of TNF-α in the serum and in the liver (C) and IL-1β in the serum (D). We evaluated cleavage of Casp-1 in the liver (E). N= 7–15 (ethanol-fed, per genotype); 5 (pair-fed, per genotype). Numbers in the graphs indicate P values. *P < 0.05 vs. baseline. Original magnification, ×200.
Fig. 3. Uric acid is required for inflammasome activation and increased TNF-α in ASH.
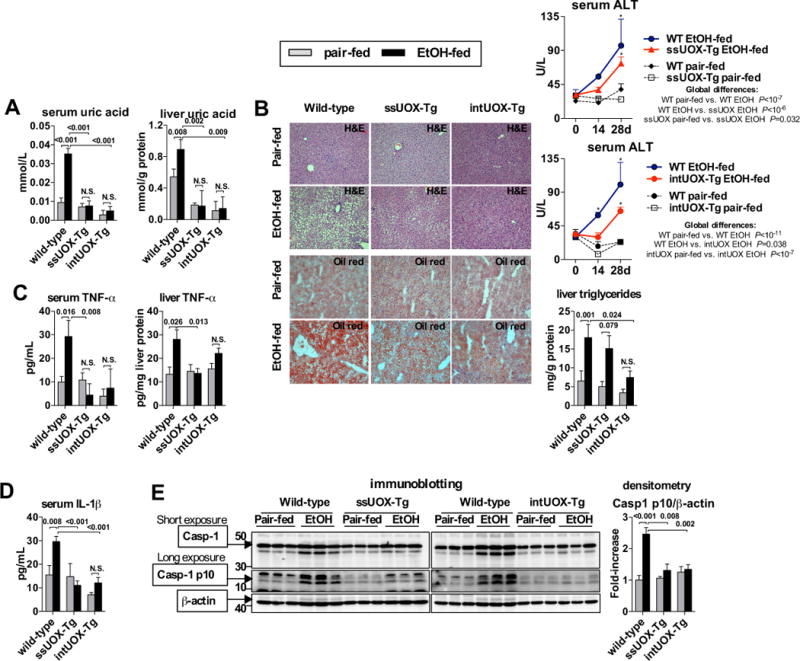
WT, ssUOX-Tg or intUOX-Tg mice were fed control (pair-fed) or alcohol Lieber-DeCarli diet. After 4 weeks, we evaluated levels of uric acid in serum and in the liver (A). Liver damage was assessed by liver histology (H&E) and serum ALT. Oil-red-O staining and liver triglycerides were measured to evaluate steatosis (B). Levels of TNF-α in the serum and in the liver were evaluated (C). Levels of IL-1β in were evaluated in the serum (D). We evaluated cleavage of Casp-1 in the liver (E). N= 5–7 (ethanol-fed, per genotype); 3–5 (pair-fed, per genotype). Numbers in the graphs indicate P values. *P < 0.05 vs. baseline. Original magnification, ×200.
Fig. 4. Pharmacologic depletion of uric acid and inhibition of ATP signaling prevents ASH.

WT mice treated with daily intragastric doses of vehicle (PBS), allopurinol or probenecid (100 mg/kg body weight) were fed control (pair-fed) or alcohol Lieber-DeCarli diet. After 4 weeks, we evaluated the levels of uric acid in the serum (A). Liver damage was assessed by histology (H&E) and serum ALT, and Oil-red-O staining was performed and liver triglycerides were measured to evaluate steatosis (B). We evaluated levels of TNF-α in the serum and in the liver (C), levels of IL-1β in the serum (D), and cleavage of Casp-1 in the liver (E). Murine splenocytes were treated with 100 ng/mL of LPS. After 2 hours, allopurinol or probenecid was added at indicated doses, and ATP (5 mM) was added 30 minutes later. One hour afterwards, inflammasome activation was assessed by measuring IL-1β protein in cell-free supernatants. Stimulations were performed in triplicates (F). N= 9–10 mice (ethanol-fed, per treatment); 3–5 mice (pair-fed, per treatment). Numbers in the graphs indicate P values. *P < 0.05 vs. baseline. Original magnification, ×200.
RNA analysis
RNA was purified using the RNeasy kit (Qiagen Sciences) and on-column DNA digestion. cDNA was transcribed with the Reverse Transcription System (Promega Corp.). qPCR was performed using Sybr-Green and iCycler from BioRad (Bio-Rad Laboratories Inc.); primer sequences and reaction conditions are shown in [2].
Statistical Analysis
Statistical significance was determined using the Mann-Whitney test. Two-way ANOVA was used in Figures 2A, 3C and 4B to determine the global effect of genotype or treatment on serum ALT. Unless stated otherwise, data are shown as mean ± standard error of the mean (SEM) and differences were considered statistically significant at P < 0.05. We used SPSS 19.0 (IBM SPSS, Chicago, IL, USA) to perform statistical analyses.
Results
Endogenous sterile danger signals, ATP and uric acid, are increased in ASH
Liver inflammation induced by alcohol is dependent on activation of the inflammasome complex and IL-1β [2], but the specific triggers of inflammasome activation in ASH are not known. Given the effect of ethanol on mitochondrial function and metabolism of purine nucleotides, we studied the role of ATP and uric acid, two well-characterized activators of the inflammasome [5].
First, we asked whether alcohol modulates the levels of uric acid and ATP. We evaluated uric acid and ATP in the serum and liver of WT mice after 4 weeks of Lieber-DeCarli ethanol or control diet feeding. We observed that liver damage caused by ethanol (ALT in Fig. 1A) was accompanied by statistically significant increases in ATP and uric acid levels (Fig. 1A) in the serum and in the liver (Fig. 1B). This data indicated that liver damaged by ethanol releases metabolic danger signals, uric acid and ATP.
Fig. 1. Endogenous inflammasome activators, ATP and uric acid, are increased in ASH.
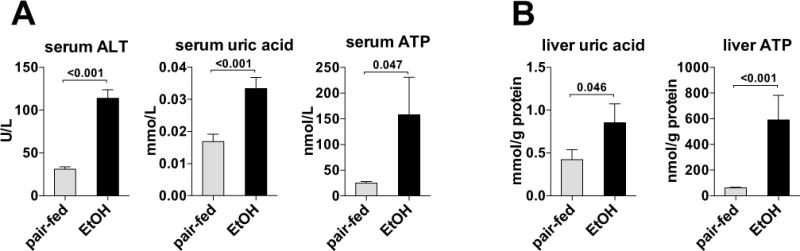
Wild-type mice were fed control (pair-fed) or alcohol Lieber-DeCarli diet. After 4 weeks, liver damage and uric acid and ATP in the serum (A) and in the liver were evaluated (B). N= 15 (ethanol-fed); 5 (pair-fed). *P < 0.05 vs. baseline.
ATP signaling is involved in inflammasome activation and liver inflammation in ASH
Our data indicating that exposure to ethanol increased circulating and liver ATP levels prompted us to ask whether ATP was required for inflammasome activation and inflammation in ASH. We used mice deficient in the P2rx7 receptor (purinergic receptor P2x, ligand-gated ion channel 7), which is activated by extracellular ATP [9]. We observed that P2rx7-deficient mice were protected from alcohol-induced liver damage as indicated by improved liver histology on H&E staining and significantly lower serum ALT levels compared to wild-type mice (Fig. 2A). Livers from P2rx7-KO mice showed attenuated steatosis as demonstrated by decreased Oil-red-O signal on histology and significantly decreased accumulation of intrahepatic triglycerides compared to WT mice (Fig. 2B). Alcohol-induced increase in the inflammatory cytokine, TNF-α (Fig. 2C), was prevented in the serum and liver of mice deficient in ATP signaling compared to wild-type (WT) mice. In contrast to WT mice, there was no alcohol-induced increase in serum IL-1β in P2rx7-deficient mice (Fig. 2D). IL-1β in the serum is present predominantly in the bioactive form. Therefore, its decreased levels in alcohol-fed P2rx7-deficient mice, compared to alcohol-fed WT mice, implied the lack of inflammasome activation in absence of ATP signaling. Western Blot analysis showed that deficiency of P2rx7 prevented alcohol-induced activation of the inflammasome in the liver, demonstrated by undetectable levels of p10, the cleavage product of the inflammasome effector molecule, Casp-1 (Fig. 2E). Interestingly, F4/80 immunohistochemistry did not show decreased levels of positive staining in ethanol-fed P2rx7-KO mice compared wild-type (Suppl. Fig. 1). This suggests that the decreased liver and systemic inflammatory cytokine levels observed are due to decreased activation of resident Kupffer cells in the liver in the absence of P2rx7 signaling. Furthermore, observed immune responses in wild-type mice were likely mediated by resident Kupffer cells and not by recruited monocyte/macrophages. Taken together, this data supported the hypothesis that ATP plays an important role in activation of the inflammasome, increase in pro-inflammatory cytokines, as well as in development of steatosis and injury in ASH.
Uric acid is involved in inflammasome activation and liver inflammation in ASH
Our data indicated that exposure to ethanol increases the release of uric acid from the damaged liver. To evaluate whether uric acid is required for liver inflammation in ASH, we used two previously described strains of transgenic (Tg) mice overexpressing uricase (urate oxidase, UOX), an enzyme that degrades uric acid [8]. In the first strain, referred to as secreted uricase (ssUOX)-Tg, uricase is secreted into the extracellular fluids, depleting uric acid from the interstitial fluids, tissues and serum [8]. In the second strain, referred to as intracellular uricase (intUOX)-Tg, uricase is targeted to peroxisomes and reduces intracellular pools of uric acid. After intUOX-Tg cells die and uricase is released, the enzyme also depletes uric acid from the environment of dead cells [8]. Both strains of Tg mice showed absence of alcohol-induced increase of uric acid in the serum and in the liver (Fig. 3A), compared to WT mice. The intUOX-Tg demonstrated a trend towards lower baseline levels of uric acid in the serum and in the liver compared to ssUOX-Tg mice, but the difference was not significant (Fig. 3A).
We observed that depletion of uric acid in ssUOX-Tg or intUOX-Tg mice provided significant protection from liver damage as evaluated by H&E liver histology and serum ALT, and from liver steatosis, demonstrated by decreased Oil-red-O signal on histology and by significantly decreased accumulation of intrahepatic triglycerides (Fig. 3B, Suppl. Fig. 2). These findings were accompanied by lack of induction of TNF-α in the serum and the liver (Fig. 3C), indicating that depletion of uric acid is protective against alcohol-induced liver inflammation. Importantly, uric acid-deficient mice showed lack of alcohol-induced increase of IL-1β in the serum (Fig. 3D), which indicated decreased inflammasome activation in absence of uric acid signaling. Indeed, further analyses showed that depletion of uric acid in ssUOX-Tg or intUOX-Tg mice prevented alcohol-induced inflammasome activation in the liver, demonstrated by absent cleavage of the inflammasome effector molecule, Casp-1, with more pronounced repression of Casp-1 cleavage in intUOX-Tg, compared to ssUOX-Tg mice (Fig. 3E). This data supported our hypothesis that uric acid is involved in inflammasome activation and development of liver inflammation, steatosis and injury in ASH.
Pharmacologic depletion of uric acid and inhibition of ATP signaling ameliorates inflammasome activation and liver inflammation in ASH
Finally, we asked whether uric acid and ATP could represent potential therapeutic targets in alcoholic steatohepatitis. To deplete uric acid, we evaluated two anti-gout medications used in humans: allopurinol, an inhibitor of xantine oxidase, an enzyme that synthesizes uric acid, and probenecid, a compound promoting renal excretion of uric acid. Daily intragastric administration of allopurinol or probenecid significantly reduced levels of uric acid in the serum of alcohol-fed mice, and treatment with allopurinol decreased baseline levels of serum uric acid to almost non-detectable levels (Fig. 4A). Administration of allopurinol or probenecid resulted in similar levels of serum ethanol and endotoxin in the liver compared to ethanol-fed mice treated with saline (Suppl. Fig. 3), confirming that the protective effect due to pharmacologic inhibition of uric acid is not due to defective ethanol metabolism.
Treatment with allopurinol significantly attenuated alcohol-induced histological changes in the liver on H&E staining and reduced serum ALT, and ameliorated accumulation of lipids as assessed by Oil-red-O staining and by triglyceride assay (Fig. 4B). Allopurinol-treated mice also demonstrated complete protection from TNF-α increase in the serum and in the liver (Fig. 4C). Amelioration of alcohol-induced damage on histology was consistent with a previous report [10]. However, treatment with probenecid provided superior protection from ASH, compared to allopurinol-treated mice, as demonstrated by only minimal liver damage on H&E staining, significantly reduced levels of serum ALT, and complete protection from lipid accumulation in the liver (Fig. 4B), in addition to lack of induction of inflammatory cytokine, TNF-α, in the serum and in the liver (Fig. 4C). This protection from alcohol-induced liver inflammation was consistent with significant reduction of IL-1β levels in the serum of ethanol-fed mice treated with allopurinol, and with complete prevention of IL-1β increase in ethanol-fed mice treated with probenecid, compared to ethanol-fed WT mice (Fig. 4D). This data was supported by analysis of inflammasome activation in the liver, showing that treatment with allopurinol partially ameliorated alcohol-induced cleavage of Casp-1 (Fig. 4E), whereas full prevention of Casp-1 cleavage in the liver was observed when mice were treated with probenecid (Fig. 4E).
This additional protective effect implied that mechanisms beyond promotion of uric acid excretion may be responsible for the protective effect of probenecid. It has been reported that probenecid inhibits pannexin-1 channels [11], which play an essential role in ATP signaling [9]. Indeed, probenecid, but not allopurinol, significantly ameliorated release of IL-1β from LPS-primed murine immune cells stimulated with ATP (Fig. 4F). Thus, the superior protective role of probenecid in ASH was likely explained through the promotion of uric acid excretion, as well as inhibition of ATP signaling, indicating a synergistic effect of uric acid and ATP on inflammasome activation in ASH.
Damaged hepatocytes release endogenous metabolic activators of the inflammasome, ATP and soluble uric acid
To evaluate the source of increased ATP and uric acid in ASH, we exposed primary murine hepatocytes to ethanol or heat-shock (HS), and observed early release of ATP and uric acid into hepatocyte supernatants along with the development of hepatocyte injury (Fig. 5A,B). In contrast, ATP or uric acid was not detected in supernatants from liver mononuclear cells (LMNCs) exposed to ethanol or HS (Fig. 5C), indicating that increased ATP and uric acid detected in serum and livers of ethanol-fed mice was most likely derived from hepatocytes and not mononuclear cells. Treatment of LPS-primed LMNCs with uric acid crystals or ATP significantly increased the release of IL-1β protein indicative of inflammasome activation, and a similar increase in IL-1β was observed when LMNCs were treated with soluble uric acid (Fig. 5D). To test if our in vitro analyses correlated with an in vivo model, we administered a single dose of ethanol or isocaloric sugar gavage to wild-type mice and evaluated damage to hepatocytes four hours post-gavage, when the peak level of liver injury begins in vivo [12]. After plating, non-adherent dead cells were washed off, leaving only cells healthy enough to attach. We assessed cell viability by microscopy with a dual stain system that is specific for healthy cells as well as dead or dying cells with compromised cell membranes [Suppl. Fig. 4]. We found a higher level of live to dead cell ratio of the adherent hepatocytes isolated from mice gavaged with sugar compared to ethanol. This data suggests that an ethanol gavage can exert damage to hepatocytes over an extended period of time, even after the ethanol insult has been removed from its environment. Given that there was an increased number of dead or dying hepatocytes due to an ethanol gavage, we investigated if damaged hepatocytes from ethanol gavage release DAMPs necessary to elicit inflammasome activation. To test this, we stimulated LPS-primed LMNCs with supernatant from hepatocytes isolated from mice gavaged with ethanol or isocaloric sugar in vivo. We probed for inflammasome assembly and activation by immunofluorescence microscopy (Fig. 6A) and analysis of IL-1β protein in LMNC supernatant (Fig. 6B). In the absence of LPS (unstimulated), LMNCs were not positive for ASC, the adaptor molecule of the inflammasome, or Casp-1, indicating no induction of inflammasome formation. Notably, ASC-speck formation co-localized with Casp-1 in LMNCs after stimulation with supernatant from hepatocytes post-ethanol gavage, but no Casp-1 induction or co-localization after stimulation with supernatant from hepatocytes exposed to intragastric sugar. Importantly, co-localization of ASC, and Casp-1 after in vivo ethanol gavage correlated with the highest IL-1β secretion by LMNCs, compared to in vivo sugar gavage (Fig. 6B). Lastly, supernatant from hepatocytes stimulated with ethanol in vitro yielded the highest inflammasome induction in LPS-primed LMNCs, similar to direct stimulation of LMNCs with LPS and ATP (Fig. 6A). This data supported the notion that DAMPs, comprising ATP and uric acid, are released from damaged hepatocytes, in vivo and in vitro, and are subsequently recognized as pro-inflammatory signals by LMNCs.
Fig. 5. Damaged hepatocytes, but not liver mononuclear cells, release endogenous metabolic activators of the inflammasome, ATP and soluble uric acid.
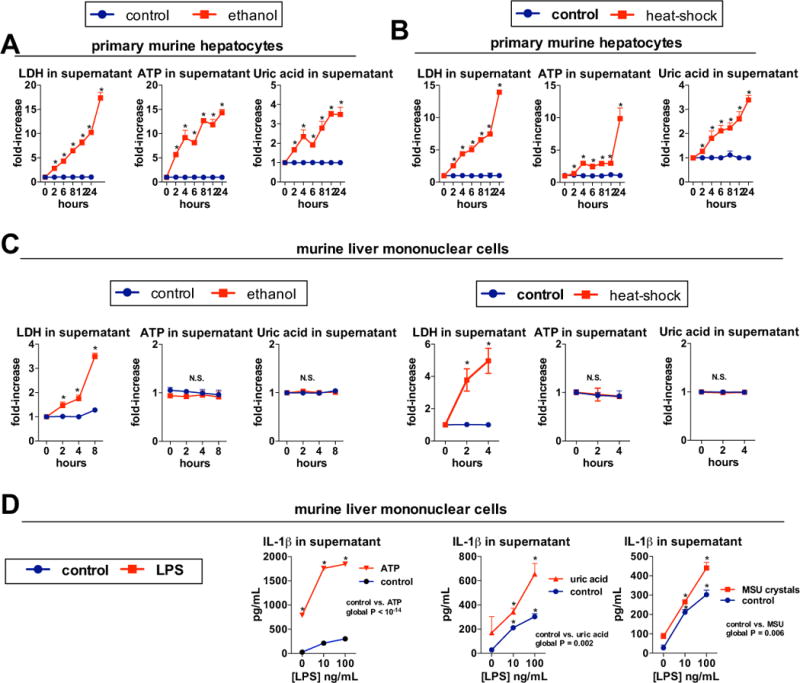
Primary murine or human hepatocytes were treated with 800 μM ethanol, and levels of LDH, indicating hepatocyte death, ATP and uric acid were evaluated in supernatants at indicated time points (A). Primary murine or human hepatocytes were cultured at 45°C (heat-shock) or 37°C (control) and levels of LDH, ATP and uric acid were evaluated in supernatants at indicated time points (B). Murine liver mononuclear cells (LMNCs) were treated with 800 mM ethanol, and levels of LDH, indicating cell death, ATP and uric acid were evaluated in supernatants at indicated time points. Murine LMNCs were cultured at 45°C (heat-shock) or 37°C (control) and levels of LDH, ATP and uric acid were evaluated in supernatants at indicated time points (C). LMNCs isolated from wild-type mice were pretreated with indicated doses of LPS. In some groups, ATP (5 mM) was added after 2 hours of LPS stimulation and supernatant was collected 1 hour afterward. In other groups, soluble uric acid (100 μg/mL) or monosodium urate crystals (MSU, 250 μg/mL) were added after 2 hours of LPS stimulation and supernatant was collected at 24 hours (D). Stimulations were performed in triplicates. *P < 0.05 vs. baseline.
Fig. 6. DAMPs released from primary hepatocytes damaged from in vivo ethanol gavage result in inflammasome activation.
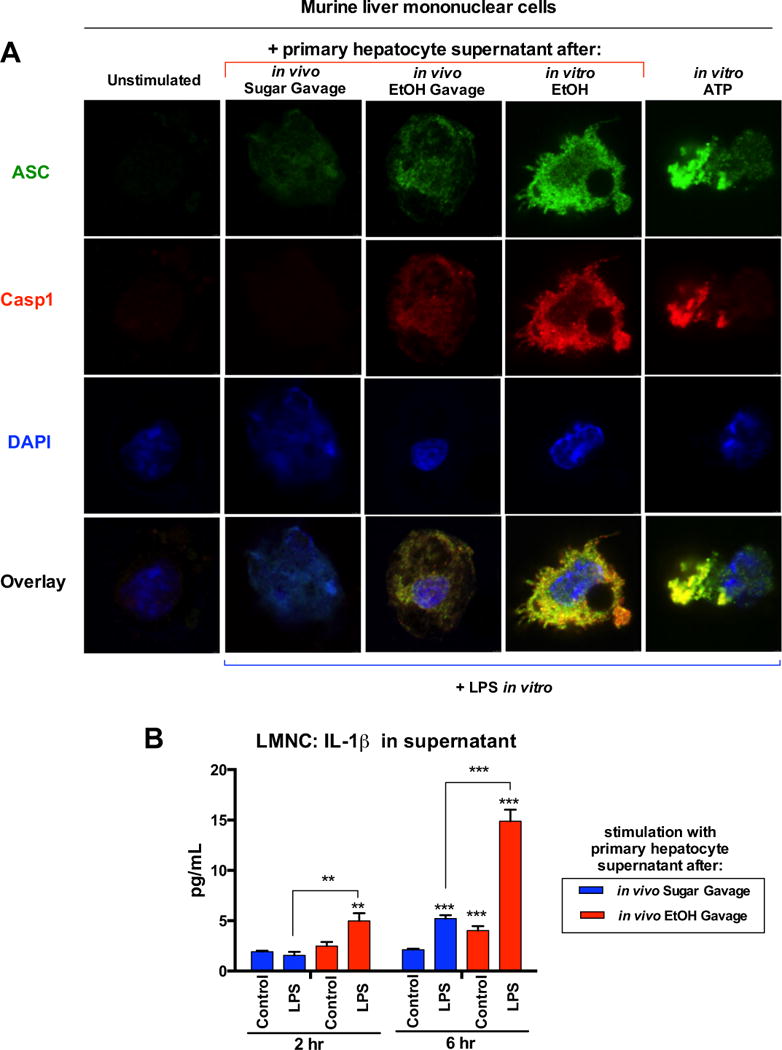
Primary murine hepatocytes and LMNCs were isolated four hours after EtOH (in vivo EtOH Gavage) or isocaloric sucrose gavage (in vivo Sugar Gavage) or from untreated mice. Hepatocytes were plated and non-adherent cells were washed off with PBS four hours later. Hepatocyte supernatant was collected 3 hours later. LMNCs were primed for 2 hours with LPS (10 ng/mL) or water (unstimulated). LMNCs were then stimulated with hepatocyte supernatant collected as described. LMNCs were stimulated with supernatant from primary murine hepatocytes treated with 800 mM EtOH for 1 hour in vitro (in vitro EtOH). LMNCs were stimulated with ATP (5 mM) for 6 hours (in vitro ATP). Some LMNCs were analyzed via immunofluorescence microscopy to assess inflammasome activation (A). Supernatant was collected from other LMNCs and analyzed for IL-1β secretion at 2 and 6 hours (B).
Uric acid and ATP represent a second signal involved in LPS-driven inflammation in ASH
In vitro studies indicate that activation of IL-1β is a two-step process in which bacterial signals up-regulate pro-IL-1b gene and the second, endogenous “danger” signal activates the inflammasome to convert pro-IL-1β into a biologically active IL-1β [9]. We asked whether this principle would apply to the pathogenesis of liver inflammation in ASH. We observed that alcohol feeding in mice deficient in the ATP receptor, P2rx7 (Fig. 7A–C), or in mice depleted of uric acid due to overexpression of uricase (Fig. 7D–F), resulted in significantly increased levels of ethanol in the serum (Fig. 7A,D), significantly increased levels of endotoxin in the liver (Fig. 7B,E) and significant up-regulation of pro-IL-1B mRNA in the liver (Fig. 7C,F). The extent of these changes was comparable to that observed in alcohol-fed WT mice (Fig. 7A–F), indicating that the protection from alcohol-induced liver inflammation in mice deficient in ATP signaling (Fig. 2), or in mice depleted of uric acid (Fig. 3) was not explained by differences in alcohol levels, translocation of bacterial LPS from the gut to the liver, or by induction of the pro-IL-1B gene. Rather, considering the lack of activation of the inflammasome and IL-1β in alcohol-fed P2rx7-KO or UOX-Tg mice (Fig. 2D,E, Fig. 3D,E), the most likely interpretation of the data was that ATP and uric acid represent an endogenous signal that is critically important in processing and secretion of LPS-induced pro-IL-1β into biologically active, mature, IL-1β. Given the fact that active IL-1β is critically involved in the pathogenesis of alcoholic steatohepatitis [2], the data presented in this report suggest that ATP and uric acid represent a second signal that plays a crucial role in activation of inflammatory signaling induced by exogenous, gut-derived LPS (Fig. 7G).
Fig. 7. Uric acid and ATP represent a second signal involved in LPS-driven inflammatory response in ASH.
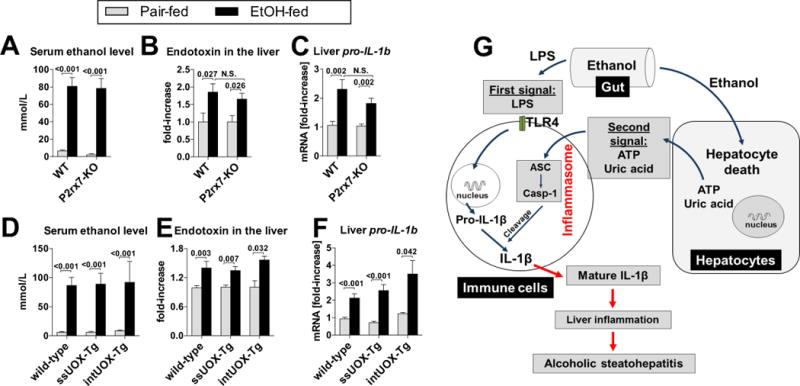
(A–C) WT or P2rx7-KO mice were fed control (pair-fed) or Lieber-DeCarli alcohol diet. After 4 weeks, levels of ethanol were measured in the liver (A), levels of endotoxin were measured in the liver (B) and expression of pro-IL-1B gene (mRNA) were measured in the liver (C). N= 6–9 (ethanol-fed, per genotype); 4–5 (pair-fed, per genotype). (D–F) WT, ssUOX-Tg or intUOX-Tg mice were fed control (pair-fed) or alcohol Lieber-DeCarli diet. After 4 weeks, levels of ethanol were measured in the liver (D), levels of endotoxin were measured in the liver (E) and expression of pro-IL-1B gene (mRNA) were measured in the liver (F). N= 6–9 (ethanol-fed, per genotype); 4–5 (pair-fed, per genotype). Numbers in the graphs indicate P values. (G) Proposed role of uric acid and ATP control inflammation in ASH. Exposure to alcohol induces hepatocyte death. In the same time, alcohol increases exposure of liver immune cells to gut-derived bacterial LPS, which provides the signal for induction of the immature pro-IL-1β in liver immune cells (first signal). The signal for IL-1β activation in the liver is probably derived from damaged hepatocytes which release uric acid and ATP (second signal). These molecules activate the inflammasome in liver immune cells. As a result, Caspase-1, the effector molecule of the inflammasome, cleaves pro-IL-1β into the bioactive IL-1β. Active IL-1β plays a crucial role in alcoholic steatohepatitis [2].
Discussion
Liver inflammation marks the transition from alcoholic steatosis to steatohepatitis and is considered the first step towards fibrosis and cirrhosis [13]. Although the development of liver inflammation in ASH involves translocation of LPS from the gut to the liver [14] and the release of HMGB1 from dying hepatocytes [15], we show that additional mechanisms are also pivotal. Here we demonstrate that liver inflammation in ASH requires endogenous danger molecules, ATP and uric acid, that act as sterile inflammatory signals. As ATP and uric acid are molecules inherently associated with alcohol-induced mitochondrial dysfunction and increased turnover of purine nucleotides [6, 16], our data demonstrates that metabolic derangements triggered by ethanol have pro-inflammatory effects in ASH.
Although LPS is required for liver inflammation in ASH [14], our data further confirm the notion that liver inflammation in ASH is driven by synergism between gut-derived signals, represented by LPS, and endogenous sterile danger signals rather than by LPS alone. Our data indicate that the pathways mediating signals associated with bacterial and tissue damage converge at IL-1β [16], a cytokine that acts synergistically with TLR signaling and substantially amplifies inflammation via feed-forward induction of LPS-inducible inflammatory cytokines [2, 3, 18–20]. Our data show that IL-1β plays an exceptional role in ASH due to the fact that it requires hepatocyte injury-derived signals for its activation (this study, Fig. 7G and ref. [2]).
This requirement for two signals for alcohol-induced liver inflammation is of great relevance because gut-derived microbial signals constantly translocate to the liver even at baseline [21], and it would be deleterious if their sole presence with no accompanying primary liver insult could induce liver inflammation. To prevent such development, there are mechanisms that control development of liver inflammation, including natural tolerance of liver immune cells to microbial stimuli [22], the capability of hepatocytes to remove endotoxin [23], and, as we report here, the dependency of liver inflammation on sterile signals related to metabolic effect of ethanol to ensure that inflammation is triggered only in the presence of hepatocyte injury. This finding is consistent with absent liver inflammation in alcohol-fed mice lacking IL-1β maturation or signaling [2], and strongly suggests that IL-1β triggered by sterile signals has permissive effect on gut-derived LPS to induce inflammation in ASH.
Our data is consistent with previously published experimental evidence supporting a causal role of ATP or uric acid signaling in liver inflammation caused by acetaminophen or by ischemia-reperfusion injury [8, 24, 25], and are further supported by evidence showing correlation between hyperuricemia and metabolic syndrome or long-term consumption of ethanol [26, 27]. Importantly, our data is consistent with a report by Shulga et al. [28] demonstrating that activation of murine Kupffer cells by ethanol requires NLRP3, a ligand-sensing component of inflammasomes that detects ATP and uric acid [5]. On the other hand, a report by DeSantis et al. [29] demonstrated that mice deficient in NLRP3 were not protected from alcohol-induced liver inflammation. Our previous data showed upregulation of NLRP3 in the livers of alcohol-fed mice and demonstrated the requirement for ASC, an adaptor molecule immediately downstream of NLRP3, for inflammasome activation in ASH [2]. The indispensability of ASC in ASH narrows the choice of inflammasome activators to two molecules: NLRP3 or an alternative intracellular ligand receptor AIM2 [5]. However, AIM2 recognizes cytoplasmic double-stranded DNA, but not ATP or uric acid [5]. And more recently, our lab demonstrated that mice deficient in NLRP3 had decreased liver injury and inflammasome activation [30], further highlighting the role of ATP- and uric acid-mediated signaling in the pathogenesis of ethanol-induced inflammation.
Taken together, our results identify the role of uric acid and ATP as signaling molecules critically involved in the liver’s inflammatory response in ASH. This mechanism may have potential therapeutic implications.
Supplementary Material
Supplementary Figure 1. F4/80 immunohistochemistry of livers from WT or P2rx7-ko mice livers from ethanol- or pair-fed. Original magnification, ×200.
Supplementary Figure 2. WT, ssUOX-Tg or intUOX-Tg mice were fed control (pair-fed) or alcohol Lieber-DeCarli diet. We evaluated liver damage as assessed by serum ALT at indicated time points. N= 5–7 (ethanol-fed, per genotype); 3–5 (pair-fed, per genotype). Summary statistics is presented in Fig. 3B in the manuscript.
Supplementary Figure 3. WT mice treated with daily intragastric doses of vehicle (PBS), allopurinol or probenecid (100 mg/kg body weight) were fed control (pair-fed) or alcohol Lieber-DeCarli diet. After 4 weeks, levels of ethanol were measured in the liver (A), levels of endotoxin were measured in the liver (B). N= 9–10 mice (ethanol-fed, per treatment); 3–5 mice (pair-fed, per treatment). Numbers in the graphs indicate P values.
Supplementary Figure 4. Primary murine hepatocytes and LMNCs were isolated four hours after ethanol (in vivo EtOH Gavage), isocaloric sucrose gavage (in vivo Sugar Gavage), or from untreated mice. Hepatocytes were plated and non-adherent cells were washed off with PBS six hours later. Naïve primary hepatocytes were incubated with 1 μM staurosporine for 4 hours (in vitro Staurosporine) or 800 mM ethanol for 2 hours (in vitro EtOH). Cells were then incubated with LIVE/DEAD Imaging Stain and imaged. Stimulations were performed in triplicates. * indicates P<0.05 vs. Live cell mean fluorescence; # indicates P<0.05 vs. ex vivo Sugar Gavage Dead cell mean fluorescence.
Supplementary Table 1. Body weights (in grams) of WT, ssUOX-Tg and intUOX-Tg mice, before (baseline) and at the conclusion of exposure to liquid diet (EtOH or pair-fed). Values are shown as mean ± SEM. There were no statistically significant differences between groups. * indicates P<0.05 vs. wild-type, pair-fed mice at baseline.
Supplementary Table 2. Body weights (in grams) of WT, ssUOX-Tg and intUOX-Tg mice, before (baseline) and at the conclusion of exposure to liquid diet (EtOH or pair-fed). Values are shown as mean ± SEM. There were no statistically significant differences between groups.
Supplementary Table 3. Body weights (in grams) of mice treated with vehicle, allopurinol or probenecid, before (baseline) and at the conclusion of exposure to liquid diet (EtOH or pair-fed). Values are shown as mean ± SEM. There were no statistically significant differences between groups. * indicates P<0.05 vs. vehicle-treated, pair-fed mice at baseline. # indicates P<0.05 vs. probenecid-treated, ethanol-fed mice at baseline.
Supplementary Table 4. Consumption of ethanol-liquid diet (mL of diet per mouse per day) in WT or P2rx7-KO mice. The volume of control diet (pair-feeding) was determined based on the consumption of the ethanol-fed group to ensure isocaloric feeding. There were no statistically significant differences between groups.
Supplementary Table 5. Consumption of ethanol-liquid diet (mL of diet per mouse per day) in WT, ssUOX-Tg and intUOX-Tg mice. The volume of control diet (pair-feeding) was determined based on the consumption of the ethanol-fed group to ensure isocaloric feeding. There were no statistically significant differences between groups.
Supplementary Table 6. Consumption of ethanol-liquid diet (mL of diet per mouse per day) in mice treated with vehicle, allopurinol or probenecid. The volume of control diet (pair-feeding) was determined based on the consumption of the ethanol-fed group to ensure isocaloric feeding. There were no statistically significant differences between groups.
Acknowledgments
This work was supported by grant AA017729 from NIAAA (to G.S.). Core resources supported by the Diabetes Endocrinology Research Center grant DK32520 were also used. The authors thank Dr. Kenneth Rock for providing uricase-transgenic mice. The authors also thank Frances S. Brown, Dr. Arlin B. Rogers, and the Cummings School of Veterinary Medicine at Tufts University for their excellent technical assistance and expert analysis. Lastly, the authors thank Dr. Jeffrey Nickerson, Dr. Jean Underwood, and the Cell & Development Biology Confocal Core at UMass Medical School for their training and support in the use of the Leica TCS SP5 II Laser Scanning Confocal Microscope.
List of abbreviations
- ALD
alcoholic liver disease
- ASH
alcoholic steatohepatitis
- LPS
lipopolysaccharide
- TLR
toll-like receptor
- LMNCs
liver mononuclear cells
- PBMCs
peripheral blood mononuclear cells
- Tg
transgene
- UOX
uricase
- EtOH
ethanol
Footnotes
Publisher's Disclaimer: This is a PDF file of an unedited manuscript that has been accepted for publication. As a service to our customers we are providing this early version of the manuscript. The manuscript will undergo copyediting, typesetting, and review of the resulting proof before it is published in its final citable form. Please note that during the production process errors may be discovered which could affect the content, and all legal disclaimers that apply to the journal pertain.
Conflict of interest: none to declare
Authors’ contributions: A.I.-V., J.P., and G.S. designed research; A.I.-V., J.P., A.S., B.G., B.S., and G.S. performed research; E.A.K.-J., and K.A.F. contributed new reagents/analytic tools; A.I.-V., J.P., K.K., and G.S. analyzed data; and A.I.-V., J.P., E.A.K.-J., K.A.F., and G.S. wrote the paper.
References
- 1.Chassaing B, Etienne-Mesmin L, Gewirtz AT. Microbiota-liver axis in hepatic disease. Hepatology. 2014;59:328–339. doi: 10.1002/hep.26494. [DOI] [PMC free article] [PubMed] [Google Scholar]
- 2.Petrasek J, Bala S, Csak T, Lippai D, Kodys K, Menashy V, et al. IL-1 receptor antagonist ameliorates inflammasome-dependent alcoholic steatohepatitis in mice. The Journal of clinical investigation. 2012;122:3476–3489. doi: 10.1172/JCI60777. [DOI] [PMC free article] [PubMed] [Google Scholar]
- 3.Petrasek J, Dolganiuc A, Csak T, Kurt-Jones EA, Szabo G. Type I interferons protect from Toll-like receptor 9-associated liver injury and regulate IL-1 receptor antagonist in mice. Gastroenterology. 2011;140:697–708. e694. doi: 10.1053/j.gastro.2010.08.020. [DOI] [PMC free article] [PubMed] [Google Scholar]
- 4.Cosgrove BD, Cheng C, Pritchard JR, Stolz DB, Lauffenburger DA, Griffith LG. An inducible autocrine cascade regulates rat hepatocyte proliferation and apoptosis responses to tumor necrosis factor-alpha. Hepatology. 2008;48:276–288. doi: 10.1002/hep.22335. [DOI] [PMC free article] [PubMed] [Google Scholar]
- 5.Schroder K, Tschopp J. The inflammasomes. Cell. 2010;140:821–832. doi: 10.1016/j.cell.2010.01.040. [DOI] [PubMed] [Google Scholar]
- 6.Hoek JB, Cahill A, Pastorino JG. Alcohol and mitochondria: a dysfunctional relationship. Gastroenterology. 2002;122:2049–2063. doi: 10.1053/gast.2002.33613. [DOI] [PMC free article] [PubMed] [Google Scholar]
- 7.Nakamura K, Sakurai M, Miura K, Morikawa Y, Yoshita K, Ishizaki M, et al. Alcohol intake and the risk of hyperuricaemia: a 6-year prospective study in Japanese men. Nutrition, metabolism, and cardiovascular diseases : NMCD. 2012;22:989–996. doi: 10.1016/j.numecd.2011.01.003. [DOI] [PubMed] [Google Scholar]
- 8.Kono H, Chen CJ, Ontiveros F, Rock KL. Uric acid promotes an acute inflammatory response to sterile cell death in mice. The Journal of clinical investigation. 2010;120:1939–1949. doi: 10.1172/JCI40124. [DOI] [PMC free article] [PubMed] [Google Scholar]
- 9.Schroder K, Zhou R, Tschopp J. The NLRP3 inflammasome: a sensor for metabolic danger? Science. 2010;327:296–300. doi: 10.1126/science.1184003. [DOI] [PubMed] [Google Scholar]
- 10.Kono H, Rusyn I, Bradford BU, Connor HD, Mason RP, Thurman RG. Allopurinol prevents early alcohol-induced liver injury in rats. The Journal of pharmacology and experimental therapeutics. 2000;293:296–303. [PubMed] [Google Scholar]
- 11.Silverman WR, de Rivero Vaccari JP, Locovei S, Qiu F, Carlsson SK, Scemes E, et al. The pannexin 1 channel activates the inflammasome in neurons and astrocytes. The Journal of biological chemistry. 2009;284:18143–18151. doi: 10.1074/jbc.M109.004804. [DOI] [PMC free article] [PubMed] [Google Scholar]
- 12.Petrasek J, Iracheta-Vellve A, Csak T, Staishchandran A, Kodys K, Kurt-Jones EA, et al. STING-IRF3 pathway links endoplasmic reticulum stress with hepatocyte apoptosis in early alcoholic liver disease. Proceedings of the National Academy of Sciences. 2013;110:16544–16549. doi: 10.1073/pnas.1308331110. [DOI] [PMC free article] [PubMed] [Google Scholar]
- 13.O’Shea RS, Dasarathy S, McCullough AJ, Practice Guideline Committee of the American Association for the Study of Liver D. Practice Parameters Committee of the American College of G Alcoholic liver disease. Hepatology. 2010;51:307–328. doi: 10.1002/hep.23258. [DOI] [PubMed] [Google Scholar]
- 14.Gao B, Bataller R. Alcoholic liver disease: pathogenesis and new therapeutic targets. Gastroenterology. 2011;141:1572–1585. doi: 10.1053/j.gastro.2011.09.002. [DOI] [PMC free article] [PubMed] [Google Scholar]
- 15.Ge X, Antoine DJ, Lu Y, Arriazu E, Leung TM, Klepper AL, et al. High mobility group box-1 (HMGB1) participates in the pathogenesis of alcoholic liver disease (ALD) The Journal of biological chemistry. 2014;289:22672–22691. doi: 10.1074/jbc.M114.552141. [DOI] [PMC free article] [PubMed] [Google Scholar]
- 16.Lieber CS, Jones DP, Losowsky MS, Davidson CS. Interrelation of uric acid and ethanol metabolism in man. The Journal of clinical investigation. 1962;41:1863–1870. doi: 10.1172/JCI104643. [DOI] [PMC free article] [PubMed] [Google Scholar]
- 17.Dinarello CA. Immunological and inflammatory functions of the interleukin-1 family. Annual review of immunology. 2009;27:519–550. doi: 10.1146/annurev.immunol.021908.132612. [DOI] [PubMed] [Google Scholar]
- 18.Granowitz EV, Vannier E, Poutsiaka DD, Dinarello CA. Effect of interleukin-1 (IL-1) blockade on cytokine synthesis: II. IL-1 receptor antagonist inhibits lipopolysaccharide-induced cytokine synthesis by human monocytes. Blood. 1992;79:2364–2369. [PubMed] [Google Scholar]
- 19.Granowitz EV, Clark BD, Vannier E, Callahan MV, Dinarello CA. Effect of interleukin-1 (IL-1) blockade on cytokine synthesis: I. IL-1 receptor antagonist inhibits IL-1-induced cytokine synthesis and blocks the binding of IL-1 to its type II receptor on human monocytes. Blood. 1992;79:2356–2363. [PubMed] [Google Scholar]
- 20.Miura K, Kodama Y, Inokuchi S, Schnabl B, Aoyama T, Ohnishi H, et al. Toll-like receptor 9 promotes steatohepatitis by induction of interleukin-1beta in mice. Gastroenterology. 2010;139:323–334. e327. doi: 10.1053/j.gastro.2010.03.052. [DOI] [PMC free article] [PubMed] [Google Scholar]
- 21.Nolan JP. The role of intestinal endotoxin in liver injury: a long and evolving history. Hepatology. 2010;52:1829–1835. doi: 10.1002/hep.23917. [DOI] [PubMed] [Google Scholar]
- 22.Tiegs G, Lohse AW. Immune tolerance: what is unique about the liver. Journal of autoimmunity. 2010;34:1–6. doi: 10.1016/j.jaut.2009.08.008. [DOI] [PubMed] [Google Scholar]
- 23.Mimura Y, Sakisaka S, Harada M, Sata M, Tanikawa K. Role of hepatocytes in direct clearance of lipopolysaccharide in rats. Gastroenterology. 1995;109:1969–1976. doi: 10.1016/0016-5085(95)90765-3. [DOI] [PubMed] [Google Scholar]
- 24.Hoque R, Sohail MA, Salhanick S, Malik AF, Ghani A, Robson SC, et al. P2X7 receptormediated purinergic signaling promotes liver injury in acetaminophen hepatotoxicity in mice. American journal of physiology Gastrointestinal and liver physiology. 2012;302:G1171–1179. doi: 10.1152/ajpgi.00352.2011. [DOI] [PMC free article] [PubMed] [Google Scholar]
- 25.Taha MO, Simoes MJ, Noguerol EC, Mendonca FP, Pascoalick HM, Alves RA, et al. Effects of allopurinol on ischemia and reperfusion in rabbit livers. Transplantation proceedings. 2009;41:820–823. doi: 10.1016/j.transproceed.2009.02.051. [DOI] [PubMed] [Google Scholar]
- 26.Stiburkova B, Pavlikova M, Sokolova J, Kozich V. Metabolic syndrome, alcohol consumption and genetic factors are associated with serum uric acid concentration. PloS one. 2014;9:e97646. doi: 10.1371/journal.pone.0097646. [DOI] [PMC free article] [PubMed] [Google Scholar]
- 27.Li Y, Xu C, Yu C, Xu L, Miao M. Association of serum uric acid level with nonalcoholic fatty liver disease: a cross-sectional study. Journal of hepatology. 2009;50:1029–1034. doi: 10.1016/j.jhep.2008.11.021. [DOI] [PubMed] [Google Scholar]
- 28.Shulga N, Pastorino JG. Hexokinase II binding to mitochondria is necessary for Kupffer cell activation and is potentiated by ethanol exposure. The Journal of biological chemistry. 2014;289:26213–26225. doi: 10.1074/jbc.M114.580175. [DOI] [PMC free article] [PubMed] [Google Scholar] [Retracted]
- 29.DeSantis DA, Ko CW, Liu Y, Liu X, Hise AG, Nunez G, et al. Alcohol-induced liver injury is modulated by Nlrp3 and Nlrc4 inflammasomes in mice. Mediators of inflammation. 2013;2013:751374. doi: 10.1155/2013/751374. [DOI] [PMC free article] [PubMed] [Google Scholar]
- 30.Petrasek J, Iracheta-Vellve A, Saha B, Satishchandran A, Kodys K, Fitzgerald KA, et al. Metabolic danger signals, uric acid and ATP, mediate inflammatory cross-talk between hepatocytes and immune cells in alcoholic liver disease. Journal of Leukocyte Biology. 2015 doi: 10.1189/jlb.3AB1214-590R. [Epub ahead of print] [DOI] [PMC free article] [PubMed] [Google Scholar]
Associated Data
This section collects any data citations, data availability statements, or supplementary materials included in this article.
Supplementary Materials
Supplementary Figure 1. F4/80 immunohistochemistry of livers from WT or P2rx7-ko mice livers from ethanol- or pair-fed. Original magnification, ×200.
Supplementary Figure 2. WT, ssUOX-Tg or intUOX-Tg mice were fed control (pair-fed) or alcohol Lieber-DeCarli diet. We evaluated liver damage as assessed by serum ALT at indicated time points. N= 5–7 (ethanol-fed, per genotype); 3–5 (pair-fed, per genotype). Summary statistics is presented in Fig. 3B in the manuscript.
Supplementary Figure 3. WT mice treated with daily intragastric doses of vehicle (PBS), allopurinol or probenecid (100 mg/kg body weight) were fed control (pair-fed) or alcohol Lieber-DeCarli diet. After 4 weeks, levels of ethanol were measured in the liver (A), levels of endotoxin were measured in the liver (B). N= 9–10 mice (ethanol-fed, per treatment); 3–5 mice (pair-fed, per treatment). Numbers in the graphs indicate P values.
Supplementary Figure 4. Primary murine hepatocytes and LMNCs were isolated four hours after ethanol (in vivo EtOH Gavage), isocaloric sucrose gavage (in vivo Sugar Gavage), or from untreated mice. Hepatocytes were plated and non-adherent cells were washed off with PBS six hours later. Naïve primary hepatocytes were incubated with 1 μM staurosporine for 4 hours (in vitro Staurosporine) or 800 mM ethanol for 2 hours (in vitro EtOH). Cells were then incubated with LIVE/DEAD Imaging Stain and imaged. Stimulations were performed in triplicates. * indicates P<0.05 vs. Live cell mean fluorescence; # indicates P<0.05 vs. ex vivo Sugar Gavage Dead cell mean fluorescence.
Supplementary Table 1. Body weights (in grams) of WT, ssUOX-Tg and intUOX-Tg mice, before (baseline) and at the conclusion of exposure to liquid diet (EtOH or pair-fed). Values are shown as mean ± SEM. There were no statistically significant differences between groups. * indicates P<0.05 vs. wild-type, pair-fed mice at baseline.
Supplementary Table 2. Body weights (in grams) of WT, ssUOX-Tg and intUOX-Tg mice, before (baseline) and at the conclusion of exposure to liquid diet (EtOH or pair-fed). Values are shown as mean ± SEM. There were no statistically significant differences between groups.
Supplementary Table 3. Body weights (in grams) of mice treated with vehicle, allopurinol or probenecid, before (baseline) and at the conclusion of exposure to liquid diet (EtOH or pair-fed). Values are shown as mean ± SEM. There were no statistically significant differences between groups. * indicates P<0.05 vs. vehicle-treated, pair-fed mice at baseline. # indicates P<0.05 vs. probenecid-treated, ethanol-fed mice at baseline.
Supplementary Table 4. Consumption of ethanol-liquid diet (mL of diet per mouse per day) in WT or P2rx7-KO mice. The volume of control diet (pair-feeding) was determined based on the consumption of the ethanol-fed group to ensure isocaloric feeding. There were no statistically significant differences between groups.
Supplementary Table 5. Consumption of ethanol-liquid diet (mL of diet per mouse per day) in WT, ssUOX-Tg and intUOX-Tg mice. The volume of control diet (pair-feeding) was determined based on the consumption of the ethanol-fed group to ensure isocaloric feeding. There were no statistically significant differences between groups.
Supplementary Table 6. Consumption of ethanol-liquid diet (mL of diet per mouse per day) in mice treated with vehicle, allopurinol or probenecid. The volume of control diet (pair-feeding) was determined based on the consumption of the ethanol-fed group to ensure isocaloric feeding. There were no statistically significant differences between groups.