

Abstract
Background
In the general population African-Americans experience higher mortality than their white peers, attributed, in part, to their lower socio-economic status, reduced access to care and possibly intrinsic biologic factors. A notable exception are patients with kidney disease, among whom African-Americans experience lower mortality. It is unclear if similar differences affecting outcomes exist in patients with no kidney disease but with similar access to health care.
Methods and Results
We compared all-cause mortality, incident coronary heart disease (CHD) and incident ischemic stroke using multivariable adjusted Cox models in a nationwide cohort of 547,441 African-American and 2,525,525 white patients with baseline estimated glomerular filtration rate (eGFR) ≥60 ml/min/1.73m2 receiving care from the US Veterans Health Administration. In parallel analyses we compared outcomes in African-American vs. white individuals in the National Health and Nutrition Examination Survey 1999–2004 (NHANES). After multivariable adjustments in veterans, African-American race was associated with 24% lower all-cause mortality (adjusted hazard ratio (aHR), 95% confidence interval (CI): 0.76, 0.75–0.77, p<0.001) and 37% lower incidence of CHD (aHR, 95%CI: 0.63, 0.62–0.65, p<0.001), but similar incidence of ischemic stroke (aHR, 95%CI: 0.99, 0.97–1.01, p=0.3). African-American race was associated with a 42% higher adjusted mortality among individuals with eGFR≥60 ml/min/1.73m2 in NHANES (aHR, 95%CI: 1.42 (1.09–1.87)).
Conclusions
African-American veterans with normal eGFR have lower all-cause mortality and incidence of CHD, and similar incidence of ischemic stroke. These associations are in contrast with the higher mortality experienced by African-American individuals in the general US population.
Keywords: Race, African-American, mortality, coronary heart disease, stroke, chronic kidney disease
INTRODUCTION
African-Americans represent an estimated 13.2% of the US population, which amounts to over 41 million individuals.1 Poorer health outcomes in African-Americans have been well documented23,45.6 These outcome-differences have been largely ascribed to the substantial socioeconomic disadvantage of African-Americans, with resultant lower health-literacy, decreased disease-awareness, suboptimal access to healthcare, and overt or latent discrimination in receiving recommended healthcare interventions.7
Notwithstanding the validity and importance of these factors, the underlying causes for differences in the health outcomes of African-Americans are likely even more complex, and are also affected by genetic differences between individuals of African and European ancestry.8 A notable example for this is the advanced stages of chronic kidney disease (CKD) and end stage renal disease (ESRD), the incidence and prevalence of which are disproportionately higher in African-Americans due in part to recently described common genetic polymorphisms in individuals of African ancestry,9–13 but paradoxically African-Americans with advanced CKD and ESRD have lower mortality than their white peers.14, 15 The markedly different etiology of CKD in African-Americans could affect race-associated clinical outcomes in patients with kidney disease (e.g. by affecting differently the age and comorbidity characteristics of affected patients). It is possible that there are also other, CKD-independent biological mechanisms affecting race-specific cardiovascular and other clinical outcomes. The effects of such mechanisms independent of socioeconomic differences could have different impacts on various clinical outcomes, due to distinct differences in the pathophysiology of each outcome. Atherosclerosis may have different pathophysiologic underpinnings in African-Americans, who develop significantly less vascular calcification compared to white individuals,16–19 which may be the result of (among others) genetic differences in vitamin D and bone metabolism,8, 20 and could result in differences in cardiovascular morbidity and mortality. African-Americans also experience a higher incidence of hypertension, more uncontrolled hypertension, differences in central aortic blood pressure with potential consequences such as higher rates of left ventricular hypertrophy and stroke.21 The relative contribution of these various factors to the disparities in outcomes seen in African Americans, and the extent to which they are impacted by socioeconomic factors is not well defined, and may vary according to the studied end point and the studied population segment. Furthermore, among the complex socioeconomic factors affecting race-specific outcomes in the US, the relative contribution of poor access to healthcare is not well defined.
We hypothesized that African-Americans without advanced CKD or ESRD will have improved outcomes in a healthcare system that allows enrollment independent of race and/or socioeconomic status. The US Veterans Health Administration (VHA) is a healthcare system which does not impose the typical access barriers of the US healthcare system that may disproportionately impede enrollment of African-Americans. We compared all-cause mortality and incident cardiovascular event rates in a large contemporary cohort of African-American and white individuals with estimated glomerular filtration rate (eGFR) ≥60 ml/min/1.73m2 followed in any one of the US VHA facilities. We hypothesized that outcome-differences between African-American and white veterans may be attenuted or eliminated due to open healthcare access in US VHA facilities.
METHODS
Study design and participants
We used data from a historic cohort study examining risk factors in patients with incident CKD (Racial and Cardiovascular Risk Anomalies in CKD (RCAV) study).22 The algorithm for cohort definition is shown in Figure 1. US veterans with serum creatinine measurements performed during the October 1, 2004–September 30, 2006 were identified from the national Veterans Affairs (VA) Corporate Data Warehouse (CDW) LabChem data files.23 Overall there were 4,447,691 veterans with at least one available serum creatinine measurement, representing approximately 94% of all veterans who received VA healthcare during this time period.24 eGFR was calculated by the Chronic Kidney Disease Epidemiology Collaboration (CKD-EPI) Equation.25 The RCAV cohort included 3,582,478 patients with eGFR ≥60 ml/min/1.73m2, of which we excluded 509,512 patients with race other than African-American or white (Hispanic 73,105 (2.0%), other races 68,889 (1.9%) and missing race 365,489 (10.2%)). The VA collects information on patients’ race primarily from VA Form 10–10EZ (Application for Health Benefits)26 which patients complete at enrollment, and which is updated as needed. We complemented this self-reported race with race data obtained from Medicare through the VA-Medicare data merge project.26 In the case of discrepancies we used the race determination from Medicare due to its more accurate nature.27 Our final analytic sample consisted of 3,072,966 patients (547,441 African American and 2,525,525 white).
Figure 1.

Algorithm used to define the study cohort.
Socio-demographic characteristics, comorbidities, medication use and laboratory variables
Information about socio-demographic characteristics, comorbid conditions, medication use and laboratory characteristics were obtained as previously described.28, 29 Briefly, data on patients’ age, gender, marital status (married, single, divorced or widowed), mean per capita income, service connectedness (a measure indicating whether one or more of a patient’s comorbidities were caused by their military service, and resulting in certain privileges such as preferential access to care and lower co-payments), body mass index (BMI), systolic (SBP) and diastolic blood pressure (DBP), comorbid conditions, location and frequency of heathcare encounters and medication use was obtained from various national VA research data files.30 Comorbidities and clinical events were assessed from the VA Inpatient and Outpatient Medical SAS Datasets31, 32 using International Classification of Diseases, Ninth Revision (ICD-9) diagnostic and procedure codes and Current Procedural Terminology (CPT) codes (Supplemental Methods). Prevalent comorbidities were defined as the presence of relevant ICD9 and CPT codes recorded during the October 1, 2004–September 30, 2006 time period.28, 29 Prevalent coronary heart disease (CHD) was defined as the presence of diagnostic codes for coronary artery disease, angina or myocardial infarction, or procedure codes for percutaneous coronary interventions (PCI) or coronary artery bypass grafting (CABG). We examined the utilization of two commonly applied medication classes (angiotensin converting enzyme inhibitors or angiotensin II receptor blockers (ACEI), and statin-type cholesterol lowering agents), and of healthcare interventions (influenza vaccinations and blood cholesterol level measurements) during October 1, 2004–September 30, 2006, and of the yearly rate of healthcare encounters over the entire follow-up period to identify discrepancies in basic healthcare delivery. Other baseline characteristics were assessed on the date of cohort entry. In addition to data derived from VA sources, we also included select socioeconomic indicators using 2004 county typology codes (housing stress, low education, low employment and persistent poverty; Supplemental Methods) based on the patients’ residential address, obtained from the Area Health Resources Files (AHRF) system issued by the US National Center for Health Workforce Analysis, Bureau of Health Workforce, Health Resources and Services Administration (http://ahrf.hrsa.gov/).
Outcomes
Outcomes of interest were all-cause mortality, incident CHD and incident ischemic strokes. Deaths were ascertained from the VA Vital Status Files, the sensitivity and specificity of which (using the US National Death index as gold standard) are 98.3% and 99.8% respectively.33 Incident CHD was defined as the composite of a first occurrence of an acute MI, PCI or CABG, and incident ischemic stroke was defined as the first occurrence of an ischemic stroke following October 1, 2006 in patients without such diagnoses prior to this date.
Statistical analyses
Data were expressed as means (standard deviations), medians (25–75 percentile) and proportions. Due to the large sample size, the significance of differences in the main cohort was established based on what we deemed to be biologically and/or clinically meaningful differences. Differences between variables in the propensity matched cohort were examined by calculating standardized differences, and regarded as significant if they were >0.1. The start of the follow-up period was the date of cohort entry, which was defined as the date of the first eGFR ≥60 ml/min/1.73m2 during October 1, 2004–September 30, 2006. Patients were followed until death or were censored at the date of the last health care or administrative VA encounter, as documented in the VA Vital Status Files, or on July 26, 2013. Gender-specific crude event rates were calculated from the number of event occurances and patient years during the follow-up period, and gender-specific age-adjusted event rates were calculated by the direct standarization method using the US 2000 Census data as the standard population (http://www.cdc.gov/nchs/tutorials/NHANES/NHANESAnalyses/agestandardization/age_standardization_intro.htm).
The association of African-American race with the outcomes of interest was examined in univariable models and after multivariable adjustment. The association of covariates with outcomes was assessed in univariable analyses using Kaplan Meier curves and log rank tests, or univariable Cox proportional hazards models and chi-square tests, as appropriate. We included in multivariable models the covariates showing statistically significant associations with outcomes, or those that could be associated with outcomes based on theoretical considerations. Cox models were applied to examine the effect confounders, with adjustments implemented incrementally: Model 1: unadjusted, Model 2: age, gender and baseline eGFR; Model 3: Model 2 variables plus prevalent comorbidities (diabetes mellitus, hypertension, CHD, congestive heart failure, cerebro-vascular disease, peripheral vascular disease, chronic lung disease, peptic ulcer disease, hemiplegia, liver disease, dementia, rheumatic disease, malignancy, HIV/AIDS and depression); Model 4: Model 3 variables plus baseline BMI, SBP and DBP; Model 5: Model 4 variables plus mean per capita income, marital status, service connectedness, housing stress, low education, low employment, persistent poverty, frequency of healthcare encounters, use of ACEI and statins, and receipt of influenza vaccination(s), and each patient’s VA healthcare center. Due to previous reports of marked differences in the outcomes of African-Americans with chronic kidney disease (CKD),14, 15 we further examined effect modification by decreased kidney function in subgroup analyses of patients who maintained eGFR ≥60 ml/min/1.73m2 throughout follow-up, and in those who developed incident CKD stage 3 and above;34 in the latter group the start of follow-up was the date of eGFR used to define incident CKD. We further assessed if the occurrence of incident CHD or stroke modifies the association of race with outcomes, by including in the models the incident events as time dependent variables, and by including multiplicative interaction terms. Proportionality was tested by using Schoenfeld and scaled Schoenfeld residuals. We evaluated the fit of the model by using the Cox-Snell residuals.
Analyses were repeated in a propensity score-matched cohort. Propensity scores quantifying the likelihood of African-American vs. white race were calculated by logistic regression, using all variables included in multivariable models, and applying a 1-to-1 nearest neighbor matching without replacement in Stata’s “psmatch2” command suite. All outcomes were also examined in subgroups divided by baseline age, gender, prevalent CHD, congestive heart failure, diabetes mellitus, hypertension, eGFR and income level. Unadjusted analyses for CHD and stroke were repeated in sensitivity analyses using competing risk regression, with non-event deaths treated as competing events.35 In order to compare outcomes associated with African-American vs. white race in the VA system with those in the general population, we also performed an analysis of all-cause, cardiovascular and stroke-related mortality overall, in individuals with eGFR≥60 ml/min/1.73m2 and in various subgroups using data from the US National Health and Nutrition Examination Survey (NHANES) 1999–2004, and adjusting all estimates for the complex NHANES survey design (Supplemental Methods).
Statistical analyses were performed using STATA MP version 12 (STATA Corporation, College Station, TX) and SAS v9.3 (Research Triangle Park, NC). The study protocol was approved by the Research and Development Committees at the Memphis VA Medical Center and Long Beach VA Medical Center.
RESULTS
The mean±SD baseline age of the cohort was 59.9±14.0 years, and 93.6% were men. Baseline characteristics in the overall cohort are shown in Table 1. Compared to whites, African-Americans were younger, more likely to be female, service connected, hypertensive, diabetic and to have HIV/AIDS, and less likely to be married, and to have prevalent CHD and chronic lung disease. African-Americans also had more frequent healthcare encounters, higher SBP and DBP, a lower per capita income and were more likely to live in areas with high housing stress, lower education level and persistent poverty. The use of ACEI and the administration of blood cholesterol measurement was similar in African-American and white veterans. The use of statins and the administration of influenza vaccinations was slightly less common in African-Americans. African-Americans and whites had characteristics similar to each other in the propensity-matched cohort (Supplemental Table 1). Differences in baseline characteristics between African-American and white individuals (when available) were in general similar in the NHANES cohort compared to the VA cohort (Supplemental Table 2).
Table 1.
Baseline characteristics
| All | Unmatched | ||
|---|---|---|---|
| Whites | African- Americans | ||
| N=3,072,966 | N=2,525,525 (82%) | N=547,441 (18%) | |
| Age (years) | 59.9 ± 13.4 | 61.0 ± 13.9 | 54.5 ± 13.2 |
| Estimated GFR (ml/min/1.73m2) | 84.0 ± 15.7 | 82.3 ± 14.4 | 91.9 ± 18.8 |
| Gender (males) | 2,876,626 (94) | 2,383,874 (94) | 492,752 (90) |
| Hypertension | 1,842,120 (60) | 1,503,404 (60) | 338,716 (62) |
| DM | 735,372 (24) | 598,022 (24) | 137,350 (25) |
| CHD | 359,848 (12) | 321,545 (13) | 38,303 (7) |
| CHF | 143,230 (5) | 118,970 (5) | 24,260 (4) |
| CVD | 194,493 (6) | 163,514 (6) | 30,979 (6) |
| PAD | 174,990 (6) | 149,833 (6) | 25,157 (5) |
| Chronic Lung disease | 586,672 (19) | 504,170 (20) | 82,502 (15) |
| Dementia | 26,253 (0.9) | 21,370 (0.9) | 4,883 (0.9) |
| Rheumatologic disease | 44,044 (1) | 37,664 (1) | 6,380 (1) |
| Peptic ulcer disease | 59,130 (2) | 47,734 (2) | 11,396 (2) |
| Liver disease | 38,241 (1) | 31,265 (1) | 6,976 (1) |
| Hemiplegia | 15,458 (0.5) | 12,187 (0.5) | 3,271 (0.6) |
| Malignancies | 324,508 (11) | 271,282 (11) | 53,226 (10) |
| AIDS/HIV | 20,318 (0.7) | 9,321 (0.4) | 10,997 (2) |
| Depression | 301,777 (10) | 245,141 (10) | 56,636 (10) |
| Per capita income | 22,496 (11,643–35,000) | 24,100 (12,284–37,533) | 16,732 (10,044–29,416) |
| Married | 1,609,343 (54) | 1,400,099 (58) | 209,244 (40) |
| Service-connected | 1,273,171 (41) | 1,009,039 (40) | 264,132 (48) |
| BMI (kg/m2) | 29.2 ± 5.8 | 29.2 ± 5.7 | 29.0 ± 6.0 |
| SBP (mmHg) | 135.4 ± 19.2 | 135.2 ± 18.9 | 136.8 ± 20.5 |
| DBP (mmHg) | 77.2 ± 11.9 | 76.6 ± 11.6 | 79.9 ± 12.8 |
| ACEI/ARB use | 1,636,622 (22) | 1,342,705 (23) | 293,917 (20) |
| Statin use | 1,688,623 (15) | 1,417,215 (16) | 271,408 (9) |
| Influenza vaccination | 2,006,550 (30) | 1,672,423 (31) | 334,127 (26) |
| Cholesterol measurement | 2,866,616 (79) | 2,355,044 (80) | 511,572 (76) |
| Healthcare encounters >1/month | 1,696,067 (56) | 1,347,435 (54) | 348,632 (64) |
| Living in area with high housing stress | 1,014,255 (34) | 770,143 (31) | 244,112 (47) |
| Living in area with low education | 312,812 (11) | 238,346 (10) | 74,466 (14) |
| Living in area with low employment | 275,108 (9) | 218,818 (9) | 56,290 (11) |
| Living in area of persistent poverty | 275,108 (5) | 102,782 (4) | 37,247 (7) |
Data is presented as means ± SD, medians (25–75 percentile) or number (% of total).
ACEI/ARB, angiotensin converting enzyme inhibitors/angiotensin receptop blockers; eGFR, estimated glomerular filtration rate; SBP, systolic blood pressure; DBP, diastolic blood pressure; DM, diabetes mellitus; CHD, coronary heart disease; CHF, chronic heart failure; CVD, cerebrovascular disease; PAD, peripheral arterial disease.
Mortality
A total of 638,536 patients died overall (crude rate: 30.16/1000 patient-years (PY), 95% confidence interval [CI]: 30.09–30.24) during a median follow-up of 7.9 years. There were 551,208 deaths in white patients (crude rate: 31.87/1000PY, 95%CI: 31.79–31.96) during a a median follow-up of 7.8 years, and 87,328 deaths in African-American patients (crude rate: 22.53/1000PY, 95%CI: 22.38–22.68) during a a median follow-up of 8.0 years. Table 2 shows gender-specific crude and age-adjusted mortality rates, indicating lower crude mortality rates in African-Americans for both men and women. This difference disappeared after adjustment for age in men, and diminished but remained slightly lower in African-American women. Compared to whites, African-Americans had an overall crude mortality hazard ratio (95%CI) of 0.70 (0.69–0.71, p<0.001) (Figure 2, Model 1). Adjustment for age, gender and baseline eGFR resulted in the attenuation of the African-American mortality advantage (Model 2 hazard ratio, 95%CI: 0.99, 0.98–0.99, p<0.001), but further adjustment for additional covariates resulted in a gradual decrease in the mortality risk associated with African-American race (HR, 95%CI: 0.76, 0.75–0.77, p<0.001, Figure 2, Model 5). Incident CHD and stroke modified the association between race and mortality. Compared to white patients who did not experience incident CHD or stroke, African-Americans without CHD or stroke had significantly lower mortality; whereas mortality in white and African-American patients after an incident CHD or stroke was similar to each other, and significantly higher compared to patients without incident events (Figure 2). Adjusted all-cause mortality was higher in African-American vs. white individuals both overall (HR, 95%CI: 1.51 (1.19–1.92)) and in individuals with eGFR≥60 ml/min/1.73m2 in NHANES (HR, 95%CI: 1.42 (1.09–1.87), Figure 3). Mortality in NHANES was also higher in African-Americans vs. whites categorized by age (adjusted HR, 95%CI for age 18–49 vs. ≥50 years: 1.74 (0.70–4.32) and 1.45 (1.10–1.93), respectively), gender (adjusted HR, 95%CI for males and females: 1.32 (0.91–1.91) and 1.67 (1.19–2.32), respectively) and poverty level (adjusted HR, 95%CI for poverty level ≥200% and <200%: 1.30 (0.84–2.00) and 1.45 (1.08–1.94), respectively). Cardiovascular and stroke-related mortality was similar in African-Americans and whites in NHANES, although the low number of stroke events resulted in imprecise risk estimates (Figure 3).
Table 2.
Crude and adjusted event rates.
| White | African-American | |||||||
|---|---|---|---|---|---|---|---|---|
| Male | Female | Male | Female | |||||
| Crude Rate (95% CI) | Age adjusted rate (95% CI) | Crude Rate (95% CI) | Age adjusted rate (95% CI) | Crude Rate (95% CI) | Age adjusted rate (95% CI) | Crude Rate (95% CI) | Age adjusted rate (95% CI) | |
| Mortality | 33.13 (33.03–33.22) | 18.74 (18.67 – 18.81) | 11.06 (10.85– 11.27) | 13.35 (13.07 – 13.62) | 24.53 (24.36–24.69) | 19.31 (19.16 – 19.46) | 5.13 (4.92–5.36) | 11.48 (10.66 – 12.31) |
| CHD | 3.76 (3.73–3.79) | 2.38 (2.36 – 2.41) | 1.17 (1.10–1.24) | 1.08 (1.01 – 1.15) | 2.97 (2.91–3.03) | 2.11 (2.06 – 2.16) | 0.82 (0.74–0.92) | 0.94 (0.75 – 1.13) |
| Stroke | 3.01 (2.98–3.03) | 1.83 (1.8 – 1.85) | 1.33 (1.26–1.41) | 1.32 (1.24 – 1.41) | 3.75 (3.68–3.82) | 2.69 (2.63 – 2.75) | 1.32 (1.21–1.44) | 2.03 (1.7 – 2.36) |
| AMI | 2.52 (2.50–2.55) | 1.66 (1.64 – 1.69) | 0.92 (0.86–0.99) | 0.87 (0.8 – 0.93) | 2.25 (2.20–2.31) | 1.65 (1.6 – 1.69) | 0.67 (0.59–0.76) | 0.79 (0.61 – 0.97) |
| PCI | 1.10 (1.09–1.12) | 0.7 (0.68 – 0.71) | 0.28 (0.25–0.31) | 0.24 (0.21 – 0.27) | 0.79 (0.76–0.82) | 0.53 (0.51 – 0.56) | 0.21 (0.17–0.27) | 0.24 (0.15 – 0.32) |
| CABG | 0.76 (0.75–0.77) | 0.43 (0.42 – 0.44) | 0.11 (0.09–0.13) | 0.10 (0.08 – 0.12) | 0.41 (0.39–0.43) | 0.26 (0.25 – 0.28) | 0.07 (0.05–0.10) | 0.05 (0.03 – 0.07) |
Event rates are presented as number per 1000 patient-years and 95% confidence intervals.
Figure 2.

Association of African-American race with all-cause mortality in the overall cohort of 3,072,966 veterans. Panel A shows association of African-American race with all-cause mortality in the overall cohort, with adjustments for baseline characteristics. White patients served as referent. Panel B shows associations of race with all-cause mortality in patients with and without an incident CHD event. CHD events were entered in the models as time dependent covariates, and models were estimated by including multiplicative interaction terms between race and CHD events. White patients without incident CHD served as referent. Panel C shows associations of race with all-cause mortality in patients with and without incident strokes. Strokes were entered in the models as time dependent covariates, and models were estimated by including multiplicative interaction terms between race and strokes. White patients without incident strokes served as referent. Model 1: unadjusted, Model 2: age, gender, baseline estimated glomerular filtration rate; Model 3: Model 2 variables plus comorbidities; Model 4: Model 3 variables plus baseline body mass index, systolic and diastolic blood pressure; Model 5: Model 4 variables plus mean income, marital status, service connectedness, area-level housing stress, low education, low employment and persistent poverty, frequency of VA healthcare encounters, use of angiotensin converting enzyme inhibitors/angiotensin receptor blockers and statins, and receipt of influenza vaccination(s), and each patient’s VA healthcare center.
Figure 3.
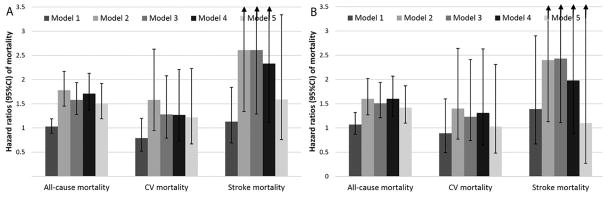
Crude and multivariable adjusted association of African-American race with all-cause, cardiovascular and stroke-related mortality in NHANES 1999–2004, overall (Panel A) and in participants with estimated glomerular filtration ≥60 ml/min/1.73m2 (Panel B). Adjustments were made for age, gender, estimated glomerular filtration rate, comorbidities, body mass index, systolic and diastolic blood pressure, marital status and poverty level.
Incident CHD
63,808 patients experienced an incident CHD event (crude rate: 3.43/1000PY, 95%CI: 3.40–3.46), with 53,988 events in whites (crude rate: 3.60/1000PY, 95%CI: 3.57–3.63) and 9,820 events in African-Americans (crude rate: 2.73/1000PY, 95%CI: 2.68–2.79). Incident CHD rates in African-Americans vs. whites were lower in both men and women after adjustment for age (Table 2). Both crude (HR, 95%CI: 0.75 (0.74–0.77)) and adjusted risks of incident CHD (HR, 95%CI: 0.63 (0.62–0.65)), and of the individual components (acute MI, CABG and PCI) were lower in African-Americans (Figure 4). The risk of incident CHD was higher following strokes vs. those who did not have an incident stroke, but incident strokes did not modify the association between race and incident CHD, which remained lower in African-American vs. white patients with or without incident strokes (Figure 4).
Figure 4.

Panel A: Association of African-American race with incident CHD and with incident AMI, CABG and PCI in the overall cohort of 3,072,966 veterans. White patients served as referent. Panel B: Associations of race with incident CHD in patients with and without an incident stroke. Strokes were entered in the models as time dependent covariates, and models were estimated by including multiplicative interaction terms between race and stroke. White patients without stroke served as referent. Model 1: unadjusted, Model 2: age, gender, baseline estimated glomerular filtration rate; Model 3: Model 2 variables plus comorbidities; Model 4: Model 3 variables plus baseline body mass index, systolic and diastolic blood pressure; Model 5: Model 4 variables plus mean income, marital status, service connectedness, area-level housing stress, low education, low employment and persistent poverty, frequency of VA healthcare encounters, use of angiotensin converting enzyme inhibitors/angiotensin receptor blockers and statins, and receipt of influenza vaccination(s), and each patient’s VA healthcare center.
Incident stroke
59,734 patients experienced an incident stroke (crude rate: 3.02/1000PY, 95%CI: 2.99–3.04), with 46,984 events in whites (crude rate: 2.91/1000PY, 95%CI: 2.88–2.93) and 12,750 events in African-Americans (crude rate: 3.49/1000PY, 95%CI: 3.43–3.55). Incident stroke rates in African-Americans vs. whites remained higher in both men and women after adjustment for age (Table 2). Crude stroke risk was higher in African-Americans (HR, 95%CI: 1.18 (1.16–1.21)), but this was attenuated after multivariable adjustments, especially for socioeconomic characteristics in Model 5 (HR, 95%CI: 0.99 (0.97–1.01), Figure 5). Incident CHD did not modify the association between race and incident stroke, which was similar in African-American vs. white patients with or without CHD, even though the risk of stroke was higher in patients who experienced an incident CHD event compared to those who did not (Figure 5).
Figure 5.

Panel A: Association of African-American race with incident ischemic strokes in the overall cohort of 3,072,966 veterans. White patients served as referent. Panel B: Associations of race with incident stroke in patients with and without incident CHD. CHD events were entered in the models as time dependent covariates, and models were estimated by including multiplicative interaction terms between race and CHD. White patients without CHD served as referent. Model 1: unadjusted, Model 2: age, gender, baseline estimated glomerular filtration rate; Model 3: Model 2 variables plus comorbidities; Model 4: Model 3 variables plus baseline body mass index, systolic and diastolic blood pressure; Model 5: Model 4 variables plus mean income, marital status, service connectedness, area-level housing stress, low education, low employment and persistent poverty, frequency of VA healthcare encounters, use of angiotensin converting enzyme inhibitors/angiotensin receptor blockers and statins, and receipt of influenza vaccination(s), and each patient’s VA healthcare center.
Sensitivity analyses
The mortality risk associated with African-American race was also lower in propensity score-matched analyses (HR, 95%CI: 0.86 (0.85–0.87), Supplemental Table 3), in patients who maintained eGFR ≥60 ml/min/1.73m2 (N=2,732,494; HR, 95%CI: 0.83 (0.82–0.84), and in various examined subgroups (Figure 6), but was similar in those who developed incident eGFR <60 ml/min/1.73m2 (N=328,221, HR, 95%CI: 0.99 (0.96–1.01) Supplemental Figures 1–2),
Figure 6.

Association of African-American race with various outcomes in pre-defined subgroups of the overall cohort of 3,072,966 veterans. White patients served as referent. Models were adjusted for age, gender, baseline estimated glomerular filtration rate, comorbidities, baseline body mass index, systolic and diastolic blood pressure, mean income, marital status, service connectedness, area-level housing stress, low education, low employment and persistent poverty, frequency of VA healthcare encounters, use of angiotensin converting enzyme inhibitors/angiotensin receptor blockers and statins, and receipt of influenza vaccination(s), and each patient’s VA healthcare center.
The risk of incident CHD was lower in African-Americans vs. whites in the overall propensity-matched cohort (HR, 95%CI: 0.68 (0.66–0.70) Supplemental Table 3), in patients who developed incident eGFR <60 ml/min/1.73m2 (HR, 95%CI: 0.79 (0.75–0.84)) and those who maintained eGFR ≥60 ml/min/1.73m2 throughout follow-up (HR, 95%CI: 0.63 (0.61–0.65), Supplemental Figures 3–4), and in all examined subgroups except for patients ≥80 years old (Figure 6), and in a competing risk regression model (Supplemental Table 4).
Stroke risk was also higher in African-Americans in the overall propensity-matched cohort (HR, 95%CI: 1.09 (1.06–1.12), Supplemental Table 3), in patients who developed incident CKD (HR, 95%CI: 1.17 (1.10–1.24)) and those who maintained eGFR ≥60 ml/min/1.73m2 (HR, 95%CI: 1.05 (1.02–1.09), Supplemental Figures 5–6), and in competing risk regression (Supplemental Table 4). African-Americans experienced higher stroke risk among older individuals and females, and in subgroups with prevalent CHF, lower eGFR and lower income (Figure 6).
DISCUSSION
In this large cohort of over 3 million contemporary US veterans with baseline eGFR >60 ml/min/1.73m2 we found significant differences in major clinical outcomes between African-Americans and whites not traditionally reported in the general population. We found substantially lower incident CHD rates and most surprisingly lower all-cause mortality in African-Americans compared to whites. Differences in demographic, comorbidity and socioeconomic characteristics accounted for some, but not all the difference in mortality and CHD. Contrasting the lower mortality seen in US veterans, our analyses of NHANES 1999–2004 showed higher all-cause mortality in African-Americans vs. whites. Similar to previous reports,36 incident stroke rates were higher in African-American veterans, but differences were attenuated to non-significant after adjustment for socio-economic characteristics.
Worse health outcomes in African-Americans have been well-described.37 These have included a variety of outcomes transcending age- and gender categories.2–6 The socio-economic deprivation of African-Americans has provided a plausible explanation for these observations,7 and point to the importance of breaking down the many remaining barriers faced by the African-American community. In today’s typical US healthcare environment it is difficult to separate the effects on outcomes of poor healthcare access and race-based discrimination in healthcare delivery from the effects of biological mechanisms. This would require not only an egalitarian healthcare system but a society that does not directly or indirectly discriminate. In a community based standardized health care system Karter et al found similar or even reduced rates of diabetes related complications in minority compared with white enrollees, with the exception of developing ESRD.38 The Department of Defense and VHA are open access healthcare systems in the US, as they provide comprehensive healthcare based on a military and/or veteran status, and thus it is less likely that institutional barriers or cost would disproportionately prevent African-American veterans from obtaining healthcare. In an analysis of Department of Defense enrollees Gao et al. found similar rates of quality care indicators for black and white patients with stages 3 and 4 CKD.39 Previous studies examining all-cause mortality in hospitalized patients,40 and outcomes associated with various health conditions such as congestive heart failure,41 Pneumocystis carinii penumonia42 or colorectal and lung cancer,43, 44 have also reported better outcomes in African-American veterans compared to those typically seen in non-veterans. Furthermore, our examination of basic healthcare metrics such as the administration of common health screening procedures and medications suggests that basic healthcare delivered after enrollment in a contemporary VHA facility is not racially discriminatory. Also supporting this notion, a previous study examining unmet healthcare needs in patients of various race and ethnicity showed that the use of VA ambulatory care eliminated the disparity in the ability to obtain needed healthcare services between African-American and white veterans.45 Finally, among participants in the UK Prospective Diabetes Study (UKPDS), Afro-Carribbean patients experienced substantially reduced risk of all-cause and diabetes-related mortality, myocardial infarctions, but not strokes,46, 47 suggesting that receiving similar care in a controlled system outside the US may also result in benefits for minortities that are similar to those reported in our study.
One possible explanation for the observed racial discrepancies in outcomes are biological differences between African-Americans and whites which are overwhelmed by the socioeconomic disparities in the general population, but uncovered in a system that provides open access to healthcare. There is now mounting evidence that some African-Americans have distinctly unique genetic characteristics linked to their African ancestry which have a direct impact on health outcomes.8 Aside from the earlier mentioned common genetic polymorphisms responsible for excess CKD and ESRD in African Americans,9–13 there may be additional ones affecting cardiovascular pathophysiology and outcomes.48–50 We limited our analysis to patients with eGFR≥60 in order to examine patients in whom clinical outcomes would be less likely affected by genetic differences leading to kidney disease and/or the biologic effect of azotemia, which could directly or indirectly affect the lower mortality previously described by us in African-American veterans with CKD.15 Our results which show lower mortality and CHD incidence, but higher stroke incidence in African-Americans independent of their level of eGFR suggests that such differences could be a result of genetic or other differences in susceptibility to various cardiovascular processes. Recent findings that African-Americans experience significantly less vascular calcification compared to white individuals,16–19 perhaps due to genetic differences in various physiologic processes such as vitamin D and bone metabolism,8, 20 support such a hypothesis. Other race-specific biologic differences that could affect other cardiovascular outcomes, such as strokes, include a higher incidence of hypertension, more uncontrolled hypertension, and differences in central aortic blood pressure and prevalence of left ventricular hypertrophy in African-Americans.21 The presence of divergent clinical outcomes (lower CHD incidence but higher stroke incidence) could be indicative of distinctly different biological processes underlying these outcomes, with some portending a favorable, but others an unfavorable outcome in African-Americans. Our finding that mortality following incident cardiovascular events in our cohort was similar in African-Americans and whites, and the lack of difference in cardiovascular and stroke-related mortality between African-Americans and whites in NHANES suggests that most of the race-based differences could affect the development of cardiovascular lesions, and less so their secondary deleterious consequences.
Our study is notable for the very large number of studied individuals and for its US-wide distribution. Our study also has several limitations. Our cohort consisted predominantly of males, and hence conclusions may not apply to females. Previous studies have described important gender differences in race-based outcomes.51 However, our findings were similar in female veterans compared to males, and in spite of the low percentage of females in our cohort, their absolute number was substantial (>150,000 patients), and eclipsed the number of females examined in most or all previous studies. We used self-identified race as our predictor, which is biologically inferior to gene-based determination of ancestry; however, the former captures social constructs and the the latter method is not yet available for large scale epidemiologic studies. Our cohort consisted of US veterans with distinct demographic and clinical characteristics, and hence it is unclear if our findings can be applied to non-veterans. Enrollment in the US armed services and subsequently into the VHA may select distinct populations of African-Americans and whites. While we cannot discount this possibility, the basic characteristics of our cohort suggests that differences between African-Americans and whites that are seen in the general population were indeed present in our cohort (such as differences in income, marital status, and certain comorbidities), and hence it is less plausible that the observed differences in outcomes were solely due to selection bias. Furthermore, higher stroke rates52 and lower incidence of CHD47, 51 in populations of African ancestry have been previously reported in non-veterans, which also suggests that our findings are not limited to US veterans alone. We examined clinical events recorded during care received in a VA facility, and would not have captured similar events recorded at non-VA facilities. We captured clinical events using diagnostic codes, and not the more accurate adjudication procedures used in clinial trials, which are not feasible in a study of this size. However, these limitations do not apply to all-cause mortality. We examined all-cause mortality, as we had no information about causes of death. We adjusted for a variety of demographic, social, economic and healthcare-quality indices that could affect race-based differences in care, but we cannot exclude the possibility that unmeasured confounders may also play a role in the observed differences. We defined our cohort based on eGFR ≥60 ml/min/1.73m2, but we did not have markers of earlier stages of CKD (e.g. proteinuria). We imply that the described associations are present in the overall VA population irrespective of level of kidney function, based on separate analyses in patients with eGFR ≥60 and <60 ml/min/1.73m2, but without analyzing all VA-enrolled patients as a single cohort.
CONCLUSIONS
There are significant differences in major clinical outcomes experienced by African-American patients enrolled in an open-access healthcare system (US VHA), compared to their white counterparts. African-American veterans experienced a lower incidence of CHD and higher incidence of stroke, and lower all-cause mortality compared to white veterans. Differences in mortality and in incident CHD could not be explained by differences in demographic, comorbidity and socio-economic characteristics, suggesting that there may be important socio-cultural and/or evolutionary transmitted biological differences (e.g. neurohormonal, epigenetic, gene variants) explaining the development of cardiovascular or other diseases in individuals of different races. Future studies will need to elucidate the nature of such putative differences in order to determine if race-specific measures are needed for the prevention and treatment of cardiovascular disease.
Supplementary Material
Acknowledgments
We thank Dulcie Kermah, MPH for help with NHANES analyses, and Praveen Potukuchi, B Pharm, MSc, MS for help with preparing tables and figures. CPK and KKZ are employees of the US Department of Veterans affairs. Opinions expressed in this paper are those of the authors’ and do not necessarily represent the opinion of the Department of Veterans Affairs.
Funding Sources: This study was supported by grant R01DK096920 to CPK and KKZ and is the result of work supported with resources and the use of facilities at the Memphis VA Medical Center and the Long Beach VA Medical Center. Support for VA/CMS data is provided by the Department of Veterans Affairs, Veterans Health Administration, Office of Research and Development, Health Services Research and Development, VA Information Resource Center (Project Numbers SDR 02-237 and 98-004). KN is supported by NIH grants TR000124, MD000182 and AG021684.
Footnotes
Disclosures: None.
References
- 1.U.S. Census Bureau. State and County QuickFacts. 2014 http://quickfacts.census.gov/qfd/states/00000.html.
- 2.Infant mortality and low birth weight among black and white infants--United States, 1980–2000. MMWR Morb Mortal Wkly Rep. 2002;51:589–92. [PubMed] [Google Scholar]
- 3.Tucker MJ, Berg CJ, Callaghan WM, Hsia J. The Black-White disparity in pregnancy-related mortality from 5 conditions: differences in prevalence and case-fatality rates. Am J Public Health. 2007;97:247–51. doi: 10.2105/AJPH.2005.072975. [DOI] [PMC free article] [PubMed] [Google Scholar]
- 4.Gold DR, Wright R. Population disparities in asthma. Annu Rev Public Health. 2005;26:89–113. doi: 10.1146/annurev.publhealth.26.021304.144528. [DOI] [PubMed] [Google Scholar]
- 5.Hyman DJ, Pavlik VN. Characteristics of patients with uncontrolled hypertension in the United States. N Engl J Med. 2001;345:479–86. doi: 10.1056/NEJMoa010273. [DOI] [PubMed] [Google Scholar]
- 6.Clark LT, Ferdinand KC, Flack JM, Gavin JR, III, Hall WD, Kumanyika SK, Reed JW, Saunders E, Valantine HA, Watson K, Wenger NK, Wright JT. Coronary heart disease in African Americans. Heart Dis. 2001;3:97–108. doi: 10.1097/00132580-200103000-00007. [DOI] [PubMed] [Google Scholar]
- 7.Mays VM, Cochran SD, Barnes NW. Race, race-based discrimination, and health outcomes among African Americans. Annu Rev Psychol. 2007;58:201–25. doi: 10.1146/annurev.psych.57.102904.190212. [DOI] [PMC free article] [PubMed] [Google Scholar]
- 8.Freedman BI, Register TC. Effect of race and genetics on vitamin D metabolism, bone and vascular health. Nat Rev Nephrol. 2012;8:459–66. doi: 10.1038/nrneph.2012.112. [DOI] [PMC free article] [PubMed] [Google Scholar]
- 9.Foster MC, Coresh J, Fornage M, Astor BC, Grams M, Franceschini N, Boerwinkle E, Parekh RS, Kao WH. APOL1 variants associate with increased risk of CKD among African Americans. J Am Soc Nephrol. 2013;24:1484–91. doi: 10.1681/ASN.2013010113. [DOI] [PMC free article] [PubMed] [Google Scholar]
- 10.Freedman BI, Kopp JB, Langefeld CD, Genovese G, Friedman DJ, Nelson GW, Winkler CA, Bowden DW, Pollak MR. The apolipoprotein L1 (APOL1) gene and nondiabetic nephropathy in African Americans. J Am Soc Nephrol. 2010;21:1422–6. doi: 10.1681/ASN.2010070730. [DOI] [PMC free article] [PubMed] [Google Scholar]
- 11.Friedman DJ, Kozlitina J, Genovese G, Jog P, Pollak MR. Population-Based Risk Assessment of APOL1 on Renal Disease. J Am Soc Nephrol. 2011;22:2098–105. doi: 10.1681/ASN.2011050519. [DOI] [PMC free article] [PubMed] [Google Scholar]
- 12.Genovese G, Friedman DJ, Ross MD, Lecordier L, Uzureau P, Freedman BI, Bowden DW, Langefeld CD, Oleksyk TK, Uscinski Knob AL, Bernhardy AJ, Hicks PJ, Nelson GW, Vanhollebeke B, Winkler CA, Kopp JB, Pays E, Pollak MR. Association of trypanolytic ApoL1 variants with kidney disease in African Americans. Science. 2010;329:841–5. doi: 10.1126/science.1193032. [DOI] [PMC free article] [PubMed] [Google Scholar]
- 13.Tzur S, Rosset S, Shemer R, Yudkovsky G, Selig S, Tarekegn A, Bekele E, Bradman N, Wasser WG, Behar DM, Skorecki K. Missense mutations in the APOL1 gene are highly associated with end stage kidney disease risk previously attributed to the MYH9 gene. Hum Genet. 2010;128:345–50. doi: 10.1007/s00439-010-0861-0. [DOI] [PMC free article] [PubMed] [Google Scholar]
- 14.Kalantar-Zadeh K, Kovesdy CP, Derose SF, Horwich TB, Fonarow GC. Racial and survival paradoxes in chronic kidney disease. Nat Clin Pract Nephrol. 2007;3:493–506. doi: 10.1038/ncpneph0570. [DOI] [PubMed] [Google Scholar]
- 15.Kovesdy CP, Quarles LD, Lott EH, Lu JL, Ma JZ, Molnar MZ, Kalantar-Zadeh K. Survival Advantage in Black Versus White Men With CKD: Effect of Estimated GFR and Case Mix. Am J Kidney Dis. 2013;62:228–35. doi: 10.1053/j.ajkd.2012.12.012. [DOI] [PMC free article] [PubMed] [Google Scholar]
- 16.Bild DE, Detrano R, Peterson D, Guerci A, Liu K, Shahar E, Ouyang P, Jackson S, Saad MF. Ethnic differences in coronary calcification: the Multi-Ethnic Study of Atherosclerosis (MESA) Circulation. 2005;111:1313–20. doi: 10.1161/01.CIR.0000157730.94423.4B. [DOI] [PubMed] [Google Scholar]
- 17.Lee TC, O’Malley PG, Feuerstein I, Taylor AJ. The prevalence and severity of coronary artery calcification on coronary artery computed tomography in black and white subjects. J Am Coll Cardiol. 2003;41:39–44. doi: 10.1016/s0735-1097(02)02618-9. [DOI] [PubMed] [Google Scholar]
- 18.Tang W, Arnett DK, Province MA, Lewis CE, North K, Carr JJ, Pankow JS, Hopkins PN, Devereux RB, Wilk JB, Wagenknecht L. Racial differences in the association of coronary calcified plaque with left ventricular hypertrophy: the National Heart, Lung, and Blood Institute Family Heart Study and Hypertension Genetic Epidemiology Network. Am J Cardiol. 2006;97:1441–8. doi: 10.1016/j.amjcard.2005.11.076. [DOI] [PubMed] [Google Scholar]
- 19.Freedman BI, Langefeld CD, Lu L, Palmer ND, Carrie SS, Bagwell BM, Hicks PJ, Xu J, Wagenknecht LE, Raffield LM, Register TC, Jeffrey CJ, Bowden DW, Divers J. APOL1 associations with nephropathy, atherosclerosis, and all-cause mortality in African Americans with type 2 diabetes. Kidney Int. 2015;87:176–81. doi: 10.1038/ki.2014.255. Epub 2014 Jul 23. [DOI] [PMC free article] [PubMed] [Google Scholar]
- 20.Powe CE, Evans MK, Wenger J, Zonderman AB, Berg AH, Nalls M, Tamez H, Zhang D, Bhan I, Karumanchi SA, Powe NR, Thadhani R. Vitamin D-binding protein and vitamin D status of black Americans and white Americans. N Engl J Med. 2013;369:1991–2000. doi: 10.1056/NEJMoa1306357. [DOI] [PMC free article] [PubMed] [Google Scholar]
- 21.Ferdinand KC, Townsend RR. Hypertension in the US Black population: risk factors, complications, and potential impact of central aortic pressure on effective treatment. Cardiovasc Drugs Ther. 2012;26:157–65. doi: 10.1007/s10557-011-6367-8. [DOI] [PubMed] [Google Scholar]
- 22.Gosmanova EO, Lu JL, Streja E, Cushman WC, Kalantar-Zadeh K, Kovesdy CP. Association of medical treatment nonadherence with all-cause mortality in newly treated hypertensive US veterans. Hypertension. 2014;64:951–7. doi: 10.1161/HYPERTENSIONAHA.114.03805. [DOI] [PMC free article] [PubMed] [Google Scholar]
- 23.VA Information Resource Center. VIReC Resource Guide: VA Corporate Data Warehouse. Hines, IL: U.S. Dept. of Veterans Affairs, Health Services Research and Development Service, VA Information Resource Center; Mar, 2012. [Google Scholar]
- 24.2015 http://www.va.gov/vetdata/Veteran_Population.asp.
- 25.Levey AS, Stevens LA, Schmid CH, Zhang YL, Castro AF, III, Feldman HI, Kusek JW, Eggers P, Van LF, Greene T, Coresh J. A new equation to estimate glomerular filtration rate. Ann Intern Med. 2009;150:604–12. doi: 10.7326/0003-4819-150-9-200905050-00006. [DOI] [PMC free article] [PubMed] [Google Scholar]
- 26.US Department of Veterans Affairs VA. Information Resource Center Data Quality Update: Race. 2009. Nov, [Google Scholar]
- 27.Sohn MW, Zhang H, Arnold N, Stroupe K, Taylor B, Wilt T, Hynes D. Transition to the new race/ethnicity data collection standards in the Department of Veterans Affairs. Population Health Metrics. 2006;4:7. doi: 10.1186/1478-7954-4-7. [DOI] [PMC free article] [PubMed] [Google Scholar]
- 28.Kovesdy CP, Bleyer AJ, Molnar MZ, Ma JZ, Sim JJ, Cushman WC, Quarles LD, Kalantar-Zadeh K. Blood pressure and mortality in u.s. Veterans with chronic kidney disease: a cohort study. Ann Intern Med. 2013;159:233–42. doi: 10.7326/0003-4819-159-4-201308200-00004. [DOI] [PMC free article] [PubMed] [Google Scholar]
- 29.Kovesdy CP, Lu JL, Molnar MZ, Ma JZ, Canada RB, Streja E, Kalantar-Zadeh K, Bleyer AJ. Observational modeling of strict vs conventional blood pressure control in patients with chronic kidney disease. JAMA Intern Med. 2014;174:1442–9. doi: 10.1001/jamainternmed.2014.3279. [DOI] [PMC free article] [PubMed] [Google Scholar]
- 30.2014 http://www.virec.research.va.gov/Resources/Info-About-VA-Data.asp.
- 31.VIReC Research User Guide. VHA Medical SAS Inpatient Datasets FY2006. Hines, IL: U.S. Department of Veterans Affairs. VA Information Resource Center; Sep, 2007. [Google Scholar]
- 32.VIReC Research User Guide. VHA Medical SAS Outpatient Datasets FY2006. Hines, IL: U.S. Department of Veterans Affairs. VA Information Resource Center; Sep, 2007. [Google Scholar]
- 33.Arnold N, Sohn M, Maynard C, Hynes DM. VIReC Technical Report 2: VA-NDI Mortality Data Merge Project. 2006 [Google Scholar]
- 34.KDIGO 2012 clinical practice guideline for the evaluation and management of chronic kidney disease. Kidney Int Suppl. 2013;3:1–150. doi: 10.1038/ki.2013.243. [DOI] [PubMed] [Google Scholar]
- 35.Fine JP, Gray RJ. A proportional hazards model for the subdistribution of competing risk. J Am Stat Assoc. 1999;94:496–509. [Google Scholar]
- 36.Go AS, Mozaffarian D, Roger VL, Benjamin EJ, Berry JD, Blaha MJ, Dai S, Ford ES, Fox CS, Franco S, Fullerton HJ, Gillespie C, Hailpern SM, Heit JA, Howard VJ, Huffman MD, Judd SE, Kissela BM, Kittner SJ, Lackland DT, Lichtman JH, Lisabeth LD, Mackey RH, Magid DJ, Marcus GM, Marelli A, Matchar DB, McGuire DK, Mohler ER, III, Moy CS, Mussolino ME, Neumar RW, Nichol G, Pandey DK, Paynter NP, Reeves MJ, Sorlie PD, Stein J, Towfighi A, Turan TN, Virani SS, Wong ND, Woo D, Turner MB. Executive summary: heart disease and stroke statistics--2014 update: a report from the American Heart Association. Circulation. 2014;129:399–410. doi: 10.1161/01.cir.0000442015.53336.12. [DOI] [PubMed] [Google Scholar]
- 37.Geronimus AT, Bound J, Waidmann TA, Hillemeier MM, Burns PB. Excess mortality among blacks and whites in the United States. N Engl J Med. 1996;335:1552–8. doi: 10.1056/NEJM199611213352102. [DOI] [PubMed] [Google Scholar]
- 38.Karter AJ, Ferrara A, Liu JY, Moffet HH, Ackerson LM, Selby JV. Ethnic disparities in diabetic complications in an insured population. JAMA. 2002;287:2519–27. doi: 10.1001/jama.287.19.2519. [DOI] [PubMed] [Google Scholar]
- 39.Gao SW, Oliver DK, Das N, Hurst FP, Lentine KL, Agodoa LY, Sawyers ES, Abbott KC. Assessment of racial disparities in chronic kidney disease stage 3 and 4 care in the department of defense health system. Clin J Am Soc Nephrol. 2008;3:442–9. doi: 10.2215/CJN.03940907. [DOI] [PMC free article] [PubMed] [Google Scholar]
- 40.Jha AK, Shlipak MG, Hosmer W, Frances CD, Browner WS. Racial differences in mortality among men hospitalized in the Veterans Affairs health care system. JAMA. 2001;285:297–303. doi: 10.1001/jama.285.3.297. [DOI] [PubMed] [Google Scholar]
- 41.Deswal A, Petersen NJ, Souchek J, Ashton CM, Wray NP. Impact of race on health care utilization and outcomes in veterans with congestive heart failure. J Am Coll Cardiol. 2004;43:778–84. doi: 10.1016/j.jacc.2003.10.033. [DOI] [PubMed] [Google Scholar]
- 42.Bennett CL, Horner RD, Weinstein RA, Dickinson GM, DeHovitz JA, Cohn SE, Kessler HA, Jacobson J, Goetz MB, Simberkoff M. Racial differences in care among hospitalized patients with Pneumocystis carinii pneumonia in Chicago, New York, Los Angeles, Miami, and Raleigh-Durham. Arch Intern Med. 1995;155:1586–92. [PubMed] [Google Scholar]
- 43.Akerley WL, III, Moritz TE, Ryan LS, Henderson WG, Zacharski LR. Racial comparison of outcomes of male Department of Veterans Affairs patients with lung and colon cancer. Arch Intern Med. 1993;153:1681–8. [PubMed] [Google Scholar]
- 44.Dominitz JA, Samsa GP, Landsman P, Provenzale D. Race, treatment, and survival among colorectal carcinoma patients in an equal-access medical system. Cancer. 1998;82:2312–20. doi: 10.1002/(sici)1097-0142(19980615)82:12<2312::aid-cncr3>3.0.co;2-u. [DOI] [PubMed] [Google Scholar]
- 45.Washington DL, Harada ND, Villa VM, Damron-Rodriguez J, Dhanani S, Shon H, Makinodan T. Racial variations in Department of Veterans Affairs ambulatory care use and unmet health care needs. Mil Med. 2002;167:235–41. [PubMed] [Google Scholar]
- 46.Davis TM. Ethnic diversity in type 2 diabetes. Diabet Med. 2008;25 (Suppl 2):52–6. doi: 10.1111/j.1464-5491.2008.02499.x. [DOI] [PubMed] [Google Scholar]
- 47.Davis TM, Coleman RL, Holman RR. Ethnicity and long-term vascular outcomes in Type 2 diabetes: a prospective observational study (UKPDS 83) Diabet Med. 2014;31:200–7. doi: 10.1111/dme.12353. [DOI] [PubMed] [Google Scholar]
- 48.Chinevere TD, Murray CK, Grant E, Jr, Johnson GA, Duelm F, Hospenthal DR. Prevalence of glucose-6-phosphate dehydrogenase deficiency in U.S. Army personnel. Mil Med. 2006;171:905–7. doi: 10.7205/milmed.171.9.905. [DOI] [PubMed] [Google Scholar]
- 49.Hecker PA, Leopold JA, Gupte SA, Recchia FA, Stanley WC. Impact of glucose-6-phosphate dehydrogenase deficiency on the pathophysiology of cardiovascular disease. Am J Physiol Heart Circ Physiol. 2013;304:H491–H500. doi: 10.1152/ajpheart.00721.2012. [DOI] [PMC free article] [PubMed] [Google Scholar]
- 50.Mozos I. Mechanisms linking red blood cell disorders and cardiovascular diseases. Biomed Res Int. 2015;2015:682054. doi: 10.1155/2015/682054. [DOI] [PMC free article] [PubMed] [Google Scholar]
- 51.Gillum RF, Mussolino ME, Madans JH. Coronary heart disease incidence and survival in African-American women and men. The NHANES I Epidemiologic Follow-up Study. Ann Intern Med. 1997;127:111–8. doi: 10.7326/0003-4819-127-2-199707150-00003. [DOI] [PubMed] [Google Scholar]
- 52.Howard VJ, Kleindorfer DO, Judd SE, McClure LA, Safford MM, Rhodes JD, Cushman M, Moy CS, Soliman EZ, Kissela BM, Howard G. Disparities in stroke incidence contributing to disparities in stroke mortality. Ann Neurol. 2011;69:619–27. doi: 10.1002/ana.22385. [DOI] [PMC free article] [PubMed] [Google Scholar]
Associated Data
This section collects any data citations, data availability statements, or supplementary materials included in this article.