Abstract
Interactions of lipids are central to the folding and stability of membrane proteins. Coarse-grained molecular simulations have been used to reveal the mechanisms of self-assembly of protein/membrane and protein/detergent complexes for representatives of two classes of membrane protein, namely glycophorin (a simple α-helical bundle) and OmpA (a β-barrel). The accuracy of the coarse-grained simulations is established via comparison with the equivalent atomistic simulations of self-assembly of protein/detergent micelles. The simulation of OmpA/bilayer self-assembly reveals how a folded outer membrane protein can be inserted in a bilayer. The glycophorin/bilayer simulation supports the two-state model of membrane folding, in which transmembrane helix insertion precedes dimer self-assembly within a bilayer. The simulations also suggest a dynamic equilibrium exists between the glycophorin helix monomer and dimer within a bilayer. The simulated glycophorin helix dimer is remarkably close in structure to that revealed by NMR. Thus, coarse-grained methods may help to define mechanisms of membrane protein (re)folding, and will prove suitable for simulation of larger scale dynamic rearrangements of biological membranes.
Introduction
Understanding the mechanisms of folding and self-assembly of membrane proteins is a key problem in contemporary biophysical chemistry. From a biological perspective, membrane proteins account for ~25% of open reading frames in most genomes 1 and yet only ~100 high resolution structures of membrane proteins are known 2. An improved understanding the folding mechanisms of membrane proteins will enable structure prediction. From a chemical perspective, an improved understanding of the principles of membrane protein structure will facilitate redesign and de novo design of membrane proteins 3,4. Molecular dynamics offers a route to accurate simulations of membrane protein self-assembly processes. However, current studies are somewhat limited by a practical upper limit of ~100 ns on the timescale of simulations of complex membrane protein-containing systems.
Biophysical and structural studies indicate that interactions of membrane proteins with lipid or detergent molecules are critical to their folding and stability 5,6. The two classes of membrane protein are thought to insert into membranes in different fashions. Thus, in the two-stage folding model for α-helical membrane proteins 7 transmembrane (TM) helices insert independently into the membrane, before self-assembling into a functional helix bundle. In contrast, for β-barrel membrane proteins is different, with β-barrel formation approximately synchronous with insertion 8.
Glycophorin A (GpA) and OmpA provide representatives of these two classes of membrane protein, and provide useful models for studying insertion. GpA contains a single ~25 residue α-helix which dimerizes to form the TM domain, the structure of which has been determined in detergent micelles 9 and lipid bilayers 10. The GpA helix contains a GxxxG motif which plays a key role in dimerization 11. OmpA is a bacterial outer membrane protein containing a ~170 residue N-terminal domain that forms an eight-stranded β-barrel 12,13.
Limited structural data are available on the interactions between membrane proteins and lipid or detergent molecules 5,14-17. Atomistic molecular dynamics (MD) simulations of membrane proteins 18 complement these data, providing a more dynamic view of protein/lipid and protein/detergent interactions 19,20. The self-assembly of protein/detergent micelles has been simulated for OmpA 21, OmpX 22, and GpA 23. In principle simulations may provide an approach to more complex phenomena, such as membrane protein folding 24, or vesicle fusion 25. However, the timescales of these processes are currently inaccessible to atomistic simulations. Thus, longer (~1 μs) simulations are required to embrace a wider range of membrane processes.
Coarse-grained (CG) models, in which small groups of atoms are treated as single particles, provide an approach to increasing the timescale and system dimensions of membrane simulations 26. CG models have been developed for detergents and lipids 27-30, proteins 31, and DNA 32. In one such model 30 each CG particle represents, on average, four heavy (i.e. not H) atoms (including water molecules). Different CG particle types interact via Lennard-Jones and screened Coulombic potentials, whilst soft harmonic terms maintain bond lengths and angles. CG simulations have been applied to membranes, including simulation of hydrophobic matching 33, phase transitions 34, and insertion and solute transport of simple model channels 35. These studies have utilised simplified representations of peptides and pores. Given the importance of specific interactions of sidechains with lipids in determining membrane protein stability 36,37, CG models which include different amino acid types are needed for accurate simulation of membrane proteins.
Methods
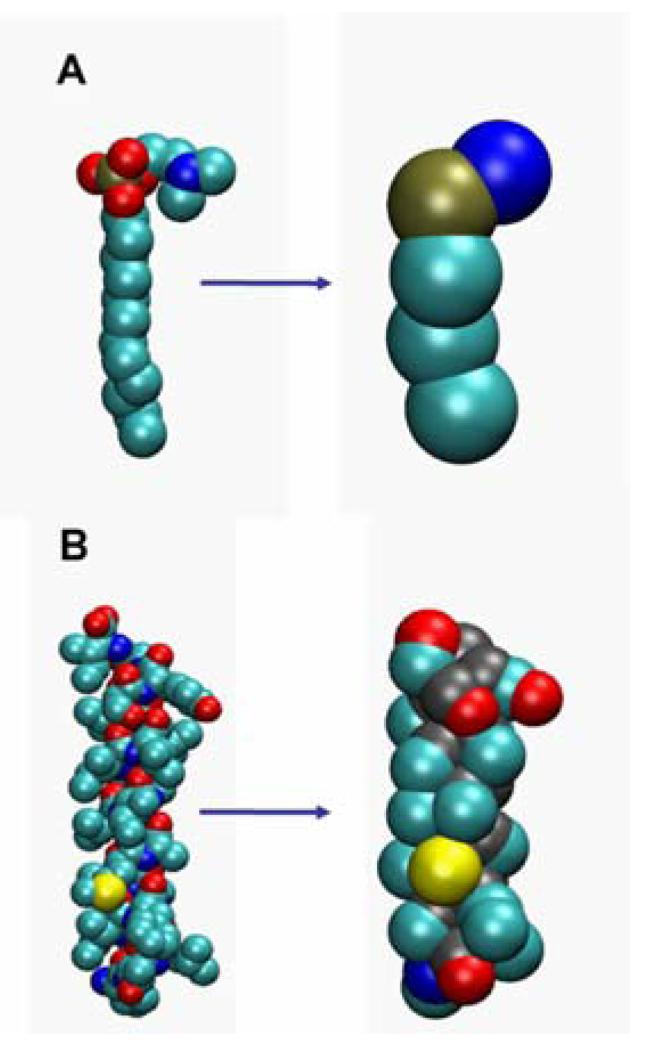
Coarse-grained (CG) parameters for lipid molecules (dipalmitoyl-phosphatidylcholine, DPPC), detergent molecules (dodecyl-phosphocholicdne, DPC; Fig. 1A), Na+ and Cl− ions, and water molecules were as in 30. CG parameterisation of amino acids was based on the methods derived for lipids by Marrink et al. 30. Thus, an approximate four-to-one mapping of heavy (i.e. not H) atoms to CG particles was used. As described in 30, only four CG particle types are distinguished, namely “polar” (P), “mixed polar/apolar” (N), “hydrophobic apolar” (C), or “charged” (Q) groups, along with further subtypes for the N and Q particles which allow fine tuning of Lennard-Jones interactions to reflect hydrogen bonding capacities.
Figure 1.
Atomistic (left hand) and coarse grained (right hand) models compared for: A a DPC molecule; and B a GpA helix. Colours for atoms: cyan = carbon; red = oxygen; blue = nitrogen; bronze = phosphorus; yellow = sulphur. Colours for CG particles: cyan = apolar; red = polar; blue = positively charged; bronze = negatively charged; yellow = neutral.
The non-bonded interactions between these particles are described by the standard Lennard-Jones (LJ) potential (see www.gromacs.org for details of implementation). In all cases, the same effective LJ particle size of 0.47 nm is used. Only five levels of LJ interaction are defined by the Marrink forcefield, ranging from attractive (representing strong polar interactions as in bulk water) through intermediate (representing non-polar interactions in aliphatic chains) through to repulsive interactions (representing hydrophobic repulsion between non-polar and polar phases) 30. It should thus be noted that the subtypes reflecting hydrogen bonding capacity for the N and Q particles mentioned above simply modulate the LJ interactions with other particles. “Charged” (Q) groups, intended for groups bearing approximately full charges, also interact via the standard Coulombic potential with a relative dielectric constant of 20. Shift functions are applied so that the energies and forces vanish at the cut-off distance. The LJ interactions are smoothly shifted to zero between 0.9 nm and 1.2 nm to reduce the cut-off noise. The Coulombic interactions are also shifted to zero, from 0 nm to the same cut-off distance of 1.2 nm.
The appropriate particle types were assigned based on the partial charges and hydrogen bonding potentials of the constituent atoms of each amino acid. Thus, a single backbone particle of type “mixed polar/apolar” (N) was assigned to every amino acid residue, plus between zero and two sidechain particles. The backbone particle subtype for a particular peptide bond group depends on the presence of H-bonds within the backbone of the starting atomistic structure; the appropriate particle subtype was applied according to 30, selected from N0 (no hydrogen-bonding), Nd (hydrogen-bonding donor), Na (hydrogen-bonding acceptor), or Nda (hydrogen-bonding donor and acceptor). An H-bond was defined using a 0.25 nm cut-off for the hydrogen-acceptor distance, and 60° for the donor-hydrogen-acceptor angle.
The sidechain particles were assigned as follows: Small hydrophobic residues (Ala, Ile, Leu, Pro, Val) were assigned particle type “apolar” (C), whilst the large hydrophobic Phe was assigned two “apolar” particles (C+C). The sulfur-containing amino acids, Cys and Met, are hydrophobic and do not hydrogen-bond with water, yet their sulfur-containing group contains a fairly strong dipole. Therefore, their sidechains were assigned a particle of type “mixed polar/apolar with no hydrogen-bonding capacity” (N0). The sidechains of Asn and Gln were also assigned “mixed polar/apolar” particle types, but with hydrogen-bonding donor and acceptor character due to their amide groups (Nda). The sidechains of the small hydrophilic residues Ser and Thr were assigned particle type “polar” (P) due to their hydroxyl groups. Although Tyr also contains a hydroxyl group and hence hydrogen-bonding donor capacity, it is significantly hydrophobic in nature, with the same number of carbon atoms as Phe; hence it was assigned particle types C+Nd. As a result, we observed in our test simulations that “interfacial” Tyr residues interacted more favourably with the glycerol backbone region of the bilayer than the headgroup region, which was consistent with the equivalent atomistic simulations. The sidechains of His and Trp contain hydrophobic rings, but also hydrogen-bonding acceptor and/or donor capability. Hence, the His sidechain was assigned particle types C+Nda, whilst Trp was assigned Nd+C. Finally, the sidechain particles of ionisable residues all incorporated a charged (Q) group of integer value +1e or −1e. Thus, the sidechains of acidic residues Asp and Glu were assigned particle type “charged with hydrogen-bonding acceptor capacity” (Qa). The longer basic sidechains of Lys and Arg which also contain linear acyl moieties were assigned an “apolar” particle followed by a “charged with hydrogen-bonding donor capacity” particle (C+Qd).
Protein bonds and angles were treated with harmonic potentials as described in 30. Bond potentials used a force constant of 1250 kJ mol−1 nm−2 and an equilibrium bond length of 0.38 nm (representing the mean distance between Cα atoms in proteins). Bond angle potentials used a force constant of 25 or 35 kJ mol−1 rad−2 for residues in random coil or secondary structure elements, respectively. Equilibrium bond angles were 90° for α-helical segments, 130° for β-strand segments, and 120° for random coil regions. To maintain secondary structural elements, harmonic distance restraints between backbone particles within the element were applied to mimic secondary structure H-bonds (as defined above). The distance was maintained between 0.45 and 0.65 nm, with a force constant of 1000 kJ mol−1 nm−2.
The initial CG models for proteins OmpA and glycophorin (GpA; Fig. 1B) were derived by extracting the coordinates for all Cα atoms and selected sidechain atoms from the corresponding all atom files. The OmpA coordinates were from pdb (www.rcsb.org) file 1BXW; the GpA micelle NMR structure was from pdb 1AFO; and the GpA bilayer NMR structure was provided by Steven Smith 10. Each CG model was energy minimised using <100 steps of the steepest decent method, to relax any steric conflicts. Subsequently, each model was combined with either randomly positioned CG DPPC lipid molecules (bilayer self-assembly simulations), or by 60 or 80 CG DPC detergent molecules (micelle self-assembly simulations) for GpA and OmpA, respectively. The detergent and lipid structures were obtained from previous simulations of the detergents/lipids alone in water. Each system was solvated with ~3000 CG water particles (equivalent to ~12000 atomistic water molecules), and where necessary, sodium or chloride counterions were added to preserve overall electrical neutrality. Each system was then energy minimised again, using <100 steps of the steepest decent method, to relax any steric conflicts between protein, detergent/lipid and solvent. Production simulations were then performed.
The non-bonded neighbour list was updated every 10 steps. All simulations were performed at constant temperature, pressure and number of particles. The temperature of the protein, DPC/DPPC, and solvent were each coupled separately using the Berendsen algorithm 38 at 300 K for the detergent simulations, and at 323 K for the lipid simulations, with a coupling constant τT = 40 ps. The system pressure was anisotropically coupled using the Berendsen algorithm at 1 bar with a coupling constant τP = 40 ps and a compressibility of 1 × 10⁻⁵ bar−1. The timestep for integration was 40 fs. Simulations were performed on dual Pentium 3, Xeon 4, and Athlon MP Linux workstations. Analyses were performed using GROMACS tools and locally-written code. All simulations were performed using the GROMACS 3.1.4 simulation package (www.gromacs.org) 39. Potentials and simulation parameters for all atomistic simulations were as in 40 and 21, and for CG simulations were as in 30.
Results
Coarse-Grained Simulations
In order to simulate lipid/protein interactions we have extended the Marrink CG lipid model 30 to proteins of known structure, and have used this to analyse insertion of OmpA and GpA into detergent micelles and lipid bilayers. Each amino acid is represented by a single backbone particle plus between 0 and 2 sidechain particles.
The potential functions in the CG model are smoother than their atomistic counterparts, and therefore the dynamics of CG models are generally faster 26. In our CG simulations, as in 30, the diffusion of water and the lateral diffusion of lipid is 3-5 times faster than in corresponding atomistic simulations. However, the diffusion of dodecylphosphocholine (DPC) detergent molecules and protein is only about twice as fast. As one might expect coarse-graining to speed up different dynamic processes to different extents, we have chosen not to rescale simulation times when presenting and interpreting our results. In order to more fully understand the consequences of the CG procedure for protein/membrane and protein/detergent simulations, we have run a number of simulations using the CG model which we have compared with equivalent atomistic simulations of OmpA and GpA.
We have performed a total of 16 simulations (Table 1), of which 6 were atomistic (total time 0.35 μs) and 10 were coarse-grained (total time 12 μs). For each protein (OmpA and the GpA dimer) a CG self-assembly simulation of the protein/DPC micelle was performed and compared with atomistic simulations of both a pre-formed micelle and of micelle self-assembly. Similarly, for each protein a CG simulation of a self-assembled protein/bilayer was compared with an atomistic simulation of the corresponding protein pre-inserted in a lipid bilayer. (Atomistic simulation of self-assembly of a protein/bilayer system remains challenging 41 and so has not been used in these comparisons). Multiple simulations were run for the self-assembled GpA/bilayer-CG system to provide better sampling of the underlying process. A simulation of an ‘extended’ GpA/bilayer-CG system, corresponding to the 40 residues in the 1AFO NMR structure of GpA, was also run to examine the effects of extending the GpA monomer beyond the α-helical transmembrane domain.
Table 1. Summary of Simulations.
| Simulation | AT or CGa | Components | Total number of atoms/particles | Δt (fs) | Duration (ns) | CPU node hour/ns |
|---|---|---|---|---|---|---|
| OmpA/micelle pre-formed-AT | AT | OmpA + 80 DPC micelle | 61,000 | 2 | 25 | 180 |
| OmpA/micelle-AT | AT | OmpA + 80 DPCs | 92,000 | 5 | 100 | 86 |
| OmpA/micelle-CG | CG | OmpA + 80 DPCs | 8,500 | 40 | 300 | 0.25 |
| OmpA/bilayer-AT | AT | OmpA + 111 DMPC bilayer | 22,000 | 2 | 25 | 56 |
| OmpA/bilayer-CG | CG | OmpA + 256 DPPCs | 6,400 | 40 | 200 | 0.2 |
| GpA/micelle preformed-AT | AT | GpA dimer + 60 DPC micelle | 47,000 | 2 | 50 | 130 |
| GpA/micelle-AT | AT | GpA dimer + 60 DPCs | 45,000 | 2 | 100 | 99 |
| GpA/micelle-CG | CG | GpA dimer + 60 DPCs | 3,800 | 40 | 200 | 0.11 |
| GpA/bilayer-AT | AT | GpA dimer + 115 DMPC bilayer | 17,000 | 2 | 50 | 39 |
| GpA/bilayer-CG | CG | GpA helices + 256 DPPCs | 6,300 | 40 | 700 to 5000b | 0.23 |
| Extended GpA/ bilayer-CG | CG | 40 residue GpA helices + 576 DPPCs | 22,000 | 40 | 1300c | 0.47 |
AT = atomistic; CG = coarse-grained;
Four simulations were run (with different random seeds), one for 1000 ns, a further two for 700 ns, and one for 5000 ns.
Three 1300 ns simulations (with different random seeds) were run.
Self-Assembly of Protein/Detergent Micelles
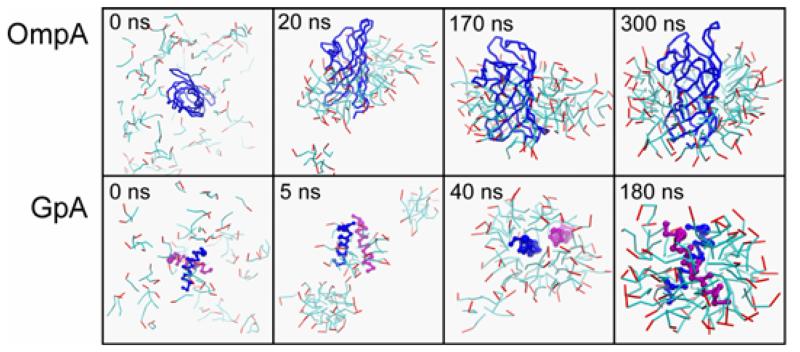
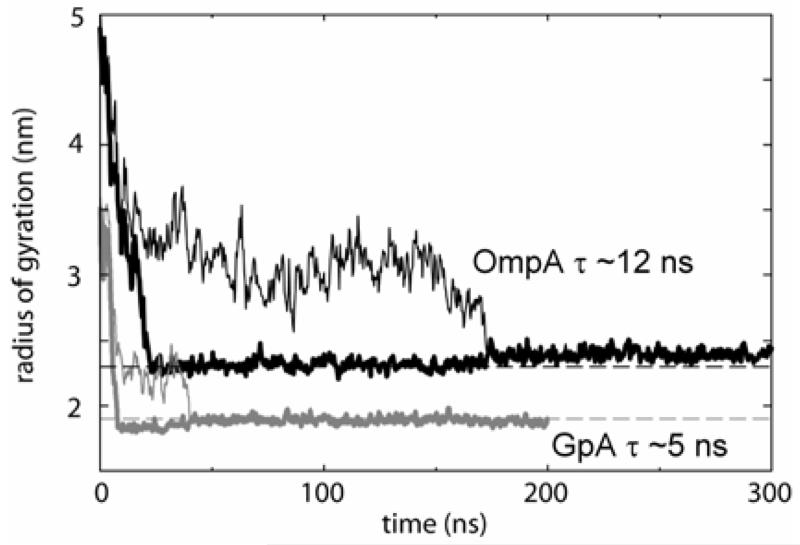
To evaluate the CG model we have simulated self-assembly of protein/detergent micelles, enabling comparison with atomistic simulations 21. Key steps in the formation of micelles observed in atomistic simulations are reproduced in the CG simulations of both OmpA/DPC and GpA/DPC (Fig. 2). Within a few nanoseconds formation of small (10-15 molecules) pure detergent micelles and initial protein-detergent interactions occur, driven by the tendency to bury hydrophobic surfaces. Subsequently, these small detergent micelles fuse and associate with the protein surface. Thus, after ~5 to ~20 ns (for GpA and OmpA respectively), the last independent pure detergent micelle fuses with the main protein-detergent complex (PDC), yielding a stable PDC attached to a separate pure detergent “globule”. The geometry of the main PDC quickly equilibrates, as indicated by the time course of its radius of gyration (Rg) (Fig. 3). The CG and the atomistic Rg values are very similar, and the overall shape, protein and detergent solvent accessible (SAS) areas, and system radial densities are also comparable between the two classes of simulation. The kinetics of micelle formation are about twice as fast in the CG compared to the atomistic simulation.
Figure 2.
Self-assembly of protein/detergent (DPC) micelles. The upper row shows snapshots from a simulation of OmpA/DPC; the lower row shows snapshots from a simulation of GpA/DPC. In each case DPC is in ‘bonds’ format with the hydrophobic tail in cyan and the polar head in red. The protein is shown as a blue Cα trace (OmpA) or blue and purple Cα traces for the two GpA monomers.
Figure 3.
Detergent radius of gyration for OmpA (black lines) and GpA (grey lines) self-assembly into protein/detergent micelles. The thin lines correspond to all detergent molecules, whereas the thick lines correspond to the main micelle (i.e. the detergent molecules in the ‘globule’ are excluded). The dashed lines correspond to the radii of gyration of equivalent micelles from atomistic simulations 21. The kinetics of formation of the main micelle have been characterised by measuring the exponential decay in radius of gyration, yielding time constants of ~5 ns for GpA and ~12 ns for OmpA. These are similar to the values from corresponding atomistic simulations.
Atomistic simulations were limited to ~100 ns by available computational power, and thus failed to fully capture later stages in the self-assembly process. In the CG simulations the “globule” eventually fuses with the main PDC, at ~170 ns and ~40 ns for OmpA and GpA respectively. As anticipated, the time of fusion exhibits a degree of stochasticity. For example in three OmpA simulations, the time of fusion varied between ~50 and ~170 ns. Encouragingly, the final radii of gyration, shape (measured as particle eccentricity), and radial densities of system components for the PDCs were identical to within ~5-10 % of pre-constructed atomistic PDCs containing the same number of detergent molecules 21,40.
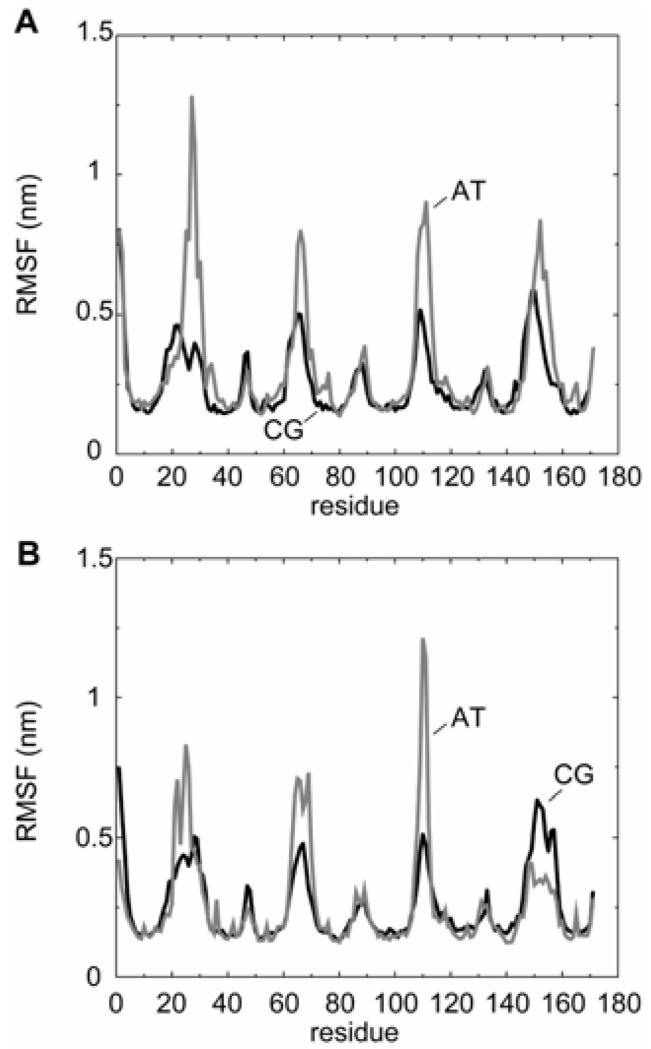
It is also informative to compare the dynamics of the protein in the CG and atomistic simulations. Overall, the CG model reproduces the dynamics of atomistic protein simulations over different timescales (from 10 to 100 ns), with root-mean square fluctuations (RMSFs) of the Cα atoms of regions of defined secondary structure ~0.2-0.4 nm. Furthermore, if one compares the profiles of the RMSF vs. residue number for OmpA/micelle simulations at the atomistic 40 and CG levels, there is good agreement (see Fig. 4A). Both simulated profiles in turn agree well with the corresponding profile of crystallographic B-values 12. We may therefore conclude that the CG protein/detergent simulations reproduce the atomistic simulations with an acceptable accuracy, whilst greatly extending the accessible simulation times.
Figure 4.
Root mean square fluctuation (RMSF) for Cα atoms vs. residue number for OmpA simulations. A OmpA/micelle, comparing AT = atomistic (pre-formed) (grey line) and CG = coarse-grained (black line) simulations. B OmpA/bilayer, comparing AT = atomistic (grey line) and CG = coarse-grained (black line) simulations. Note that in both cases the atomistic RMSFs have been multiplied by a factor of 3 to normalise for the increased sampling in the longer CG simulations. This was based on comparison of the mean square fluctuations vs. sample time 42 for the uncorrected atomistic simulations and the coarse-grained simulations.
OmpA Insertion into a Lipid Bilayer
Given the good agreement of atomistic and CG simulations of protein/detergent micelles, we next simulated the more complex (and computationally time-consuming) process of self-assembly of lipid (dipalmitoyl phosphatidycholine DPPC) bilayers with OmpA. At the outset of the simulation, the protein was surrounded with 256 randomly-positioned lipids, along with ~3000 water particles (the equivalent of ~12,000 water molecules). During the simulation we observed an initial (within <2 ns) assembly of lipids into a continuous lamellar phase. In both the protein/lipid simulation, and in a control simulation containing lipid and water only, the continuous lamellar lipid transformed into a bilayer-like structure over the next 5-10 ns. These initial bilayers included an elongated lipid “stalk” which bridges between the bilayer and its periodic image. This reproduces similar intermediate structures in atomistic 43 and CG 30 simulations of self-assembly of pure lipid bilayers. In each case, the lipids eventually reoriented to form a defect-free bilayer, as a result of a gradual process of diffusion of lipids from stalk to bilayer. The breakdown of the stalk was rate-limiting in bilayer formation, taking ~50-100 ns in our control lipid simulations. However, the process was accelerated in the presence of OmpA taking only ~10 ns. The protein molecule appeared to provide a nucleation site for lipid-protein interactions that facilitated reorientation lipids within the stalks. This is of some biological interest in relation to stalks as an intermediate stage in membrane fusion and budding events 25,44.
In the OmpA/lipid CG simulation, the β-barrel is surrounded by lipid after a few nanoseconds (Fig. 5). The barrel inserts within the (defect-containing) bilayer, tilted at an angle of ~45° to the bilayer normal. Over ~15 ns, the barrel gradually realigns so that its axis becomes approximately parallel to the bilayer normal, whilst its extracellular loops interact with the stalk lipids. Once the stalk has disappeared, the bilayer equilibrates within just ~5 ns and subsequently is stable beyond ~200 ns. The resultant system has very similar properties to an equivalent 25 ns atomistic simulation of OmpA in a pre-formed bilayer. Thus, the lipid-buried protein SAS and profiles of component densities along the bilayer axis are the same for the atomistic and CG simulations to within 10 %. The lipid-protein interactions in the CG and atomistic simulations are comparable, with the aromatic bands of Tyr and Trp and the Lys and Arg residues preferentially contacting the glycerol backbone and lipid headgroup domains respectively 36. Encouragingly, the barrel tilts with respect to the bilayer normal by ~5-10° on a nanosecond timescale, as reported in previous atomistic simulations 45. From the protein perspective, the RMSF vs. residue profiles are very similar for the atomistic and CG simulations (Fig. 4B). Thus, it appears that CG simulations may be used successfully to insert a (folded) outer membrane protein into a lipid bilayer.
Figure 5.
Self-assembly bilayer and insertion of an OmpA molecule. The lipid (equivalent to DPPC) is shown in ‘bonds’ format with the hydrophobic tails in cyan, the glycerol backbone in green, and the polar head in red. The Cα trace of the OmpA molecule is in blue. Water particles are omitted for clarity. Snapshots from a simulation of duration 200 ns are shown, at t = 0, 2, 8 and 12 ns.
Glycophorin A Insertion and Self-Assembly
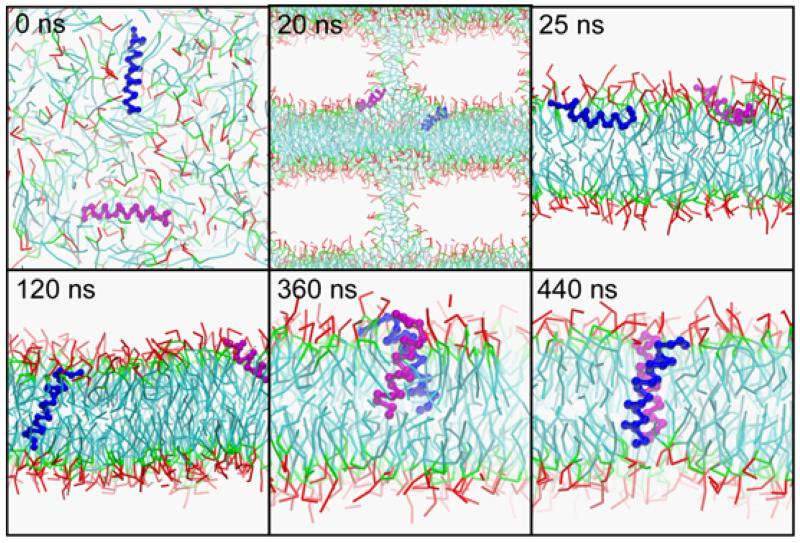
The interactions of the two TM helices in the GpA dimer has been extensively investigated experimentally 46, and to a lesser extent computationally 19,47, as a paradigm for helix-helix interactions in membrane protein folding. In order to investigate the self-assembly of GpA in a bilayer, the two TM helices were initially separated by ~4 nm and placed perpendicular to one another in a box containing randomly placed lipid molecules (Fig. 6). Whilst OmpA integrates rapidly into a stable bilayer, for GpA the situation is more complex. The GpA TM domain includes four polar residues: Thr74, Thr87, Ser92, and Tyr93. At ~20 ns the two GpA α-helices are at the interface between the lipid stalk and pseudo-bilayer, both orientated so that their polar sidechain particles interact with lipid headgroups and solvent. Once a stable bilayer has formed (~25 ns) the helices lie at the surface of the bilayer, perpendicular to the membrane normal. Whilst in this orientation, the helices are oriented such that their polar residues can interact with the glycerol and phosphate particles whilst their hydrophobic residues contact the lipid tails. In this, and in the three repeat simulations, the helices remain for some time (~50-1000 ns) at the membrane surface, indicating a significant barrier to bilayer insertion.
Figure 6.
Self-assembly of a GpA helix dimer in a lipid bilayer. The lipid is shown in ‘bonds’ format with the hydrophobic tails in cyan, the glycerol backbone in green, and the polar head in red. The two GpA monomers are shown as a blue and purple Cα traces. The helices do not appear to fully span the bilayer at 440 ns as a result of the simplified backbone representation. However, the CG potential results in a rather large particle diameter of 4.7 nm, as indicated in Fig. 1, and hence the interfacial bilayer region and the helical termini do actually overlap (see Fig. 10).
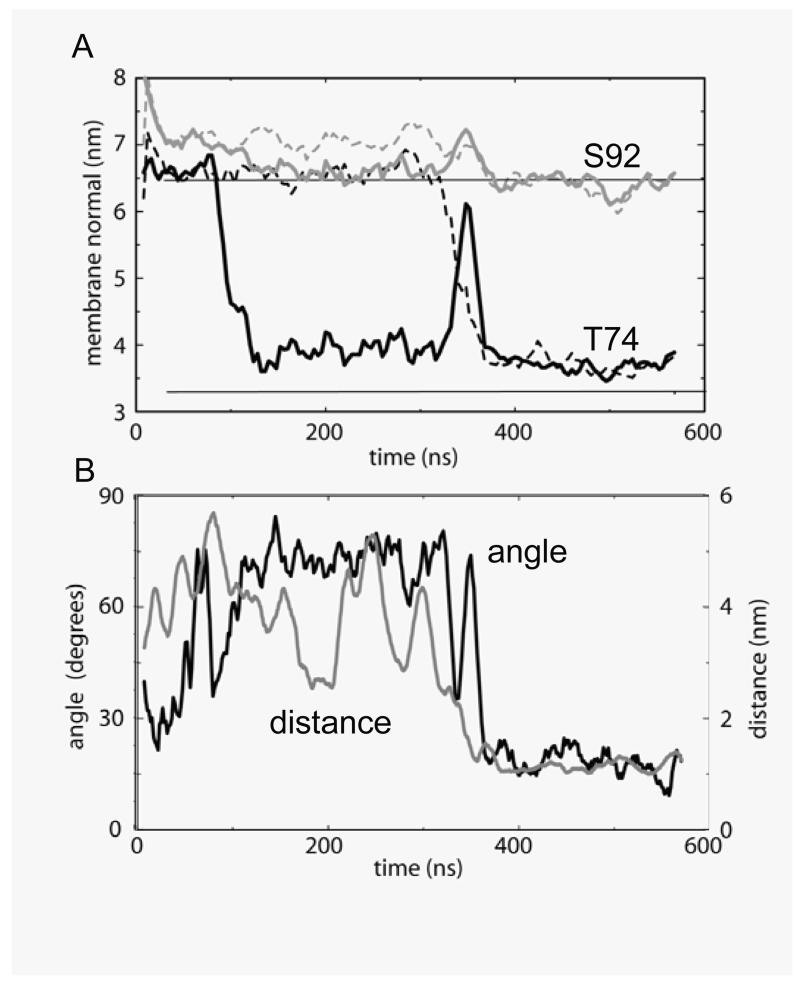
In the simulation in Fig. 6, at ~95 ns a GpA monomer begins to insert into the bilayer. Small undulations at the bilayer interface seem to support this, with the glycerol backbones of a few lipids on both leaflets cooperatively chaperoning first Thr74, then Thr87, and finally Ser92 and Tyr93 into the membrane (Fig. 7A). Insertion is complete by ~120 ns. This (and the repeat simulations) suggest that the GpA helix inserts via its N-terminus first (there being only one polar residue at this end, whilst there are three towards the C-terminus). This helix subsequently oscillates around ~5-15° with respect to the bilayer normal (data not shown), whilst the other helix continues to lie parallel to the bilayer/water interface. Eventually, at ~320 ns, the two monomers approach sufficiently closely to interact via their polar moieties. This temporarily results in partial de-insertion of the first GpA helix from the bilayer. However, this results in local bilayer undulations which enable the previously interfacial GpA monomer to insert into the bilayer. The first helix re-inserts at ~360 ns (Fig. 7A). The proximity of the two monomers in the membrane-embedded state enables the helices to dimerize (Fig. 7B). In particular, this seems to result in the stabilisation of the Thr87 sidechains by mutual interaction between the two monomers (cf. 47). This releases the need for Thr87 to interact with the glycerol backbone, thereby enabling the helices, including their interfacial residues, to move into a slightly deeper position in the bilayer. This inserted dimeric configuration reaches equilibrium at ~440 ns and appears to be stable until ~900 ns, at which time helix dissociation occurred.
Figure 7.
Time course of GpA TM helix dimer assembly. A Trajectories of the sidechain particles for Thr74 (black lines) and Ser92 (grey lines) along the bilayer normal axis. The solid lines correspond to one GpA monomer, and the broken lines to the other monomer. The equilibrium locations of the glycerol backbone of upper and lower membrane leaflets (once the bilayer has formed, i.e. after ~25 ns) are shown as horizontal black lines. Thus the centre of the bilayer is at ~4.8 nm. B Crossing angle of helices (black line; left hand axis) and the inter-helical separation distance (grey line, right hand axis) as a function of time. The inter-helical distance is calculated as that between the centres of mass of all CG particles in each helix. The corresponding crossing angles and inter-helical distances (all atoms centres of mass) in the corresponding NMR structures are 41° and ~0.9 nm 9, and 35° and ~0.9 nm 10.
Following dimerization of the GpA helices during the CG simulations, their overall packing compares favourably with that in the experimental structures, with ~25% of the protein SAS buried at the dimerization interface (cf. ~20% in the NMR structures and in atomistic simulations). From ~400 ns onwards the tilt angle fluctuations of these helices were noticeably smaller than that of the single helix inserted during ~120-320 ns, with an average value of ~10°. This can be compared with estimates of ~17° measured using polarized Fourier transform infrared spectroscopy of GpA in membranes 48. The crossing angle between the two helices is an important property of the GpA dimer structure. In our CG simulations, this value oscillates around ~20° (Fig. 6B). In comparison, the crossing angle in the NMR structures is ~35° in the bilayer and ~41° in the micelle. This lower crossing angle in the simulation is probably a result of the lower “resolution” of the CG method, preventing exact reproduction of ridges-into-grooves interfacial packing. Additionally, it may represent an inherent flexibility in the packing of the two helices, as suggested by atomistic simulations of GpA in a DMPC bilayer in which the angle varied between ~25 and ~45° (Cuthbertson and Sansom, unpublished results).
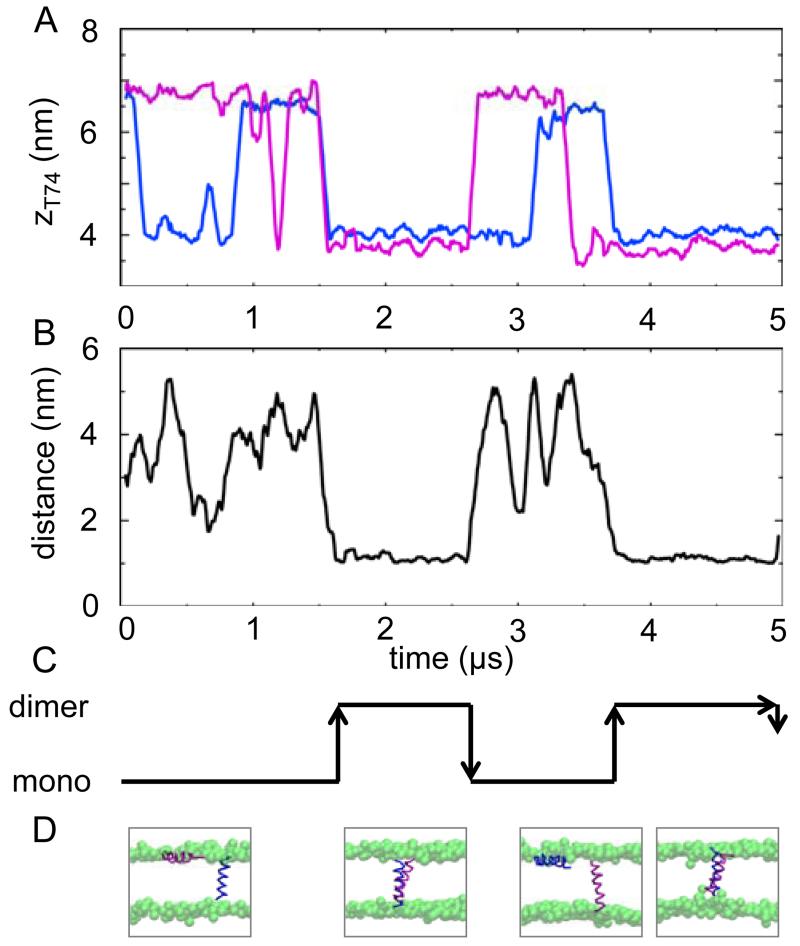
From the initial simulation (duration 1000 ns) it appeared that a monomer/dimer equilibrium may be observed. Thus two (shorter) repeat simulations were run, each of duration 700 ns. Dimerization was not observed in either of these, suggesting an equilibrium constant for the monomer ↔ dimer process of Kdimer ≈ 0.3. To explore this in more detail, a further repeat simulation of 5 μs was performed (see Fig. 8). In this case, a dynamic equilibrium was observed within the simulation. Thus, initial dimerization did not occur until 1.5 μs. However, the dimer then remained stable for over 1 μs before dissociation. Moreover, at 3.7 μs the helices again formed a stable dimer, for the remainder of the simulation. More detailed examination of the 5 μs simulation suggested that: (i) a helix is able to independently insert and de-insert on its own; (ii) a dimer can form either from a state where both helices are interfacial, or from a state where one helix is already inserted; and (iii) a dimer may dissociate when one of the helices switches to an interfacial location. From this simulation, again Kdimer ≤ 0.5, consistent with the earlier estimate.
Figure 8.
Time course of the long (5 μs) GpA TM helix dimer self-assembly simulation. A Trajectories along the bilayer normal (z) of the sidechain particles for Thr74 of the two helices (colours correspond to those in D). The centre of the bilayer is at z ~5.5 nm. B Inter-helical separation distance. C Schematic of the helix monomer/helix dimer equilibrium, derived from the data in A,B. D Snapshots of the system, showing the two helices (using the same colour convention as in A) as Cα traces, with the bilayers represented via spheres for the lipid headgroups.
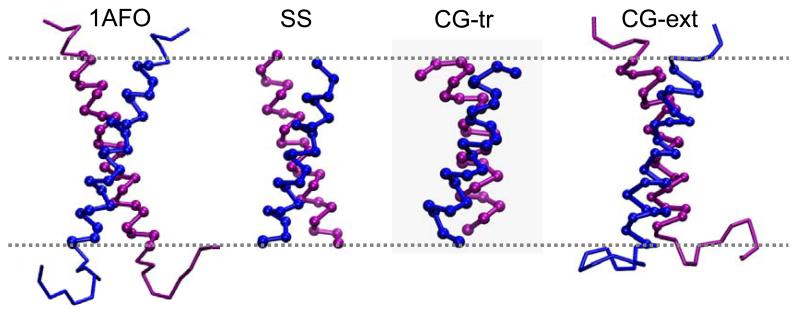
Although the complete GpA protein is composed of 131 amino acids, it only spans the membrane once and the TM sequence is sufficient for helix formation and insertion, as well as dimerization 46. The NMR structure of GpA in a detergent micelle is of a peptide that includes loop regions flanking the TM helix, composed of an additional 11 amino-terminal residues and 6 carboxy-terminal residues. It was thus of interest to examine whether these extramembraneous regions would affect dimerization. Bilayer self-assembly simulations were therefore also run starting from a system composed of the two extended 40 residue peptides, separated from one another and surrounded by randomly placed lipids. Three simulations of duration 1.3 μs were performed (Table 1). In two of these simulations, dimerization occurred, in one for the periods 0.1 - 0.4 μs and 1.0 - 1.3 μs, and in the second simulation for 0.5 - 1.0 μs. Thus, for these three simulations one may estimate Kdimer ≈ 0.3, as for the previous simulation with just the 23-mer TM helices. Whilst the loops regions flanking the TM helix were flexible, as is the case in the NMR structure, and primarily interacted with the glycerol backbone and polar headgroups, the TM region of the resultant GpA dimer closely resembled that observed in the simulations of just the TM helix dimer (Fig. 9). Hence, for both the TM helix and for the extended GpA helix dimers, the helices interacted along the same face, leading to a similar proportion of the helices being buried upon dimerization, whilst the crossing angle of the helices was ~20° in both simulations.
Figure 9.
Structures of the GpA TM helix dimer showing (from left to right): the NMR structure in a micelle (1AF0), in a bilayer (SS), and from the CG simulation of the truncated helices (CG-tr), and from the CG simulation of the extended helices (CG-ext). In each case, the C-termini are at the top of the diagram.
Comparison with NMR Structures
The structures of the GpA dimers after the self-assembly process have equilibrated are in good agreement with the experimental NMR structures (Fig. 9). Detailed examination, for both the TM helix simulation and the extended GpA sequence simulation, suggests that the helix/helix interface in the CG simulated GpA dimers are in slightly better agreement with the lipid bilayer NMR structure 10 than the structure determined in a detergent micelle 9. In particular, whilst both NMR structures showed inter-helical interactions between Val80-Gly79 and between Val84-Gly83, only the bilayer structure suggested direct Gly79-Gly79 and Glu83-Gly83 contacts between helices, because of a rotation of the interacting helical faces by ~25°. Thr87 hydrogen bonds across the dimer interface in the bilayer NMR structure. In the CG simulations we observe van der Waal’s ridges-into-groove packing as a result of inter-helical Gly-Gly contacts, and Thr87 makes primarily inter-helical interactions. The NMR structure suggested that the hydroxyl of Thr87 H-bonds to the backbone carbonyl of Val84 in the opposing helix 10,48. Our simulations also suggest that interaction between both the backbone and the opposing Thr may occur. The polarity of Thr87 is essential in the conformation and stability of GpA, as shown in mutagenesis studies11,49.
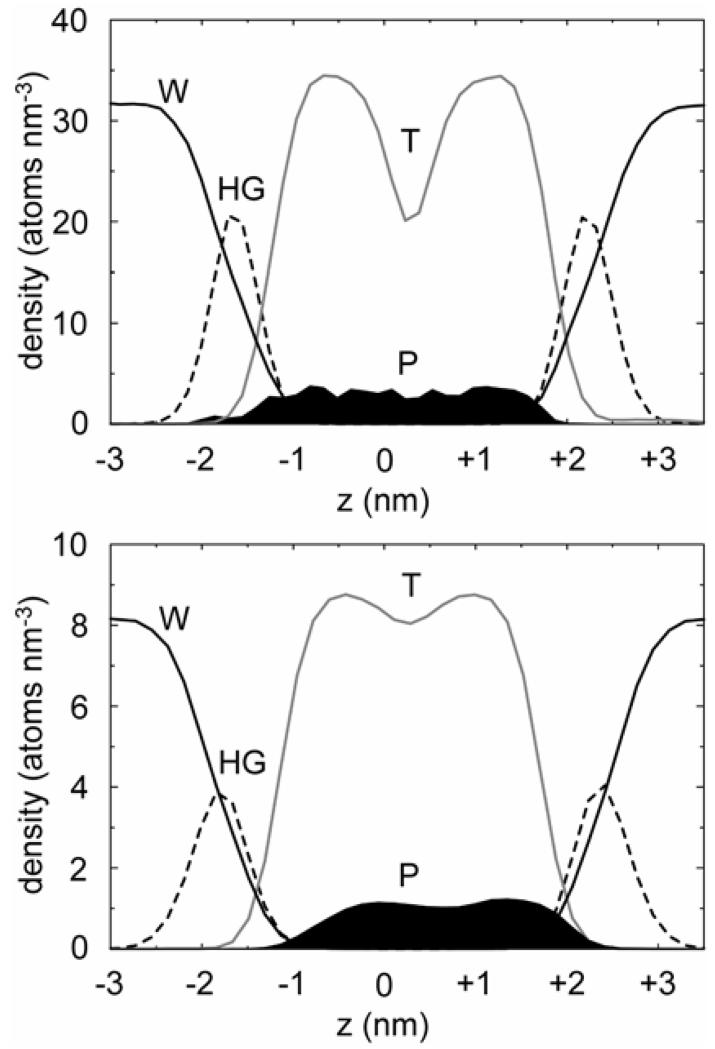
It is also informative to compare the location of the GpA TM helix dimer relative to the lipid bilayer in atomistic and CG simulations (Fig. 10). It can be seen that in both cases the TM helix dimer spans the hydrophobic core of the membrane, indicating a similar equilibrium location of the protein in the two simulations. It is evident that in the CG simulation the protein is slightly displaced relative to the centre of the bilayer compared with the atomistic simulation, which may reflect the effect of coarse-graining on the exact nature of the interactions of the protein with the bilayer core and headgroups. Nevertheless, a similar pattern of interactions was observed for the atomistic and CG simulations between different lipid moieties and GpA aromatic residues lying around the intefacial region of the bilayer. Thus, in both simulations, ~80 % of the contacts of the sidechain of Phe78 (towards the amino-terminus of the TM helix) were with the hydrophobic tails of the lipids, and ~20 % of the contacts were with the glycerol backbone. Moreover, the Tyr93 sidechain (at the carboxy-terminus of the helix) contacted both the tail and glycerol backbone domains with an approximately equal ratio, with a small number of residual contacts (~10-20 %) being made with the polar headgroup region.
Figure 10.
Atom number density profiles along the bilayer normal for the A GpA/bilayer-AT and B GpA/bilayer-CG simulations. In each case the density profiles for water (W, solid black line), lipid headgroups (HG, broken black line), lipid tails (T, grey line), and protein (P, black filled region) are shown. In B the protein number density was multiplied by 3 to correct for the difference in cross-sectional area of the CG and AT simulation boxes.
Conclusions
In summary, CG simulations of membrane proteins demonstrate that is possible to reproduce the structural and dynamic aspects of detergent-protein and lipid-protein interactions. CG simulations are about two orders of magnitude faster than the corresponding atomistic simulations. The comparison with atomistic simulations is important in providing validation of the extension of CG methodologies to complex membrane proteins, i.e. α-helix bundles and β-barrels. Thus CG simulations provide an alternative to more computationally demanding approaches such as atomistic simulations combined with replica exchange 41. It will also be valuable to compare the results of CG simulations with those which employ an atomistic model of the protein combined with an implicit generalized Born model for the membrane 50-52.
From a mechanistic perspective, we have shown spontaneous self-assembly of membrane protein/lipid bilayer systems. For the model α-helical membrane protein GpA we observe interfacial partitioning of helices, followed by their spontaneous insertion into the bilayer and subsequent dimerization. This is a direct simulation of the two-state model of membrane protein (re)folding. As such, it provides strong support for the validity of this model. This is in contrast with the results of recent replica exchange simulations 41 for the synthetic TM helix WALP16, which suggest the peptide may insert into a bilayer in an unfolded form which subsequently forms a helix (although of course in our simulations the glycophorin TM domain is constrained to be α-helical). Stabilization of the α-helical conformation at an interfacial location followed by insertion has been suggested on the basis of simulations using a generalized Born model to represent the membrane 52. Our simulations also suggest that dimerization may be a dynamic equilibrium process. It would therefore seem that simulations on a wider range of membrane protein systems may be required to establish the robustness of conclusions concerning mechanisms of insertion and folding. However, results to date are encouraging in suggesting that simulations are able to provide a mechanistic description of the interactions of α-helices with lipid bilayers. For example, the voltage-sensing S4 helix of Kv channels 53 is able to insert biosynthetically into a membrane 54, despite the presence of multiple arginine sidechains within the helix. Preliminary CG simulations (Bond and Sansom, unpublished data) provide a direct mechanistic insight into this process.
Acknowledgements
Our thanks to members of the Sansom laboratory, especially Jonathan Cuthbertson, for helpful discussions. This work was supported by grants from BBSRC (MPSI) and the Wellcome Trust.
References
- (1).Wallin E, von Heijne G. Prot. Sci. 1998;7:1029–1038. doi: 10.1002/pro.5560070420. [DOI] [PMC free article] [PubMed] [Google Scholar]
- (2).White SH. Prot. Sci. 2004;13:1948–1949. doi: 10.1110/ps.04712004. [DOI] [PMC free article] [PubMed] [Google Scholar]
- (3).Lear JD, Stouffer AL, Gratkowski H, Nanda V, DeGrado WF. Biophysical Journal. 2004;87:3421–3429. doi: 10.1529/biophysj.103.032839. [DOI] [PMC free article] [PubMed] [Google Scholar]
- (4).Senes A, Engel DE, DeGrado WF. Current Opinion in Structural Biology. 2004;14:465–479. doi: 10.1016/j.sbi.2004.07.007. [DOI] [PubMed] [Google Scholar]
- (5).Lee AG. Biochim. Biophys. Acta. 2003;1612:1–40. doi: 10.1016/s0005-2736(03)00056-7. [DOI] [PubMed] [Google Scholar]
- (6).Lee AG. Biochim. Biophys. Acta. 2004;1666:62–87. doi: 10.1016/j.bbamem.2004.05.012. [DOI] [PubMed] [Google Scholar]
- (7).Popot JL, Engelman DM. Biochem. 1990;29:4031–4037. doi: 10.1021/bi00469a001. [DOI] [PubMed] [Google Scholar]
- (8).Tamm LK, Hong H, Liang B. Biochim. Biophys. Acta. 2004;1666:250–263. doi: 10.1016/j.bbamem.2004.06.011. [DOI] [PubMed] [Google Scholar]
- (9).MacKenzie KR, Prestegard JH, Engelman DM. Science. 1997;276:131–133. doi: 10.1126/science.276.5309.131. [DOI] [PubMed] [Google Scholar]
- (10).Smith SO, Song D, Shekar S, Groesbeek M, Ziliox M, Aimoto S. Biochem. 2001;40:6553–6558. doi: 10.1021/bi010357v. [DOI] [PubMed] [Google Scholar]
- (11).Russ WP, Engelman DM. J. Mol. Biol. 2000;296:911–919. doi: 10.1006/jmbi.1999.3489. [DOI] [PubMed] [Google Scholar]
- (12).Pautsch A, Schulz GE. J. Mol. Biol. 2000;298:273–282. doi: 10.1006/jmbi.2000.3671. [DOI] [PubMed] [Google Scholar]
- (13).Arora A, Abildgaard F, Bushweller JH, Tamm LK. Nature Struct. Biol. 2001;8:334–338. doi: 10.1038/86214. [DOI] [PubMed] [Google Scholar]
- (14).Fyfe PK, McAuley KE, Roszak AW, Isaacs NW, Codgell RJ, Jones MR. Trends Biochem. Sci. 2001;26:106–112. doi: 10.1016/s0968-0004(00)01746-1. [DOI] [PubMed] [Google Scholar]
- (15).Hilty C, Wider G, Fernandez C, Wuthrich K. ChemBioChem. 2004;5:467–473. doi: 10.1002/cbic.200300815. [DOI] [PubMed] [Google Scholar]
- (16).Palsdottir H, Hunte C. Biochim. Biophys. Acta. 2004;1666:2–18. doi: 10.1016/j.bbamem.2004.06.012. [DOI] [PubMed] [Google Scholar]
- (17).Marsh D, Pali T. Biochim. Biophys. Acta. 2004;1666:118–141. doi: 10.1016/j.bbamem.2004.08.006. [DOI] [PubMed] [Google Scholar]
- (18).Ash WL, Zlomislic MR, Oloo EO, Tieleman DP. Biochim. Biophys. Acta. 2004;1666:158–189. doi: 10.1016/j.bbamem.2004.04.012. [DOI] [PubMed] [Google Scholar]
- (19).Petrache HI, Grossfield A, MacKenzie KR, Engelman DM, Woolf TB. J. Mol. Biol. 2000;302:727–746. doi: 10.1006/jmbi.2000.4072. [DOI] [PubMed] [Google Scholar]
- (20).Feller SE, Gawrisch K, Woolf TB. J. Am. Chem. Soc. 2003;125:4434–4435. doi: 10.1021/ja0345874. [DOI] [PubMed] [Google Scholar]
- (21).Bond PJ, Cuthbertson JM, Deol SD, Sansom MSP. J. Am. Chem. Soc. 2004;126:15948–15949. doi: 10.1021/ja044819e. [DOI] [PubMed] [Google Scholar]
- (22).Bockmann RA, Caflisch A. Biophys. J. 2005;88:3191–3204. doi: 10.1529/biophysj.105.060426. [DOI] [PMC free article] [PubMed] [Google Scholar]
- (23).Braun R, Engelman DM, Schulten K. Biophys. J. 2004;87:754–763. doi: 10.1529/biophysj.104.040279. [DOI] [PMC free article] [PubMed] [Google Scholar]
- (24).Booth PJ, Curran AR. Curr. Opin. Struct. Biol. 1999;9:115–121. doi: 10.1016/s0959-440x(99)80015-3. [DOI] [PubMed] [Google Scholar]
- (25).Brünger AT. Ann. Rev. Biophys. Biomol. Struct. 2001;30:157–171. doi: 10.1146/annurev.biophys.30.1.157. [DOI] [PubMed] [Google Scholar]
- (26).Nielsen SO, Lopez CF, Srinivas G, Klein ML. J. Phys.: Condens. Matt. 2004;16:R481–R512. [Google Scholar]
- (27).Smit B, Hilbers AJ, Esselink K, Rupert LAM, Van Os NM, Schlijper G. Nature. 1990;348:624–625. [Google Scholar]
- (28).Shelley JC, Shelley MY, Reeder RC, Bandyopadhyay S, Klein ML. J. Phys. Chem. B. 2001;105:4464–4470. [Google Scholar]
- (29).Whitehead L, Edge CM, Essex JW. J. Comput. Chem. 2001;22:1622–1633. [Google Scholar]
- (30).Marrink SJ, de Vries AH, Mark AE. J. Phys. Chem. B. 2004;108:750–760. [Google Scholar]
- (31).Tozzini V. Curr. Opin. Struct. Biol. 2005;15:144–150. doi: 10.1016/j.sbi.2005.02.005. [DOI] [PubMed] [Google Scholar]
- (32).Tepper HL, Voth GA. J. Chem. Phys. 2005;122:124906–124901. doi: 10.1063/1.1869417. [DOI] [PubMed] [Google Scholar]
- (33).Venturoli M, Smit B, Sperotto MM. Biophys. J. 2005;88:1778–1798. doi: 10.1529/biophysj.104.050849. [DOI] [PMC free article] [PubMed] [Google Scholar]
- (34).Nielsen SO, Lopez CF, Ivanov I, Moore PB, Shelley JC, Klein ML. Biophys. J. 2004;87:2107–2115. doi: 10.1529/biophysj.104.040311. [DOI] [PMC free article] [PubMed] [Google Scholar]
- (35).Lopez CF, Nielsen SO, Moore PB, Klein ML. Proc. Natl. Acad. Sci. USA. 2004;101:4431–4434. doi: 10.1073/pnas.0400352101. [DOI] [PMC free article] [PubMed] [Google Scholar]
- (36).Deol SS, Bond PJ, Domene C, Sansom MSP. Biophys. J. 2004;87:3737–3749. doi: 10.1529/biophysj.104.048397. [DOI] [PMC free article] [PubMed] [Google Scholar]
- (37).Killian JA, von Heijne G. Trends Biochem. Sci. 2000;25:429–434. doi: 10.1016/s0968-0004(00)01626-1. [DOI] [PubMed] [Google Scholar]
- (38).Berendsen HJC, Postma JPM, van Gunsteren WF, DiNola A, Haak JR. J. Chem. Phys. 1984;81:3684–3690. [Google Scholar]
- (39).Lindahl E, Hess B, van der Spoel D. J. Molec. Model. 2001;7:306–317. [Google Scholar]
- (40).Bond PJ, Sansom MSP. J. Mol. Biol. 2003;329:1035–1053. doi: 10.1016/s0022-2836(03)00408-x. [DOI] [PubMed] [Google Scholar]
- (41).Nymeyer H, Woolf TB, Garcia AE. Proteins: Struc. Func. Bioinf. 2005;59:783–790. doi: 10.1002/prot.20460. [DOI] [PubMed] [Google Scholar]
- (42).Faraldo-Gómez JD, Forrest LR, Baaden M, Bond PJ, Domene C, Patargias G, Cuthbertson J, Sansom MSP. Proteins: Struct. Func. Bioinf. 2004;57:783–791. doi: 10.1002/prot.20257. [DOI] [PubMed] [Google Scholar]
- (43).Marrink SJ, Lindahl E, Edholm O, Mark AE. J. Am. Chem. Soc. 2001;123:8638–8639. doi: 10.1021/ja0159618. [DOI] [PubMed] [Google Scholar]
- (44).Markin VS, Albanesi JP. Biophys. J. 2002;82:693–712. doi: 10.1016/S0006-3495(02)75432-5. [DOI] [PMC free article] [PubMed] [Google Scholar]
- (45).Bond PJ, Faraldo-Gómez JD, Sansom MSP. Biophys. J. 2002;83:763–775. doi: 10.1016/S0006-3495(02)75207-7. [DOI] [PMC free article] [PubMed] [Google Scholar]
- (46).Popot JL, Engelman DM. Ann. Rev. Biochem. 2000;69:881–922. doi: 10.1146/annurev.biochem.69.1.881. [DOI] [PubMed] [Google Scholar]
- (47).Hénin J, Pohorille A, Chipot C. J. Am. Chem. Soc. 2005;127:8478–8484. doi: 10.1021/ja050581y. [DOI] [PubMed] [Google Scholar]
- (48).Smith SO, Eilers M, Song D, Crocker E, Ying W, Groesbeek M, Metz G, Ziliox M, Aimoto S. Biophys. J. 2002;82:2476–2486. doi: 10.1016/S0006-3495(02)75590-2. [DOI] [PMC free article] [PubMed] [Google Scholar]
- (49).Lemmon MA, Flanagan JM, Treutlein HR, Zhang J, Engelman DM. Biochemistry. 1992;31:12719–12725. doi: 10.1021/bi00166a002. [DOI] [PubMed] [Google Scholar]
- (50).Im W, Feig M, Brooks CL. Biophysical Journal. 2003;85:2900–2918. doi: 10.1016/S0006-3495(03)74712-2. [DOI] [PMC free article] [PubMed] [Google Scholar]
- (51).Im W, Brooks CL. J. Mol. Biol. 2004;337:531–519. doi: 10.1016/j.jmb.2004.01.045. [DOI] [PubMed] [Google Scholar]
- (52).Im W, Brooks CL. Proc. Nat. Acad. Sci. USA. 2005;102:6771–6776. doi: 10.1073/pnas.0408135102. [DOI] [PMC free article] [PubMed] [Google Scholar]
- (53).Long SB, Campbell EB, MacKinnon R. Science. 2005;309:903–908. doi: 10.1126/science.1116270. [DOI] [PubMed] [Google Scholar]
- (54).Hessa T, White SH, von Heijne G. Science. 2005;307:1427. doi: 10.1126/science.1109176. [DOI] [PubMed] [Google Scholar]


