

Abstract
Rationale
Chronic inflammation is a major contributor to the progressive pathology of hypertension and T cell activation is required for the genesis of hypertension. However, the precise role of myeloid cells in this process is unclear.
Objective
To characterize and understand the role of peripheral myeloid cells in the development of hypertension.
Methods and Results
We examined myeloid cells in the periphery of hypertensive mice and found that increased numbers of CD11b+Gr1+ myeloid cells in blood and the spleen is a characteristic of three murine models of experimental hypertension (Ang II, L-NAME, and high salt). These cells express surface markers and transcription factors associated with immaturity and immunosuppression. Also, they produce hydrogen peroxide to suppress T cell activation. These are characteristics of myeloid-derived suppressor cells (MDSCs). Depletion of hypertensive MDSCs increased blood pressure and renal inflammation. In contrast, adoptive transfer of wild-type MDSCs to hypertensive mice reduced blood pressure, while the transfer of NADPH oxidase 2-deficient MDSCs did not.
Conclusions
The accumulation of MDSCs is a characteristic of experimental models of hypertension. MDSCs limit inflammation and the increase of blood pressure through the production of hydrogen peroxide.
Keywords: Hypertension, inflammation, leukocyte, reactive oxygen species
INTRODUCTION
Hypertension occurs in one-third of Western populations and is an important risk factor for stroke, heart failure and hypertensive glomerulosclerosis. There is substantial debate regarding the relative contribution of the kidney, autonomic nervous system, and vascular injury to the development of hypertension. Recently, several experimental studies have implicated aberrant immune activation and inflammation in the pathogenesis of experimental hypertension.1–3 It has been suggested that cell death associated with sterile inflammation may lead to an adaptive immune response directed against cell associated antigens.4 Indeed, in experimental models, T cells are required for a vigorous blood pressure (BP) increase and full pathologic expression of hypertensive injury.1,5 Thus, it is important to understand the regulation of the immune response and the precise pathologic contribution of inflammation in hypertensive disease.
Myeloid-derived suppressor cells (MDSCs) are a heterogeneous population of immature myeloid cells that regulate the immune system.6 First discovered in murine tumor models, MDSCs are now known to exist in humans and to dramatically increase under various pathologic conditions including graft-versus-host disease, inflammatory bowel disease and infection.7–9 MDSCs share common features as they all express the myeloid markers CD11b and Gr1, and the ability to suppress T cell activation.6 MDSCs are generally considered as one of several means by which the immune system limits inflammation and thus prevents excessive inflammatory injury. Perhaps not surprisingly, both excessive accumulation of MDSCs and the insufficient generation of MDSCs have been associated with pathologic processes.8,10 Studies examining tumor growth have proposed several mechanisms that direct recruitment and accumulation of MDSCs. However, common features linking MDSC generation in different pathologic conditions are still elusive, except that nonresolving inflammation is a hallmark in all of the conditions.
Given the abundant information suggesting that experimental hypertension is associated with chronic immune activation, we examined myeloid cells in hypertension. Here, we report that peripheral CD11b+Gr1+ myeloid cells accumulate in three separate murine models of hypertension (angiotensin (Ang) II, L-NAME (L-NG-Nitroarginine Methyl Ester) and salt-sensitive hypertension). These myeloid cells suppress T cell activity using hydrogen peroxide. Depletion of MDSCs increases BP and renal inflammation, while treatment of hypertensive animals with exogenous MDSCs reduces BP. Thus, our studies show that in experimental models of hypertension, MDSCs act to limit both inflammation and the increase of BP.
METHODS
A detailed Methods section is available in the Supplemental materials.
RESULTS
Hypertension is associated with increased CD11b+Gr1+ cells in the periphery
We first examined the myeloid populations in an Ang II-induced hypertension model. Mice were administered 980 ng/kg/min of Ang II for 4 weeks. Systolic BP increased and by the end of the first week reached a plateau between 140–150 mmHg (Figure 1A). This was associated with a significant increase of circulating CD11b+Gr1+ myeloid cells. By week 4, blood CD11b+Gr1+ cells in hypertensive mice averaged 1.62 k/μl vs 0.78 k/μl in normotensive mice (p<0.01). Further analysis of cell surface markers showed two distinct populations comprising CD11b+Gr1+ cells: Gr1highLy6Clow and Gr1lowLy6Chigh (Online Figure I). These correspond to granulocytic and monocytic MDSCs found in tumor models.11 While both populations increased in hypertension, the Gr1highLy6Clow cells were predominant.
Figure 1. Hypertension is associated with increased CD11b+Gr1+ cells.

A, Systolic BP (line) and blood CD11b+Gr1+ cell numbers (bars) were measured after mice were infused with Ang II. n=10. On right, representative dot plots of CD11b+Gr1+ cells from normotensive mice and mice treated with Ang II for 3 weeks are shown. (B) The percentages of CD11b+Gr1+ cells in the spleens and the number of CD11b+Gr1+ cells in the kidneys of normotensive mice and mice infused with Ang II for 3 weeks. C, Mice were fed with 0.5 mg/ml or 1.5 mg/ml L-NAME in water, their BP and blood CD11b+Gr1+ cell numbers were monitored. D, Mice were pre-treated with L-NAME for 4 weeks followed by 1 week of normal water. They were then fed with a high-salt diet and their systolic BP and blood CD11b+Gr1+ cell numbers were monitored. *P < 0.05; **P < 0.01; ***P < 0.005.
We also examined the myeloid populations in the spleens, kidney and bone marrow (BM) of mice treated with Ang II. At week 3, the percentage of CD11b+Gr1+ cells in the spleens of hypertensive mice increased 2.7-fold compared to normotensive mice (Figure 1B). This was despite the fact that the total number of splenocytes remained constant (115.2 ± 9.0 ×10⁶ for hypertensive mice vs. 118.7 ± 13.6 ×10⁶ in normotensive mice). There were normal percentages of F4/80highCD11blow red pulp macrophages and CD11chigh conventional dendritic cells in the hypertensive spleens (Online Figure IIB). In the kidneys, the number of CD11b+Gr1+ cells increased over 2-fold in hypertensive mice (Figure 1B and Online Figure IIA). In contrast to blood and spleen, BM from hypertensive mice exhibited no increase in the percentage of CD11b+Gr1+ cells (Online Figure IIC). Thus, Ang II-induced hypertension is accompanied with an increase of CD11b+Gr1+ myeloid cells in the periphery without much change in the BM.
Ang II has recently been reported to be a chemotactic factor for monocytes and able to mobilize monocytes from the spleen.12 To exclude the possibility that the accumulated MDSC are specific for Ang II rather than hypertension, we studied two other hypertension models. L-NAME-induced hypertension is mechanistically different from Ang II-induced hypertension in that it is associated with low plasma levels of Ang II. Two cohorts of mice received either 0.5 mg/ml or 1.5 mg/ml L-NAME in drinking water, and their BP and blood CD11b+Gr1+ cell numbers were studied (Figure 1C). The group fed a high dose of L-NAME had a more acute BP elevation and reached peak levels about 10 mmHg higher than that of the low dose group. While both groups showed an increase in the number of blood CD11b+Gr1+ cells, the L-NAME high dose group had a faster rise in cell number than the low dose group, corresponding to their BP levels.
We also studied hypertension induced by a high salt diet.13 In this model, mice were treated with 0.5 mg/ml L-NAME for 4 weeks to induce hypertension and to predispose the animals to salt sensitivity. The L-NAME phase was followed by a 1 week washout period in which both BP and peripheral CD11b+Gr1+ cell numbers fell to normal levels. Beginning on the 6th week, the animals were fed a high salt diet (4% NaCl) for 3 weeks. In response to the salt load, mice developed hypertension (Figure 1D). By the third week of high salt, the rise in BP was associated with more than a 2-fold increase in the number of blood CD11b+Gr1+ cells. Thus, analysis of hypertension models induced by three different agents displayed a similar behavior; we conclude that an increase of CD11b+Gr1+ cells is a general characteristic of hypertension.
The accumulated CD11b+Gr1+ myeloid cells are immunosuppressive
To define the characteristics of the CD11b+Gr1+ cells that accumulate during hypertension, we purified the Gr1highLy6Clow and Gr1lowLy6Chigh subsets and examined their morphology. These cells collected from the spleens of Ang II-induced hypertensive mice have a polymorphonuclear and monocytic morphology similar to their counterparts from naive mice (Online Figure IIIA). We also evaluated the expression levels of surface markers related to the maturational and functional state of myeloid cells (Figure 2). There was no difference between cells from normotensive and hypertensive mice until 2 weeks after the start of Ang II infusion. Splenic CD11b+Gr1+ cells from hypertensive mice lost expression of the maturational markers CD80 and MHC class II (I-Ab), but gradually increased expression of IL-4 receptor α (IL-4Rα) and IFN-γ receptor 1 (IFN-γR1). IL-4Rα is a key component in mediating M2 macrophage differentiation and its expression is associated with MDSCs in tumor models.14 IFN-γR1 has also been characterized as a feature of MDSCs. Signaling through IFN-γR1 induces the expression of iNOS and has been attributed to the development of MDSCs.15 Thus, these data show that with the onset of hypertension, splenic CD11b+Gr1+ cells gradually transition to a relatively immature and immunosuppressive phenotype. Further, CD11b+Gr1+ cells from the blood of hypertensive mice also up-regulate IL-4Rα and down-regulate CD80 (Online Figure IIIB).
Figure 2. Surface phenotype of hypertensive CD11b+Gr1+ cells.

Surface markers expressed by splenic CD11b+Gr1+ cells from normotensive mice and mice treated with Ang II for 1, 2 or 3 weeks. ΔMFI indicates the difference between the absolute mean fluorescent intensity (MFI) of an individual sample and the MFI of the isotype control. *P < 0.05; **P < 0.01; ***P < 0.005.
A key question is whether the CD11b+Gr1+ cells that accumulate in hypertension are immunosuppressive and thus correspond to the MDSCs described in tumor models. To investigate this, we used an immunosuppressive assay in which purified CD11b+Gr1+ cells were co-incubated with splenocytes from OT-I mice loaded with the fluorescent dye CFSE. The transgenic CD8+ OT-I T cells recognize the MHC class I presented ovalbumin peptide SIINFEKL. We tested the effect of CD11b+Gr1+ cells on OT-I T cells activated by their cognate epitope SIINFEKL. Separately, we also tested the effect of CD11b+Gr1+ cells on total T cells activated by antibodies directed against CD3 and CD28. During the 3-day assay, the T cells proliferate, resulting in dilution of the CFSE dye. Immunosupression by the CD11b+Gr1+ cells resulted in less T cell proliferation (Figure 3A). While there was an increase of CD11b+Gr1+ after only 1 week of Ang II stimulation, there was no difference between these cells and equivalent cells from normotensive mice in affecting T cell proliferation. However, irrespective of the means by which the T cells were activated, the hypertensive CD11b+Gr1+ cells present at 2 and 3 weeks effectively prevented T cell proliferation. This timing of suppressive activity corresponded to the appearance of immunosuppressive surface markers on CD11b+Gr1+ cells, which also appeared 2 weeks after initiating Ang II infusion. Thus, it seems that the accumulation of immunosuppressive MDSCs requires a relatively chronic process secondary to a BP increase.
Figure 3. CD11b+Gr1+ cells from hypertensive mice are immunosuppressive.

A, CFSE-labeled splenocytes from OT-I mice were co-cultured with CD11b+Gr1+ cells (1:1) from normotensive mice or mice treated with Ang II for 1, 2 or 3 weeks. T cells in the culture were stimulated with either anti-CD3/anti-CD28 antibodies or SIINFEKL peptide. Three days later, the proliferation profiles (left) and proliferation index (right) of total T cells (CD3+ in the anti-CD3/anti-CD28 treated wells) or CD8+ T cells (in the SIINFEKL treated wells) were obtained. B, CFSE-labeled OT-I CD8+ T cells were i.v. transferred with CD11b+Gr1+ cells derived from either normotensive or hypertensive mice (1:1) to naïve mice followed by i.p. ovalbumin immunization. Two days later, the proliferation profiles of splenic OT-I T cells from the recipients were measured, as well as their surface CD44 expression. *P < 0.05; ***P < 0.005.
To investigate whether the hypertensive MDSCs can suppress antigen-mediated activation of T cells in vivo, we injected i.v. a 1:1 ratio of CFSE-labeled OT-I T cells and CD11b+Gr1+ cells from either normotensive mice or hypertensive mice (3-week Ang II). One day later, we immunized the recipients i.p. with ovalbumin. Finally, the spleens of the recipient mice were harvested 2 days later to analyze the activation status of the OT-I cells (Figure 3B). In fact, the OT-1 T cells co-injected with hypertensive CD11b+Gr1+ cells had a slower proliferation rate and reduced expression of the activation marker CD44 than the OT-1 cells co-injected with CD11b+Gr1+ from normotensive mice. Thus, in this in vivo model, it is hypertensive CD11b+Gr1+ cells that suppress T cell activation, even in a non-hypertensive environment.
Among the transcription factors involved in myeloid lineage commitment, the CCAAT enhancer binding protein (C/EBP) family plays a fundamental role. A differential expression of C/EBP family members has been associated with specific stages in cell fate determination.16 C/EBPα is the key factor in driving myeloid differentiation.17 C/EBPβ is required for emergent granulopoiesis and the formation of MDSCs.18,19 C/EBPδ fosters a macrophage pro-inflammatory phenotype.20 In addition, PU.1 is another fate-determining transcription factor for myeloid cells, especially macrophages, and its recruitment to inflammatory gene enhancers is required for responses to inflammatory stimuli.21,22 We analyzed the expression levels of these transcription factors in splenic CD11b+Gr1+ cells from hypertensive mice 3 wk after the initiation of Ang II (Online Figure IV). Compared to CD11b+Gr1+ cells from normotensive mice, hypertensive CD11b+Gr1+ cells up-regulated C/EBPβ but had diminished expression of C/EBPα, C/EBPδ and PU.1. These changes in transcription factors and surface markers are consistent with our functional analysis indicating that Ang II-induced hypertension is associated with accumulation of relatively immature myeloid cells capable of suppressing T cell proliferation. Thus, these cells fit the phenotypic and functional definition of MDSCs.
Reactive oxygen species (ROS) mediate the immunosuppressive ability of hypertensive MDSCs
We wished to identify the mechanism MDSCs use to suppress T cells in hypertension. Study of MDSCs in various pathologic models has implicated several different possible agents, such as iNOS, arginase I and ROS. 6,23,24 Depending on the model, each of these has been reported to damp host immune responses, either independently or in concert with one another. L-NAME is a pan-NOS inhibitor. When we isolated CD11b+Gr1+ cells from L-NAME-induced hypertensive mice and co-incubated them with T cells, they still showed T cell suppressive effects (Online Figure VA). Moreover, the iNOS specific inhibitor 1400W did not affect the suppressive activity of the MDSCs from Ang II-treated mice on T cells (Online Figure VB). These data indicate that iNOS and NO are unlikely to mediate the immunosuppressive effects of hypertensive MDSCs. Finally, using intracellular staining and FCM analysis, we found negligible iNOS expression in the CD11b+Gr1+ cells of hypertensive mice (Online Figure VC). We also found that there was no significant difference in arginase I expression between CD11b+Gr1+ cells from normotensive and hypertensive mice (Online Figure VD). The addition of the arginase I inhibitor Nor-NOHA to the immunosuppressive assay only mildly enhanced the proliferation of T cells cultured with CD11b+Gr1+ cells from both normotensive and hypertensive mice (Online Figure VE). This suggests that arginase I is not a key mediator of the immunosuppression caused by hypertensive MDSCs.
Phagocytic cells use ROS to kill pathogens, and work has suggested that some MDSCs use ROS to suppress T cells.25,26 ROS production was measured by the ability of cells to oxidize dehydrorhodamine 123 to the fluorescent cationic rhodamine 123. Splenic MDSCs from mice with either Ang II- or L-NAME-induced hypertension produced significantly more ROS than equivalent cells from normotensive mice (Figure 4A, 1). Also, when MDSCs from hypertensive mice were transferred into normotensive mice, we could detect in vivo by cytofluorogram that they express ROS even after 24 hr (Online Figure VI), which indicates that the hypertensive MDSCs produce abundant ROS even in a normotensive environment. Unlike other ROS, hydrogen peroxide is long-lived and can easily diffuse between cells. We therefore considered the hypothesis that hydrogen peroxide mediates the suppressive activity of MDSCs. Addition of catalase (which catalyzes the conversion of hydrogen peroxide to water and oxygen) to the immunosuppressive assay, completely eliminated the suppressive activities of MDSCs from either Ang II treated or L-NAME treated mice (Figure 4B). These data imply that hydrogen peroxide plays an important role in mediating the suppression of T-cell proliferation by hypertensive MDSCs. Two of the major sources of cellular ROS are mitochondria and cellular NADPH oxidase.27 We added Ebselen, a potent scavenger of peroxides, to the immunosuppressive assay. The addition of this agent to the hypertensive MDSCs eliminated suppression and resulted in T cell proliferation nearly equivalent to that in an assay performed with CD11b+Gr1+ cells from normotensive mice (Figure 4C). We also used mitoEbselen, which specifically localizes to mitochondria and neutralizes mitochondrial produced ROS. mitoEbselen only partially inactivated the suppressive activity of hypertensive MDSCs. Thus, ROS produced by both mitochondria and other cellular compartments plays a major role in the activity of hypertensive MDSCs.
Figure 4. ROS mediate the immunosuppression ability of hypertensive MDSCs.
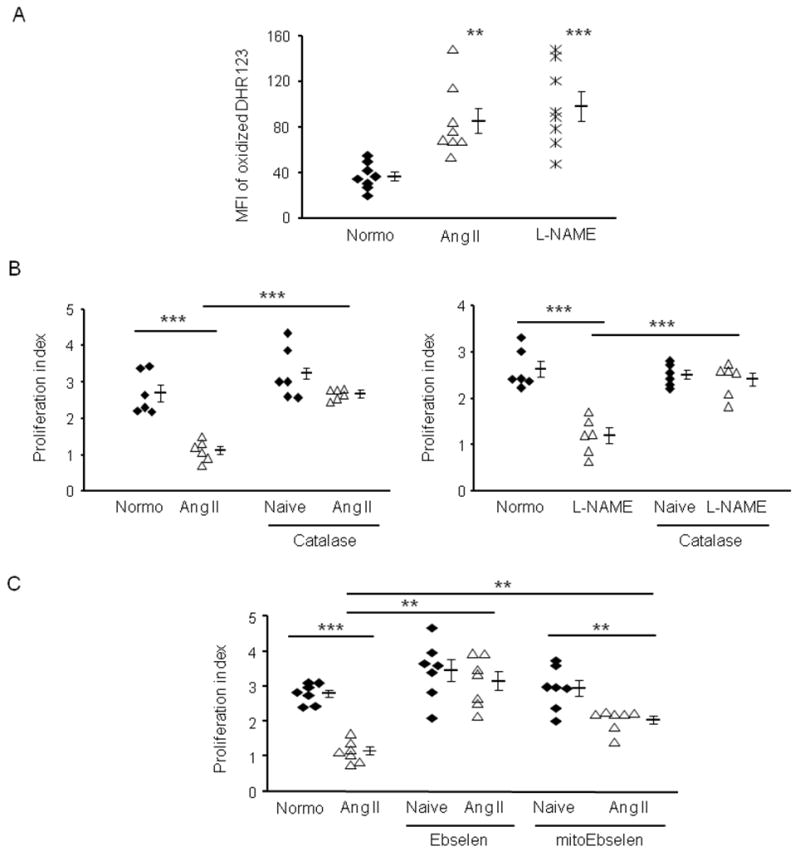
A, The production of ROS by splenic CD11b+Gr1+ cells from normotensive (normo) mice or mice made hypertensive by Ang II or L-NAME. B and C, The immunosuppressive assay was performed using CD11b+Gr1+ from normotensive or hypertensive mice. In some groups B 100 U/ml catalase, C 100 nM Ebselen or 1 nM mitoEbselen was used for the 3-day assay. **P < 0.01; ***P < 0.005.
Depletion of MDSCs raises BP in hypertension
Evidence suggests that inflammation is a critical pathologic process affecting long term BP control. Because MDSCs are potent suppressors of T cells and polarize immunity toward an anti-inflammatory phenotype, we wanted to understand their function in hypertension. To investigate this, we first used a depletion strategy. Gemcitabine has been used extensively to reduce MDSC levels in vivo without substantially altering the numbers of other leukocytes.28,29 Mice were injected i.p. with gemcitabine or saline and gemcitabine treatment reduced the number of CD11b+Gr1+ cells by 80%, confirming its efficacy. Mice were infused with Ang II (980 ng/kg/min) to induce hypertension and on day 10 of treatment started to receive gemcitabine until the end of the 4-week observation period. By day 17, there was a significant difference between the two groups with the gemcitabine treated mice having a higher BP than the saline treated group (Figure 5A). This difference continued and mice depleted of MDSC had a BP that averaged 16 mmHg higher than the control mice from day 18 until the end of the experiment (P<0.005).
Figure 5. Depletion of MDSCs enhanced the hypertensive response.

A, Two groups of mice were made hypertensive by Ang II infusion. On day 10, one group was started on i.p. gemcitabine while the other group received a similar volume of saline. BP was measured on the indicated dates. n=6–15. B, A protocol similar to A, except that one group was started on i.p. anti-Gr1 antibody while the other groups received either control isotype antibody or saline. n=7. Data was analyzed by 2-way ANOVA with posttest. Proteinuria (C) and heart weight (D) were measured on normotensive (black), Ang II treated (gray) and Ang II treated mice with MDSC depletion (white). n=6–11. *P < 0.05; ***P < 0.005.
Gemcitabine is a chemotherapeutic agent. To exclude the possibility that the increased BP was due to a mechanism besides MDSC depletion, we next used anti-Gr1 antibody to deplete MDSCs, an approach widely used for MDSC research in tumor models.29,30 On day 10 of Ang II infusion, mice received anti-Gr1 antibody i.p. or an equivalent dose of an isotype irrelevant antibody. Another group of mice wer given the same volume of saline. Starting at day 11 and continuing until the end of the experiment, analysis showed a highly significant increase of BP comparing the mice treated with anti-Gr1 antibody vs. the mice treated with control antibody or saline (Figure 5B, P<0.005). Further, we also measured proteinuria and heart weight at the end of the experiment. Hypertension caused proteinuria and increased heart weight; MDSC depletion exacerbated these pathological changes (Figure 5C and 5D). Thus, these studies indicate that MDSCs suppress BP in hypertension and reduce organ damage.
Depletion of MDSC is associated with increased T cell activity
To understand how MDSCs regulate BP, we examined T cell activation in hypertensive mice. Mice were made hypertensive with either Ang II or L-NAME for 3 weeks and their splenic T cell expression of the pro-inflammatory cytokines IFNγ and TNFα was measured. T cell IL-17 was also measured since IL-17 is thought important in mediating hypertensive responses.31 Hypertension was accompanied with an increase of IFNγ+, TNFα+ and IL-17+ cells among both CD8+ and CD4+ T cells (Online Figure VII). However, following a 2-week depletion of MDSCs with anti-Gr1 antibody, there was an exaggerated increase of CD8+ T cells secreting both IFNγ and IL-17 and CD4+ T cells secreting either IFNγ+ or IL-17+, compared to the Ang II-treated mice injected with an isotype control antibody (Figure 6A). In particular, IL-17/IFNγ double positive CD8+ T cells increased by 3-fold and 6.2-fold in MDSC-depleted hypertensive mice compared to hypertensive mice treated with control Ab and to naïve normotensive mice, respectively. These data strongly suggest that, in vivo, MDSCs suppress the number of T cells activated during hypertension.
Figure 6. Depletion of MDSCs intensified inflammation in hypertension.

A, Mice were made hypertensive with Ang II. Starting on day 10, mice were depleted of MDSCs with anti-Gr1 antibody or treated with isotype antibody. At week 4, spleens were harvested and both CD8+ and CD4+ T cells were analyzed by FCM for IFNγ, TNFα and IL-17 expression. Some of the cells were stimulated with PMA and ionomycin (P+I). Representative contours of IL-17/IFNγ double positive CD8+ T cells are shown. n=5–6. B and C, Normotensive mice, mice treated with either 4 weeks of L-NAME or Ang II, and mice treated with Ang II plus either anti-Gr1 or isotype antibody were sacrificed and their kidneys were collected. B, Cells were evaluated for the number of inflammatory cells (CD45+) and T cells (CD45+CD3+) after kidney digestion and Percoll enrichment. C, Cells were stimulated with PMA and ionomycin and then assayed for the percentage of T cells expressing IFNγ and TNFα. The representative contours of IFNγ/TNFα double positive T cells are shown. *P < 0.05; **P < 0.01; ***P < 0.005.
The kidney regulates BP by controlling salt and water excretion and by being the source of renin. Renal inflammation is a hallmark of hypertension.32 Therefore, we analyzed renal inflammation to further assess the role of MDSCs in hypertension. Both Ang II and L-NAME hypertension were accompanied by more than a 2-fold increase in the number of renal CD45+ inflammatory cells (Figure 6B). CD3+ T cells accounted for a large number of inflammatory cells in hypertensive kidneys and their numbers were increased by over 3-fold compared with those in naïve normotensive kidneys (Figure 6B). To gain insight into the role of MDSCs in modulating renal inflammation, we depleted these cells using an anti-Gr1 antibody. Depletion of MDSCs increased infiltrating cells in kidney, as indicated by a 2-fold increase in the numbers of CD45+ and CD3+ cells compared to treatment with an isotype control antibody. Examination of cytokine production by renal T cells showed very few IL-17+ cells. However, IFNγ/TNFα double positive T cells were significantly increased in hypertensive mice compared to normotensive controls (Figure 6C, P<0.05). Again, MDSC depletion led to not only a higher BP, but an aggravation in inflammation as indicated by increased renal T cell infiltration and cytokine expression. We also observed a similar result in gemcitabine treated hypertensive mice (Online Figure VIII).
Administration of MDSCs from wild-type mice but not NADPH oxidase 2 (Nox2) deficient mice reduced BP in hypertension
The depletion experiments presented above imply a beneficial role of MDSC accumulation in hypertension. We next designed adoptive transfer experiments to examine whether MDSCs derived from hypertensive mice were functional in regulating BP. A cohort of mice was injected i.v. twice with 2×10⁶ MDSCs isolated from the spleens of syngeneic hypertensive mice previously treated with 3 weeks of Ang II. As a control, a second cohort was treated identically, except they received splenic CD11b+Gr1+ cells from normotensive mice. A third cohort received only PBS. In this protocol, the first transfer of cells was 1 day before recipients were started on Ang II (490 ng/kg/min). The second transfer was 2 days after the start of Ang II. We used an Ang II dose of 490 ng/kg/min instead of 980 ng/kg/min because we wanted to evaluate possible preventive effects of MDSCs on BP increase and 490 ng/kg/min Ang II is relatively milder in forcing a BP increase. During the period between day 0 and day 9, the BP of the mice receiving hypertensive MDSCs was significantly lower than the other two groups (Figure 7A, P<0.05 and P<0.005 by two-way ANOVA). There was no difference in the BP response between the mice receiving PBS and those receiving CD11b+Gr1+ cells from normotensive mice, indicating that the transfer of normotensive myeloid cells did not affect BP.
Figure 7. Adoptive transfer of MDSCs suppressed BP.

A, Mice were infused with Ang II beginning on day 0. On days −1 and 2, the mice were administered with either MDSCs from hypertensive mice (Ang II for 3 weeks, n=6), CD11b+Gr1+ cells from normotensive mice (n=7), or PBS (n=10). B, Similar to A, except mice were transferred with either MDSCs from wild-type BM culture, MDSCs from Nox2−/− BM culture or fresh wild-type total BM cells (n=8). C, Mice were infused with Ang II beginning on day 0. On day 7, mice received either BM derived MDSCs (n=7) or an equivalent volume of saline (n=10). Treatment was repeated every week. Data were analyzed by 2-way ANOVA with posttest.
To investigate whether ROS production by MDSCs is a major mechanism retarding hypertension development, we performed a similar protocol as above but using gp91phox−/− (Nox2−/−) mice as a donor. The Nox2−/− mice have a global knockout of this gene which could potentially affect the development of hypertension and the generation of MDSCs in vivo. To avoid this and to increase the number of MDSCs available to us, we employed an established protocol by generating MDSCs from wild-type and Nox2−/− mice with BM culture in the presence of GM-CSF and IL-6.19 Two cohorts of mice were administered 5×10⁶ MDSCs twice from wild-type BM culture and Nox2−/− BM culture, respectively (Figure 7B). As a control, a third cohort was treated identically, except they received fresh total BM cells which had not been cultured in vitro and contained very few MDSCs. BP of the mice receiving total BM cells increased to above 120 mmHg on day 1 and stayed at that level for the remainder of the experiment. However, the BP of the mice receiving MDSCs from wild-type BM culture never surpassed 120 mmHg until day 8. As such, there was a consistent and highly significant difference of at least 10 mmHg during the first week between these two groups (P<0.005). In contrast to the mice receiving MDSCs from wild-type BM culture, the mice receiving MDSCs from Nox2−/− BM culture had a sustainable increase of BP from day 1 to day 7 and their average systolic BP reached 133 mmHg on day 7. Thus, the mice receiving Nox2−/− MDSCs averaged 13.5 mmHg higher BP than the mice receiving wild-type MDSCs in the first week (Figure 7B, P<0.005). We conclude that ROS production is critical for the function of MDSCs in BP control.
In the third experiment, we investigated whether MDSCs could be used as a treatment for established hypertension. Mice received Ang II for 4 weeks. Beginning on day 7, the hypertensive mice received an i.v. injection of 5×10⁶ MDSCs every 7 days. Weekly administration of MDSCs had a highly significant impact on BP, reducing systolic BP at day 27 by 37 mmHg and essentially restoring basal BP levels (Figure 7C). Thus, MDSC transfer is efficient in both preventing hypertension development and treating established hypertension.
Finally, to know the whereabouts of the transferred MDSCs, we i.v. transferred MDSCs derived from hypertensive GFP transgenic mice into normotensive and hypertensive mice. Twenty-four hours later, we collected blood, spleen, lung, bone marrow, and kidney and counted the numbers of GFP+ MDSCs in these organs (Online Figure IX). Very few transferred MDSCs were found in the blood of either group, suggesting that the cells distributed to tissues. We examined the lung because it is the first organ the transferred cells encounter. It appeared that there were more transferred cells present in the lung of normotensive mice than those of hypertensive mice. Interestingly, more transferred MDSCs repopulated the spleens of hypertensive mice, which is consistent with a role of MDSC in T cell suppression during hypertension. We also found that there was significantly more transferred MDSCs in the kidneys of hypertensive mice than those of normotensive mice, although the number was a magnitude lower than that in the spleen. Instead, there were more transferred MDSCs populating the bone marrow of normotensive mice, which indicates that without peripheral inflammation, these cells are prone to stay at where hematopoiesis begins.
DISCUSSION
Our data indicate a previously unknown role of MDSCs in hypertension. While myeloid cells capable of suppressing immune responses were described, the functional effects of these cells were largely defined in the area of cancer. Models of hypertension commonly elicit a chronic inflammatory response. Our study shows that this systemic inflammation is associated with the migration and accumulation of MDSCs in the spleen. These data indicate that the spleen is a critical place where MDSCs interact with T cells in hypertension. This finding is consistent with a recent paper showing that the release of splenic T cells is important in regulating inflammation and BP in hypertension.33 Kidney inflammation has been shown as a characteristic of hypertension. We analyzed renal inflammation as a function of MDSC numbers and found that a reduction of MDSCs in hypertension is associated with significantly increased numbers of renal inflammatory cell, including T cells. Further, with MDSC depletion, the T cells in spleen and kidney have an increased pro-inflammatory phenotype. Thus, MDSCs act to counter and limit the inflammation and increase of BP. In hypertension, the actions of MDSCs are advantageous.
Several mechanisms are known to limit the immune response. For example, regulatory T cells (Treg) are another type of regulatory cell that limits inflammation. Adoptive transfer of Tregs has been shown to reduce inflammation, tissue injury and BP in Ang II-induced hypertension.34,35 Similar benefits were observed in aldosterone induced hypertension.36 MDSCs have been reported to foster the production of inducible Tregs in tumors.37 Of note, hypertension decreases the circulating Treg number, possibly due to Ang II-induced Treg apoptosis or skewed CD4+ T cell differentiation.34,35 This decrease contrasts to the accumulation of MDSCs in the hypertensive models we studied. Further studies of the number and localization of Treg in hypertension models with low Ang II level may shed light on the relationship of Treg and MDSCs in hypertension. In hypertension, it is granulocytic MDSCs that are most increased. This is the same population that most often predominates in malignancy. Gabrilovich and colleagues recently reported that a large proportion of monocytic MDSCs in tumor-bearing mice can acquire phenotypic, morphologic and functional features of granulocytic MDSCs.38 This mechanism may also occur in the setting of hypertension. All mice have splenic and peripheral CD11b+Gr1+ cells. However, it is not believed that the immunosuppresive MDSCs are derived from these cells. Rather, experiments have demonstrated that, in response to a yet to be determined signal accompanying chronic inflammation, suppressive CD11b+Gr1+ MDSCs are newly formed in BM.24 So far, there is no accepted marker system to predict whether a MDSC will be suppressive without evaluating its suppressive function using in vitro T cell assays. As compared to the CD11b+Gr1+ cells found under basal conditions, our data and others show that these newly formed MDSCs have a distinctive pattern of differentiation markers, transcription factors and effector molecules.39 MDSC expansion is related to a hematopoietic response to inflammation where growth factors such as GM-CSF and G-CSF signal to the BM to transiently increase cellular output. This “emergency” hematopoiesis aids in the destruction and elimination of the insulting entity and is followed by tissue repair and resolution. In nonresolving inflammation, the inciting agent remains and the hematopoietic cycle linked to clearance and resolution becomes dysregulated. Presumably, this increase in the number of immunoregulatory MDSCs is one aspect of a dynamic change in the immune system that is both the cause of and the response to the onset of a chronic hypertensive inflammatory state.
We analyzed possible mechanisms by which MDSCs may affect T cells and found that MDSCs associated with hypertension made more ROS. Moreover, the experimental finding that adoptive transfer of wild-type MDSCs but not Nox2−/− MDSCs limited BP increase in recipient mice further indicates that ROS is a key factor mediating the function of MDSCs in vivo. ROS produced by endothelium and vascular smooth muscle play a major role in hypertension, but have often been assumed to be pathologic.40 However, ROS production is also a key feature of myeloid derived cells. Clinical studies have investigated antioxidant therapy as an adjunct for the treatment of cardiovascular disease.41 In such studies, it is worth considering that depletion of myeloid ROS production might exacerbate inflammation and have effects contrary to the hoped for result.
Supplementary Material
Novelty and Significance.
What Is Known?
Hypertension is accompanied by systemic inflammation as evidenced by tissue infiltration of T cells and other blood-born inflammatory cells.
In experimental animals, T cells make a major contribution to the pathogenesis of hypertension and appear obligatory for blood pressure elevation.
What New Information Does This Article Contribute?
Hypertension is accompanied by an increase of CD11b+Gr1+ myeloid-derived suppressor cells in the blood, spleen and kidney.
These hypertension-associated myeloid suppressor cells suppress T cell activity, inflammation and eventually blood pressure by producing hydrogen peroxide.
These findings highlight an immune balance in hypertension in that a subset of myeloid cells are anti-inflammatory and act to oppose the rise of blood pressure.
Chronic inflammation is a characteristic of hypertension and T cells are critical in the genesis and development of hypertension. However, the role of other components of hypertension-associated inflammation, especially the role of myeloid cells, is not well defined. We found that in 3 murine models of hypertension, the rise in blood pressure is associated with an increase of myeloid-derived suppressor cells in the blood and the spleen. These cells, in contrast to other inflammatory cells, are beneficial in blood pressure control in that they suppress T cell activity. While reactive oxygen species are generally assumed to be pathogenic in hypertension, hydrogen peroxide produced by these myeloid suppressor cells is critical in their immunosuppressive function and is advantageous. Depletion of these cells aggravated inflammation and the increase in blood pressure. In contrast, adoptive transfer of myeloid-derived suppressor cells delayed the rise in blood pressure in de novo hypertension and decreased blood pressure in established hypertension. These findings highlight a self-regulatory mechanism in hypertension. Further elucidation of this mechanism might provide a potential pathway in the management of refractory hypertension.
Acknowledgments
We thank Dr. Kolja Wawrowsky for confocal microscopy and Dr. Beatrice Knudsen and Mr. Steven Swartwood for the assistance of immunohistochemistry.
SOURCES OF FUNDING
This work was supported by NIH National Research Service Award grant T32DK007770 (KHS), an American Heart Association Beginning Grant-in-Aid 13BGIA14680069 (XZS) and Scientist Development Grant 11SDG6770006 (PS), UCLA CTSI Translational Technologies Voucher Award UT1TR000124 (PS), the National Institutes of Health R01 grants HL110353 (KEB), HL105294 (DGH), HL039006 (DGH) and Program Project Grant P01 HL58000 (DGH).
Nonstandard Abbreviations and Acronyms
- BP
blood pressure
- MDSC
myeloid-derived suppressor cells
- ROS
reactive oxygen species
- iNOS
inducible nitric oxide synthase
- Ang
angiotensin
- L-NAME
L-NG-Nitroarginine Methyl Ester
- BM
bone marrow
- FCM
flow cytometry
- C/EBP
CCAAT enhancer binding protein
Footnotes
DISCLOSURES
None.
References
- 1.Guzik TJ, Hoch NE, Brown KA, McCann LA, Rahman A, Dikalov S, Goronzy J, Weyand C, Harrison DG. Role of the T cell in the genesis of angiotensin II induced hypertension and vascular dysfunction. J Exp Med. 2007;204:2449–60. doi: 10.1084/jem.20070657. [DOI] [PMC free article] [PubMed] [Google Scholar]
- 2.Ko EA, Amiri F, Pandey NR, Javeshghani D, Leibovitz E, Touyz RM, Schiffrin EL. Resistance artery remodeling in deoxycorticosterone acetate-salt hypertension is dependent on vascular inflammation: evidence from m-CSF-deficient mice. Am J Physiol Heart Circ Physiol. 2007;292:H1789–95. doi: 10.1152/ajpheart.01118.2006. [DOI] [PubMed] [Google Scholar]
- 3.Wenzel P, Knorr M, Kossmann S, Stratmann J, Hausding M, Schuhmacher S, Karbach SH, Schwenk M, Yogev N, Schulz E, et al. Lysozyme M-positive monocytes mediate angiotensin II-induced arterial hypertension and vascular dysfunction. Circulation. 2011;124:1370–81. doi: 10.1161/CIRCULATIONAHA.111.034470. [DOI] [PubMed] [Google Scholar]
- 4.Zelenay S, Reis e Sousa C. Adaptive immunity after cell death. Trends Immunol. 2013;34:329–35. doi: 10.1016/j.it.2013.03.005. [DOI] [PubMed] [Google Scholar]
- 5.Gratze P, Dechend R, Stocker C, Park JK, Feldt S, Shagdarsuren E, Wellner M, Gueler F, Rong S, Gross V, et al. Novel role for inhibitor of differentiation 2 in the genesis of angiotensin II-induced hypertension. Circulation. 2008;117:2645–56. doi: 10.1161/CIRCULATIONAHA.107.760116. [DOI] [PubMed] [Google Scholar]
- 6.Gabrilovich DI, Nagaraj S. Myeloid-derived suppressor cells as regulators of the immune system. Nat Rev Immunol. 2009;9:162–74. doi: 10.1038/nri2506. [DOI] [PMC free article] [PubMed] [Google Scholar]
- 7.Highfill SL, Rodriguez PC, Zhou Q, Goetz CA, Koehn BH, Veenstra R, Taylor PA, Panoskaltsis-Mortari A, Serody JS, Munn DH, et al. Bone marrow myeloid-derived suppressor cells (MDSCs) inhibit graft-versus-host disease (GVHD) via an arginase-1-dependent mechanism that is up-regulated by interleukin-13. Blood. 2010;116:5738–47. doi: 10.1182/blood-2010-06-287839. [DOI] [PMC free article] [PubMed] [Google Scholar]
- 8.Ostanin DV, Bhattacharya D. Myeloid-derived suppressor cells in the inflammatory bowel diseases. Inflamm Bowel Dis. 2013;19:2468–77. doi: 10.1097/MIB.0b013e3182902b11. [DOI] [PubMed] [Google Scholar]
- 9.Delano MJ, Scumpia PO, Weinstein JS, Coco D, Nagaraj S, Kelly-Scumpia KM, O’Malley KA, Wynn JL, Antonenko S, Al-Quran SZ, et al. MyD88-dependent expansion of an immature GR-1(+)CD11b(+) population induces T cell suppression and Th2 polarization in sepsis. J Exp Med. 2007;204:1463–74. doi: 10.1084/jem.20062602. [DOI] [PMC free article] [PubMed] [Google Scholar]
- 10.Marigo I, Dolcetti L, Serafini P, Zanovello P, Bronte V. Tumor-induced tolerance and immune suppression by myeloid derived suppressor cells. Immunol Rev. 2008;222:162–79. doi: 10.1111/j.1600-065X.2008.00602.x. [DOI] [PubMed] [Google Scholar]
- 11.Peranzoni E, Zilio S, Marigo I, Dolcetti L, Zanovello P, Mandruzzato S, Bronte V. Myeloid-derived suppressor cell heterogeneity and subset definition. Curr Opin Immunol. 2010;22:238–44. doi: 10.1016/j.coi.2010.01.021. [DOI] [PubMed] [Google Scholar]
- 12.Swirski FK, Nahrendorf M, Etzrodt M, Wildgruber M, Cortez-Retamozo V, Panizzi P, Figueiredo JL, Kohler RH, Chudnovskiy A, Waterman P, et al. Identification of splenic reservoir monocytes and their deployment to inflammatory sites. Science. 2009;325:612–6. doi: 10.1126/science.1175202. [DOI] [PMC free article] [PubMed] [Google Scholar]
- 13.Quiroz Y, Pons H, Gordon KL, Rincón J, Chávez M, Parra G, Herrera-Acosta J, Gómez-Garre D, Largo R, Egido J, et al. Mycophenolate mofetil prevents salt-sensitive hypertension resulting from nitric oxide synthesis inhibition. Am J Physiol Renal Physiol. 2001;281:F38–47. doi: 10.1152/ajprenal.2001.281.1.F38. [DOI] [PubMed] [Google Scholar]
- 14.Chen F, Liu Z, Wu W, Rozo C, Bowdridge S, Millman A, Van Rooijen N, Urban JF, Wynn TA, Gause WC. An essential role for TH2-type responses in limiting acute tissue damage during experimental helminth infection. Nat Med. 2012;18:260–6. doi: 10.1038/nm.2628. [DOI] [PMC free article] [PubMed] [Google Scholar]
- 15.Huang B, Pan PY, Li Q, Sato AI, Levy DE, Bromberg J, Divino CM, Chen SH. Gr-1+CD115+ immature myeloid suppressor cells mediate the development of tumor-induced T regulatory cells and T-cell anergy in tumor-bearing host. Cancer Res. 2006;66:1123–31. doi: 10.1158/0008-5472.CAN-05-1299. [DOI] [PubMed] [Google Scholar]
- 16.Tsukada J, Yoshida Y, Kominato Y, Auron PE. The CCAAT/enhancer (C/EBP) family of basic-leucine zipper (bZIP) transcription factors is a multifaceted highly-regulated system for gene regulation. Cytokine. 2011;54:6–19. doi: 10.1016/j.cyto.2010.12.019. [DOI] [PubMed] [Google Scholar]
- 17.Rosenbauer F, Tenen DG. Transcription factors in myeloid development: balancing differentiation with transformation. Nat Rev Immunol. 2007;7:105–17. doi: 10.1038/nri2024. [DOI] [PubMed] [Google Scholar]
- 18.Hirai H, Zhang P, Dayaram T, Hetherington CJ, Mizuno S, Imanishi J, Akashi K, Tenen DG. C/EBPbeta is required for ‘emergency’ granulopoiesis. Nat Immunol. 2006;7:732–9. doi: 10.1038/ni1354. [DOI] [PubMed] [Google Scholar]
- 19.Marigo I, Bosio E, Solito S, Mesa C, Fernandez A, Dolcetti L, Ugel S, Sonda N, Bicciato S, Falisi E, et al. Tumor-induced tolerance and immune suppression depend on the C/EBPbeta transcription factor. Immunity. 2010;32:790–802. doi: 10.1016/j.immuni.2010.05.010. [DOI] [PubMed] [Google Scholar]
- 20.Balamurugan K, Sterneck E. The many faces of C/EBPδ and their relevance for inflammation and cancer. Int J Biol Sci. 2013;9:917–33. doi: 10.7150/ijbs.7224. [DOI] [PMC free article] [PubMed] [Google Scholar]
- 21.Kastner P, Chan S. PU.1: a crucial and versatile player in hematopoiesis and leukemia. Int J Biochem Cell Biol. 2008;40:22–7. doi: 10.1016/j.biocel.2007.01.026. [DOI] [PubMed] [Google Scholar]
- 22.Ghisletti S, Barozzi I, Mietton F, Polletti S, De Santa F, Venturini E, Gregory L, Lonie L, Chew A, Wei CL, et al. Identification and characterization of enhancers controlling the inflammatory gene expression program in macrophages. Immunity. 2010;32:317–28. doi: 10.1016/j.immuni.2010.02.008. [DOI] [PubMed] [Google Scholar]
- 23.Goh C, Narayanan S, Hahn YS. Myeloid-derived suppressor cells: the dark knight or the joker in viral infections? Immunol Rev. 2013;255:210–21. doi: 10.1111/imr.12084. [DOI] [PMC free article] [PubMed] [Google Scholar]
- 24.Youn JI, Gabrilovich DI. The biology of myeloid-derived suppressor cells: the blessing and the curse of morphological and functional heterogeneity. Eur J Immunol. 2010;40:2969–75. doi: 10.1002/eji.201040895. [DOI] [PMC free article] [PubMed] [Google Scholar]
- 25.Kusmartsev S, Nefedova Y, Yoder D, Gabrilovich DI. Antigen-specific inhibition of CD8+ T cell response by immature myeloid cells in cancer is mediated by reactive oxygen species. J Immunol. 2004;172:989–99. doi: 10.4049/jimmunol.172.2.989. [DOI] [PubMed] [Google Scholar]
- 26.Schmielau J, Finn OJ. Activated granulocytes and granulocyte-derived hydrogen peroxide are the underlying mechanism of suppression of t-cell function in advanced cancer patients. Cancer Res. 2001;61:4756–60. [PubMed] [Google Scholar]
- 27.Dikalov S. Cross talk between mitochondria and NADPH oxidases. Free Radic Biol Med. 2011;51:1289–301. doi: 10.1016/j.freeradbiomed.2011.06.033. [DOI] [PMC free article] [PubMed] [Google Scholar]
- 28.Suzuki E, Kapoor V, Jassar AS, Kaiser LR, Albelda SM. Gemcitabine selectively eliminates splenic Gr-1+/CD11b+ myeloid suppressor cells in tumor-bearing animals and enhances antitumor immune activity. Clin Cancer Res. 2005;11:6713–21. doi: 10.1158/1078-0432.CCR-05-0883. [DOI] [PubMed] [Google Scholar]
- 29.Mundy-Bosse BL, Lesinski GB, Jaime-Ramirez AC, Benninger K, Khan M, Kuppusamy P, Guenterberg K, Kondadasula SV, Chaudhury AR, La Perle KM, et al. Myeloid-derived suppressor cell inhibition of the IFN response in tumor-bearing mice. Cancer Res. 2011;71:5101–10. doi: 10.1158/0008-5472.CAN-10-2670. [DOI] [PMC free article] [PubMed] [Google Scholar]
- 30.Mauti LA, Le Bitoux MA, Baumer K, Stehle JC, Golshayan D, Provero P, Stamenkovic I. Myeloid-derived suppressor cells are implicated in regulating permissiveness for tumor metastasis during mouse gestation. J Clin Invest. 2011;121:2794–807. doi: 10.1172/JCI41936. [DOI] [PMC free article] [PubMed] [Google Scholar]
- 31.Madhur MS, Lob HE, McCann LA, Iwakura Y, Blinder Y, Guzik TJ, Harrison DG. Interleukin 17 promotes angiotensin II-induced hypertension and vascular dysfunction. Hypertension. 2010;55:500–7. doi: 10.1161/HYPERTENSIONAHA.109.145094. [DOI] [PMC free article] [PubMed] [Google Scholar]
- 32.Harrison DG, Guzik TJ, Lob HE, Madhur MS, Marvar PJ, Thabet SR, Vinh A, Weyand CM. Inflammation, immunity, and hypertension. Hypertension. 2011;57:132–40. doi: 10.1161/HYPERTENSIONAHA.110.163576. [DOI] [PMC free article] [PubMed] [Google Scholar]
- 33.Carnevale D, Pallante F, Fardella V, Fardella S, Iacobucci R, Federici M, Cifelli G, De Lucia M, Lembo G. The angiogenic factor PlGF mediates a neuroimmune interaction in the spleen to allow the onset of hypertension. Immunity. 2014;41:737–52. doi: 10.1016/j.immuni.2014.11.002. [DOI] [PubMed] [Google Scholar]
- 34.Matrougui K, Abd Elmageed Z, Zakaria AE, Kassan M, Choi S, Nair D, Gonzalez-Villalobos RA, Chentoufi AA, Kadowitz P, Belmadani S, et al. Natural regulatory T cells control coronary arteriolar endothelial dysfunction in hypertensive mice. Am J Pathol. 2011;178:434–41. doi: 10.1016/j.ajpath.2010.11.034. [DOI] [PMC free article] [PubMed] [Google Scholar]
- 35.Barhoumi T, Kasal DA, Li MW, Shbat L, Laurant P, Neves MF, Paradis P, Schiffrin EL. T regulatory lymphocytes prevent angiotensin II-induced hypertension and vascular injury. Hypertension. 2011;57:469–76. doi: 10.1161/HYPERTENSIONAHA.110.162941. [DOI] [PubMed] [Google Scholar]
- 36.Kasal DA, Barhoumi T, Li MW, Yamamoto N, Zdanovich E, Rehman A, Neves MF, Laurant P, Paradis P, Schiffrin EL. Regulatory lymphocytes prevent aldosterone-induced vascular injury. Hypertension. 2012;59:324–30. doi: 10.1161/HYPERTENSIONAHA.111.181123. [DOI] [PubMed] [Google Scholar]
- 37.Lindau D, Gielen P, Kroesen M, Wesseling P, Adema GJ. The immunosuppressive tumour network: myeloid-derived suppressor cells, regulatory T cells and natural killer T cells. Immunology. 2013;138:105–15. doi: 10.1111/imm.12036. [DOI] [PMC free article] [PubMed] [Google Scholar]
- 38.Youn JI, Kumar V, Collazo M, Nefedova Y, Condamine T, Cheng P, Villagra A, Antonia S, McCaffrey JC, Fishman M, et al. Epigenetic silencing of retinoblastoma gene regulates pathologic differentiation of myeloid cells in cancer. Nat Immunol. 2013;14:211–20. doi: 10.1038/ni.2526. [DOI] [PMC free article] [PubMed] [Google Scholar]
- 39.Sonda N, Chioda M, Zilio S, Simonato F, Bronte V. Transcription factors in myeloid-derived suppressor cell recruitment and function. Curr Opin Immunol. 2011;23:279–85. doi: 10.1016/j.coi.2010.12.006. [DOI] [PubMed] [Google Scholar]
- 40.Rajagopalan S, Kurz S, Münzel T, Tarpey M, Freeman BA, Griendling KK, Harrison DG. Angiotensin II-mediated hypertension in the rat increases vascular superoxide production via membrane NADH/NADPH oxidase activation. Contribution to alterations of vasomotor tone. J Clin Invest. 1996;97:1916–23. doi: 10.1172/JCI118623. [DOI] [PMC free article] [PubMed] [Google Scholar]
- 41.Sesso HD, Buring JE, Christen WG, Kurth T, Belanger C, MacFadyen J, Bubes V, Manson JE, Glynn RJ, Gaziano JM. Vitamins E and C in the prevention of cardiovascular disease in men: the Physicians’ Health Study II randomized controlled trial. JAMA. 2008;300:2123–33. doi: 10.1001/jama.2008.600. [DOI] [PMC free article] [PubMed] [Google Scholar]
Associated Data
This section collects any data citations, data availability statements, or supplementary materials included in this article.