

Abstract
Current computational methods used to analyze changes in DNA methylation and chromatin modification rely on sequenced genomes. Here we describe a pipeline for the detection of these changes from short-read sequence data that does not require a reference genome. Open source software packages were used for sequence assembly, alignment, and measurement of differential enrichment. The method was evaluated by comparing results with reference-based results showing a strong correlation between chromatin modification and gene expression. We then used our de novo sequence assembly to build the DNA methylation profile for the non-referenced Psammomys obesus genome. The pipeline described uses open source software for fast annotation and visualization of unreferenced genomic regions from short-read data.
Keywords: ChIP-seq, DNA methylation, de novo assembly, epigenomic integration, High-throughput sequencing, MBD-seq, Psammomys obesus
Abbreviations:
- ChIP-seq
immunoprecipitated chromatin sequencing
- RNA-seq
RNA sequencing
- MeDIP-seq
methylated DNA immunoprecipitation sequencing
- MBD-seq
methyl binding domain protein sequencing
- DMR
differentially methylated region
Introduction
Rapid advances in massive parallel sequencing allow the study of regulatory chromatin modifications with unprecedented scope and resolution. The epigenome describes the covalent modifications of chromatinized proteins and DNA that are critical to chromatin structure and gene function.1 Large collaborative projects, such as the ENCODE consortium, have described important discoveries with respect to epigenetic gene regulation.2 Furthermore, a growing body of evidence defines a central role for chromatin modifications driving phenotypic changes associated with disease. With the reduced cost of sequencing ultimately leading to the development of more applications for biological discovery, improved computational methods are increasingly required to assist researchers to accurately profile the epigenome.
Epigenomic marks are profiled by sequencing immunoprecipitated DNA associated with chromatinized proteins or cytosine methylation.3,4 Currently, the genomic sources of epigenetic marks are identified by sequence alignment to an annotated genome. Thus, absence of a published reference genome greatly limits the capacity of standard methods to study the epigenome for the majority of known species. Therefore, the only method currently available to detect epigenomic changes in non-referenced species requires the building of a reference genome as a precursor to the alignment of epigenomic sequencing. The current study describes a bioinformatics pipeline that permits the study of changes in chromatin modifications without a reference genome. This is achieved by assembling epigenomic sequencing data de novo and quantifying the assembled contigs by alignment of reads to the new epigenome assembly. The assembled epigenome can then be used for further analysis in conjunction with established methods of bioinformatics analysis. We assessed the applicability of our de novo pipeline against publicly available data sets for epigenomic profiling and demonstrate that our findings are consistent with results derived by reference-based alignment.
Further validating our novel method, we demonstrate the application of our approach to epigenomic profiling of original data experimentally derived from a species without a reference genome. As a model of the metabolic syndrome, dietary modification in Psammomys obesus (Israeli sand rat) can induce a phenotype closely resembling human type 2 diabetes.5,6 In striking contrast to the normoglycemic phenotype conferred by their natural low-energy diet, rapid development of metabolic disorders, including obesity, hyperglycemia, and hyperinsulinemia, is observed for a proportion of animals fed standard rodent laboratory chow.7 The heterogeneous phenotype of this experimental model reflects similar variations observed in human populations, driving its use for discovery of gene variants and pathways subsequently associated with metabolic disorders in human cohorts.8-10 Poor intrauterine nutrition and low birth weight are strongly linked with increased risk for type 2 diabetes11,12 and epigenetic changes have been implicated in this pathology.13 To examine hypothalamic methylation patterns for associations with intrauterine nutrition, we adopted a model of early life caloric restriction in P. obesus for analysis using our method of de novo sequence assembly. Results of this analysis validate the application of our novel approach to epigenomic profiling without a reference genome.
Results
Overview
Our method for epigenomic profiling consisted of 3 steps: (i) the epigenomic sequence data were assembled de novo; (ii) the assembled contigs were quantified in each sample by alignment of reads to the new epigenome assembly and; (iii) the differential enrichment between sample groups was determined using a statistical analysis method developed for high-throughput sequencing. To demonstrate the general applicability of our methodology, 3 publicly available sequencing data sets from human, mouse, and fly were analyzed. Our method for testing the feasibility of our pipeline is shown diagrammatically in Figure 1. In order to validate the method, in silico extension of the published sequence was needed because virtually all publicly available chromatin immunoprecipitation followed by high-throughput sequencing (ChIP-seq) data have a read length of <50 nt. Read extension was performed by derivation of read alignment coordinates and addition of sequencing noise through random incorporation of base call errors proportional to empirical Illumina base quality scores. These semi-synthetic simulated reads were assembled, with subsequent per-sample quantification, and differentially analyzed. The results of the de novo assembly were then compared to a conventional reference-based sequencing analysis method.
Figure 1.
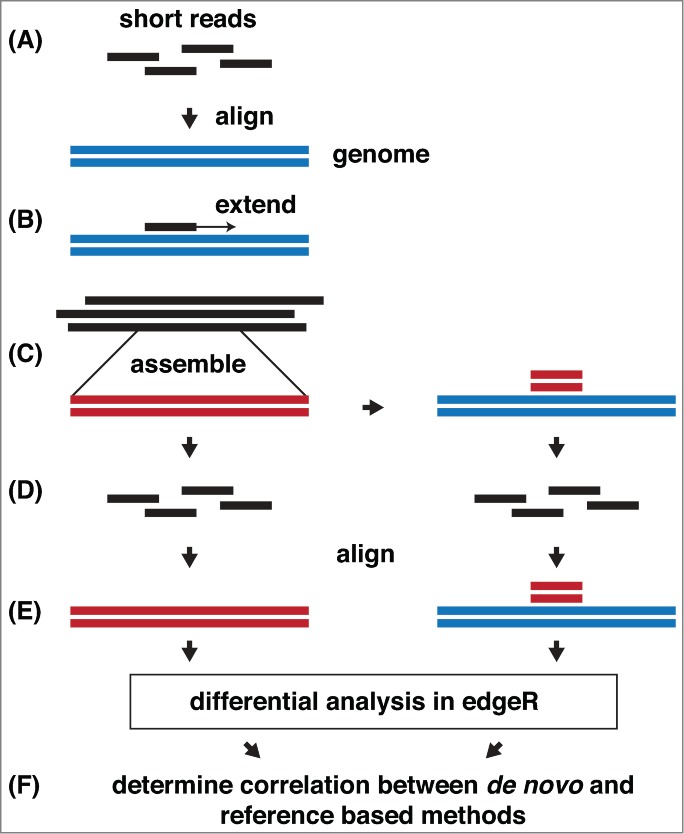
Evaluation of the de novo method of differential epigenomic profiling without a reference genome. (A) Test data set acquisition. Publicly available differentially enriched sequence data is aligned to the species-specific reference genome. (B) Simulated data generation. The read coordinates are extracted, extended to 100 bp (3' end), assigned base quality scores derived from a real Illumina sequencing run, random sequencing errors are incorporated, and low quality bases from the 3' ends are trimmed. Reads <30 bp are discarded. (C) Assembly. Extended reads are assembled with ABySS, contigs <100 bp discarded. The newly assembled regions are aligned to the original reference genome. (D) Remapping. Extended reads are mapped to the new assembly, and to the original reference genome. (E) Quantification. Read mapping for each contig in the de novo assembly and its corresponding region in the reference genome is counted in each sample and case-control differential representation determined with edgeR. (F) Verification: The efficacy of de novo epigenomic analysis is determined by comparing de novo profiles to those derived from reference based methods.
Publicly accessible data sets used to test the pipeline
The 3 public data sets derived from histone modification, transcription factor binding, and DNA methylation were selected to represent diverse epigenomic profiles from distinct species with a range of genome sizes (Table 1). Furthermore, these data sets contain biological replicates that permit application of sound statistical methods taking into consideration biological variation. Two of the data sets were derived by sequencing of immunoprecipitated chromatin (ChIP-seq): histone 3 lysine 9 acetylation (H3K9Ac) in Drosophila melanogaster (ModEncode),14 where embryo-derived data sets were compared to those derived from larvae (GSE16013), and estrogen receptor α (ER-α) ChIP-seq data examining the effect of tamoxifen resistance in cancer cell lines (GSE32222).15 The third data set compared genome-wide methylated DNA immunoprecipitation (MeDIP-seq) of intestinal adenoma and normal tissue from mouse (GSE38983).16 Accession numbers for these data sets are provided in Table S1, and the accession numbers for mRNA sequencing data used for integration analysis are provided in Table S2.
Table 1.
Data sets used to evaluate de novo differential enrichment analysis
| Dataset | Species | Enrichment protocol | Experimental conditions |
|---|---|---|---|
| Drosophila development | D. melanogaster | ChIP-seq - histone H3K9Ac | Embryo vs. larvae |
| Estrogen receptor binding in tamoxifen resistance | H. sapiens | Estrogen receptor α ChIP-seq | Tamoxifen-resistant vs. tamoxifen-responsive |
| DNA–methylome analysis of mouse intestinal adenoma | M. musculus | MeDIP-seq | Adenoma vs. normal |
| Methylation in the hypothalami of offspring with alternative prenatal diets. | P. obesus | MBD-seq | Prenatal high vs. low fat diet. |
De novo assembly identifies functional genomic regions
We propose the de novo epigenome assembly pipeline as a useful bioinformatics tool for epigenomic profiling of species for which there is no published reference genome. To evaluate the utility of the pipeline to identify genomic regions, we analyzed the assembled contigs of publicly available data generated using fly (fly_H3K9Ac) and human (human_ERA) ChIP-seq for histone acetylation and estrogen receptor α transcription factor binding, respectively. Intersection of these data with annotated genomic features examining gene bodies, exons and introns as well as CpG islands (Fig. 2) revealed that the fly_H3K9Ac and human_ERA data sets each recovered >60% of the genome. Similar analysis of mouse DNA methylation data sets derived by MeDIP-seq (mouse_MeDIP) recovered approximately 25% of the genome. In all data sets examined, exons displayed the highest proportion of sequence coverage. These results suggest that our de novo sequence assembly of epigenomic profiles captures significant regions of the genome.
Figure 2.
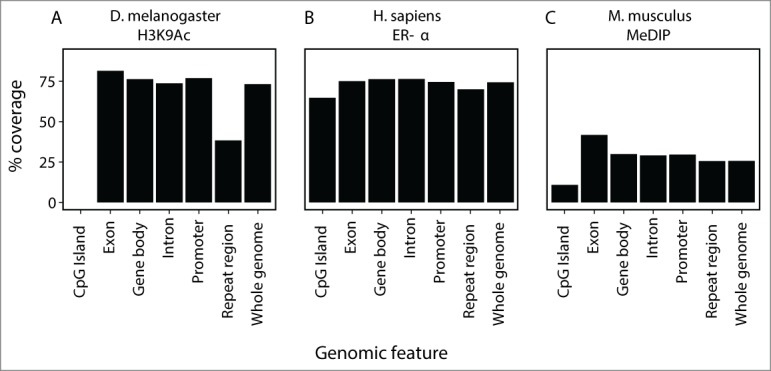
Coverage of assembled regions when mapped to their respective reference genomes. The percentage of genomic features covered by newly assembled contigs by ChIP-seq for H3K9Ac and ER-α, and DNA methylation enrichment. Gene features derived from Ensembl ver. 72 for D. melanogaster and M. musculus, and Ensembl ver. 54 for H. sapiens are composed of CpG islands, exons, introns, whole gene bodies, promoters (the region 3 kb upstream from the transcription start site) and the whole genome. Genomic regions were filtered by 36 bp read mappability. Coverage is shown for (A) D. melanogaster H3K9Ac (no CpG islands are annotated), (B) H. sapiens ER-α, (C) M. musculus DNA methylation.
Comparison of assembly method to reference-based method
Having identified differential genomic regions from publicly accessible epigenomic data, we next evaluated the efficacy of the de novo pipeline by comparing results derived by this method with standard reference-based approaches. By defining our intervals as the regions where assembled contigs align to the reference genome, we were able to evaluate the utility of our method for measuring changes in sequence abundance while avoiding the distributional assumptions of common interval defining methods such as binning or peak finding.17,18 The assembled contigs showed a high level of realignment to their reference genomes, with 98% of the mouse contigs, 96% of the fly contigs and 99% of the human contigs having a mapQ >30. Reference based methods require genomic coordinate intervals to be defined so sequence counts can be summarized and tested for differential binding using count-based statistical tools such as edgeR.19 Figure 3 shows a high degree of correlation between results obtained by both analysis pipelines for fly_H3K9Ac, human_ERA, and mouse_MeDIP. Overall, the de novo method using simulated read-extended data yielded results that were consistent with the reference based method.
Figure 3.
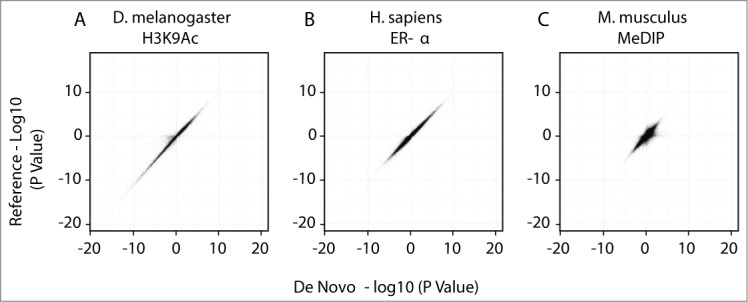
Comparison of differential data derived by de novo and reference-based sequence analysis. A comparison of the edgeR calculated differential significance showing the signed -log10 P-value of de novo assembled contigs (x-axis) compared to that of the same region on the reference genome (y-axis). The region on the reference genome was defined by mapping assembled contigs to the reference and counting overlapping aligned tags for that region. (A) D. melanogaster H3K9Ac (slope = 1.02, R2 = 0.96), (B) H. sapiens ER-α (slope = 0.995, R2 = 0.98), (C) M. musculus DNA methylation (slope = 0.92, R2 = 0.78).
A common approach to count ChIP-seq reads is parameter-based binning using a sliding window.20-22 We used this method to compare large data sets derived from ChIP-seq and MeDIP-seq with our de novo pipeline. Compared to the reference-based approach, de novo sequence assembly identified a larger genome proportion as differentially enriched (P ≤ 1e-5) in fly (71% greater [de novo 5,496 kbp; sliding-window 3,222 kbp]), human (94% greater [de novo 1,811 kbp; sliding-window 935 kbp]), but not mouse (27% less [de novo 68 kbp; sliding-window 92 kbp]) (Fig. 4). In addition to recovering a significant proportion of the differential contigs identified by the reference-based method, these findings indicate that the de novo method recovers many additional regions of ChIP-seq and MeDIP-seq enrichment.
Figure 4.
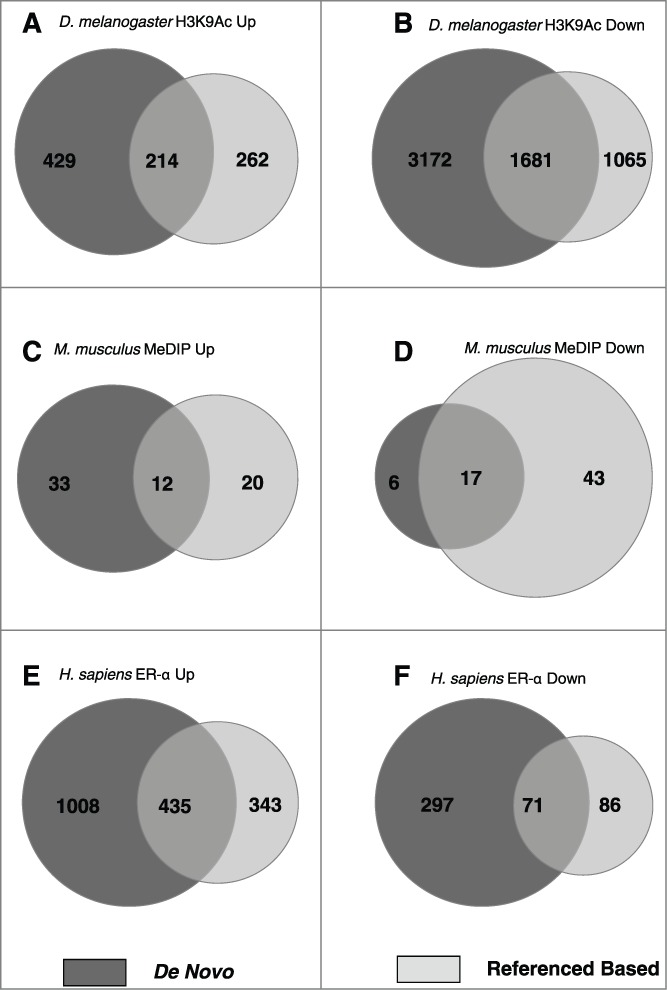
Intersection of differential regions between de novo and reference based analyzes of enrichment sequencing. Venn diagrams show intersection of differential (P ≤ 1e-5) regions (kbp) between the reference based sliding-window method and de novo method. Comparisons show: increased (A) and decreased (B) D. melanogaster H3K9Ac; increased (C) and decreased (D) DNA methylation in M. musculus; and increased (E) and decreased (F) H. sapiens ER-α binding.
De novo assembly of the P. obesus hypothalamus methylome identifies methylation changes conferred by early life diet
Having demonstrated that our method of sequence assembly can identify differential regions of enrichment from a range of published epigenomic sequence data, we used the de novo approach to examine genome methylation in the P. obesus. Currently, a reference genome for this rodent species has not been published. Epigenomic profiling of this experimental model has potential to identify epigenetic changes underlying susceptibility to development of diet-induced diabetes. Using MDB-seq, differential methylation patterns were derived from hypothalami of animals exposed to a healthy or calorie-restricted environment during early life, followed by standard diets from 4 weeks of age. A k-mer of 51 provided the largest assembly size of contigs greater than or equal to 100 bp and this was used for downstream differential analysis. The 646 Mbp assembly comprised 2,581,742 contigs with an average contig size of 250.3 bp and median size of 184 bp. P. obesus contigs were annotated by sequence homology with the mouse genome (mm10) as this represents the best annotated closely-related species. Sequence matches were examined for genomic features such as exons, introns, and CpG islands (Fig. 5). Approximately 4% of the mouse genome was matched to the methylome contigs. This sequence homology increased to 5% for promoters and gene bodies, and to 23% for exons. The high levels of sequence homology in mammalian exons would account for the high level of alignment of these regions to the mouse genome. In contrast, intergenic and repeat regions were under-represented. These results demonstrate that exons are more likely to be annotated for MBD-seq at the same P-value threshold.
Figure 5.
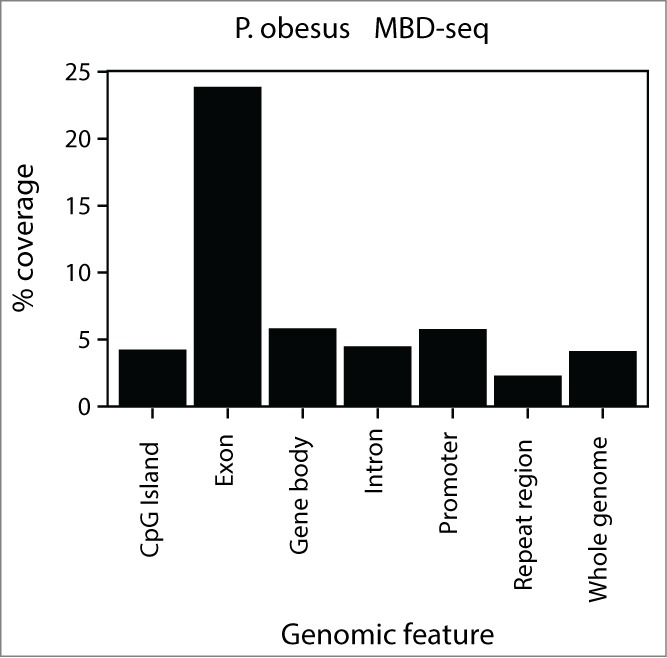
Distribution of assembled Psammomys obesus regions aligned to the Mus musculus mm10 reference genome. P. obesus methylome contigs were mapped to mouse homolog regions via BLASTN (E ≤ 1e-10). Gene features are based on Ensembl version 72 are composed of CpG islands, exons, introns, whole gene bodies, promoters (the region 3 kb upstream from the transcription start site) and the whole genome. Genomic regions were filtered by 100 bp read mappability.
Statistical comparison of contig counts derived from the hypothalamus of P. obesus on standard diets (n = 4) with those having early-life calorie-restriction (n = 4) identified 328 differentially methylated regions (DMRs) (P ≤ 1e-4). Analysis identified 134 regions with increased DNA methylation and 194 differential regions with reduced DNA methylation conferred by early-life calorie restriction. The 20 most significant annotated regions for increased and reduced differential DNA methylation are described in Table 2. A bioinformatics protocol describing the sand rat analysis is in Table S3. DMRs identified by MBD-seq should correspond to independent experimental validation. MBD-seq revealed increased and decreased DNA methylation of Oxct2a and Havcr2 genes respectively, and distinct levels of sequence abundance. Quantitative PCR analysis of these loci following MBD enrichment independently confirmed the changes observed using massive parallel sequencing (Fig. 6).
Table 2.
Differentially methylated regions identified using de novo profiling of P. obesus model of prenatal calorie restriction
| Gene name | Homologous mm10 location | Distance to gene (bp) | log2 fold change | P-value |
|---|---|---|---|---|
| Oxct2a | chr4:123322016-123322472 | 0 | 0.81 | 9.03E-10 |
| Syngr3 | chr17:24686122-24686475 | 0 | 1.20 | 7.42E-07 |
| Gpr4 | chr7:19222636-19223445 | 0 | 0.90 | 8.03E-07 |
| Gchfr | chr2:119171926-119172742 | 0 | 0.74 | 1.61E-06 |
| Pcdha10 | chr18:36999424-36999597 | 0 | 1.11 | 1.87E-06 |
| Odf2 | chr2:29910653-29910801 | 0 | 1.14 | 1.89E-06 |
| Tmem206 | chr1:191338752-191338998 | 0 | 0.81 | 2.47E-06 |
| Rpp25 | chr9:57511359-57511615 | 5,912 | 0.65 | 3.14E-06 |
| Sema3f | chr9:107682422-107683286 | 0 | 0.79 | 3.92E-06 |
| Kcnj4 | chr15:79484606-79484890 | 0 | 1.77 | 6.00E-06 |
| Gm14314 | chr2:179096367-179097333 | 75,234 | 0.77 | 9.48E-06 |
| Nrf1 | chr6:30116059-30116295 | 0 | 0.47 | 1.55E-05 |
| AL662835.2 | chr11:119153678-119154116 | 0 | 0.66 | 1.75E-05 |
| Shank2 | chr7:144235592-144235854 | 0 | 0.89 | 1.83E-05 |
| Mcf2l | chr8:12890389-12890744 | 0 | 0.97 | 1.85E-05 |
| Dnm2 | chr9:21481279-21481483 | 0 | 1.31 | 2.21E-05 |
| Zdhhc24 | chr19:4884060-4884430 | 0 | 1.19 | 2.56E-05 |
| Gm831 | chr4:131502583-131502831 | 0 | 0.86 | 2.68E-05 |
| RP24-448C16.2 | chr5:64717851-64717917 | 0 | 0.71 | 2.98E-05 |
| Padi3 | chr4:140803413-140803610 | 0 | 1.28 | 3.41E-05 |
| Havcr2 | chr11:46469804-46469670 | 0 | −1.41 | 1.48E-07 |
| Plxdc2 | chr2:16683086-16683133 | 0 | −1.18 | 3.50E-07 |
| Igsf10 | chr3:59379342-59379428 | 35,086 | −1.40 | 1.21E-06 |
| Gm10369 | chr5:134677569-134677612 | 0 | −1.38 | 2.16E-06 |
| Zfp600 | chr4:146175632-146175578 | 0 | −1.39 | 6.40E-06 |
| 7SK | chr12:96375389-96375483 | 119,152 | −1.55 | 6.67E-06 |
| Gm14235 | chr2:168131246-168131290 | 16,727 | −1.50 | 1.03E-05 |
| D18Ertd653e | chr18:68172466-68172877 | 0 | −0.91 | 1.28E-05 |
| Rngtt | chr4:33500412-33500200 | 0 | −1.57 | 1.41E-05 |
| Kansl1 | chr11:104361048-104360876 | 0 | −1.16 | 1.55E-05 |
| 1700095J03Rik | chr7:109442635-109443096 | 0 | −1.22 | 2.01E-05 |
| Nek11 | chr9:105381416-105381626 | 0 | −0.97 | 2.26E-05 |
| Cyp2e1 | chr7:140750537-140750586 | 13,153 | −1.50 | 2.46E-05 |
| AC154353.1 | chr12:42845315-42845363 | 563,502 | −1.51 | 2.65E-05 |
| Samd8 | chr14:21785123-21785185 | 0 | −1.11 | 4.08E-05 |
| Robo1 | chr16:73049803-73049856 | 3,708 | −1.16 | 4.22E-05 |
| Dpysl3 | chr18:43363811-43363297 | 0 | −1.24 | 4.28E-05 |
| Rora | chr9:69328458-69328817 | 0 | −0.90 | 5.15E-05 |
| Lca5 | chr9:83293753-83294291 | 96,002 | −1.09 | 5.40E-05 |
| Gm13483 | chr2:50363272-50363351 | 0 | −1.39 | 5.48E-05 |
Figure 6.
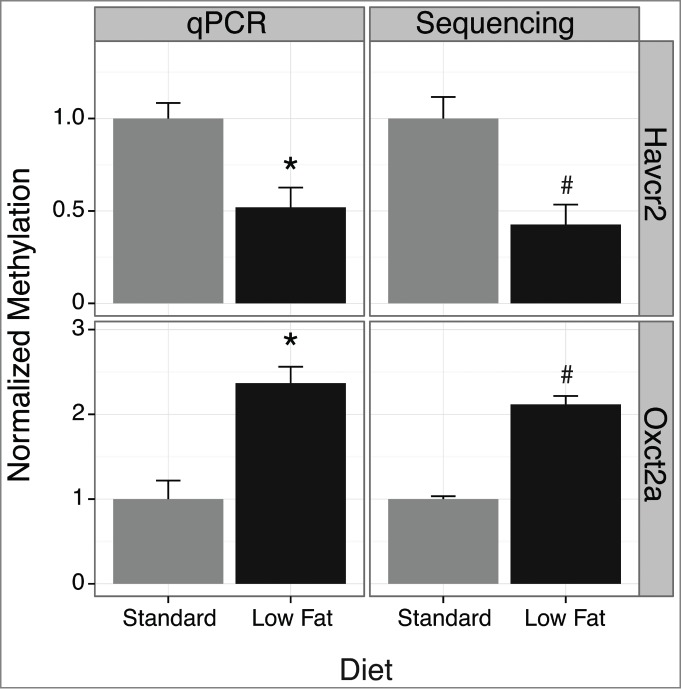
Validation of differentially methylated regions in P. obesus using quantitative PCR. qPCR and MBD-seq differential results are shown for Oxct2a and Havcr2. All values were normalized to the standard diet. The sequencing results describe the reads per million values for the whole contig. *P < 0.05 for qPCR using a one tailed Student's t-test. Sequencing results represent 4 biological replicates, and changes were validated by qPCR analysis of 3 biological replicates. Error bars represent standard error of the mean.
De novo assembled epigenomic and transcriptomic data can be integrated without a reference genome
Accurate recovery of epigenomic regions using our de novo method prompted us to test the consistency of our results with known relationships to transcriptional regulation. To evaluate the applicability of our de novo pipeline we compared assembled transcriptomic and genomic sequencing data derived from the same experimental conditions. RNA-seq data for Drosophila development was assembled and matched to the H3K9Ac assembly using BLASTN. Of the 14,034 assembled transcript contigs, 12,744 of these could be matched to at least one H3K9Ac contig (E ≤ 1e-9; Fig. 7A). An example of a gene with differential mRNA expression and corresponding histone acetylation between embryo and larvae samples, showed an overlap of 790 base pairs as well as demonstrating the existence of an intron (Fig. 7B). Transcript contigs and acetylation contigs were each ranked from most significantly upregulated to most significantly downregulated. Genes were binned by degree of differential gene expression. Using a rank correlation analysis, a significant positive correlation was observed (Fig. 7C). These results demonstrate that genome-wide relationships between epigenomic and transcriptomic data can be recovered without a reference genome or transcriptome using our de novo method across multiple sequencing data sets.
Figure 7.
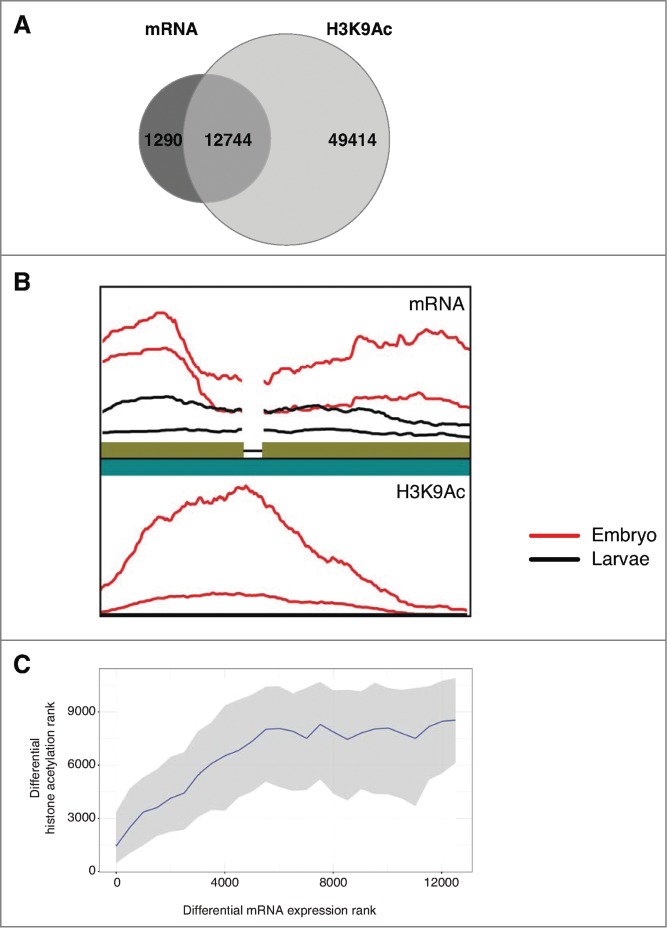
Relationships for epigenomic and transcriptomic signal are recoverable without a reference genome. Integrative analysis of de novo assembled fly development H3K9Ac and mRNA transcript data. (A) Overlap between H3K9Ac contigs and mRNA contigs. Transcript contigs were matched to acetylation contigs using BLASTN with E ≤ 1e-9. (B) Visualization of the matching of a contig pair showing the relative sequence read density of decreased acetylation and mRNA expression in larvae stage compared to embryo. Broken line indicates an exon junction. Sequence density plots are generated using ggpolt2 with a rectangular kernel, normalized by library size. (C) Differential mRNA rank compared to differential H3K9Ac rank in fly development. Ranks were calculated by signed -log10 (P-value) as determined by edgeR. Rank order bins of 500 mRNA contigs each were generated. For each bin the median and interquartile range is shown for the matched differential acetylation ranks (Spearman test: rho = 0.367, P < 2.2e-16).
Discussion
The current study presents a novel method for profiling genome-wide chromatin changes without a reference genome using de novo epigenome assembly. The implementation we describe incorporates established bioinformatics algorithms that have been described in different contexts in recent years. 19,23,24 Data generated by de novo sequence assembly was consistent with reference-based methods. In general this method identified a greater proportion of the genome as differential when compared to the standard binning scheme using a sliding window. Recent reports suggest that there remains no single gold-standard methodology for defining intervals of interest in epigenomic data sets and this could impact the distinction of chromatin marks.17,25,26 Contrasting peak-calling and sliding window analyses, our de novo method uses assembled contigs, thereby avoiding the need for arbitrary selection or optimization of interval size and shape parameters.
Our novel method was validated by the identification of significant genomic regions by intersecting de novo assemblies of public data with annotated genomic features. Using simulated read-extended data we demonstrated that fly_H3K9Ac had the highest read depth per genome size. This data set also scored the largest average contigs and mapped to a larger proportion of Drosophila gene bodies when compared to the mouse and human data sets. The mouse_MeDIP data set exhibited the lowest read depth per genome size and also scored the lowest average contig size. Read depth influences differential detection, and the fly_H3K9Ac data set accordingly identified a greater proportion of the genome with differential enrichment (3.9%) when compared to the mouse_MeDIP data set (0.0024%). Since base call error rates impact the quality of genome assemblies, stringent base quality filters are recommended for de novo epigenomic profiling.27,28 We showed that de novo assembly and mapping are achievable with 100 bp reads and this is compatible with most deep sequencing platforms. The strong correlation of results generated using de novo assembly and reference-based methods further validated our approach.
By matching assembled sequences from epigenomic and transcriptomic data sets derived from histone acetylation profiles, correlations were recovered in accordance with current understanding of the relationship of these modifications to transcription. Specifically, we identified positive associations between H3K9Ac and gene expression with transcriptional activation. These results demonstrate a novel approach to epigenomic profiling that is consistent with reference-based sequence assembly while offering greater scope to identify epigenetic enrichment.
Standard methods of epigenomic profiling that necessitate alignment of sequencing reads to an annotated reference genome have limited capacity to characterize epigenomes of the vast majority of known species. Since P. obesus belongs to the Muridae family (subfamily Gerbillinae), we mapped the sequence assembly to the mouse genome. Approximately 19% of P. obesus methylome contigs were matched in sequence to the mouse genome. Approximately 23% of mouse exons were matched with the P. obesus methylation contigs, with this association most likely attributable to the increased conservation of these coding regions. Dietary modulation of P. obesus represents an important model for the investigation of diabetes and associated complications. As a central regulator of energy homeostasis,29 the hypothalamus holds strong potential for discovery of gene changes implicated in the development of metabolic disorders in this animal model.30 Findings from clinical and epidemiological studies suggest that intrauterine factors, such as nutrition and growth, can be epigenetically assimilated during gestation and early postnatal development to direct metabolic function in adulthood.11-13 Indeed, several studies have linked these factors with altered DNA methylation at specific loci associated with glucose metabolism.11,31-33 De novo sequence assembly of methylomes derived from the hypothalamus of P. obesus fed high- and low-calorie prenatal diets revealed numerous DMRs.
The proposed pipeline complements existing transcriptome assembly analysis and was validated by demonstrating a strong correlation for a known relationship between an epigenome and gene expression data set. We have demonstrated the applicability of this method using public data and describe findings similar to those derived by reference-based methods. Moreover, results of our de novo assembly of the P. obesus methylome provide proof of principle for comprehensive mapping of differential epigenomic marks without a reference genome.
Materials and Methods
Reference-based epigenome analyses
Reads were aligned to the appropriate reference genome using the BWA aligner (version 0.6.2) using default settings.23 The number of uniquely mapped reads (mapQ ≥ 30) for 500 bp bins with a 250 bp base sliding window was summarized for the whole genome across all samples. Bins with mean count below 10 reads per sample were removed from downstream analysis. The edgeR (version 3.2.4) package from Bioconductor was used to determine the statistical significance of differential regions between the experimental groups using trimmed mean normalization and tagwise dispersion using a default prior N.19,34
Simulation of long read epigenomic data
Reads were aligned to the respective genome with the BWA aligner using default settings. Aligned reads were then extended in silico to 100 bp using genome build mm10, hg18 or dm3 for the appropriate species. Each of the reads was assigned quality strings derived from a real single-end Illumina Genome Analyzer IIx run (below). Sequencing errors were simulated by exchanging individual bases with random nucleotides at a rate proportional to the assigned base quality value of each base. The FASTX-toolkit version 0.0.13 fastq quality trimmer (http://hannonlab.cshl.edu/fastx_toolkit/) was used to eliminate bases with a quality score less than 30 from the 3′ end. Trimmed reads shorter than 30 bp were removed from further analysis.
Filtering of genomic features for sequence mappability
Mappability data sets were generated for each reference genome using the gem-mappability software.35 The mappability data sets were based on the read length of the original sequence data. The mappability data sets were used to remove regions of genomic features whose mappability score was <1.
De novo epigenome assembly of simulated reads
ABySS (version 1.2.7) was used for assembly of epigenomic data pooled from all samples to form contigs.24 A minimum coverage threshold of 3 was used. As the assembly is influenced by selected k-mer parameter, we selected a k-mer that produced the largest assembly after elimination of contigs shorter than 100 bp. For the Drosophila ChIP-seq data, there was no apparent local maximum of assembly size observed in the appropriate k-mer range 30-60 so a k-mer of 31 was selected for that data set.
Comparison of reference based and de novo analyses
Assembled contigs were annotated by mapping them to the appropriate reference genome to generate genomic intervals using the BWA-MEM algorithm (version 0.7.5a-r405).36 The signed -log 10(P-value) was used to score each contig in the de novo and reference based method. The results of the de novo pipeline were compared to the results generated by a sliding window approach by calculating the genome wide overlap using Bed Tools (version 2.16.2) between merged sliding window differential regions and de novo based regions defined by P-values ≤ 1e-5.37
P. obesus experimentation
Animals were maintained in accordance with the Code of Practice of the National Health and Medical Research Council of Australia, and all procedures were carried out subject to the approval of the Deakin University Animal Ethics Committee. A colony of outbred P. obesus is maintained at Deakin University, Geelong, Australia. All animals were housed in a temperature-controlled room (22 ± 1°C) with a 12-12 h light-dark cycle (light 06:00–18:00 h). Breeding pairs were randomly allocated to one of two diets: A) standard diet (20% kcal/fat, 64% kcal/carbohydrate, 16% kcal/protein; total digestible energy 15 MJ/kg; n = 20 breeding pairs) or; B) low fat diet (10% kcal/fat, 74% kcal/carbohydrate, 16% kcal/protein; total digestible energy 18 MJ/Kg; n = 30 breeding pairs). The animals had ad libitum access to food and water. Offspring were weaned on to the low fat diet at 4 weeks of age and given ad libitum access, resulting in 2 experimental groups: 1) male offspring of animals fed a low fat diet and weaned on to the low fat diet (male low-low) and; 2) male offspring of animals fed a standard diet and weaned on to the low fat diet (male standard-low). Body weight was measured at 8, 12 and 16 weeks of age. Two hour fasted blood glucose (Accuchek II, Roche) and plasma insulin (ELISA, Caymen Chemicals) levels were measured at 8, 12 and 16 weeks of age. All animals were sacrificed by anesthetic overdose (pentobarbitone 120 mg/kg) at 16 weeks of age, and the whole hypothalamus was immediately collected and snap frozen in liquid nitrogen, then stored at −80°C.
Methylome profiling of the P. obesus hypothalamus
Methyl-binding domain enrichment sequencing (MBD-seq) was used to analyze the P. obesus methylome. DNA was isolated from hypothalamus homogenate using the Qiagen DNeasy Kit. High molecular weight genomic DNA integrity was confirmed by agarose gel electrophoresis and quantified by Qubit fluorometer (Life Technologies). Purified DNA was fragmented by sonication using the BioRuptor (Diagenode), and this was confirmed by capillary electrophoresis on the MultiNA (Shimadzu) using the DNA-2500 kit (cat#292-27912-91). Five hundred nanograms of fragmented genomic DNA was used for methyl-CpG enrichment using the MethylMiner system (Life Technologies) following the manufacturer's instructions (cat# ME10025). DNA was eluted from the Methyl-CpG Binding Domain-coupled magnetic beads with 2 M NaCl. Eluted DNA was quantified with Qubit and 5 ng of this DNA was used for sequencing library preparation using the NEB-Next DNA Library Preparation Kit (New England Biolabs) according to the manufacturer's protocol (cat#E6040S). Amplified libraries were quantified on MultiNA (Shimadzu) using the DNA-500 kit (cat#292-27910-91). Cluster generation was performed on cBot (Illumina) using version 4 Cluster Generation kits (single end sequencing, cat# GD-300-100), and the flow cell was processed on Genome Analyzer IIx (Illumina) with 151 cycles using version 4 SBS kits (cat#FC-104-4001). Base calling was performed by the Illumina RTA software version 1.8. Fastx quality trimmer was used to remove low quality bases from the 3’ end of the sequence read at a base quality threshold of 30. Reads shorter than 40 bp were discarded.
P. obesus methylome assembly and annotation
Following quality trimming, reads for all samples were combined and assembled using ABySS with variable k-mer parameter and coverage threshold of 3. The largest assembly after elimination of contigs smaller than 100 bp was used for downstream analysis. Methylome assembly contigs were screened for homology to the mouse genome (Ensembl version GRCm38.70/mm10), with BLASTN (BLAST 2.2.23+) using default search parameters.38 Contigs were assigned an annotation based upon the closest gene to the BLASTN match coordinates on the mouse genome (Ensembl genome annotation version GRCm38.70), using an E-value threshold of E < 1e-9.
Epigenomic quantification and differential analysis of P. obesus MBD-seq
Reads were aligned to the newly generated P. obesus methylome using the BWA-MEM algorithm. The reads for each contig were counted for each sample with a minimum mapping quality of 30. Differential contigs between sample groups were determined using edgeR groups using trimmed mean normalization and tagwise dispersion using a default prior N. These counts were transformed into a count matrix of samples and contigs. Contigs without an annotated homologous region in the mouse with a BLASTN E-value < 1e-7 were not included in downstream analysis.
Validation of differential methylation by quantitative PCR
To validate the differential methylation profiles identified by our bioinformatics analysis of the P. obesus hypothalamus methylome, we used quantitative PCR (qPCR) to analyze the MBD enriched fractions with FastStart Universal SYBR Green Master (Rox) (Roche) (cat#04913914001). The following oligonucleotides were used: Oxct2a region1 5′-GTCACCATGGAACACTGCAC-3′ and 5′-CTTTAAACACGGCCTTCTCG-3′; Havcr2 5′-CAGAGGCTCGCTGTCTCTCT-3′ and 5′-TCAGAACGTTTGTTCCCACA-3′. Thermal cycling was performed on Applied Biosystems 7500 Fast Real-Time PCR System as follows: 94°C for 2 min followed by 40 cycles of 94°C for 15 s, 55°C for 15 s, 68°C for 30 s and final extension at 68°C for 5 min. Differential enrichment was calculated as a proportion of the input signal and products generated were analyzed on the MultiNA bioanalyzer (DNA-500 kit) to confirm the presence of a single amplicon. Statistical significance was determined by a one tailed Student's t-test.
Transcriptome data simulation and analysis
Downloaded short reads were aligned to the dm3 RefSeq transcriptome with the BWA algorithm using default settings. Reads were extended in silico to 100 bp using the dm3 RefSeq transcriptome. Each read was assigned quality strings derived from a real single-end Genome Analyzer IIx run. FASTX-toolkit fastq quality trimmer was used to eliminate bases with a quality score less than 30 from the 3’ end. Reads shorter than 30 bp were removed from further analysis. Base miscalls were incorporated at a rate proportional to the assigned base quality value of each base.
Trinity (Release-2012-01-25) was used for assembly of transcriptomic data pooled from all samples to generate contigs using default settings.39 Each assembled transcript contig was annotated with its top BLASTN match to the epigenomic assembly, with a minimum E-value of 1e-9. Reads were aligned to the de novo generated reference transcriptome using the BWA-MEM algorithm. The reads for each contig were counted using SAMtools (v 0.1.19-44428cd) with a minimum mapping quality of 30 to avoid ambiguous alignments.40 These counts were summarized as a count matrix of samples and contigs. Differential transcripts between sample groups were determined using edgeR.
Disclosure of Potential Conflicts of Interest
No potential conflicts of interest were disclosed.
Funding
The authors acknowledge grant and fellowship support from the National Health and Medical Research Council (NHMRC) as well as the support from the Moshe Meydan Donation. A.E-O. is a NHMRC Senior Research Fellow. Supported in part by the Victorian Government's Operational Infrastructure Support Program.
Supplemental Material
Supplemental data for this article can be accessed on the publisher's website.
References
- 1.Bernstein BE, Meissner A, Lander ES. The mammalian epigenome. Cell 2007; 128:669-81; PMID:17320505; http://dx.doi.org/ 10.1016/j.cell.2007.01.033 [DOI] [PubMed] [Google Scholar]
- 2.Encode Project Consortium, Bernstein BE, Birney E, Dunham I, Green ED, Gunter C, Snyder M. An integrated encyclopedia of DNA elements in the human genome. Nature 2012; 489:57-74; PMID:22955616; http://dx.doi.org/ 10.1038/nature11247 [DOI] [PMC free article] [PubMed] [Google Scholar]
- 3.Johnson DS, Mortazavi A, Myers RM, Wold B. Genome-wide mapping of in vivo protein-DNA interactions. Science 2007; 316:1497-502; PMID:17540862; http://dx.doi.org/ 10.1126/science.1141319 [DOI] [PubMed] [Google Scholar]
- 4.Harris RA, Wang T, Coarfa C, Nagarajan RP, Hong C, Downey SL, Johnson BE, Fouse SD, Delaney A, Zhao Y, et al. Comparison of sequencing-based methods to profile DNA methylation and identification of monoallelic epigenetic modifications. Nat Biotechnol 2010; 28:1097-105; PMID:20852635; http://dx.doi.org/ 10.1038/nbt.1682 [DOI] [PMC free article] [PubMed] [Google Scholar]
- 5.Schmidt-Nielsen K, Haines HB, Hackel DB. Diabetes Mellitus in the Sand Rat Induced by Standard Laboratory Diets. Science 1964; 143:689-90; PMID:14081240; http://dx.doi.org/ 10.1126/science.143.3607.689 [DOI] [PubMed] [Google Scholar]
- 6.Saidi T, Mbarek S, Omri S, Behar-Cohen F, Chaouacha-Chekir RB, Hicks D. The sand rat, Psammomys obesus, develops type 2 diabetic retinopathy similar to humans. Invest Ophthalmol Vis Sci 2011; 52:8993-9004; PMID:21989730; http://dx.doi.org/ 10.1167/iovs.11-8423 [DOI] [PubMed] [Google Scholar]
- 7.Walder KR, Fahey RP, Morton GJ, Zimmet PZ, Collier GR. Characterization of obesity phenotypes in Psammomys obesus (Israeli sand rats). Int J Exp Diabetes Res 2000; 1:177-84; PMID:11467408; http://dx.doi.org/ 10.1155/EDR.2000.177 [DOI] [PMC free article] [PubMed] [Google Scholar]
- 8.Collier GR, McMillan JS, Windmill K, Walder K, Tenne-Brown J, de Silva A, Trevaskis J, Jones S, Morton GJ, Lee S, et al. Beacon: a novel gene involved in the regulation of energy balance. Diabetes 2000; 49:1766-71; PMID:11078442; http://dx.doi.org/ 10.2337/diabetes.49.11.1766 [DOI] [PubMed] [Google Scholar]
- 9.Jowett JB, Elliott KS, Curran JE, Hunt N, Walder KR, Collier GR, Zimmet PZ, Blangero J. Genetic variation in BEACON influences quantitative variation in metabolic syndrome-related phenotypes. Diabetes 2004; 53:2467-72; PMID:15331561; http://dx.doi.org/ 10.2337/diabetes.53.9.2467 [DOI] [PubMed] [Google Scholar]
- 10.Cummings N, Shields KA, Curran JE, Bozaoglu K, Trevaskis J, Gluschenko K, Cai G, Comuzzie AG, Dyer TD, Walder KR, et al. Genetic variation in SH3-domain GRB2-like (endophilin)-interacting protein 1 has a major impact on fat mass. Int J Obes (Lond) 2012; 36:201-6; PMID:21407171; http://dx.doi.org/ 10.1038/ijo.2011.67 [DOI] [PubMed] [Google Scholar]
- 11.Heijmans BT, Tobi EW, Stein AD, Putter H, Blauw GJ, Susser ES, Slagboom PE, Lumey LH. Persistent epigenetic differences associated with prenatal exposure to famine in humans. Proc Natl Acad Sci U S A 2008; 105:17046-9; PMID:18955703; http://dx.doi.org/ 10.1073/pnas.0806560105 [DOI] [PMC free article] [PubMed] [Google Scholar]
- 12.Li Y, He Y, Qi L, Jaddoe VW, Feskens EJ, Yang X, Ma G, Hu FB. Exposure to the Chinese famine in early life and the risk of hyperglycemia and type 2 diabetes in adulthood. Diabetes 2010; 59:2400-6; PMID:20622161; http://dx.doi.org/ 10.2337/db10-0385 [DOI] [PMC free article] [PubMed] [Google Scholar]
- 13.Keating ST, El-Osta A. Epigenetic changes in diabetes. Clin Genet 2013; 84:1-10; PMID:23398084; http://dx.doi.org/ 10.1111/cge.12121 [DOI] [PubMed] [Google Scholar]
- 14.Celniker SE, Dillon LA, Gerstein MB, Gunsalus KC, Henikoff S, Karpen GH, Kellis M, Lai EC, Lieb JD, MacAlpine DM, et al. Unlocking the secrets of the genome. Nature 2009; 459:927-30; PMID:19536255; http://dx.doi.org/ 10.1038/459927a [DOI] [PMC free article] [PubMed] [Google Scholar]
- 15.Ross-Innes CS, Stark R, Teschendorff AE, Holmes KA, Ali HR, Dunning MJ, Brown GD, Gojis O, Ellis IO, Green AR, et al. Differential oestrogen receptor binding is associated with clinical outcome in breast cancer. Nature 2012; 481:389-93; PMID:22217937 [DOI] [PMC free article] [PubMed] [Google Scholar]
- 16.Grimm C, Chavez L, Vilardell M, Farrall AL, Tierling S, Bohm JW, Grote P, Lienhard M, Dietrich J, Timmermann B, et al. DNA-methylome analysis of mouse intestinal adenoma identifies a tumour-specific signature that is partly conserved in human colon cancer. PLoS Genet 2013; 9:e1003250; PMID:23408899; http://dx.doi.org/ 10.1371/journal.pgen.1003250 [DOI] [PMC free article] [PubMed] [Google Scholar]
- 17.Young MD, Willson TA, Wakefield MJ, Trounson E, Hilton DJ, Blewitt ME, Oshlack A, Majewski IJ. ChIP-seq analysis reveals distinct H3K27me3 profiles that correlate with transcriptional activity. Nucleic Acids Res 2011; 39:7415-27; PMID:21652639; http://dx.doi.org/ 10.1093/nar/gkr416 [DOI] [PMC free article] [PubMed] [Google Scholar]
- 18.Soneson C, Delorenzi M. A comparison of methods for differential expression analysis of RNA-seq data. BMC Bioinformatics 2013; 14:91; PMID:23497356; http://dx.doi.org/ 10.1186/1471-2105-14-91 [DOI] [PMC free article] [PubMed] [Google Scholar]
- 19.Robinson MD, McCarthy DJ, Smyth GK. edgeR: a Bioconductor package for differential expression analysis of digital gene expression data. Bioinformatics 2010; 26:139-40; PMID:19910308; http://dx.doi.org/ 10.1093/bioinformatics/btp616 [DOI] [PMC free article] [PubMed] [Google Scholar]
- 20.Jothi R, Cuddapah S, Barski A, Cui K, Zhao K. Genome-wide identification of in vivo protein-DNA binding sites from ChIP-Seq data. Nucleic Acids Res 2008; 36:5221-31; PMID:18684996; http://dx.doi.org/ 10.1093/nar/gkn488 [DOI] [PMC free article] [PubMed] [Google Scholar]
- 21.Mikkelsen TS, Ku M, Jaffe DB, Issac B, Lieberman E, Giannoukos G, Alvarez P, Brockman W, Kim TK, Koche RP, et al. Genome-wide maps of chromatin state in pluripotent and lineage-committed cells. Nature 2007; 448:553-60; PMID:17603471; http://dx.doi.org/ 10.1038/nature06008 [DOI] [PMC free article] [PubMed] [Google Scholar]
- 22.Rozowsky J, Euskirchen G, Auerbach RK, Zhang ZD, Gibson T, Bjornson R, Carriero N, Snyder M, Gerstein MB. PeakSeq enables systematic scoring of ChIP-seq experiments relative to controls. Nat Biotechnol 2009; 27:66-75; PMID:19122651; http://dx.doi.org/ 10.1038/nbt.1518 [DOI] [PMC free article] [PubMed] [Google Scholar]
- 23.Li H, Durbin R. Fast and accurate short read alignment with Burrows-Wheeler transform. Bioinformatics 2009; 25:1754-60; PMID:19451168; http://dx.doi.org/ 10.1093/bioinformatics/btp324 [DOI] [PMC free article] [PubMed] [Google Scholar]
- 24.Simpson JT, Wong K, Jackman SD, Schein JE, Jones SJ, Birol I. ABySS: a parallel assembler for short read sequence data. Genome Res 2009; 19:111; 7-23; PMID:19251739; http://dx.doi.org/ 10.1101/gr.089532.108 [DOI] [PMC free article] [PubMed] [Google Scholar]
- 25.Kaspi A, Ziemann M, Rafehi H, Lazarus R, El-Osta A. A pipeline for the identification and characterization of chromatin modifications derived from ChIP-Seq datasets. Biochimie 2012; 94:2353-9; PMID:22705386; http://dx.doi.org/ 10.1016/j.biochi.2012.06.002 [DOI] [PubMed] [Google Scholar]
- 26.Micsinai M, Parisi F, Strino F, Asp P, Dynlacht BD, Kluger Y. Picking ChIP-seq peak detectors for analyzing chromatin modification experiments. Nucleic Acids Res 2012; 40:e70; PMID:22307239 [DOI] [PMC free article] [PubMed] [Google Scholar]
- 27.Lin Y, Li J, Shen H, Zhang L, Papasian CJ, Deng HW. Comparative studies of de novo assembly tools for next-generation sequencing technologies. Bioinformatics 2011; 27:2031-7; PMID:21636596; http://dx.doi.org/ 10.1093/bioinformatics/btr319 [DOI] [PMC free article] [PubMed] [Google Scholar]
- 28.Li R, Zhu H, Ruan J, Qian W, Fang X, Shi Z, Li Y, Li S, Shan G, Kristiansen K, et al. De novo assembly of human genomes with massively parallel short read sequencing. Genome Res 2010; 20:265-72; PMID:20019144; http://dx.doi.org/ 10.1101/gr.097261.109 [DOI] [PMC free article] [PubMed] [Google Scholar]
- 29.Sainsbury A, Cooney GJ, Herzog H. Hypothalamic regulation of energy homeostasis. Best Pract Res Clin Endocrinol Metab 2002; 16:623-37; PMID:12468411; http://dx.doi.org/ 10.1053/beem.2002.0230 [DOI] [PubMed] [Google Scholar]
- 30.Trevaskis J, McMillan JS, Windmill K, Walder K, Collier GR. Identificativon of hypothalamic genes implicated in the development of obesity in Psammomys obesus using differential display PCR. Comp Biochem Physiol B Biochem Mol Biol 2004; 137:65-73; PMID:14698911; http://dx.doi.org/ 10.1016/j.cbpc.2003.10.004 [DOI] [PubMed] [Google Scholar]
- 31.Park JH, Stoffers DA, Nicholls RD, Simmons RA. Development of type 2 diabetes following intrauterine growth retardation in rats is associated with progressive epigenetic silencing of Pdx1. J Clin Invest 2008; 118:2316-24; PMID:18464933; http://dx.doi.org/ 10.1172/JCI32011 [DOI] [PMC free article] [PubMed] [Google Scholar]
- 32.Fu Q, Yu X, Callaway CW, Lane RH, McKnight RA. Epigenetics: intrauterine growth retardation (IUGR) modifies the histone code along the rat hepatic IGF-1 gene. FASEB J 2009; 23:2438-49; PMID:19364764; http://dx.doi.org/ 10.1096/fj.08-124768 [DOI] [PMC free article] [PubMed] [Google Scholar]
- 33.Tobi EW, Lumey LH, Talens RP, Kremer D, Putter H, Stein AD, Slagboom PE, Heijmans BT. DNA methylation differences after exposure to prenatal famine are common and timing- and sex-specific. Hum Mol Genet 2009; 18:4046-53; PMID:19656776; http://dx.doi.org/ 10.1093/hmg/ddp353 [DOI] [PMC free article] [PubMed] [Google Scholar]
- 34.Robinson MD, Oshlack A. A scaling normalization method for differential expression analysis of RNA-seq data. Genome Biol 2010; 11:R25; http://dx.doi.org/ 10.1186/gb-2010-11-3-r25 [DOI] [PMC free article] [PubMed] [Google Scholar]
- 35.Derrien T, Estelle J, Marco Sola S, Knowles DG, Raineri E, Guigo R, Ribeca P. Fast computation and applications of genome mappability. PLoS One 2012; 7:e30377; http://dx.doi.org/ 10.1371/journal.pone.0030377 [DOI] [PMC free article] [PubMed] [Google Scholar]
- 36.Li H. Aligning sequence reads, clone sequences and assembly contigs with BWA-MEM. Submitted. Preprint available at arXiv:1303.3997, 2013. [Google Scholar]
- 37.Quinlan AR, Hall IM. BEDTools: a flexible suite of utilities for comparing genomic features. Bioinformatics 2010; 26:841-2; PMID:20110278; http://dx.doi.org/ 10.1093/bioinformatics/btq033 [DOI] [PMC free article] [PubMed] [Google Scholar]
- 38.Altschul SF, Gish W, Miller W, Myers EW, Lipman DJ. Basic local alignment search tool. J Mol Biol 1990; 215:403-10; PMID:2231712; http://dx.doi.org/ 10.1016/S0022-2836(05)80360-2 [DOI] [PubMed] [Google Scholar]
- 39.Grabherr MG, Haas BJ, Yassour M, Levin JZ, Thompson DA, Amit I, Adiconis X, Fan L, Raychowdhury R, Zeng Q, et al. Full-length transcriptome assembly from RNA-Seq data without a reference genome. Nat Biotechnol 2011; 29:644-52; PMID:21572440; http://dx.doi.org/ 10.1038/nbt.1883 [DOI] [PMC free article] [PubMed] [Google Scholar]
- 40.Li H, Havndsaker B, Wysoker A, Fennell T, Ruan J, Homer N, Marth G, Abecasis G, Durbin R, Genome Project Data Processing S. The Sequence Alignment/Map format and SAMtools. Bioinformatics 2009; 25:2078-9; PMID:19505943; http://dx.doi.org/ 10.1093/bioinformatics/btp352 [DOI] [PMC free article] [PubMed] [Google Scholar]
Associated Data
This section collects any data citations, data availability statements, or supplementary materials included in this article.