

Abstract
Prenatal exposure to neurotoxicants such as lead (Pb) may cause stable changes in the DNA methylation (5mC) profile of the fetal genome. However, few studies have examined its effect on the DNA de-methylation pathway, specifically the dynamic changes of the 5-hydroxymethylcytosine (5hmC) profile. Therefore, in this study, we investigate the relationship between Pb exposure and 5mC and 5hmC modifications during early development. To study the changes in the 5hmC profile, we use a novel modification of the Infinium™ HumanMethylation450 assay (Illumina, Inc.), which we named HMeDIP-450K assay, in an in vitro human embryonic stem cell model of Pb exposure. We model Pb exposure-associated 5hmC changes as clusters of correlated, adjacent CpG sites, which are co-responding to Pb. We further extend our study to look at Pb-dependent changes in high density 5hmC regions in umbilical cord blood DNA from 48 mother-infant pairs from the Early Life Exposure in Mexico to Environmental Toxicants (ELEMENT) cohort. For our study, we randomly selected umbilical cord blood from 24 male and 24 female children from the 1st and 4th quartiles of Pb levels. Our data show that Pb-associated changes in the 5hmC and 5mC profiles can be divided into sex-dependent and sex-independent categories. Interestingly, differential 5mC sites are better markers of Pb-associated sex-dependent changes compared to differential 5hmC sites. In this study we identified several 5hmC and 5mC genomic loci, which we believe might have some potential as early biomarkers of prenatal Pb exposure.
Keywords: clusters, CpG islands, HM450K, HMeDIP-450K, lead, umbilical cord blood, 5-hydroxymethylcytosine, 5-methylcytosine
Abbreviations
- Aclust
A-clustering approach for grouping HM450K CpG sites into clusters based on correlations
- CpG island
CpG islands are usually in the promoter and 5' untranslated regions of genes
- CpG
sites, CG dinucleotide methylation site in the genome corresponding with probes on HM450K
- DhMRs
Differentially Hydroxymethylated regions (clusters) identified by GEE
- DMRs
Differentially methylated regions (clusters) identified by GEE
- ELEMENT
Early Life Exposure in Mexico to Environmental Toxicants
- GEE
Generalized Estimating Equations, used to measure the estimated change in DNA methylation in co-regulated regions of the genome
- HM450K
Infinium Human Methylation 450K BeadChip array from Illumina
- HMeDIP-450K
Infinium Human Methylation 450K BeadChip array from Illumina coupled with immunoprecipitation with 5hmC antibodies
- hMRs
Hydroxymethylated regions (clusters) identified by A-clustering
- LINE-1
Long Interspersed Element 1, a common retrotransposon in humans
- MRs
Methylation regions (clusters) identified by A-clustering
Introduction
Lead (Pb) is a pervasive environmental neurotoxicant which can have serious adverse effects on neurodevelopment in children. Early life exposure to Pb has been associated with a significant deterioration in cognitive abilities, an increase in instances of childhood delinquency and an enhanced susceptibility to neurodegenerative disorders.1-3 The placenta does not provide an effective barrier against Pb.4,5 Therefore, maternal exposure remains a significant source of exposure to the fetus. Evidence from several animal and human studies has suggested that one of the main mechanism by which Pb exposure may exert its effect is via the alteration of the DNA methylation (5mC) status of the genome. DNA methylation is the addition of a methyl group to 5′ end of a cytosine or a guanine, which is mediated by enzymes called DNA methyltransferases (DNMTs).6 Pilsner et al., 2009 reported an inverse dose-response relationship between LINE-1 methylation levels in umbilical cord blood and patella lead from the mothers, and a similar inverse correlation between Alu repeat elements and tibia lead from the mothers.7 This result suggests that genomic methylation level may be associated with the maternal Pb burden. Schneider et al., 2012 reported that low level Pb exposure in post weaning rats can cause increased expression of DNMT 1 in the frontal cortex, providing indirect evidence that Pb exposure can affect the 5mC profile of genome.8 5mC can be oxidized by a family of dioxygenases called ten-eleven-translocation enzymes (TET) into 5-hydroxymethylcytosine (5hmC). 5hmCs are abundant in the mature brain, which suggests that they play a crucial role in brain development.9,10 Studies with embryonic stem cells have shown an enrichment of 5hmCs in actively transcribed promoters in mouse and in enhancer and gene body regions in humans, which suggest significant association with regulation of gene expression.11,12 Furthermore, evidence suggests that the 5hmC profile show a better correlation with gene expression compared to 5mC.13 Zhang et al., 2014 reported a marked increase in total 5hmC levels in the heart and spleen of rats exposed to physiologically relevant levels of Arsenic (As) through drinking water.14 An association between arsenic metabolism and global DNA hydroxymethylation has also been reported in humans.15 Therefore, in light of this recent evidence we hypothesized that Pb exposure may exert its neurotoxic effects in humans through the alteration of the genomic 5hmC profile.
Methylation signatures are often localized in specific regions across the genome known as CpG Islands. Increase in methylation in the CpG islands located in the promoter regions (CGI promoters) of a gene prevent the binding of transcription factors and promote recruitment of methyl binding proteins such as MECP2 which results in epigenetic silencing of the gene.16-18 Conversely, increase in methylation in the gene body has been associated with increased transcription of the gene.19These regions often exhibit similar behavior in response to environmental stimuli and can be assigned to specific clusters or co-regulated regions on the basis of a correlation between their methylation signatures and bases pair distance.20 Therefore, in this study, we first define co-regulated regions of the genome, independent of any exposure or classifier data and then fit a generalized estimating equation to measure the effect of exposure on these regions. This approach, called adjacent site clustering (A-clustering), was proposed by Sofer et al., 2012 and has been shown to perform significantly better than a similar method called “bump hunting”.20,21 Furthermore, we believe that studying exposure-associated changes in 5mC and 5hmC as co-regulated regions is more biologically relevant because DNMT1, DNMT3a and TET proteins act on multiple sites in a small region when they bind to DNA.22 These Pb-targeted co-regulated regions can influence a variety of biological processes including binding of transcription factors and may serve as putative epigenetic biomarkers for Pb exposure. Although several studies support the role of Pb exposure in altering the DNA methylation profile in humans,7,23,24 little is known about the effects of Pb exposure on the DNA hydroxymethylation profile.
To address these issues, in this paper we focused on the identification and mapping of candidate regions with high density of 5hmCs, which are co-regulated by Pb. For enrichment of high density regions of 5hmC modification, we generated randomly-sheared DNA fragments and immunoprecipitated (IP) them with 5hmC specific antibodies. Due to the limited sensitivity of the antibodies, only fragments with large numbers of 5hmC sites were expected to be precipitated. Then we used the high-throughput Infinium™ HumanMethylation450 (HM450K) array (Illumina, Inc.,) to determine the 5hmC profile of the IP'ed fragments. We named this novel modification of the HM450K array the LF array. Using this approach we show that human embryonic stem cells (hESCs) exposed to 0.8 μM and 1.5 μM Lead Acetate (PbAc), which are in the range of normal human exposures, have significant changes in high density 5hmC clusters. We further validated the 5hmC clusters identified by the HMeDIP-450K assay using a bisulfite-conversion-independent 5hmC detection technique called Pvu-Seq, which uses the enzyme PvuRts1i to cleave DNA near 5hmC sites, and is described in one of our recent publications.25
Prenatal exposure to environmental toxicants might lead to epigenetic reprogramming of the fetus. As DNA methylation is a mitotically stable epigenetic modification, prenatal exposures can in this manner interact with the genome and cause increased susceptibility to adult diseases (Barker hypothesis).26 It has been suggested that these early epigenetic changes can be monitored in the umbilical cord blood DNA and might serve as suitable biomarkers for developmental effects of prenatal exposure.27,28 External factors have been shown to accentuate sex-specific differences in DNA methylation. For example, preferential grooming of male rats by mothers over female rats is correlated with higher level of methylation in the 5' region flanking the promoter of the estrogen receptor α (ERα) gene in males.29 An epidemiological study conducted by Liu et al., 2010 on buccal swabs collected from adult volunteers, showed a large number of locus-specific DNA methylation differences in autosomes.30 These reports indirectly suggest that the DNA methylation status of the genome may be affected by environmental exposures in a sex-specific manner. Interestingly, a recent report by Faulk et al., 2013 suggested that early life Pb exposure had a more profound effect on the DNA methylation status of the metastable epiallele Avy in male infant mice compared to female infant mice. Therefore, in lieu of recent evidence, we hypothesize that locus specific differences in DNA methylation and possibly hydroxymethylation is dependent on the sex of the infant. In the second part of this study, we determined whether there is a sex-dependent association between prenatal Pb exposure and 5mC and 5hmC profiles. In this population study, we again used the HM450K and HMeDIP-450K assays, described in the first part of this study, and analyzed DNA extracted from umbilical cord blood (UCB) sample of 48 mother-infant pairs from the well-characterized ELEMENT (cohort from Mexico City, Mexico).7
Results
Acute exposure to Pb modifies the DNA hydroxymethylation (5hmC) profile of hESCs
The raw β values (i.e., fraction of the DNA that is methylated, with values between 0.0 and 1.0) obtained from the HM450K array have a bimodal distribution with the left peak representing un-methylated CpG sites and the right peak representing the methylated CpG sites.31 Combination of the 5hmC immunoprecipitation (IP) with the HM450K array generates a considerably different β value distribution (Fig. S1). The distribution is characterized by a central peak, which is most likely due to the accumulation of HM450K probes that mapped to DNA fragments poorly isolated by IP (Fig. S1A). Applying the background and color bias correction for raw data (.idat) files effectively eliminates this peak (Fig. S1B). This filter is implemented as a part of most of the recent HM450K normalization pipelines such as methylumi.32Therefore, no extra analysis step is required for normalization of the data. It is reasonable to assume that the TET proteins responsible for converting 5mC to 5hmC act over a stretch of DNA rather than single nucleotide at a time. We speculated that the 5mCs and 5hmCs occur in clusters and that the most likely scenario is that very few of the IP‘ed DNA fragments will contain both types of modifications. Based on this premise and the knowledge of the average fragment size of IP’ed DNA (∼300 to 600 bps), we clustered adjacent CpG sites into regions dependent on the correlation between β values (d = 0.25) and base pair distance cutoff ≤300 bps. The regions with ≥ 5 CpG sites (1909 putative clusters consisting of 12929 CpG sites) were considered for further differential hydroxymethylation analysis. The cut-off of 5 probes was decided arbitrarily. We defined these clusters/regions as co-regulated high density 5hmC regions (hMRs). Among 12929 CpG sites mapping to 1909 hMRs, which have different β values that are dependent on the Pb concentration (Fig. 1A), 5333 (∼41%) mapped to within 1500 bps of transcription start sites (TSS). Independent of the β values, the density distribution of these hydroxymethylated CpG sites gradually decreased when moving away from the TSS (Figs. 1B-D).
Figure 1.
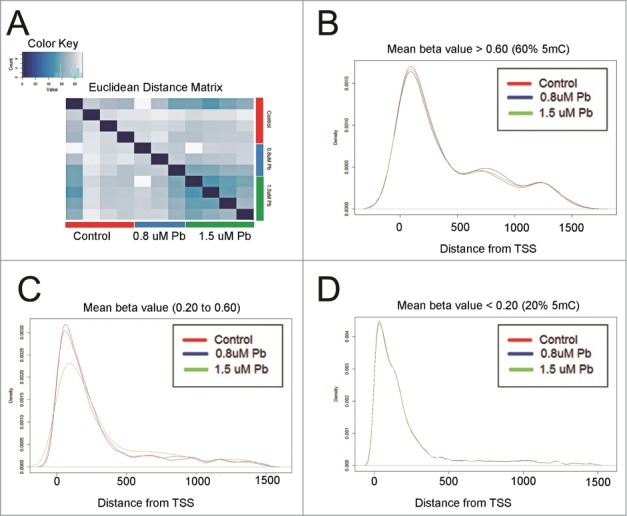
Characterization of CpG sites in putative 5hmC clusters. (A) Heatmap representation of Euclidean distance matrix between control hESCs and hESCs exposed to Pb (0.8 μM and 1.5 μM for 12929 CpG sites mapping to 1909 hMRs. (B) Distribution of CpG sites with β values ≥ 0.60 or 60% within 1500 bps on either side of transcription start sites. (C) Distribution of CpG sites with β values ≥ 0.20 or 20% and ≤ 0.60 or 60% within 1500 bps on either side of transcription start sites. (D) Distribution of CpG sites with β values ≤ 0.20 or 20% within 1500 bps on either side of transcription start sites.
We further investigated the hMRs for statistically significant Pb exposure dependent differences in 5hmCs; i.e., differentially hydroxymethylated regions (DhMRs). We found that exposure to 0.8 μM Pb caused a ≥ 2% increase in 5hmCs in 36 DhMRs and a ≤ 2% decrease in 70 DhMRs at a FDR corrected significance cut-off of 0.05 (Fig. 2A). Similarly, exposure to 1.5 μM Pb concentrations caused a ≥ 2% increase in 5hmC in 38 DhMRs and a ≤ 2% decrease in 162 DhMRs at a FDR corrected significance cut-off of 0.05 (Fig. 2B). These data indicate that Pb exposure causes a decrease in a majority of affected 5hmC loci. The DhMRs for hESCs exposed to 0.8 μM and 1.5 μM Pb mapped to 91 and 167 genes, and 45 genes were common between them. Gene ontology analysis for hESCs exposed to 0.8 μM Pb revealed enrichment of genes for categories associated with processing of mRNA such as RNA phosphodiester bond hydrolysis, endonucleolytic (GO: 0090502, P-value = 0.00040) and pyrimidine deoxyribonucleotide metabolic process (GO: 0009219, P-value =0.0025). For hESCs exposed to 1.5 μM Pb, gene ontology categories were associated with cellular proliferation associated processes such as cell division (GO:0051301, P-value = 1.16E-05), mitosis (GO:0007067, P-value = 0.00013) (Table S1). Table 1 highlights some of the representative genes which show a Pb-dependent change in 5hmC in putative DhMRs.
Figure 2.
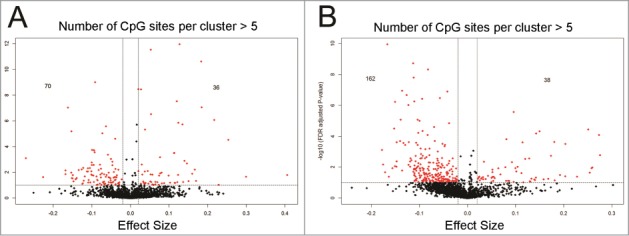
Number of differentially hydroxymethylated clusters (DhMRs) detected at a FDR corrected P-value cut-off ≤ 0.05, effect size ≥ |0.02| or |2%| and number of CpG site per cluster ≥ 5 for hESCs exposed to (A) 0.8 μM or (B) 1.5 μM Pb. Exposure to 0.8 μM Pb caused ≥ 2% increase in 5hmC in 36 hMRs and ≤ 2% decrease in 70 hMRs. Exposure to 1.5 μM Pb concentrations caused ≥ 2% increase in 5hmC in 38 hMRs and ≤ 2% decrease in 162 hMRs.
Table 1.
Differentially hydroxymethylated (5hmC) regions (DhMRs) for representative genes in hESCs exposed to either 0.8 μM Pb or 1.5 μM Pb. These clusters can be used as potential early 5hmC biomarkers of Pb exposure.
| Pb exposure (μM) | Gene | CpG Island | Promoter associated | Effect size | Standard error | P-value | FDR | Number of sites per cluster |
|---|---|---|---|---|---|---|---|---|
| 0.8 | ATP5G1 | chr17:46969695-46970125 | yes | −0.078 | 0.023 | 0.000631 | 0.015042 | 7 |
| 0.8 | ATPAF1 | chr1:47133674-47134395 | yes | 0.028 | 0.004 | 1.50E-11 | 3.59E-09 | 7 |
| 0.8 | ETHE1 | chr19:44031127-44031504 | yes | −0.063 | 0.011 | 2.21E-08 | 2.63E-06 | 6 |
| 0.8 | HSD17B4 | chr5:118788125-118788428 | yes | −0.074 | 0.021 | 0.000459 | 0.011862 | 6 |
| 0.8 | AGO2 | chr8:141646075-141646514 | yes | −0.073 | 0.014 | 9.40E-08 | 9.27E-06 | 5 |
| 1.5 | CCND1 | chr11:69451136-69458596 | yes | −0.034 | 0.010 | 0.000912 | 0.013337 | 11 |
| 1.5 | NUF2 | chr1:163291479-163292021 | yes | −0.148 | 0.043 | 0.000539 | 0.009251 | 5 |
| 1.5 | RAD51 | chr15:40986871-40987772 | yes | −0.074 | 0.025 | 0.00306 | 0.031238 | 6 |
| 1.5 | GOLPH3 | chr5:32173598-32174837 | yes | −0.066 | 0.022 | 0.003354 | 0.033245 | 7 |
| 1.5 | SOD1 | chr21:33031734-33032657 | yes | −0.064 | 0.021 | 0.002905 | 0.030225 | 6 |
Further validation of Pb-specific 5hmC modifications in the putative DhMRs was carried out using a bisulfite independent technique called Pvu-Seq. The PvuRts1i enzyme cuts 12–15 nucleotides away from the 5hmC sites.33 Therefore, regions which show significantly higher coverage compared to the surrounding noise levels (also called peaks) are indicative of the presence of 5hmC within ± 12–15 nucleotides from the genomic location of the peaks.25 We found that Pvu-Seq can only validate the presence or absence of 5hmC site (s) and cannot be used quantitatively at the sequencing depth that we used in this paper. Therefore, to validate the presence of 5hmC in hMRs (12929 CpG sites) we did a Pvu-Seq analyses on DNA isolated from H9 stem cells used in our experiments. Using a Poisson's distribution based calculations (described in method section) we obtained a set of likely Pvu-Seq peaks. Then we extended the Pvu-Seq peaks by 20 bps on either side and looked for overlap with CpG sites mapping to hMRs. Our analysis showed ∼44% (n = 5661/12929) of CpG sites mapping to high density 5hmC regions overlapped with Pvu-Seq peaks. Examples of an overlapped region are indicated (Fig. 3A and B).
Figure 3.

Validation of putative 5hmC clusters. Visualization of overlap between representative putative hMRs detected by HMeDIP-450K array and putative Pvu-Seq peaks for hESCs not exposed to Pb, (A) BOD-1 (Biorientation Of Chromosomes In Cell Division 1) promoter region. (B) ATPAF1 (ATP Synthase Mitochondrial F1 Complex Assembly Factor 1) promoter region.
For further validation of 5hmC sites in hESC cells, we downloaded HMeDIP- Seq data (.bed files) for H9-hESCs from Gene expression omnibus (GEO accession, GSM1008199).34 GSM1008199 was part of a study exploring 5hmC distribution in H9 hESCs using 5hmC immunoprecipitation coupled with sequencing. The sample and the IP protocol for this study were almost identical to our non-exposed hESCs. Therefore we used the GSM1008199 HMeDIP-Seq dataset to validate our high density 5hmC regions in the non-exposed H9 hESCs. We found ∼52% (n = 6807 /12929) of CpG sites mapping to hMRs overlapped with HMeDIP-Seq enriched regions. Examples of overlapping region are indicated (Fig S2A and S2B). There was a positive correlation (r2 = 0.365) between the β values of the overlapping HMeDIP-450K sites and enriched fragments from the HMeDIP-Seq data set (Fig. S3A). Finally we did an overlap between the CpG sites validated by Pvu-Seq, and CpG sites corresponding to the HMeDIP-Seq dataset and found 3160 CpG sites in common; i.e., validated by both data sets (Fig. S3B). Additionally, 3647 CpG sites not validated by Pvu-Seq overlapped with the HMeDIP-Seq dataset (Fig. S3B). Therefore, using a combination of 2 data sets we were able to validate ∼72% (n = 9308/12929) of the CpG sites mapping to hMRs that we identified with the HMeDIP-450K analyses. We conclude that the HMeDIP-450K assay is a valid approach for mapping 5hmC clusters in the human genome.
Pb exposure associated changes in co-responding high density 5hmC clusters in umbilical cord blood samples
After validating the HMeDIP-450K method with hESC exposed to Pb, we used this method to identify Pb associated differential 5hmC regions in UCB DNA isolated from the ELEMENT cohort. Selection of 5hmC-containing DNA by IP and subsequent normalization and filtering restricted our final 5hmC dataset for UCB DNA to 170300 CpG sites. Chen et al., 2014 reported a subset of probes for the HM450K array mapping to autosomal CpG sites which co-hybridize to sex chromosomes with 94% sequence identity.35 This can give rise to false positives for sex specific association. Therefore, we removed these probes from the data set and performed an association analysis between β values and sex using mixed effect model. We found only 9 CpG sites which were significantly different between males and females (Fig. 4A), suggesting that sex has a minimal effect on the 5hmC profile of the genome. However, as it is not entirely absent, we performed our differential hydroxymethylation analysis using sex of the infant as a covariate. Note that in this study we are using mixed effect model to discover the relationship between 5mC/5hmC and gender. Differential 5mC/5hmC analysis is done using the A-Clustering model. This resulted into the detection of sex-independent Pb-associated changes in DhMRs, which we defined as conserved DhMRs. Then, we separated our samples into males and females and repeated the analysis to identify sex-specific DhMRs. At a FDR corrected P-value ≤0.05, we found 4 DhMRs which showed ≥2% Pb-associated increase in hydroxymethylation and 12 DhMRs which showed ≤2% Pb associated decrease in hydroxymethylation in conserved DhMRs (Fig. S5A).
Figure 4.
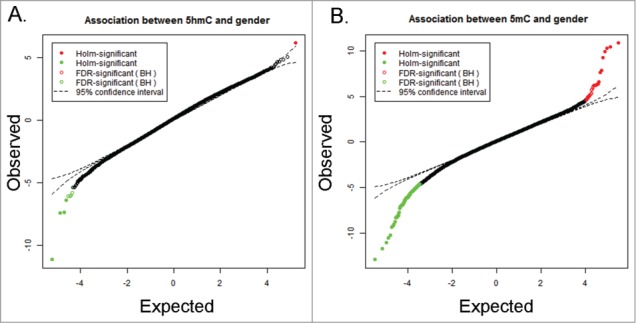
Sex-dependent difference in 5hmC and 5mC clusters. T-plot representation of association analysis based on mixed effect model for single nucleotide difference in (A) 5hmC and (B) 5mC status between males and females in UCB DNA while controlling for blood lead levels (BLL), Socioeconomic score (SES), birth weight, gestational age and smoking status. The results show that a larger number of 5mC sites in UCB DNA is associated with sex rather than putative 5hmC sites.
Table 2 lists a few gene categories that were identified as potential sex-independent biomarkers of prenatal Pb exposure. For example, we saw a 13 ± 3% Pb exposure dependent decrease in a DhMR of 5 probes mapping to CpG island (chr1:110230238–110230614) near the TSS of the glutathione-S-transferase subunit mu 1 gene GSTM1 (Table 2, Fig. 5A). Similarly, we found a 21 ± 3% decrease in a DhMR of 8 probes mapping to non-CpG region located in the TSS of Glutathione-S-transferase subunit mu 5 encoding gene GSTM5 (Table 2). For an effect size cutoff of |0.02| or |2%|, and FDR corrected P-value ≤ 0.05, we saw 8 DhMRs which showed an Pb-dependent increase in hydroxymethylation and 14 DhMRs showed Pb-dependent decrease in hydroxymethylation in UCB DNA for male infants (male-specific DhMRs) (Fig. S4A). For females, using the same criteria for filtering we found 9 DhMRs which showed a Pb-dependent increase in 5hmC and 12 DhMRs which showed a Pb-dependent decrease in 5hmC (female-specific DhMRs) (Fig. S4A). Table 2 lists some representative DhMRs which can serve as sex-specific 5hmC biomarker of developmental toxicity on neonatal Pb exposure. For example, male specific DhMRs mapped to genes such as shared promoter CpG island (chr7: 94284858–94286527) paternally expressed imprinted gene PEG10 and Sarcoglycan (SGCA) (11 ± 3% decrease) (Fig. 5B). Female specific DhMRs mapped to genes such as CpG Island (chr7-130130739-130133111) of paternally imprinted mesoderm specific transcript (MEST) (11 ± 3% decrease) (Fig. 5C). More examples of sex-specific Pb-dependent DNA methylation changes are illustrated in Table 2.
Table 2.
Differentially hydroxymethylated (5hmC) regions (DhMRs) for representative genes for male-specific, female-specific and conserved regions in umbilical cord blood DNA with blood lead levels (BLL) ≥ 5 μg/dl. These clusters can be used as potential early 5hmC biomarkers of Pb exposure
| Group | Gene | CpG island | around TSS | Imprinted gene | Effect size | Standard error | P-value | FDR | Number of sites per cluster |
|---|---|---|---|---|---|---|---|---|---|
| Conserved | GSTM1 | chr1:110230238-110230614 | yes | no | −0.139 | 0.035 | 6.1E-05 | 0.000777 | 5 |
| Conserved | GSTM5 | Non-CpG | yes | no | −0.212 | 0.033 | 9.82E-11 | 3.8E-08 | 8 |
| Conserved | H19 | chr11:2019565-2019863 | yes | maternally expressed | −0.106 | 0.025 | 1.59E-05 | 0.000307 | 5 |
| Conserved | DNAH6 | chr2:84743463-84743685 | yes | no | 0.044 | 0.008 | 4.57E-08 | 4.82E-06 | 6 |
| Male-specific | GOLPH3 | chr5:32173598-32174837 | yes (promoter) | no | 0.038 | 0.013 | 0.002885 | 0.018132 | 7 |
| Male-specific | SGCA/PEG10 | chr7:94284858-94286527 | yes (promoter) | paternally expressed | −0.113 | 0.032 | 0.000364 | 0.005345 | 9 |
| Female-specific | MEST | chr7:130130739-130133111 | yes | paternally expressed | −0.112 | 0.031 | 0.000291 | 0.002521 | 7 |
| Female-specific | DDAH2 | chr6:31695894-31698245 | yes (promoter) | no | 0.034 | 0.011 | 0.001535 | 0.008076 | 5 |
Figure 5.

Representative Pb-dependent 5hmC clusters for UCB DNA from infants prenatally exposed to Pb. The Delta β was calculated by subtracting the mean of β values for cases with high BLL samples (≥5 μg/dl) and the mean of β values for controls (BLL ≤ 5 μg/dl). The resulting Delta β was mapped to the genome to visualize the estimated changes in hydroxymethylation in UCSC genome browser for regions mapping to DHMRs. The significant clusters are highlighted in light blue. (A) 13 ± 3% Pb-exposure dependent decrease in a DhMR of 5 probes mapping to CpG Island near the TSS of GSTM1 for conserved regions. (B) 11 ± 3% increase in 5hmC in a cluster of 7 CpG sites in the promoter CpG island mapping to imprinted gene cluster SCGE/PEG10 for male-specific regions. (C) 11 ± 3% decrease around the TSS of mesoderm specific transcript (MEST) in a cluster of 7 CpG sites for female-specific regions.
Pb exposure associated changes in co-regulated high density 5mC clusters in umbilical cord blood samples
To identify the locus-specific 5mC changes, we filtered our HM450K data by removing the regions mapping to all potential hMRs and unreliable probes that did not map uniquely to the genome. Using the mixed effect model, we first examined the association between sex and the 5mC profile. Our analysis revealed that 300 CpG sites were significantly different between males and females (Fig. 4B), suggesting that, contrary to our findings for 5hmC, sex has a large effect on the 5mC profile of UCB DNA. The Pb exposure dependent changes in 5mC were identified by clustering the correlated 5mC sites into co-regulated regions or methylated regions (MRs) based on 2 parameters: correlation between β values (d = 0.25) and base pair distance cutoff ≤300 bps. MRs with at least 2 CpG sites per cluster were selected for further differential methylation analysis. Due to a large sex effect on UCB DNA methylation, we followed the same pipeline for analysis as described for HMeDIP-450K data. For conserved regions at an exposure effect size cut-off ≥ |0.02| or |2%| and FDR corrected P-value ≤ 0.05, we found 4 Pb-associated differentially methylated regions (DMRs). The identified DMRs mapped to genomic regions such as the CpG island (chr5: 67585213-67584451) located in the promoter region of Phosphoinositide-3-Kinase, Regulatory Subunit 1 – Alpha (PIK3R1) encoding gene (3 ± 0.006% increase) (Table 3).
Table 3.
Differentially methylated (5mC) regions (DMRs) for representative genes for male-specific, female-specific and conserved regions umbilical cord blood DNA with blood lead levels (BLL) ≥ 5 μg/dl. These clusters can be used as potential early 5mC biomarkers of Pb exposure.
| Group | Gene | CpG Island | around TSS | Effect size | Standard error | P-value | FDR | Number of sites per cluster |
|---|---|---|---|---|---|---|---|---|
| Conserved | PIK3R1 | chr5:67584213-67584451 | yes (promoter) | 0.030 | 0.006 | 1.67E-06 | 0.00912 | 2 |
| Male-specific | GLI2 | chr2:121624827-121625209 | no | −0.040 | 0.010 | 4.57E-05 | 0.00536 | 2 |
| Male-specific | FGF20 | chr8:16859044-16859452 | yes | −0.036 | 0.008 | 1.99E-06 | 0.000774 | 3 |
| Male-specific | SLITRK5 | chr13:88329394-88329885 | yes | 0.042 | 0.012 | 0.000772 | 0.040357 | 3 |
| Male-specific | TOP1MT | chr8:144416712-144417054 | yes(promoter) | −0.024 | 0.007 | 0.000831 | 0.042691 | 2 |
| Female-specific | MBP | chr18:74843360-74845426 | yes(promoter) | −0.059 | 0.015 | 0.000121 | 0.032948 | 2 |
| Female-specific | SLC2A1 | chr1:43423467-43424768 | yes | 0.036 | 0.010 | 0.000237 | 0.039979 | 3 |
| Female-specific | GJB3 | chr1:35246876-35247599 | yes | 0.043 | 0.010 | 5.85E-06 | 0.007541 | 2 |
To determine the sex-dependent differential effects of Pb exposure on the DNA methylation profile, we organized the samples based on the sex of the infant before A-clustering. For an effect size cutoff of |0.02| or |2%|, and FDR corrected P-value ≤ 0.05, we identified 44 DMRs consisting of 122 CpG sites in females. Out of these 44 DMRs, 25 were hypermethylated, and 19 DMRs were hypomethylated in females (Fig. S4B). For males, using the same criteria for filtering, we found 96 DMRs mapping to 390 CpG sites. Of these 96 DMRs, 19 were hypermethylated and 77 DMRs were hypomethylated in males (Fig. S4B). These data suggest that the 5mC profile for UCB DNA from male infants is more sensitive to Pb exposure compared to females, with a greater than 4-fold higher number of DMRs with a Pb-dependent decrease in 5mC in males. Functional annotation analysis using hypergeometric testing showed that the genes mapping to male-specific DMRs where enriched for functional categories such as telencephalon development (GO: 0021537, P-value = 4.25E-05) and glial cell differentiation (GO: 0010001, P-value = 0.00015) (Table S2). Since no genes were common between males and females, these genes were not affected by Pb exposure in females. Most genes in females were associated with regulation cell division such as negative regulation of mitotic cell cycle phase transition (GO: 1901991, P-value = 0.00029) and other similar GO terms (Table S2). Examples of representative biomarker regions are illustrated in Table 3.
Discussion
Exposure-associated changes in the epigenetic profile can be altered by seemingly unrelated factors like sex, gestational age and smoking status. We were specifically interested in the effect of sex on the 5mC and 5hmC profiles because Pb exposures are known to affect boys differently from girls. Based on a mixed effect model, we found a significant association between sex and the 5mC and 5hmC profiles. Moreover sex contributed to a greater number of single-nucleotide changes in the 5mC profile compared to the 5hmC profile. Based on this observation, we hypothesize that exposure-associated changes can be divided into 3 subtypes: 1) conserved regions, which are sex-independent effects; 2) male-specific regions, which are 5mC and 5hmC regions that are affected by prenatal Pb exposure only in UCB DNA for male infants; and 3) female-specific regions, which are 5mC and 5hmC regions affected by prenatal Pb exposure only in the UCB DNA for female infants. Using this approach we were able to identify sex- independent and sex-specific differentially methylated (DMRs) and differentially hydroxymethylated (DhMRs) regions that correlate with prenatal Pb exposure in UCB DNA. Mapping the CpG sites from the DMRs and DhMRs to the genome revealed several interesting target genes associated with significant biological processes. We believe that these regions may have some application as epigenetic biomarkers of early life Pb exposure.
In this study, we tested our hypothesis that prenatal exposure to Pb can cause changes in the hydroxymethylation profiles of high density 5hmC clusters. Because 5hmCs are abundantly found in hESCs,11 we first analyzed the locus-specific 5hmC profiles of hESCs acutely exposed (24 hour) to physiologically relevant concentrations of Pb, using the HMeDIP-450K array which we developed for this study. We found that in hESCs a large percentage (∼41%) of the CpG sites mapping to 5hmC clusters were localized within 1500 bps of TSS, and that their density was inversely proportional to the distance from the TSS. The HM450K probes covers 99% of the refseq genes with 17 CpG sites per gene region distributed across the promoter, 5‘UTR, first exon, gene body, and 3′UTR. Therefore, we conclude that the majority of the high density CpG sites mapping to hMRs are truly enriched for the promoter/TSS gene regions. This observation is in agreement with previous studies which have reported a large genomic distribution of 5hMCs around the promoter of expressed genes in mouse and human embryonic stem cells.36,37 Using Pvu-Seq and an external HMeDIP-Seq dataset we were able to validate the presence of 5hmC sites for ∼72% of the CpG sites mapping to hMRs. This suggests that few of our hMRs may contain 5mC modifications and was pulled down along with the nearby 5hmC. For differential hydroxymethylation analysis, DhMRs are modeled clusters of CpG sites which show correlated changes in β values on exposure to Pb. Therefore the presence of a small number of 5mC modifications, in a predominant 5hmC background in not expected to alter the effect of DhMRS on transcriptional regulation.
To further our understanding of the association between environmental exposure to Pb and changes in 5hmC, we searched for Pb exposure associated 5hmC changes modeled as co-regulated high density clusters, hMRs, in a well characterized human cohort. To this end, we applied the HMeDIP-450K array on DNA extracted from UCB because they contain CD34+ haematopoietic stem cells which are known to have high levels of 5hmC. We did not use newborn blood for this study because, in contrast to UCB DNA, found very little 5hmC in DNA isolated from newborn blood from the Michigan Neonatal Biobank (Ruden, unpublished). Our UCB samples consisted in 24 male and 24 female infants.
While both males and females are vulnerable to the adverse effects of Pb exposure, there is significant evidence that sex can influence the severity of Pb neurotoxicity.38,39 Prenatal Pb exposure appears to induce poorer cognitive performances in boys, even at very low BLLs.40 Childhood exposure to Pb reduces adult gray matter volume significantly more in males than females.41 In animal models, sex-specific differences in the effects of Pb exposure have also been observed in spatial learning and memory, motor behavior, dopamine metabolism, and brain gene expression.8,42,43 Some of the sex-biased response to Pb toxicity can be attributed to sex hormones, or to the differential expression of sex and/or autosomal genes.44
A mechanism through which exposure to heavy metals such as Pb might contribute to altering gene expression is by changing the 5hmC and 5mC profiles in the genome. Pilsner and colleagues demonstrated that prenatal exposure to Pb changes global DNA methylation in UCB in a sex-specific manner.45 Liu et al., 2010 reported over 580 autosomal CpG sites which showed sex-specific differences in DNA methylation in salivary DNA from healthy subjects.30 In a mouse model, Faulk and colleagues showed a significant correlation between birth weight and DNA methylation at the Agoutiviable yellow locus exclusively in yellow agouti (Avy/Avy) mouse male offspring.46 Therefore for our data, we classified Pb exposure associated 5mC and 5hmC changes into 3 subtypes: 1) Conserved regions; sex-independent effects, 2) male-specific regions; Pb-dependent 5mC and 5hmC changes only observed in the UCB DNA from male infants; and 3) female-specific regions; Pb-dependent 5mC and 5hmC changes only present in the UCB DNA from female infants. For example, we identified a large decrease in 5hmC (DhMRs) mapping to the transcription start sites of GSTM1 (13% decrease) and GSTM5 (21% decrease). GSTM1 and GSTM5 are cytosolic GST encoded by GST mu cluster of genes.47 Within, this cluster they share >85% sequence similarity suggesting that GSTM1 and GSTM5 probably have similar functions.48 Daggett et al., 1998 reported that increased expression of all GST subunit including GSTM1 in kidney of Sprague Dawley rats, 3 d after a single injection of 114 mg /kg of body weight Pb acetate.49 Pb has been shown to induce GST expression via GSH depletion and lipid peroxidation leading to increased burden of ROS in various tissues.50,51 Interestingly, the authors reported no increase in markers of oxidative stress in the kidney suggesting that increase in GST expression might be via other mechanism.
Wu et al., 2011 reported that 5hmC modification can be involved in both TET mediated activation or repression of genes.52 Our preliminary results indicate that chronic prenatal exposure to Pb causes a significant decrease in 5hmC around the transcription start site of GSTM1 and GSTM5, which might explain the increase in expression seen previously. Therefore, based on evidence from previous studies and our study, we speculate that the DhMRs localizing to the TSS of GSTM1 and GSTM5 expression might be actively repressed by 5hmC modifications in normal conditions and activated via loss of 5hmC, in response to oxidative stress induced by Pb exposure.
Male-specific DhMRs mapped to promoter region of a paternally expressed imprinted gene locus consisting of 2 genes; paternally expressed 10 (PEG10) and sarcolycan epsilon gene (SGCE) showed an 11% decrease in 5hmC. Under normal conditions this region maintains a stable epigenetic profile throughout development and its alteration can potentially cause developmental disorders.53,54 Genomic imprinting in this region was shown to be associated with increased susceptibility toward growth related defects such as Silver-Russell syndrome.55,56 A study by Yamaguchi et al., 2013 showed that the imprinted SGCE/PEG10 locus was completely methylated in TET1 paternal KO embryos which lead to early embryonic lethality in mouse model.57 We predict that a decrease in 5hmC levels in this region will overtime lead to the accumulation of methylation marks and consequently increase susceptibility to developmental disorder. Based on this finding, we speculate that a longitudinal study looking at the relationship between epigenetic status of this region and growth in male infants prenatally exposed to Pb in a larger sample cohort will allow the determination of the utility of SGCE/PEG10 locus as a male-specific biomarker for Pb exposure associated disease outcomes. In female-specific DhMRs we saw a decrease in 5hmC in the CpG islands located in the TSS of the Mesoderm specific transcript (MEST), also known as PEG1. PEG1/MEST derives its expression from the paternal allele.58
Bisulfite-pyrosequencing of UCB DNA obtained from newborns with mothers diagnosed with gestational diabetes mellitus revealed a significant decrease in the methylation signature of PEG1 compared to healthy controls, suggesting that aberrant methylation of this region might be associated with metabolic diseases.59 However, since bisulfite-based chemical modification is unable to distinguish between 5hmC and 5mC, we provide evidence that most epigenetic changes in this region are attributed to 5hmC modification. In conclusion using the HMeDIP-450K array we show that Pb exposure can affect the 5hmC status of imprinted genes leading to their altered expression and function in a sex-specific manner. These may serve as good biomarkers for susceptibility to adult diseases.
The analysis of the 5mC data revealed large number of Pb exposure independent sex-specific differences in individual CpG sites (n = 300) (Fig. 4B). In contrast, fewer 5hmC sites were associated with the sex of the infant (n = 9). Therefore, we speculate that 5mC changes might function as better sex specific markers of early life Pb exposure. The number of loci showing methylation changes was much higher in the case of UCB DNA for male infants suggesting that males have an increased susceptibility to prenatal Pb exposure. Pb exposure is generally associated with cognitive impairment which has been shown to be more prevalent in boys.60 In line with previous data, most of the genes we identified as associated with Pb exposure–dependent 5mC clusters or DhMRs were known to play key roles in neurodevelopment. We believe that most of these changes are detrimental in nature, i.e., they cause an alteration of the normal gene expression profile, and they might be candidate sex-specific biomarkers of early life Pb exposure. In contrast, in females the DhMRs were associated with only 31 genes and none of them were directly involved in neurodevelopment.
Since the WA09 (H9) stem cells have an XX karyotype (i.e., they are from a female embryo), we searched for a potential overlap between female-specific DhMRs identified in the UCB DNA and those detected in hESC DNA after acute exposure to Pb, but found none. Based on this observation, we speculate: 1) prenatal exposure is more similar to a chronic rather than an acute Pb exposure 24; and 2) contrary to hESCs, UCB is a mixture of various immune cells and CD34-positive haematopoietic cells, which may have different epigenetic changes and survival capabilities in reponse to Pb exposure.
To determine the contribution of a possible shift in the immune cell population, we restricted the effect size for the identification of DhMRs to at least 0.02 or 2% because we did not want to exclude the possibility that a smaller exposure effect size or Pb-dependent change in the 5hmC and 5mC profiles is due to a shift in the immune cell population.20 Houseman et al., 2012 proposed a statistical model for estimation of blood cell type proportion using methylation data.61 Using this methodology, they found that the leukocyte distribution accounts for only 3% of the differences in the DNA methylation profile of individuals exposed to arsenic (As).27 We found that, although there was some variability in sample-to-sample estimated cell counts, there was no significant difference between the blood-cell-type populations between infants with high BLL and low BLL (Fig. S6A and S6B, Table S3). Therefore, the differences in the 5hmC and 5mC profiles that we observed in the UCB DNA are probably not due to a shift in the immune cell population.
Conclusions
In this study, using an in-vitro stem cell culture and a novel modification of the HM450K assay (HMeDIP-450K), we confirm our hypothesis that that Pb-induced changes in 5hmC can be modeled as co-regulated clusters. Furthermore, our analysis of Pb-associated changes in UCB DNA allowed us to identify several 5hmC and 5mC clusters as potential candidates for sex-independent or sex-specific epigenetic biomarkers for prenatal Pb exposure. We also determined that differential 5mC sites are better predictors for sex-specific effects of Pb exposure than differential 5hmC sites. Results from this prototype study and similar studies in the future promise to increase our understanding of Pb-induced epigenetic regulation of neurodevelopment in humans.
Material and Methods
hESC culture and Pb exposure
The human ESC line WA09 (H9) (Thomson et al., 1998) was obtained from the WiCell Research Institute (Madison, WI, USA) and maintained in a humidified incubator at 37°C with 5% CO2, as previously described (Senut et al., 2014). Briefly, undifferentiated hESCs (passages 26–39) were cultured in DMEM/F12 supplemented with knockout serum replacement, nonessential amino acids, penicillin/streptomycin, L-Glutamine, 2-mercaptoethanol, and human basic fibroblast growth factor (Life Technologies) on a feeder layer of irradiated mouse embryonic fibroblasts (Globalstem). hESCs (Fig. S5A) were passaged by mechanical dissociation every 4–6 d and their pluripotency frequently tested by immunofluorescence staining for specific markers including Oct4 (Fig. S5B), and Lin28 (Fig. S5C). Stock solutions (100-fold concentrated) of Pb acetate (Pb(C2H3O2)2) (Sigma-Aldrich) were prepared in sterile distilled water. Two physiologically relevant concentrations of Pb acetate chosen on the basis of our previous work 24 were tested in this study: 0.8 μM (16 μg/dL) and 1.5 μM (32 μg/dL). Distilled water was used as a vehicle control. Undifferentiated hESCs were acutely exposed to the different concentrations of Pb or vehicle for 24 h, at which time the hESC colonies were dissected and their DNA was isolated.
Extracting genomic DNA from hESCs
DNA was isolated from hESCs by using QiagenDNA Easy Kit™. The “Purification of DNA from Cells” protocol, the EZ1 DNA Cell Card, and the EZ1 DNA Cell 350-μl Kit were used for this study. DNA was isolated from ∼1 million cells with Qiagen EZ1 Advanced® using the DNA Investigator® reagents and protocol card. DNA concentrations were quantified by UV spectrophotometry using the DropSense96® Microplate Spectrophotometer (Trinean), and the purity was assessed based on the A260/A280 and A260/A230 ratios.
Samples and sample classification
The Early Life Exposure in Mexico to Environmental Toxicants (ELEMENT) cohort consists of over 4000 mother-infant pairs, belonging to a low income population recruited from 1994 onwards from 3 hospitals in Mexico City (Mexican Social Security Institute, Manuel Gea Gonzalez Hospital, and National Institute of Perinatology).7 We used umbilical cord blood (UCB) from the fourth wave of the ELEMENT study (Each of the 4 waves had approximately 1000 children participants). The blood lead concentrations of umbilical cord blood were determined using atomic absorption spectroscopy (Model 3000; PerkinElmer, Chelmsford, MA, USA) at the metals laboratory of the American British Cowdray Hospital in Mexico City.7 Out of the initial pool of samples, 412 samples were randomly selected for DNA extraction. DNA extraction was carried out at the Harvard-Partners Center for Genetics and Genomics. Unfortunately, RNA was not extracted so it is not possible to follow up these findings with gene expression analyses. For our study, we randomly selected UCB from 24 male and 24 female children from the 1st and 4th quartiles of Pb levels. The UCB for male children had a minimum blood lead level (BLL) of 0.59 μg/dl and highest BLL of 7.21 μg/dl. The UCB for female children had a minimum BLL of 0.68 μg/dl and highest BLL of 10.53 μg/dl. Five male children and 7 female children had BLL in UCB ≥ 5 μg/dl and classified as high BLL group. Details on the 48 sample mother-infant cohort samples are shown (Table 4).
Table 4.
The Early Life Exposure in Mexico to Environmental Toxicants (ELEMENT) cohort consists of over 2000 mother-infant pairs, belonging to a low income population recruited from 1994 onwards from 3 hospitals in Mexico City (Mexican Social Security Institute, Manuel Gea Gonzalez Hospital, and National Institute of Perinatology). For our study, we randomly selected UCB for 24 male children and 24 female children from the 1st and 4th quartiles of Pb levels.
| Family ID | Gender | SES score | Gestational age | Smoke Ever | Birth weight | Pb concentration |
|---|---|---|---|---|---|---|
| 12 | male | 6 | 38 | 1 | 3.63 | 1.2797 |
| 15 | female | 4 | 38 | 1 | 3.05 | 6.1748 |
| 17 | female | 2 | 40 | 1 | 3.285 | 1.2036 |
| 32 | male | 1 | 37 | 0 | 2.7 | 1.3276 |
| 41 | male | 2 | 38 | 0 | 3.1 | 1.6951 |
| 62 | female | 5 | 39 | 1 | 3.285 | 1.6714 |
| 70 | female | 3 | 39 | 0 | 2.98 | 3.8141 |
| 76 | male | 4 | 37 | 0 | 3.3 | 1.5686 |
| 82 | male | 3 | 38 | 0 | 3.09 | 1.5404 |
| 83 | male | 4 | 40 | 0 | 3.25 | 4.8687 |
| 88 | male | 2 | 40 | 1 | 3.47 | 1.5936 |
| 91 | male | 4 | 39 | 1 | 2.98 | 1.3482 |
| 92 | female | 2 | 38 | 1 | 3.09 | 1.7482 |
| 99 | female | 2 | 39 | 1 | 3.025 | 1.3594 |
| 101 | female | 1 | 39 | 1 | 2.725 | 6.3513 |
| 105 | female | 3 | 41 | 1 | 2.5 | 6.4667 |
| 120 | male | 3 | 40 | 0 | 3.85 | 6.4195 |
| 129 | male | 3 | 40 | 1 | 3.02 | 4.7712 |
| 135 | female | 2 | 39 | 1 | 3.3 | 5.0786 |
| 141 | female | 2 | 40 | 0 | 3.15 | 9.825 |
| 144 | male | 2 | 40 | 0 | 3.105 | 7.2093 |
| 150 | male | 1 | 39 | 1 | 3.05 | 5.3881 |
| 162 | female | 4 | 39 | 1 | 2.6 | 3.7799 |
| 163 | male | 2 | 39 | 1 | 2.805 | 1.5525 |
| 164 | male | 2 | 40 | 0 | 3.625 | 1.1279 |
| 168 | female | 1 | 39 | 1 | 3.575 | 7.8923 |
| 184 | female | 2 | 40 | 1 | 3.125 | 0.8501 |
| 185 | female | 3 | 39 | 1 | 2.375 | 4.0317 |
| 189 | male | 3 | 37 | 0 | 2.705 | 0.5872 |
| 196 | female | 3 | 38 | 0 | 3.005 | 10.5263 |
| 199 | male | 3 | 40 | 1 | 3.05 | 1.3602 |
| 202 | female | 6 | 37 | 0 | 3.055 | 4.3582 |
| 203 | female | 2 | 41 | 1 | 2.705 | 1.4625 |
| 207 | male | 2 | 36 | 1 | 2.4 | 1.3162 |
| 212 | female | 3 | 36 | 0 | 3.05 | 4.6601 |
| 215 | female | 4 | 39 | 1 | 2.8 | 0.6821 |
| 222 | male | 2 | 39 | 0 | 3.2 | 6.2375 |
| 230 | female | 3 | 38 | 0 | 2.325 | 4.5225 |
| 235 | female | 2 | 40 | 1 | 3.06 | 4.9727 |
| 239 | male | 2 | 39 | 1 | 3 | 1.0372 |
| 247 | female | 2 | 39 | 1 | 2.7 | 0.9782 |
| 264 | female | 2 | 40 | 0 | 2.725 | 1.1936 |
| 269 | male | 4 | 41 | 1 | 4 | 3.9883 |
| 276 | male | 4 | 39 | 1 | 3.6 | 5.364 |
| 278 | male | 5 | 37 | 0 | 3.3 | 0.9199 |
| 283 | male | 2 | 40 | 1 | 2.85 | 4.5899 |
| 287 | female | 2 | 40 | 1 | 3.25 | 1.572 |
| 305 | male | 2 | 38 | 0 | 3.425 | 4.3498 |
Shearing and denaturation of DNA
Similar protocol was used shearing and denaturation of DNA for hESCs and UCB. Approximately 3 μg genomic DNA was diluted in 130 μl of buffer TE (10 mM Tris (pH 8.0), and 1 mM EDTA (pH 8.0)) and sheared into ∼200–600bp fragment using microcavitation (Covaris, Inc, setting: Duty Cycle = 5%, Intensity = 3, Cycles/burst = 200, Time = 75 seconds run at 6–8°C). 125 μl of the sheared DNA samples were mixed with 330 μl of buffer TE. The sheared DNA was denatured by boiling it in the Thermomixer at 95°C and 700rpm for ten minutes and left on ice for 10 min.
Immunoprecipitation and extraction of DNA
A similar protocol was used for DNA extracted from hESCs and UCB. 51 μl of 10x immunoprecipitation buffers and 3 μl of 5mC or 5 hmC specific antibodies at a concentration of 1μg/μl was added to the denatured DNA sample and incubated for ≥ 2 h at 4°C with tipping. Then, 25 μl protein G beads was added to the samples and incubated overnight at 4°C with tipping. The residual beads were collected with a magnetic rack and washed 3 times with 700 μl 1×IP buffer. The bead were then re-suspended in 20 mg/ml Proteinase K solution and incubated for 3 h at 50°C and 800 rpm. The residual beads where pelleted using a magnetic rack. The supernatant was collected for phenol/chloroform extraction. For extraction, the supernatant was treated with 250 μl phenol: chloroform: isoamyl at a ratio of 25:24:1, vortexed and then spun down for 2 minutes at 14,000 rpm. Then, the supernatant was treated with 250 μl chloroform, vortexed and spun down for 2 minutes. Finally, DNA was precipitated by adding 20 μl 5M NaCl, 1 μl glycogen and 500 μl 100% ethanol and incubated at -20°C for 30 minutes. The samples were then pelleted at 4°C and 14,000 rpm for 20 minutes and allowed to dry at room temperature for 10 minutes. The dried out samples are re-suspended in 25–50 μl water and readied for the HM450K bead chip array for methylation analysis.
HM450K bead chip array
For this study, we measured the influence of environmental exposure to Pb on the DNA methylation profiles of UCB using the Illumina Human Methylation 450K Bead chip array (HM450K). The HM450K assay measures DNA methylation at over ∼480,000 CpG and non-CpG sites with a single-base resolution.62,63 The results are represented in the form of β (β) values ranging from 0 to 1, and provide a quantitative measure of methylation for each queried CG dinucleotide methylation site (CpG site).62 DNA methylation changes at CpG sites located close to each other often exhibit common behavior in response to environmental stimuli. These regions show highly correlated changes in methylation signatures and can be defined as co-regulated regions. The co-regulated regions can be assigned to specified clusters and the effect of the exposure on these clusters can be tested using the generalized estimating equation (GEE).20 GEE uses a weighted combination of observation to measure the effect of a covariate (in our case Pb exposure) while conserving the correlation structure of the data.64 Consequently this approach is much less conservative and yields a greater number of differentially methylated regions compared to the traditional case-control study with a single CpG site β value comparison.
Detection of methylated DNA is facilitated by 2 different probe types (Type 1 and Type 2 probes). The Type 1 probes or the Infinium 1 (Inf1) probes consist of the methylated bead and an un-methylated bead.65 If the probe for methylated DNA matches the target site there is a single base extension which results in detection which signals into the red channel. Similarly if an un-methylated probe binds to the DNA it signals into the green channel. The type 2 probes or the Infinium 2(Inf2) queries both methylated and un-methylated DNA on a single bead, and the ratio of incorporation of 2 differently-colored fluorescent nucleotides (Signals A and B) determines the methylation signal. The results are represented in the form of β values, specifically, the average β value (AVG_Beta), representative of the average methylation level of the CpG dinucleotide, and a delta β value which signifies the difference in methylation levels between the control and the experimental group. The Beta or β for the ith interrogated CpG nucleotide is:
Where yi,methy and yi,unmethy are the intensities measured by the ith methylated and un-methylated probes, respectively. Illumina recommends adding a constant offset α (by default, α = 100) to the denominator to regularize β value when both methylated and un-methylated probe intensities are low. The Beta-value statistic results in a number between 0 and 1, or 0 and 100%.66 The raw data was retrieved from Genome Studio methylation module version 1.8™ in the form of 2 files; a sample methylation profile and control probe profile. Quality control, signal correction and normalization of the data was carried out using the HM450K Bead Chip data processing pipeline proposed by Teschendorff et al., 2013 in R environment (R > 2.13.0).67 Several studies have indicated that the Infinium 1 and 2 probes differed in chemistry, henceforth the HM450K are 2 separate experiment combined as one. The Infinium 1 probes were shown to have a more stable signal and extended dynamic range compared to the Infinium 2 probes.68 Therefore, a 3-state β mixture model is utilized to assign methylation values to specific methylation states implemented in ChAMP. Then the probability of assignment to particular state is divided in quartiles and finally a methylation dependent dilation transformation is performed to preserve sample monotonicity.67 Prior to analysis the β values were corrected for Batch effect using Combat function in R and potential single nucleotide polymorphism (snp)-containing probes were removed from the analysis (>2.15).69
DNA digestion with PvuRst1L and DNA sequencing
PvuRts1I (Pvu) restriction enzyme can directly cleave hydroxymethylated DNA 12–14 bps away from the 5hmC site.33 We developed a new technique that we call Pvu-seq which allows direct detection of 5hmC without chemical modification of 5hmC or bisulfite conversion. A paper describing this technique was published in BMC Genomics.25 Briefly, the whole genomic DNA extracted from control and Pb-treated hESCs, was digested with PvuRts1I and sequenced using 50 bps paired end sequencing reads in Illumina™ HiSeq 2500.
Statistical analysis for HMeDIP-450K data
For studying effects of exposure to Pb on the 5hmC profile for our in vitro Pb-hESCs and UCB DNA, we used the Adjacent cite clustering algorithm (A-clustering) proposed by Sofer et al., 2013.20 A-clustering to detect sets of correlated CpG sites and then tested the clusters for multivariate response to environmental exposure to Pb using the generalized estimation equation approach. The aforementioned approach is efficiently implemented using the R-package Aclust.20 For determining the differentially hydroxymethylated regions (DhMRs) we used modified Aclust parameters; Spearman correlation, for calculating the distance between adjacent sites (dist(i,j) = 1 corr(i,j)), average clustering type, which require that mean distance between 2 sites be at least 0.25, 300 bps distance restriction for merging of clusters, which ensures that clusters located far away from each other are not merged together based on correlation. The clustering approach is implemented with a 299 bps merge initiation step, which clusters all sites wedged between 2 high correlated sites within 299 bps of each other together, to reduce the complexity of data and the analysis time for the A-clustering step. The minimum fragment length pulled down by 5hmC antibody was 300bps, therefore to increase the probability of detecting high density 5hmC clusters only the distance restriction for clustering was restricted to 300 bps. Finally the data was analyzed using a generalized estimation equation approach and filtered for significant DhMRs using FDR corrected P-value cutoff = 0.05, exposure effect size ≥ |0.02| and number of CpG sites per cluster ≥ 5. These regions are can be defined as Pb-dependent high density 5hmC clusters. To determine the genomic locations of the probes belonging to individual DhMCs, they were annotated using the publicly available Illumina Human Methylation 450 k annotation data in R (>2.15). The target genes mapping to DhMRs were individually visualized using UCSC genomic browser. The Delta β or the β difference between the median of the β values for each probe for low BLL samples and high BLL samples were mapped by the chromosomal location of the probes.
Statistical analysis of the effect of sex in HMeDIP-450k assay for UCB DNA
The single nucleotide differences 5hmC and association with the sex of the infant was determined using a mixed effect model which was implemented using the package CpGassoc in R(R>2.15).70 All analysis was conducted controlling for covariates such as BLL, socioeconomic status, gestational age and smoking status of the mothers and birth weight of the infant. After determination of single nucleotide differences the sample was either separated into males and females and analyzed separately using the A-clustering approach described previously to determine the male-specfic and female-specific 5hmC changes in co-regulated hMRs. Alternatively, the sex of the infant was used as a covariate which enabled us to determine the Pb-dependent changes in hMRs conserved between male and female infant. All analysis was conducted while controlling for socioeconomic status, gestational age and smoking status of the mothers and birth weight of the infant.
Cell type estimation
Cell type estimation was done using the “estimate-Cell-Count” function in Minfi (R > 2.15)71 The raw data sets were obtained from the .idat files and where used to estimate the cell count. The published cell-type data, which is available in Bioconductor, is based on HM450K data that was generated from flow-sorted blood cells from 6 adult males.
Statistical analysis of HM450K for UCB DNA
All CpG sites mapping to putative 5hmC clusters are removed from the β matrix. The single nucleotide differences 5hmC and association with the sex of the infant was determined using a mixed effect model which was implemented using the package CpGassoc in R(R > 2.15)[26]. All analyses were conducted controlling for covariates such as BLL, socioeconomic status, gestational age and smoking status of the mothers and birth weight of the infant. For determining the differentially methylated regions (DMRs) we used the modified Aclust parameters; Spearman correlation, for calculating the distance between adjacent sites (dist(i,j) = 1- corr(i,j)), average clustering type, which require that mean distance between 2 sites be at least 0.25, 300 bps distance restriction for merging of clusters. The clustering approach is implemented with a 299 bps merge initiation step. Finally the data was analyzed using a generalized estimation equation approach and filtered for significant DhMCs using FDR corrected P-value cutoff = 0.05 and exposure effect size ≥ |0.02|. To determine the genomic locations of the probes belonging to individual DMCs, they were annotated using the publicly available Illumina™ Human Methylation 450k annotation data in R (>2.15).
Statistical analysis for Pvu-Seq data
Pvu-Seq was used to confirm the presence of 5hmC in the predicted Pb-dependent high density 5hmC clusters.25 Using the approach implemented in the chipseq package in R/Bioconductor, peaks significantly above the noise distribution was estimated and visualized in using Integrative genome viewer (IGV). Briefly, the peak calling for pvu-seq is based on the presumption that the number of times a genomic position is sequenced (coverage where coverage = Read Length (nt) * Total Reads Number * / *Genome Length (nt)) follows a Poisson distribution. Therefore from this information we can estimate a coverage cut-off for which the FDR corrected P-value ≤ 0.05. For our study the estimated coverage cutoff was 4.5. PvuRts1I (Pvu) restriction enzyme can directly cleave hydroxymethylated DNA 12–14 bps away from the 5hmC site33 sites. Therefore we extended our peak region to ±20 on either side. Then using GenomicRanges package in R we determined HMeDIP-450K 5hmC regions were overlapped with the predicted Pvu-Seq peak to confirm the presence of 5hmC. Validation was only done for the Pb non-treated hESCs. For visualization of the data, we converted the sorted Pvu-Seq, .bam files into .bed file using bedtools and calculated the median count in 25bps windows along the genome and plotted them as histograms using Integrative genome viewer (IGV). The location of the CpG sites/probes mapping to high density 5hmC regions (hMRs) where obtained from the Illumina HumanMethylation450 annotation data in R and plotted as a separate track in IGV. The overlapped regions where queried on IGV to generate region-specific 5hmC overlap. HMeDIP-Seq data was downloaded from GEO (GSM1008199) and overlapped HMeDIP-450K using Genomic Ranges package in R.
Gene ontology analysis
Gene ontology analysis was done using GOstats in R/Bioconductor. Briefly, for a gene ontology (GO) class a hypergeometric probability is calculated, denoting whether the number of gene belong to the GO term is larger than expected.72 We use this method to look at the suggestive association of our gene list with gene-ontological categories. As the gene list is short, this assists in manual curation of the dataset rather than providing the exact biological targets.
Disclosure of Potential Conflicts of Interest
No potential conflicts of interest were disclosed.
Acknowledgments
The authors would like to thank Dr. Jose Cibelli and the members of the Cellular Reprogramming Laboratory (CRL) at Michigan State University for the use of CRL facilities and stem cell culturing guidance. We also thank Molly Estill for her valuable expertise and assistance with the statistical analysis. All of the HM450K and HMeDIP-450K data has been deposited into the GEO database (Accession Number – GSE69636; http://www.ncbi.nlm.nih.gov/geo/query/acc.cgi?acc=GSE69636).
Funding
This research was supported by R01ES012933, R21ES021893, R01ES013744, R01ES020268, R01ES021357, the WSU and MSSM NIEHS Centers (P30ES020957 and P30ES023515), and a Bloodspot Environmental Epidemiology Program (BLEEP) pilot grant from the Michigan University Research Corridor (URC). This study also was supported and partially funded by the National Institute of Public Health/Ministry of Health of Mexico.
Supplemental Material
Supplemental data for this article can be accessed on the publisher's website.
Ethical Statements
Informed consent was obtained from all participants. The human component was approved by the Internal Review Boards of Wayne State University, the Michigan Department of Community Health, and the Michigan Neonatal Biobank.
References
- 1. Altmann L, Gutowski M, Wiegand H. Effects of maternal lead exposure on functional plasticity in the visual cortex and hippocampus of immature rats. Brain Res Dev Brain Res 1994; 81:50-6; PMID:7805286; http://dx.doi.org/ 10.1016/0165-3806(94)90067-1 [DOI] [PubMed] [Google Scholar]
- 2. Wolff MS, Britton JA, Boguski L, Hochman S, Maloney N, Serra N, Liu Z, Berkowitz G, Larson S, Forman J. Environmental exposures and puberty in inner-city girls. Environ Res 2008; 107:393-400; PMID:18479682; http://dx.doi.org/ 10.1016/j.envres.2008.03.006 [DOI] [PMC free article] [PubMed] [Google Scholar]
- 3. Lawrence DA, McCabe MJ, Jr. Immunomodulation by metals. Int Immunopharm 2002; 2:293-302; PMID:11811932; http://dx.doi.org/ 10.1016/S1567-5769(01)00180-1 [DOI] [PubMed] [Google Scholar]
- 4. Chuang HY, Schwartz J, Gonzales-Cossio T, Lugo MC, Palazuelos E, Aro A, Hu H, Hernandez-Avila M. Interrelations of lead levels in bone, venous blood, and umbilical cord blood with exogenous lead exposure through maternal plasma lead in peripartum women. Environ Health Perspect 2001; 109:527-32; PMID:11401766; http://dx.doi.org/ 10.1289/ehp.01109527 [DOI] [PMC free article] [PubMed] [Google Scholar]
- 5. Goyer RA. Lead toxicity: from overt to subclinical to subtle health effects. Environ Health Perspect 1990; 86:177-81; PMID:2205487; http://dx.doi.org/ 10.1289/ehp.9086177 [DOI] [PMC free article] [PubMed] [Google Scholar]
- 6. Schubeler D. Function and information content of DNA methylation. Nature 2015; 517:321-6; PMID:25592537; http://dx.doi.org/ 10.1038/nature14192 [DOI] [PubMed] [Google Scholar]
- 7. Pilsner JR, Hu H, Ettinger A, Sanchez BN, Wright RO, Cantonwine D, Lazarus A, Lamadrid-Figueroa H, Mercado-Garcia A, Tellez-Rojo MM, et al. . Influence of prenatal lead exposure on genomic methylation of cord blood DNA. Environ Health Perspect 2009; 117:1466-71; PMID:19750115; http://dx.doi.org/ 10.1289/ehp.0800497 [DOI] [PMC free article] [PubMed] [Google Scholar]
- 8. Schneider JS, Mettil W, Anderson DW. Differential effect of postnatal lead exposure on gene expression in the hippocampus and frontal cortex. J Mol Neurosci: MN 2012; 47:76-88; PMID:22160880; http://dx.doi.org/ 10.1007/s12031-011-9686-0 [DOI] [PMC free article] [PubMed] [Google Scholar]
- 9. Kriaucionis S, Heintz N. The nuclear DNA base 5-hydroxymethylcytosine is present in Purkinje neurons and the brain. Science 2009; 324:929-30; PMID:19372393; http://dx.doi.org/ 10.1126/science.1169786 [DOI] [PMC free article] [PubMed] [Google Scholar]
- 10. Tahiliani M, Koh KP, Shen Y, Pastor WA, Bandukwala H, Brudno Y, Agarwal S, Iyer LM, Liu DR, Aravind L, et al. . Conversion of 5-methylcytosine to 5-hydroxymethylcytosine in mammalian DNA by MLL partner TET1. Science 2009; 324:930-5; PMID:19372391; http://dx.doi.org/ 10.1126/science.1170116 [DOI] [PMC free article] [PubMed] [Google Scholar]
- 11. Stroud H, Feng S, Morey Kinney S, Pradhan S, Jacobsen SE. 5-Hydroxymethylcytosine is associated with enhancers and gene bodies in human embryonic stem cells. Genome Biol 2011; 12:R54; PMID:21689397; http://dx.doi.org/ 10.1186/gb-2011-12-6-r54 [DOI] [PMC free article] [PubMed] [Google Scholar]
- 12. Szulwach KE, Li X, Li Y, Song CX, Han JW, Kim S, Namburi S, Hermetz K, Kim JJ, Rudd MK, et al. . Integrating 5-hydroxymethylcytosine into the epigenomic landscape of human embryonic stem cells. PLoS Genet 2011; 7:e1002154; PMID:21731508; http://dx.doi.org/ 10.1371/journal.pgen.1002154 [DOI] [PMC free article] [PubMed] [Google Scholar]
- 13. Colquitt BM, Allen WE, Barnea G, Lomvardas S. Alteration of genic 5-hydroxymethylcytosine patterning in olfactory neurons correlates with changes in gene expression and cell identity. Proc Natl Acad Sci U S A 2013; 110:14682-7; PMID:23969834; http://dx.doi.org/ 10.1073/pnas.1302759110 [DOI] [PMC free article] [PubMed] [Google Scholar]
- 14. Zhang J, Mu X, Xu W, Martin FL, Alamdar A, Liu L, Tian M, Huang Q, Shen H. Exposure to arsenic via drinking water induces 5-hydroxymethylcytosine alteration in rat. Sci Total Environ 2014; 497-498C:618-25 [DOI] [PubMed] [Google Scholar]
- 15. Tellez-Plaza M, Tang WY, Shang Y, Umans JG, Francesconi KA, Goessler W, Ledesma M, Leon M, Laclaustra M, Pollak J, et al. . Association of global DNA methylation and global DNA hydroxymethylation with metals and other exposures in human blood DNA samples. Environ Health Perspect 2014; 122:946-54; PMID:24769358 [DOI] [PMC free article] [PubMed] [Google Scholar]
- 16. Hendrich B, Bird A. Identification and characterization of a family of mammalian methyl-CpG binding proteins. Mol Cell Biol 1998; 18:6538-47; PMID:9774669 [DOI] [PMC free article] [PubMed] [Google Scholar]
- 17. Hendrich B, Tweedie S. The methyl-CpG binding domain and the evolving role of DNA methylation in animals. Trends Genet: TIG 2003; 19:269-77; PMID:12711219; http://dx.doi.org/ 10.1016/S0168-9525(03)00080-5 [DOI] [PubMed] [Google Scholar]
- 18. Arand J, Spieler D, Karius T, Branco MR, Meilinger D, Meissner A, Jenuwein T, Xu G, Leonhardt H, Wolf V, et al. . In vivo control of CpG and non-CpG DNA methylation by DNA methyltransferases. PLoS Genet 2012; 8:e1002750. [DOI] [PMC free article] [PubMed] [Google Scholar]
- 19. Jones PA. Functions of DNA methylation: islands, start sites, gene bodies and beyond. Nat Rev Genet 2012; 13:484-92; PMID:22641018; http://dx.doi.org/ 10.1038/nrg3230 [DOI] [PubMed] [Google Scholar]
- 20. Sofer T, Schifano ED, Hoppin JA, Hou L, Baccarelli AA. A-clustering: a novel method for the detection of co-regulated methylation regions, and regions associated with exposure. Bioinformatics 2013; 29:2884-91; PMID:23990415; http://dx.doi.org/ 10.1093/bioinformatics/btt498 [DOI] [PMC free article] [PubMed] [Google Scholar]
- 21. Jaffe AE, Murakami P, Lee H, Leek JT, Fallin MD, Feinberg AP, Irizarry RA. Bump hunting to identify differentially methylated regions in epigenetic epidemiology studies. Int J Epidemiol 2012; 41:200-9; PMID:22422453; http://dx.doi.org/ 10.1093/ije/dyr238 [DOI] [PMC free article] [PubMed] [Google Scholar]
- 22. Jurkowska RZ, Jurkowski TP, Jeltsch A. Structure and function of mammalian DNA methyltransferases. Chembiochem: Eur J Chem Biol 2011; 12:206-22; PMID:21243710; http://dx.doi.org/ 10.1002/cbic.201000195 [DOI] [PubMed] [Google Scholar]
- 23. Wright RO, Schwartz J, Wright RJ, Bollati V, Tarantini L, Park SK, Hu H, Sparrow D, Vokonas P, Baccarelli A. Biomarkers of lead exposure and DNA methylation within retrotransposons. Environ Health Perspect 2010; 118:790-5; PMID:20064768; http://dx.doi.org/ 10.1289/ehp.0901429 [DOI] [PMC free article] [PubMed] [Google Scholar]
- 24. Senut MC, Sen A, Cingolani P, Shaik A, Land SJ, Ruden DM. Lead exposure disrupts global DNA methylation in human embryonic stem cells and alters their neuronal differentiation. Toxicol Sci: Off J Soc Toxicol 2014; 139:142-61; PMID:24519525; http://dx.doi.org/ 10.1093/toxsci/kfu028 [DOI] [PMC free article] [PubMed] [Google Scholar]
- 25. Cingolani P, Cao X, Khetani RS, Chen CC, Coon M, Sammak A, Bollig-Fischer A, Land S, Huang Y, Hudson ME, et al. . Intronic non-CG DNA hydroxymethylation and alternative mRNA splicing in honey bees. BMC Genomics 2013; 14:666; PMID:24079845; http://dx.doi.org/ 10.1186/1471-2164-14-666 [DOI] [PMC free article] [PubMed] [Google Scholar]
- 26. Barker DJ, Eriksson JG, Forsen T, Osmond C. Fetal origins of adult disease: strength of effects and biological basis. Int J Epidemiol 2002; 31:1235-9; PMID:12540728; http://dx.doi.org/ 10.1093/ije/31.6.1235 [DOI] [PubMed] [Google Scholar]
- 27. Koestler DC, Avissar-Whiting M, Houseman EA, Karagas MR, Marsit CJ. Differential DNA methylation in umbilical cord blood of infants exposed to low levels of arsenic in utero. Environ Health Perspect 2013; 121:971-7; PMID:23757598; http://dx.doi.org/ 10.1289/ehp.1205925 [DOI] [PMC free article] [PubMed] [Google Scholar]
- 28. Kile ML, Houseman EA, Baccarelli AA, Quamruzzaman Q, Rahman M, Mostofa G, Cardenas A, Wright RO, Christiani DC. Effect of prenatal arsenic exposure on DNA methylation and leukocyte subpopulations in cord blood. Epigenet: Off J DNA Methylation Soc 2014; 9:774-82; PMID:24525453; http://dx.doi.org/ 10.4161/epi.28153 [DOI] [PMC free article] [PubMed] [Google Scholar]
- 29. Champagne FA, Weaver IC, Diorio J, Dymov S, Szyf M, Meaney MJ. Maternal care associated with methylation of the estrogen receptor-alpha1b promoter and estrogen receptor-alpha expression in the medial preoptic area of female offspring. Endocrinology 2006; 147:2909-15; PMID:16513834; http://dx.doi.org/ 10.1210/en.2005-1119 [DOI] [PubMed] [Google Scholar]
- 30. Liu J, Morgan M, Hutchison K, Calhoun VD. A study of the influence of sex on genome wide methylation. PloS One 2010; 5:e10028; PMID:20386599; http://dx.doi.org/ 10.1371/journal.pone.0010028 [DOI] [PMC free article] [PubMed] [Google Scholar]
- 31. Dedeurwaerder S, Defrance M, Calonne E, Denis H, Sotiriou C, Fuks F. Evaluation of the Infinium Methylation 450K technology. Epigenomics 2011; 3:771-84; PMID:22126295; http://dx.doi.org/ 10.2217/epi.11.105 [DOI] [PubMed] [Google Scholar]
- 32. Sean Davis PD, Sven B, Tim T, Jr, Moiz B. methylumi: Handle Illumina methylation data. R Package Version 2100 2014; http://www.bioconductor.org/packages/release/bioc/html/methylumi.html [Google Scholar]
- 33. Szwagierczak A, Brachmann A, Schmidt CS, Bultmann S, Leonhardt H, Spada F. Characterization of PvuRts1I endonuclease as a tool to investigate genomic 5-hydroxymethylcytosine. Nucleic Acids Res 2011; 39:5149-56; PMID:21378122; http://dx.doi.org/ 10.1093/nar/gkr118 [DOI] [PMC free article] [PubMed] [Google Scholar]
- 34. Gao F, Xia Y, Wang J, Luo H, Gao Z, Han X, Zhang J, Huang X, Yao Y, Lu H, et al. . Integrated detection of both 5-mC and 5-hmC by high-throughput tag sequencing technology highlights methylation reprogramming of bivalent genes during cellular differentiation. Epigenet: Off J DNA Methylation Soc 2013; 8:421-30; PMID:23502161; http://dx.doi.org/ 10.4161/epi.24280 [DOI] [PMC free article] [PubMed] [Google Scholar]
- 35. Chen YA, Lemire M, Choufani S, Butcher DT, Grafodatskaya D, Zanke BW, Gallinger S, Hudson TJ, Weksberg R. Discovery of cross-reactive probes and polymorphic CpGs in the Illumina Infinium HumanMethylation450 microarray. Epigenet: Off J DNA Methylation Soc 2013; 8:203-9; PMID:23314698; http://dx.doi.org/ 10.4161/epi.23470 [DOI] [PMC free article] [PubMed] [Google Scholar]
- 36. Robertson J, Robertson AB, Klungland A. The presence of 5-hydroxymethylcytosine at the gene promoter and not in the gene body negatively regulates gene expression. Biochem Biophys Res Commun 2011; 411:40-3; PMID:21703242; http://dx.doi.org/ 10.1016/j.bbrc.2011.06.077 [DOI] [PubMed] [Google Scholar]
- 37. Ficz G, Branco MR, Seisenberger S, Santos F, Krueger F, Hore TA, Marques CJ, Andrews S, Reik W. Dynamic regulation of 5-hydroxymethylcytosine in mouse ES cells and during differentiation. Nature 2011; 473:398-402; PMID:21460836; http://dx.doi.org/ 10.1038/nature10008 [DOI] [PubMed] [Google Scholar]
- 38. Senut MC, Cingolani P, Sen A, Kruger A, Shaik A, Hirsch H, Suhr ST, Ruden D. Epigenetics of early-life lead exposure and effects on brain development. Epigenomics 2012; 4:665-74; PMID:23244311; http://dx.doi.org/ 10.2217/epi.12.58 [DOI] [PMC free article] [PubMed] [Google Scholar]
- 39. Mergler D. Neurotoxic exposures and effects: gender and sex matter! Hanninen Lecture 2011. Neurotoxicology 2012; 33:644-51; PMID:22664101; http://dx.doi.org/ 10.1016/j.neuro.2012.05.009 [DOI] [PubMed] [Google Scholar]
- 40. Koller K, Brown T, Spurgeon A, Levy L. Recent developments in low-level lead exposure and intellectual impairment in children. Environ Health Perspect 2004; 112:987-94; PMID:15198918; http://dx.doi.org/ 10.1289/ehp.6941 [DOI] [PMC free article] [PubMed] [Google Scholar]
- 41. Cecil KM, Brubaker CJ, Adler CM, Dietrich KN, Altaye M, Egelhoff JC, Wessel S, Elangovan I, Hornung R, Jarvis K, et al. . Decreased brain volume in adults with childhood lead exposure. PLoS Med 2008; 5:e112; PMID:18507499; http://dx.doi.org/ 10.1371/journal.pmed.0050112 [DOI] [PMC free article] [PubMed] [Google Scholar]
- 42. Weston HI, Weston DD, Allen JL, Cory-Slechta DA. Sex-dependent impacts of low-level lead exposure and prenatal stress on impulsive choice behavior and associated biochemical and neurochemical manifestations. Neurotoxicology 2014; 44:169-83; PMID:25010656; http://dx.doi.org/ 10.1016/j.neuro.2014.06.013 [DOI] [PMC free article] [PubMed] [Google Scholar]
- 43. Mansouri MT, Naghizadeh B, Lopez-Larrubia P, Cauli O. Behavioral deficits induced by lead exposure are accompanied by serotonergic and cholinergic alterations in the prefrontal cortex. Neurochem Int 2013; 62:232-9; PMID:23266395; http://dx.doi.org/ 10.1016/j.neuint.2012.12.009 [DOI] [PubMed] [Google Scholar]
- 44. Schneider J, Anderson D, Talsania K, Mettil W, Vadigepalli R. Effects of developmental lead exposure on the hippocampal transcriptome: influences of sex, developmental period, and lead exposure level. Toxicol Sci 129:108-25; PMID:22641619; http://dx.doi.org/ 10.1093/toxsci/kfs189 [DOI] [PMC free article] [PubMed] [Google Scholar]
- 45. Pilsner JR, Hall MN, Liu X, Ilievski V, Slavkovich V, Levy D, Factor-Litvak P, Yunus M, Rahman M, Graziano JH, et al. . Influence of prenatal arsenic exposure and newborn sex on global methylation of cord blood DNA. PloS One 2012; 7:e37147; PMID:22662134; http://dx.doi.org/ 10.1371/journal.pone.0037147 [DOI] [PMC free article] [PubMed] [Google Scholar]
- 46. Faulk C, Barks A, Liu K, Goodrich JM, Dolinoy DC. Early-life lead exposure results in dose- and sex-specific effects on weight and epigenetic gene regulation in weanling mice. Epigenomics 2013; 5:487-500; PMID:24059796; http://dx.doi.org/ 10.2217/epi.13.49 [DOI] [PMC free article] [PubMed] [Google Scholar]
- 47. Xu S, Wang Y, Roe B, Pearson WR. Characterization of the human class Mu glutathione S-transferase gene cluster and the GSTM1 deletion. J Biol Chem 1998; 273:3517-27; PMID:9452477; http://dx.doi.org/ 10.1074/jbc.273.6.3517 [DOI] [PubMed] [Google Scholar]
- 48. Pearson WR, Vorachek WR, Xu SJ, Berger R, Hart I, Vannais D, Patterson D. Identification of class-mu glutathione transferase genes GSTM1-GSTM5 on human chromosome 1p13. Am J Hum Genet 1993; 53:220-33; PMID:8317488 [PMC free article] [PubMed] [Google Scholar]
- 49. Daggett DA, Oberley TD, Nelson SA, Wright LS, Kornguth SE, Siegel FL. Effects of lead on rat kidney and liver: GST expression and oxidative stress. Toxicology 1998; 128:191-206; PMID:9750042; http://dx.doi.org/ 10.1016/S0300-483X(98)00080-8 [DOI] [PubMed] [Google Scholar]
- 50. Sugawara E, Nakamura K, Miyake T, Fukumura A, Seki Y. Lipid peroxidation and concentration of glutathione in erythrocytes from workers exposed to lead. Brit J Ind Med 1991; 48:239-42; PMID:2025589 [DOI] [PMC free article] [PubMed] [Google Scholar]
- 51. Lawton LJ, Donaldson WE. Lead-induced tissue fatty acid alterations and lipid peroxidation. Biol Trace Elem Res 1991; 28:83-97; PMID:1709034; http://dx.doi.org/ 10.1007/BF02863075 [DOI] [PubMed] [Google Scholar]
- 52. Wu H, D'Alessio AC, Ito S, Wang Z, Cui K, Zhao K, Sun YE, Zhang Y. Genome-wide analysis of 5-hydroxymethylcytosine distribution reveals its dual function in transcriptional regulation in mouse embryonic stem cells. Genes Dev 2011; 25:679-84; PMID:21460036; http://dx.doi.org/ 10.1101/gad.2036011 [DOI] [PMC free article] [PubMed] [Google Scholar]
- 53. Murphy SK, Huang Z, Hoyo C. Differentially methylated regions of imprinted genes in prenatal, perinatal and postnatal human tissues. PloS One 2012; 7:e40924; PMID:22808284; http://dx.doi.org/ 10.1371/journal.pone.0040924 [DOI] [PMC free article] [PubMed] [Google Scholar]
- 54. Ono R, Nakamura K, Inoue K, Naruse M, Usami T, Wakisaka-Saito N, Hino T, Suzuki-Migishima R, Ogonuki N, Miki H, et al. . Deletion of Peg10, an imprinted gene acquired from a retrotransposon, causes early embryonic lethality. Nat Genet 2006; 38:101-6; PMID:16341224; http://dx.doi.org/ 10.1038/ng1699 [DOI] [PubMed] [Google Scholar]
- 55. Eggermann T, Wollmann HA, Kuner R, Eggermann K, Enders H, Kaiser P, Ranke MB. Molecular studies in 37 Silver-Russell syndrome patients: frequency and etiology of uniparental disomy. Hum Genet 1997; 100:415-9; PMID:9272165; http://dx.doi.org/ 10.1007/s004390050526 [DOI] [PubMed] [Google Scholar]
- 56. Kotzot D, Schmitt S, Bernasconi F, Robinson WP, Lurie IW, Ilyina H, Mehes K, Hamel BC, Otten BJ, Hergersberg M, et al. . Uniparental disomy 7 in Silver-Russell syndrome and primordial growth retardation. Hum Mol Genet 1995; 4:583-7; PMID:7633407; http://dx.doi.org/ 10.1093/hmg/4.4.583 [DOI] [PubMed] [Google Scholar]
- 57. Yamaguchi S, Shen L, Liu Y, Sendler D, Zhang Y. Role of Tet1 in erasure of genomic imprinting. Nature 2013; 504:460-4; PMID:24291790; http://dx.doi.org/ 10.1038/nature12805 [DOI] [PMC free article] [PubMed] [Google Scholar]
- 58. Kobayashi S, Kohda T, Miyoshi N, Kuroiwa Y, Aisaka K, Tsutsumi O, Kaneko-Ishino T, Ishino F. Human PEG1/MEST, an imprinted gene on chromosome 7. Hum Mol Genet 1997; 6:781-6; PMID:9158153; http://dx.doi.org/ 10.1093/hmg/6.5.781 [DOI] [PubMed] [Google Scholar]
- 59. El Hajj N, Pliushch G, Schneider E, Dittrich M, Muller T, Korenkov M, Aretz M, Zechner U, Lehnen H, Haaf T. Metabolic programming of MEST DNA methylation by intrauterine exposure to gestational diabetes mellitus. Diabetes 2013; 62:1320-8; PMID:23209187; http://dx.doi.org/ 10.2337/db12-0289 [DOI] [PMC free article] [PubMed] [Google Scholar]
- 60. Jedrychowski W, Perera FP, Jankowski J, Mrozek-Budzyn D, Mroz E, Flak E, Edwards S, Skarupa A, Lisowska-Miszczyk I. Very low prenatal exposure to lead and mental development of children in infancy and early childhood: Krakow prospective cohort study. Neuroepidemiology 2009; 32:270-8; PMID:19223686; http://dx.doi.org/ 10.1159/000203075 [DOI] [PMC free article] [PubMed] [Google Scholar]
- 61. Houseman EA, Accomando WP, Koestler DC, Christensen BC, Marsit CJ, Nelson HH, Wiencke JK, Kelsey KT. DNA methylation arrays as surrogate measures of cell mixture distribution. BMC Bioinformatics 2012; 13:86; PMID:22568884; http://dx.doi.org/ 10.1186/1471-2105-13-86 [DOI] [PMC free article] [PubMed] [Google Scholar]
- 62. Sandoval J, Heyn H, Moran S, Serra-Musach J, Pujana MA, Bibikova M, Esteller M. Validation of a DNA methylation microarray for 450,000 CpG sites in the human genome. Epigenetics: Off J DNA Methylation Soc 2011; 6:692-702; PMID:21593595; http://dx.doi.org/ 10.4161/epi.6.6.16196 [DOI] [PubMed] [Google Scholar]
- 63. Jin P, Warren ST. New insights into fragile X syndrome: from molecules to neurobehaviors. Trends Biochem Sci 2003; 28:152-8; PMID:12633995; http://dx.doi.org/ 10.1016/S0968-0004(03)00033-1 [DOI] [PubMed] [Google Scholar]
- 64. Petronis KR, Anthony JC. Social epidemiology, intra-neighbourhood correlation, and generalised estimating equations. J Epidemiol Commun Health 2003; 57:914; author reply; PMID:14600121; http://dx.doi.org/ 10.1136/jech.57.11.914 [DOI] [PMC free article] [PubMed] [Google Scholar]
- 65. Bibikova M, Barnes B, Tsan C, Ho V, Klotzle B, Le JM, Delano D, Zhang L, Schroth GP, Gunderson KL, et al. . High density DNA methylation array with single CpG site resolution. Genomics 2011; 98:288-95; PMID:21839163; http://dx.doi.org/ 10.1016/j.ygeno.2011.07.007 [DOI] [PubMed] [Google Scholar]
- 66. Du P, Zhang X, Huang CC, Jafari N, Kibbe WA, Hou L, Lin SM. Comparison of Beta-value and M-value methods for quantifying methylation levels by microarray analysis. BMC Bioinformatics 2010; 11:587; PMID:21118553; http://dx.doi.org/ 10.1186/1471-2105-11-587 [DOI] [PMC free article] [PubMed] [Google Scholar]
- 67. Teschendorff AE, Marabita F, Lechner M, Bartlett T, Tegner J, Gomez-Cabrero D, Beck S. A beta-mixture quantile normalization method for correcting probe design bias in Illumina Infinium 450 k DNA methylation data. Bioinformatics 2013; 29:189-96; PMID:23175756; http://dx.doi.org/ 10.1093/bioinformatics/bts680 [DOI] [PMC free article] [PubMed] [Google Scholar]
- 68. Touleimat N, Tost J. Complete pipeline for Infinium((R)) Human Methylation 450K BeadChip data processing using subset quantile normalization for accurate DNA methylation estimation. Epigenomics 2012; 4:325-41; PMID:22690668; http://dx.doi.org/ 10.2217/epi.12.21 [DOI] [PubMed] [Google Scholar]
- 69. Johnson WE, Li C, Rabinovic A. Adjusting batch effects in microarray expression data using empirical Bayes methods. Biostatistics 2007; 8:118-27; PMID:16632515; http://dx.doi.org/ 10.1093/biostatistics/kxj037 [DOI] [PubMed] [Google Scholar]
- 70. Barfield RT, Kilaru V, Smith AK, Conneely KN. CpGassoc: an R function for analysis of DNA methylation microarray data. Bioinformatics 2012; 28:1280-1; PMID:22451269; http://dx.doi.org/ 10.1093/bioinformatics/bts124 [DOI] [PMC free article] [PubMed] [Google Scholar]
- 71. Aryee MJ, Jaffe AE, Corrada-Bravo H, Ladd-Acosta C, Feinberg AP, Hansen KD, Irizarry RA. Minfi: a flexible and comprehensive Bioconductor package for the analysis of Infinium DNA methylation microarrays. Bioinformatics 2014; 30:1363-9; PMID:24478339; http://dx.doi.org/ 10.1093/bioinformatics/btu049 [DOI] [PMC free article] [PubMed] [Google Scholar]
- 72. Falcon S, Gentleman R. Using GOstats to test gene lists for GO term association. Bioinformatics 2007; 23:257-8; PMID:17098774; http://dx.doi.org/ 10.1093/bioinformatics/btl567 [DOI] [PubMed] [Google Scholar]
Associated Data
This section collects any data citations, data availability statements, or supplementary materials included in this article.