

Abstract
Background
Cancer pharmacogenetic studies use archival tumor samples as a DNA source when germline DNA is unavailable. Genotyping DNA from formalin‐fixed paraffin embedded tumors (FFPE‐T) may be inaccurate due to FFPE storage, genetic aberrations, and/or insufficient DNA extraction. Our objective was to assess the extent and source of genotyping inaccuracy from FFPE‐T DNA and demonstrate analytical validity of FFPE‐T genotyping of candidate single nucleotide polymorphisms (SNPs) for pharmacogenetic analyses.
Methods
Cancer pharmacogenetics SNPs were genotyped by Sequenom MassARRAYs in DNA harvested from matched FFPE‐T, FFPE lymph node (FFPE‐LN), and whole blood leukocyte samples obtained from breast cancer patients. No‐ and discordant‐call rates were calculated for each tissue type and SNP. Analytical validity was defined as any SNP with <5% discordance between FFPE‐T and blood and <10% discordance plus no‐calls.
Results
Matched samples from 114 patients were genotyped for 247 SNPs. No‐call rate in FFPE‐T was greater than FFPE‐LN and blood (4.3% vs. 3.0% vs. 0.5%, p < 0.001). Discordant‐call rate between FFPE‐T and blood was very low, but greater than that between FFPE‐LN and blood (1.1% vs. 0.3%, p < 0.001). Samples with heterozygous genotypes were more likely to be no‐ or discordantly‐called in either tissue (p < 0.001). Analytical validity of FFPE‐T genotyping was demonstrated for 218 (88%) SNPs.
Conclusions
No‐ and discordant‐call rates were below concerning thresholds, confirming that most SNPs can be accurately genotyped from FFPE‐T on our Sequenom platform. FFPE‐T is a viable DNA source for prospective–retrospective pharmacogenetic analyses of clinical trial cohorts.
Keywords: Germline genome, Somatic genome, Formalin-fixed paraffin embedded, FFPE, Cancer, Pharmacogenetics
Highlights
Genotyping DNA from FFPE‐T specimens is highly concordant (≈99%) with genotyping germline DNA.
The small loss of genotyping performance is attributable to inadequate DNA yield, not genetic rearrangement.
Analytic validity of genotyping from FFPE‐T on our Sequenom array was documented for 218 cancer pharmacogenetics SNPs.
FFPE‐T DNA is a viable alternative for prospective–retrospective pharmacogenetic analyses of clinical trials.
Abbreviations
- FFPE
formalin-fixed paraffin embedded
- FFPE-T
Formalin-fixed paraffin embedded tumor
- FFPE-LN
formalin-fixed paraffin embedded lymph node
- SNP
single nucleotide polymorphism
- MAF
minor allele frequency
- HWE
Hardy–Weinberg Equilibrium
1. Introduction
In cancer there are two relevant genomes, that of the tumor (somatic) and the patient (germline) (McLeod, 2013). The somatic genome has been the area of intense basic and clinical‐translational research. Analyses of the somatic genome across tumor types have cataloged oncogenic drivers, many of which are now targets for precision medicine (Kandoth et al., 2013). The germline genome may be less directly involved in predicting cancer treatment effectiveness compared to tumor de novo and acquired resistance mechanisms, but highly relevant for predicting cancer susceptibility and drug exposure, which can have critical downstream effects on treatment efficacy and toxicity (Hertz and McLeod, 2013; Hertz and Rae, 2015). There is great interest in discovering pharmacogenetic predictors for personalizing cancer therapy. In order to do so, DNA from cohorts of patients with long‐term clinical outcomes data are required for definitive “prospective–retrospective” pharmacogenetic analyses (Patterson et al., 2011).
Since tumor assessment is ubiquitous in cancer treatment, there are hundreds of thousands of stored specimens available for retrospective biomarker research. The ability to use the DNA extracted from these tumors, particularly those formalin‐fixed paraffin embedded (FFPE), for germline genetic association testing would dramatically increase the availability of cohorts for prospective–retrospective studies. However, germline genotyping requires demonstration of analytic validity; that the results obtained from genotyping DNA isolated from FFPE tumors (FFPE‐T) are concordant with those obtained from genotyping germline DNA. There is concern that analytic validity may be compromised due to somatic genetic alteration, DNA degradation during FFPE processing and storage, and/or low DNA yield during extraction from stored tumor specimens.
Previous publications have assessed genotype concordance between germline DNA and DNA isolated from tissues stored in a variety of conditions (Supplementary Table 1). Very high genotyping concordance (>97%) has been documented comparing germline DNA and with DNA isolated from FFPE non‐tumor tissue (Adank et al., 2006; Cannon‐Albright et al., 2011; Hagleitner et al., 2011; Vos et al., 2015; Xie et al., 2006; Zhang et al., 2015), non‐FFPE tumor tissue (Marsh et al., 2005; A. Thompson et al., 2010) and FFPE‐T tissue (Goetz et al., 2005, 2010, 2003, 2013, 2013). Despite these highly consistent findings there continues to be concern raised regarding the use of FFPE‐T DNA in retrospective–prospective studies (Nakamura et al., 2012), perhaps due to isolated reports of inadequate genotyping performance for single SNPs genotyped from FFPE‐T (Goetz et al., 2014; Marisi et al., 2014). Given these concerns, it is critical to demonstrate analytic validity of genotyping FFPE‐T prior to prospective–retrospective analyses (Greytak et al., 2015). We collected matched FFPE‐T, FFPE non‐cancer lymph node (FFPE‐LN), and germline DNA to document high genotyping concordance in CYP2D6, which we previously reported (Rae et al., 2013). In this study we reused these samples to assess the overall genotyping performance from FFPE‐T and document analytic validity of genotyping our target SNPs pertinent to cancer pharmacogenetics on a custom multiplex array in FFPE‐T DNA for prospective–retrospective analyses.
2. Methods
2.1. Patient enrollment and sample collection and processing
Details of patient recruitment and enrollment, sample collection and processing, and DNA preparation have been previously published (Rae et al., 2013). Briefly, patients seen consecutively by their University of Michigan breast medical oncology team were offered the opportunity to participate in this study, ClinicalTrial.gov identifier NCT00858585. Eligible patients were over the age of 21, carried the diagnosis of invasive breast cancer and were able to provide access to FFPE archived primary tumor and benign lymph node tissues. Patients who received neo‐adjuvant chemotherapy were eligible but patients with metastatic disease were not.
An 8 mL whole blood sample was collected in a 10 mL EDTA vacutainer tube for germline DNA isolation from peripheral leukocytes. Whole blood was stored on ice or at 4 °C. Whole blood was aliquoted within 8 h of collection into one 0.5 mL sample and the remainder into 1 mL aliquots, which were stored at −80 °C. Stored FFPE tumor blocks were obtained from the University of Michigan Pathology Department and stored at room temperature until processing. DNA was extracted from peripheral whole blood samples within 24 h of collection using the Qiagen DNeasy® Blood and Tissue Kit (kit 69506, Valencia, California, USA) and from FFPE‐T and unaffected FFPE‐LN utilizing the same kit in conjunction with a previously published protocol (Sikora et al., 2011). The amount of useable DNA was quantified in the samples via Nanodrop. DNA was stored at −80 °C until genotyping was performed.
2.2. Genotyping
Approximately 30 μL of DNA from whole blood, FFPE‐T and FFPE‐LN was submitted to the University of Michigan DNA Sequencing core. Assays were designed using standard Sequenom software (both online Assay Design Suite tools and desktop Assay Design 4.0) and assays were performed using a Sequenom MassARRAY Compact instrument, according to manufacturer's standard protocols. Results were processed to generate SNP calls automatically, using Sequenom TyperAnalyzer software, and then manually reviewed by the operator to validate the allele calls. Automatic SNP calls that were of concern, based on questionable spectra, were removed. A total of 304 unique SNPs were genotyped on 8 Sequenom MassARRAY plexes with up to 40 SNPs each. These SNPs were not selected specifically for this project, but represent a collection of candidate SNPs relevant to the metabolism, mechanism, or toxicity of breast cancer treatments, for genotyping in prospective–retrospective pharmacogenetic analyses of breast cancer clinical trials. Sample concentration was determined using a Nanodrop spectrophotometer. Ideal sample concentrations for Sequenom are between 50 and 100 ng/μl. DNA concentrations were less than optimal from FFPE‐T (median = 10.09, range: 0.78–88.0) and FFPE‐LN (median = 57.00, range 2.57–97.29).
2.3. Sample and SNP quality control
Samples with whole blood call rate <95% or tumor call rate <80% were eliminated prior to analysis. SNPs were eliminated for blood sample genotype call rate <95%, minor allele frequency <2%, or if the p‐value for Hardy–Weinberg Equilibrium (HWE) was <0.0002 (0.05/304), to remove weak or failed SNP assays.
2.4. Genotyping performance within sample types
Patients with all three matched tissue types (blood, FFPE‐T, and FFPE‐LN) that passed quality control were included in the analysis. Genotyping performance in each tissue type was compared in several ways. The overall no‐call rate was calculated for all three tissue types. The no‐call rates in FFPE‐T and FFPE‐LN were also calculated by genotype (heterozygous or homozygous), assuming the genotype call in blood was correct. Discordance was defined in two ways: strict discordance and possible discordance. Strict discordance is a different genotype call made in the tissue of interest (FFPE‐T or FFPE‐LN) compared with blood. Possible discordance combines strict discordance and instances in which a genotype call was not made in either blood or the tissue of interest (FFPE‐T or FFPE‐LN). Strict and possible discordance rates overall were calculated similarly to no‐call rates. Strict discordance rates were also calculated by genotype, and each discordant instance was categorized into the 3 possible transitions between homozygous and heterozygous, again assuming the blood genotype call was correct.
2.5. Analytical validation of SNPs
FFPE‐T genotyping results for individual SNPs were interrogated to identify SNPs with unacceptable rates of no‐calls and/or discordant calls. SNPs failed analytical validation if they had FFPE‐T strict discordance rate >5% or possible discordance rate >10%. SNPs that passed both metrics were considered analytically validated.
2.6. Statistical methods
Comparisons of call rates (no‐calls, strict discordant calls, possible discordant calls) between tissue types (blood, FFPE‐T, FFPE‐LN) were analyzed using mixed effects logistic regression with random effects for subjects and SNPs and primary covariate of interest being tissue type. Similar models were used for differences by genotype with the covariate of interest being the interaction between genotype and tissue type. Spearman Correlation was used to measure the association between no‐call or discordant call rate and DNA concentration. All statistical analyses were performed using SAS v9.3.
3. Results
3.1. Sample quality control
Flow diagrams that describe the filtering of patients and SNPs are displayed in Figure 1. After exclusion of four patients' samples due to unacceptable genotype call rates in blood (<95%, n = 1) or FFPE‐T (<80%, n = 3), 114 patients with matched samples were included in the analysis. There was a statistically significant correlation between FFPE‐T DNA concentration and call rate (r = 0.48, p < 0.0001, Supplementary Figure 1). Quality control was then performed on the 304 individual SNPs, with 247 passing all quality control metrics. These 247 SNPs were ordered by chromosomal location and assigned labels that indicate the chromosome (#) and their position (letter) (Supplementary Table 2). The eliminated SNPs (n = 57, See Supplementary Table 3) failed due to low call rate (<95%, n = 24), low minor allele frequency (MAF) (<2%, n = 31), or significant deviation from HWE (p < 0.0002, n = 2) in blood sample genotyping.
Figure 1.
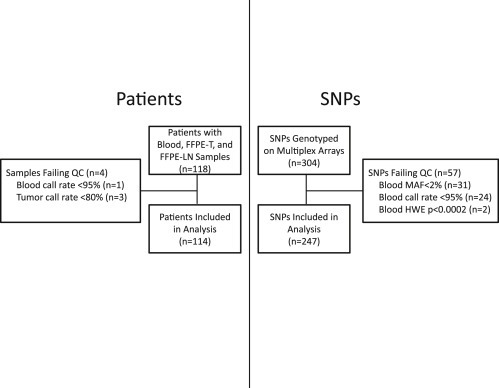
Consort Diagram for Patients and SNPs. Quality control filtering of patients whose samples failed genotyping in blood or tumor (left) and SNPs that failed genotyping in blood (right). After quality control 114 patients with matched blood, FFPE‐T and FFPE‐LN samples genotyped for 247 independent SNPs were included in the analysis. Footnote: Abbreviations: MAF: Minor allele frequency, HWE: Hardye—Weinberg Equilibrium.
3.2. Genotyping performance by tissue and sample
Concordant, discordant, and no‐calls in FFPE‐T for all patients and SNPs, and the summary rate of discordance per SNP, are displayed in Figure 2A and B, respectively. The summary no‐call and discordant call rates in all three tissue types are reported in Table 1. Across the 28,158 genotype calls in the 247 SNPs among 114 patients the overall no‐call rates were higher in the FFPE‐T (4.3%) than FFPE‐LN (3.0%), and higher in either compared to blood (0.5%) (p < 0.001 for all comparisons) (Supplementary Figure 2). The pattern was similar for strict discordant calls, with the strict discordance rate being greater in FFPE‐T than FFPE‐LN (1.1% vs. 0.3%, p < 0.001). Assuming the blood genotype is correct, heterozygous samples were significantly more likely than homozygous samples to have no‐calls or strict discordant calls in both FFPE‐T and FFPE‐LN (p < 0.001 for all comparisons). Of the strict discordant calls, the majority was heterozygous samples incorrectly called homozygous (FFPE‐T: 89.2% of 306 discordant calls, FFPE‐LN: 61.9% of 84 discordant calls).
Figure 2.
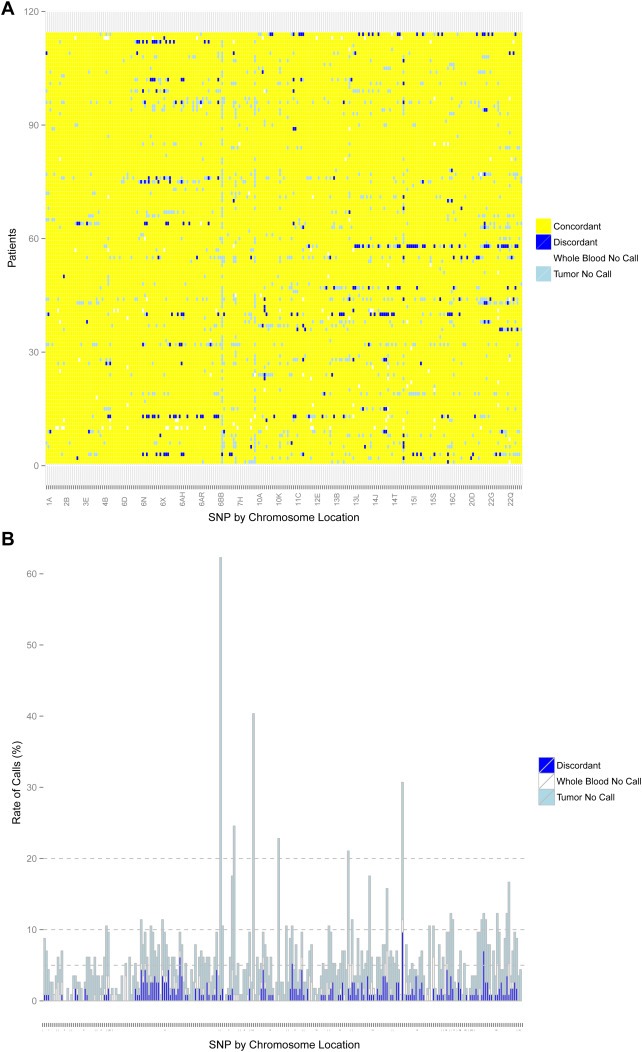
Genotyping for FFPE‐T. Concordance between FFPE‐T and blood for all patients (n = 114) and SNPs (n = 247) that passed quality control. (A) Discordant calls (blue) and no‐calls in either the tumor (light blue) or blood (white) are represented by colors. (B) The number of possible discordant calls (strict discordant calls plus no‐calls in tumor or blood) for all SNPs with stacked bars colored similarly to Figure 1A. The horizontal lines indicate cutoffs of 5%, 10%, and 20%. Overall, the tumor genotyping was highly concordant with few SNPs that failed FFPE‐T genotyping.
Table 1.
No‐call and discordant call rates in each sample type across all SNPs (n = 247) and by genotype.
| Blood | FFPE‐T | Comparison p‐valuei | FFPE‐LN | Comparison p‐valuei | FFPE‐T vs FFPE‐LN p‐value | |||
|---|---|---|---|---|---|---|---|---|
| No calls | Overalla | 0.5% (135/28158) | 4.3% (1221/28158) | <0.001 | 3.0% (843/28158) | <0.001 | <0.001 | |
| By genotypeb | Homozygous | NA | 1.8% (346/18900) | <0.001 | 2.5% (468/18900) | <0.001 | NA | |
| Heterozygous | NA | 9.5% (864/9123) | 4.0% (363/9123) | |||||
| Strict discordant callsc | Overalld | NA | 1.1% (306/26813) | NA | 0.3% (84/27192) | NA | <0.001 | |
| By genotypee | Homozygous | NA | 0.2% (33/18554) | <0.001 | 0.2% (32/18432) | <0.001 | NA | |
| Heterozygous | NA | 3.3% (273/8259) | 0.6% (52/8760) | |||||
| Direction of discordancef | Hom → Het | NA | 10.8% (33/306) | NA | 28.6% (24/84) | NA | NA | |
| Het → Hom | NA | 89.2% (273/306) | 61.9% (52/84) | |||||
| Hom → Hom | NA | 0% (0/306) | 9.5% (8/84) | |||||
| Possible discordant callsg | Overallh | NA | 5.9% (1651/28158) | NA | 3.7% (1050/28158) | NA | <0.001 | |
Abbreviations: Het = Heterozygous genotype call, Hom = Homozygous genotype call.
Overall no‐call rate calculated by: # no‐calls/28158 genotype calls (247 SNPs in 114 patients).
No‐call rate by genotype calculated by: # no‐calls/# calls of that genotype. Note this excludes 135 SNPs with no‐calls in blood.
Strict discordance defined as a genotype call was made in both blood and FFPE‐T (or FFPE‐LN) and the calls were different.
Overall strict discordant call rate calculated by: # genotype calls in FFPE‐T (or FFPE‐LN) that are different from genotype call in blood/# of genotype calls in FFPE‐T (or FFPE‐LN) and blood. Note that any sample with a no‐call in FFPE‐T (or FFPE‐LN) or blood excluded from calculation.
Strict discordance rate by genotype calculated by: # genotype calls in FFPE‐T (or FFPE‐LN) that are different from genotype call in blood/# of genotype calls in FFPE‐T (or FFPE‐LN) and blood of that genotype. Note that any sample with a no‐call in FFPE‐T (or FFPE‐LN) or blood excluded form calculation.
Type of discordance with the genotype call in blood first and the genotype call in the tissue of interest second. Percentage calculated as the # of discordant calls in that direction/the number of total discordant calls.
Possible discordance defined as either a strict discordant call was made or a genotype call was not made in blood or FFPE‐T (or FFPE‐LN).
Overall possible discordance calculated by: # of genotype calls in FFPE‐T (or FFPE‐LN) that are different from genotype calls in blood plus number of no‐calls in FFPE‐T (or FFPE‐LN) or blood/28158 genotype calls (247 SNPs in 114 patients).
P‐values compare FFPE‐T or FFPE‐LN vs. blood, FFPE‐T vs. FFPE‐LN, or homozygous vs. heterozygous within sample type, as appropriate.
When assessed by patient sample sets across 247 SNPs the discordance was not randomly distributed. The majority of FFPE‐T samples had no strict discordant calls (64/114 = 56.1%), while 6 (4.2%) had strict discordance rates >5%. There was a weak, but statistically significant inverse correlation between FFPE‐T DNA concentration and strict discordance (r = −0.20, p = 0.031, Supplementary Figure 3).
3.3. Analytical validation of SNPs
Looking within each SNP across all 114 samples, 29 unique SNPs failed at least one performance metric in FFPE‐T genotyping. Four SNPs (4/247 = 1.6%) had a strict discordance rate >5% (Table 2, Figure 3), 28 (11.3%) SNPs had a possible discordance rate >10% (Table 3), and 3 SNPs failed both metrics. Overall 88.3% (218/247) of the SNPs were analytically validated (Supplementary Figure 4).
Table 2.
SNPs with strict discordance >5% in FFPE‐T.
| Study label | Gene | rsID | Strict discordance (# FFPE‐T discordant/# genotype calls in blood and tumor) |
|---|---|---|---|
| 6AI | ESR1 | rs2347869 | 6% (7/110) |
| 11B | PGR | rs500760 | 6% (6/108) |
| 15E | CYP19A1 | rs9806371 | 12% (11/90) |
| 22E | COMT | rs4633 | 7% (8/108) |
Figure 3.
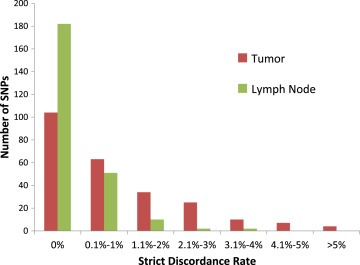
Strict discordance rates for FFPE‐T and FFPE‐LN. Histogram of the strict discordance rates in FFPE‐T and FFPE‐LN, each compared with blood, for all SNPs included in the analysis. Overall the discordance rates were quite low, with very few SNPs having more than 1% discordant calls between either tissue of interest and blood.
Table 3.
SNPs with possible discordance >10% in FFPE‐T.
| Study label | Gene | rsID | # FFPE‐T strict discordant calls | # FFPE‐T no‐calls | # blood no‐calls | Possible discordancea |
|---|---|---|---|---|---|---|
| 4E | VEGFC | rs1485766 | 1 | 8 | 3 | 10.5% |
| 6O | ESR1 | rs2046210 | 5 | 7 | 1 | 11.4% |
| 6T | ESR1 | rs3853250 | 3 | 8 | 1 | 10.5% |
| 6Z | ESR1 | rs1709181 | 4 | 8 | 1 | 11.4% |
| 6BD | OPRM1 | rs1799971 | 1 | 70 | 0 | 62.3% |
| 7A | Intergenic | rs2097903 | 2 | 10 | 0 | 10.5% |
| 7F | ABCB1 | rs2032582 | 2 | 15 | 3 | 17.5% |
| 7G | CYP3A | rs10273424 | 0 | 27 | 1 | 24.6% |
| 9A | SLC28A3 | rs7853758 | 0 | 44 | 2 | 40.4% |
| 10M | CYP2C8 | rs11188172 | 0 | 25 | 1 | 22.8% |
| 10Q | CYP17A1 | rs4919687 | 0 | 12 | 0 | 10.5% |
| 11Bb | PGR | rs500760 | 6 | 6 | 0 | 10.5% |
| 12M | NCOR2 | rs1812730 | 1 | 10 | 1 | 10.5% |
| 13J | HTR2A | rs6311 | 2 | 18 | 4 | 21.1% |
| 13L | SLC10A2 | rs2301159 | 3 | 7 | 3 | 11.4% |
| 14I | ESR2 | rs1952585 | 1 | 18 | 1 | 17.5% |
| 14R | AKT1 | rs2494732 | 3 | 10 | 5 | 15.8% |
| 15Eb | CYP19A1 | rs9806371 | 11 | 22 | 2 | 30.7% |
| 15S | CYP19A1 | rs730154 | 0 | 10 | 2 | 10.5% |
| 15U | CYP19A1 | rs4774585 | 2 | 5 | 5 | 10.5% |
| 16D | SPG7 | rs12960 | 4 | 10 | 0 | 12.3% |
| 17A | PELP1 | rs9436 | 2 | 11 | 0 | 11.4% |
| 22D | COMT | rs6269 | 1 | 12 | 0 | 11.4% |
| 22Eb | COMT | rs4633 | 8 | 6 | 0 | 12.3% |
| 22F | COMT | rs4818 | 3 | 10 | 0 | 11.4% |
| 22L | EP300 | rs20551 | 1 | 8 | 5 | 12.3% |
| 22Q | NDUFA6 | rs1801311 | 4 | 10 | 0 | 12.3% |
| 22R | CYP2D6 | rs28371738 | 1 | 13 | 5 | 16.7% |
Calculated as: # of strict discordant calls + FFPE‐T no‐calls + blood no‐calls/number of patients (n = 114).
Also failed due to strict discordance >5% in FFPE‐T (Table 2).
4. Discussion
In this study, we assessed the genotyping performance in DNA extracted from FFPE‐T samples for 247 cancer pharmacogenetic SNPs genotyped on a custom Sequenom panel. Overall we found adequate call rates (95.7%) and very strong concordance (98.9%) to germline genotyping, consistent with previous publications (Goetz et al., 2005, 2010, 2003, 2013, 2013), reaffirming the analytic validity of genotyping stored tumor specimens for prospective–retrospective secondary analyses of clinical trials. The no‐call rate in FFPE‐T (4.3%) is below typical thresholds used for quality control in pharmacogenetic analyses (<5%) and the extremely low rate of strict discordant calls (1.1%) is well below reasonable thresholds of concern for correlative pharmacogenetic research. Analytic validity was demonstrated for genotyping 218 unique candidate SNPs on our custom platform from DNA extracted from FFPE‐T.
There are several theoretical concerns with genotyping FFPE‐T DNA. The first is the degradation of DNA from formalin fixation and long‐term storage. Assessment of matched FFPE‐LN enables us to isolate the contribution of FFPE processing and storage to the genotyping error seen in this study. The no‐call rate in FFPE‐LN was approximately 70% of that of FFPE‐T, suggesting that most of the non‐calling in FFPE‐T is attributable to the FFPE process, consistent with what we reported previously for matched CYP2D6 genotyping (Rae et al., 2013). The extremely low rate of discordance in FFPE‐LN (0.3%) is in line with discordance rates from comparisons of germline and FFPE non‐tumor tissue (0%–2.6%) (Adank et al., 2006; Cannon‐Albright et al., 2011; Hagleitner et al., 2011; Vos et al., 2015; Xie et al., 2006; Zhang et al., 2015) and similar to the 3% discordance reported in a comparison of matched fresh frozen and FFPE ovarian tumors genotyped on a genome‐wide genotyping array (E. R. Thompson et al., 2005). In a secondary analysis we identified a slight increase in FFPE‐T strict discordance rate as the amount of time in FFPE storage increased (spearman correlation r = 0.22, p = 0.017), which is consistent with an increasing loss of DNA quality reported by others (Hedegaard et al., 2014). These findings clearly demonstrate that the FFPE processing and long‐term storage have a small, but real, effect on genotyping performance.
Somatic genetic aberrations, including LOH, are the second potential concern with FFPE‐T genotyping. The strict discordance in FFPE‐LN only accounted for 27.2% of that seen in FFPE‐T, suggesting that the tumor genome may introduce some genotyping errors, as has been documented by some groups for individual SNPs (Goetz et al., 2014; Marisi et al., 2014). It is even possible that the discordance seen in a given patient could depend on the section of tumor from which the DNA was extracted due to intra‐tumor heterogeneity. Alternatively, several other groups have reported high concordance (>98.9%) between comparisons of germline and frozen (non‐FFPE) tumor (Marsh et al., 2005; A. Thompson et al., 2010) and matched FFPE normal and malignant tissue (Ahern et al., 2010; Schneider et al., 2006). This high concordance in direct comparisons of tumor versus normal that were similarly processed and stored confirms that the tumor genome introduces very little genotyping error. The enrichment of discordance within heterozygous samples could be taken as evidence that tumor LOH interferes with genotyping accuracy a small amount, however, LOH is not the only, or even the most likely, explanation for this enrichment. The Sequenom MassARRAY calls genotypes by signal detection from each allele; therefore, accurate genotype calling of heterozygous samples can be more challenging, particularly for assays with differential binding efficiencies. This alternative hypothesis is supported by the coincident enrichment in heterozygous samples for no‐calls, which would not be a consequence of LOH, and strict discordant calls in heterozygous FFPE‐LN samples, which do not contain LOH.
The final concern with FFPE‐T genotyping is the comparatively low yield of DNA extracted from these samples. We found that no‐call and discordant call rates were higher in FFPE‐T with lower DNA concentration. DNA extraction yield can vary greatly depending on the tumor sample type (i.e. core biopsy or section), size, and tumor content and genotyping platforms vary in their minimal DNA requirement and sensitivity to low DNA concentration. Thus, ensuring adequate sample availability, maximizing DNA extraction, and using genotyping platforms that are less sensitive to the amount of DNA template could further improve genotyping performance from FFPE‐T.
Filtering samples with low genotype call rate is a standard aspect of genotyping quality control; three tumor samples with call rate <80% were eliminated from this analysis. Retaining these samples in the analysis would have increased the rate of tumor no‐calls and discordant calls, potentially leading to classification of additional SNPs as FFPE‐T failures. Conversely, setting a more stringent threshold, such as call rate <90%, would have eliminated additional samples and decreased the amount of discordance and the number of FFPE‐T SNP failures. Similarly, adjusting the discordance thresholds above which SNPs were classified as FFPE‐T failures has a direct consequence on the proportion of SNPs considered analytically validated, as depicted by the horizontal lines in Figure 2B.
The generalizability of these findings to other SNPs, tumor types, or genotyping protocols is limited. It is not possible to extrapolate our findings to SNPs that were not interrogated in our system and we could not identify any genes or genetic regions that were particularly difficult to genotype due to the small number of individual genes represented by multiple SNPs (data not shown). Analytic validity of our platform may not extend to FFPE‐T samples from other cancer types given the differences in frequency of somatic genetic mutation, rearrangement, and LOH across cancers (Cancer Genome Atlas Network, 2012a; Cancer Genome Atlas Network, 2012b; Cancer Genome Atlas Research Network, 2012). The SNPs that were analytically validated in this study are likely specific to the genotyping platform (Nasri et al., 2010) and multiplex assays (Horn et al., 2010) utilized within this protocol. Therefore, others should perform assessments of analytic validity for genotyping their SNPs on their platform using their samples, which may have distinct pre‐analytic features that affect genotyping performance (Bass et al., 2014).
5. Conclusions
In conclusion, genotyping from FFPE‐T for breast cancer specimens has slightly higher rates of no‐calls but is highly concordant to genotyping from germline DNA. The small loss of genotyping performance from FFPE‐T is caused primarily by lower DNA yield, which is easily identified and overcome prior to analysis. The success rate could likely be improved by limiting multiplexing (Horn et al., 2010) or performing targeted amplification prior to genotyping (Baak‐Pablo et al., 2010), if desired. While germline DNA remains the gold standard for pharmacogenetic analyses, FFPE‐T DNA is a viable alternative for prospective–retrospective analyses of clinical trials. Analyses utilizing DNA isolated from FFPE should report whether the source tissue was normal, tumor, or a mixture of the two, and document analytic validity for genotyping each SNP using the appropriate tissue source and genotyping platform. We report here analytic validity for 218 cancer pharmacogenetics SNPs that can be accurately genotyped from breast FFPE‐T on our custom Sequenom Multiplex array.
Supporting information
The following are the supplementary data related to this article:
Supplementary data
Supplementary Figure 1 Tumor DNA concentration vs. call rate. Each FFPE‐T sample is depicted by a single dot. The horizontal line is the call rate threshold (<80%) below which samples were eliminated. Eliminated samples are labeled with their DNA concentration and call rate. There was a significant correlation between FFPE‐T DNA concentration and call rate (r = 0.48, p < 0.0001), and samples with call rate <80% (n = 3) had lower average concentration (median: 1.7% vs. 11.0%, p = 0.027).
Supplementary Figure 2 No‐call rate in each sample type. Histogram of no‐call rate in each sample type across all 247 SNPs included in the analysis. The no‐call rates in all three tissues were below 5% for the vast majority of SNPs in all three samples. There are a small number of SNPs in which the no‐call rate in FFPE‐T and/or FFPE‐LN exceeded thresholds of acceptability (5%, 10%, or 20%). Footnote: 24 SNPs with blood no‐call rate >5% were eliminated during quality control.
Supplementary Figure 3 FFPE‐T DNA concentration vs. discordance rate. Each FFPE‐T sample is depicted by a single dot comparing DNA concentration and strict discordant call rate. Samples with the greatest discordance tended to have the lowest DNA concentration (r = −0.20, p = 0.031).
Supplementary Figure 4 Analytic validation of SNPs in FFPE‐tumor genotyping. The purpose of this analysis was to identify SNPs that could not be genotyped in FFPE‐T samples on our custom multiplex array. Of the 247 SNPs included in the analysis, 29 failed FFPE‐T genotyping due to unacceptably high rates of strict (>5%) and/or possible (>10%) discordance. The remaining 218 SNPs passed all performance metrics in FFPE‐T and were considered analytically validated for inclusion in future pharmacogenetic analyses.
Acknowledgments
This research was supported by the Breast Cancer Research Foundation (BCRF) (N003173 to JMR and DFH), National Institute of General Medical Sciences (1RO1GM099143 to JMR), National Institute of Dental and Craniofacial Research (5K23DE020197 to CVP), the MICHR Clinical and Translational Science Award (UL1RR024986), a grant from the Fashion Footwear Charitable Foundation of New York/QVC Presents Shoes on Sale™ (DFH), and the National Institutes of Health through the University of Michigan's Cancer Center Support Grant (P30 CA046592) by the use of the following Cancer Center Core: University of Michigan DNA Sequencing Core.
Supplementary data 1.
Supplementary data related to this article can be found at http://dx.doi.org/10.1016/j.molonc.2015.07.002.
Hertz Daniel L., Kidwell Kelley M., Thibert Jacklyn N., Gersch Christina, Regan Meredith M., Skaar Todd C., Henry N. Lynn, Hayes Daniel F., Van Poznak Catherine H., Rae James M., (2015), Genotyping concordance in DNA extracted from formalin‐fixed paraffin embedded (FFPE) breast tumor and whole blood for pharmacogenetic analyses, Molecular Oncology, 9, doi: 10.1016/j.molonc.2015.07.002.
Contributor Information
Daniel L. Hertz, Email: DLHertz@med.umich.edu
Kelley M. Kidwell, Email: kidwell@umich.edu
Jacklyn N. Thibert, Email: jthibert@med.umich.edu
Christina Gersch, Email: clgersch@med.umich.edu.
Meredith M. Regan, Email: mregan@jimmy.harvard.edu
Todd C. Skaar, Email: tskaar@iu.edu
N. Lynn Henry, Email: norahh@med.umich.edu.
Daniel F. Hayes, Email: hayesdf@med.umich.edu
Catherine H. Van Poznak, Email: cvanpoz@med.umich.edu
James M. Rae, Email: jimmyrae@med.umich.edu
References
- Adank, M.A. , Brogi, E. , Bogomolniy, F. , Wadsworth, E.A. , Lafaro, K.J. , Yee, C.J. , 2006. Accuracy of BRCA1 and BRCA2 founder mutation analysis in formalin-fixed and paraffin-embedded (FFPE) tissue. (Electronic version) Fam. Cancer. 5, (4) 337–342. [DOI] [PubMed] [Google Scholar]
- Ahern, T.P. , Christensen, M. , Cronin-Fenton, D.P. , Lunetta, K.L. , Rosenberg, C.L. , Sorensen, H.T. , 2010. Concordance of metabolic enzyme genotypes assayed from paraffin-embedded, formalin-fixed breast tumors and normal lymphatic tissue. (Electronic version) Clin. Epidemiol. 2, 241–246. [DOI] [PMC free article] [PubMed] [Google Scholar]
- Baak-Pablo, R. , Dezentje, V. , Guchelaar, H.J. , van der Straaten, T. , 2010. Genotyping of DNA samples isolated from formalin-fixed paraffin-embedded tissues using preamplification. (Electronic version) J. Mol. Diagn. 12, (6) 746–749. [DOI] [PMC free article] [PubMed] [Google Scholar]
- Bass, B.P. , Engel, K.B. , Greytak, S.R. , Moore, H.M. , 2014. A review of preanalytical factors affecting molecular, protein, and morphological analysis of formalin-fixed, paraffin-embedded (FFPE) tissue: how well do you know your FFPE specimen?. (Electronic version) Arch. Pathol. Lab. Med. 138, (11) 1520–1530. [DOI] [PubMed] [Google Scholar]
- Cancer Genome Atlas Network, 2012. Comprehensive molecular characterization of human colon and rectal cancer. (Electronic version) Nature. 487, (7407) 330–337. [DOI] [PMC free article] [PubMed] [Google Scholar]
- Cancer Genome Atlas Network, 2012. Comprehensive molecular portraits of human breast tumours. (Electronic version) Nature. 490, (7418) 61–70. [DOI] [PMC free article] [PubMed] [Google Scholar]
- Cancer Genome Atlas Research Network, 2012. Comprehensive genomic characterization of squamous cell lung cancers. (Electronic version) Nature. 489, (7417) 519–525. [DOI] [PMC free article] [PubMed] [Google Scholar]
- Cannon-Albright, L.A. , Cooper, K.G. , Georgelas, A. , Bernard, P.S. , 2011. High quality and quantity genome-wide germline genotypes from FFPE normal tissue. (Electronic version) BMC Res. Notes. 4, 159 [DOI] [PMC free article] [PubMed] [Google Scholar]
- Goetz, M.P. , Sun, J.X. , Suman, V.J. , Silva, G.O. , Perou, C.M. , Nakamura, Y. , 2014. Loss of heterozygosity at the CYP2D6 locus in breast cancer: implications for germline pharmacogenetic studies. (Electronic version) J. Natl. Cancer Inst. 107, (2) 10.1093/jnci/dju401 [DOI] [PMC free article] [PubMed] [Google Scholar]
- Goetz, M.P. , Rae, J.M. , Suman, V.J. , Safgren, S.L. , Ames, M.M. , Visscher, D.W. , 2005. Pharmacogenetics of tamoxifen biotransformation is associated with clinical outcomes of efficacy and hot flashes. (Electronic version) J. Clin. Oncol. 23, (36) 9312–9318. [DOI] [PubMed] [Google Scholar]
- Greytak, S.R. , Engel, K.B. , Bass, B.P. , Moore, H.M. , 2015. Accuracy of molecular data generated with FFPE biospecimens: lessons from the literature. (Electronic version) Cancer Res. 75, (8) 1541–1547. [DOI] [PMC free article] [PubMed] [Google Scholar]
- Hagleitner, M.M. , Coenen, M.J. , Jeuken, J.W. , Flucke, U. , Schreuder, H.W. , te Loo, D.M. , 2011. Taqman genotyping assays can be used on decalcified and paraffin-embedded tissue from patients with osteosarcoma. (Electronic version) Pediatr. Blood Cancer. 56, (1) 35–38. [DOI] [PubMed] [Google Scholar]
- Hedegaard, J. , Thorsen, K. , Lund, M.K. , Hein, A.M. , Hamilton-Dutoit, S.J. , Vang, S. , 2014. Next-generation sequencing of RNA and DNA isolated from paired fresh-frozen and formalin-fixed paraffin-embedded samples of human cancer and normal tissue. (Electronic version) PloS One. 9, (5) e98187 [DOI] [PMC free article] [PubMed] [Google Scholar]
- Hertz, D.L. , McLeod, H.L. , 2013. Use of pharmacogenetics for predicting cancer prognosis and treatment exposure, response and toxicity. (Electronic version) J. Hum. Genet. 58, (6) 346–352. [DOI] [PubMed] [Google Scholar]
- Hertz, D.L. , Rae, J. , 2015. Pharmacogenetics of cancer drugs. (Electronic version) Annu. Rev. Med. 66, 65–81. [DOI] [PubMed] [Google Scholar]
- Horn, H. , Pott, C. , Kalla, J. , Dreyling, M. , Rosenwald, A. , Ott, G. , 2010. A multiplex MALDI-TOF MS approach facilitates genotyping of DNA from formalin-fixed paraffin-embedded tumour specimens. (Electronic version) Pharmacogenet. Genomics. 20, (10) 598–604. [DOI] [PubMed] [Google Scholar]
- Kandoth, C. , McLellan, M.D. , Vandin, F. , Ye, K. , Niu, B. , Lu, C. , 2013. Mutational landscape and significance across 12 major cancer types. (Electronic version) Nature. 502, (7471) 333–339. [DOI] [PMC free article] [PubMed] [Google Scholar]
- Marisi, G. , Passardi, A. , Calistri, D. , Zoli, W. , Amadori, D. , Ulivi, P. , 2014. Discrepancies between VEGF -1154 G>A polymorphism analysis performed in peripheral blood samples and FFPE tissue. (Electronic version) Int. J. Mol. Sci. 15, (8) 13333–13343. [DOI] [PMC free article] [PubMed] [Google Scholar]
- Marsh, S. , Mallon, M.A. , Goodfellow, P. , McLeod, H.L. , 2005. Concordance of pharmacogenetic markers in germline and colorectal tumor DNA. (Electronic version) Pharmacogenomics. 6, (8) 873–877. [DOI] [PubMed] [Google Scholar]
- McLeod, H.L. , 2013. Cancer pharmacogenomics: early promise, but concerted effort needed. (Electronic version) Science (New York, N.Y.). 339, (6127) 1563–1566. [DOI] [PMC free article] [PubMed] [Google Scholar]
- Nakamura, Y. , Ratain, M.J. , Cox, N.J. , McLeod, H.L. , Kroetz, D.L. , Flockhart, D.A. , 2012. Re: CYP2D6 genotype and tamoxifen response in postmenopausal women with endocrine-responsive breast cancer: the breast international group 1-98 trial. (Electronic version) J. Natl. Cancer Inst. 104, (16) 1264 author reply 1266–8 [DOI] [PubMed] [Google Scholar]
- Nasri, S. , Anjomshoaa, A. , Song, S. , Guilford, P. , McNoe, L. , Black, M. , 2010. Oligonucleotide array outperforms SNP array on formalin-fixed paraffin-embedded clinical samples. (Electronic version) Cancer Genet. Cytogenet. 198, (1) 1–6. [DOI] [PubMed] [Google Scholar]
- Patterson, S.D. , Cohen, N. , Karnoub, M. , Truter, S.L. , Emison, E. , Khambata-Ford, S. , 2011. Prospective-retrospective biomarker analysis for regulatory consideration: white paper from the industry pharmacogenomics working group. (Electronic version) Pharmacogenomics. 12, (7) 939–951. [DOI] [PubMed] [Google Scholar]
- Rae, J.M. , Cordero, K.E. , Scheys, J.O. , Lippman, M.E. , Flockhart, D.A. , Johnson, M.D. , 2003. Genotyping for polymorphic drug metabolizing enzymes from paraffin-embedded and immunohistochemically stained tumor samples. (Electronic version) Pharmacogenetics. 13, (8) 501–507. [DOI] [PubMed] [Google Scholar]
- Rae, J.M. , Regan, M.M. , Thibert, J.N. , Gersch, C. , Thomas, D. , Leyland-Jones, B. , 2013. Concordance between CYP2D6 genotypes obtained from tumor-derived and germline DNA. (Electronic version) J. Natl. Cancer Inst. 105, (17) 1332–1334. [DOI] [PMC free article] [PubMed] [Google Scholar]
- Schneider, B.P. , Skaar, T.C. , Sledge, G.W. , Badve, S. , Li, L. , Flockhart, D.A. , 2006. Analysis of angiogenesis genes from paraffin-embedded breast tumor and lymph nodes. (Electronic version) Breast Cancer Res. Treat. 96, (3) 209–215. [DOI] [PubMed] [Google Scholar]
- Sikora, M.J. , Thibert, J.N. , Salter, J. , Dowsett, M. , Johnson, M.D. , Rae, J.M. , 2011. High-efficiency genotype analysis from formalin-fixed, paraffin-embedded tumor tissues. (Electronic version) Pharmacogenomics J. 11, (5) 348–358. [DOI] [PMC free article] [PubMed] [Google Scholar]
- Thompson, A. , Johnson, A. , Quinlan, P. , Hillman, G. , Fontecha, M. , Bray, S. , 2010. Comprehensive CYP2D6 Genotype and Adherence Affect Outcome in Breast Cancer Patients Treated with Tamoxifen Monotherapy Springer; Netherlands: [DOI] [PubMed] [Google Scholar]
- Thompson, E.R. , Herbert, S.C. , Forrest, S.M. , Campbell, I.G. , 2005. Whole genome SNP arrays using DNA derived from formalin-fixed, paraffin-embedded ovarian tumor tissue. (Electronic version) Hum. Mutat. 26, (4) 384–389. [DOI] [PubMed] [Google Scholar]
- van Huis-Tanja, L. , Kweekel, D. , Gelderblom, H. , Koopman, M. , Punt, K. , Guchelaar, H.J. , 2013. Concordance of genotype for polymorphisms in DNA isolated from peripheral blood and colorectal cancer tumor samples. (Electronic version) Pharmacogenomics. 14, (16) 2005–2012. [DOI] [PubMed] [Google Scholar]
- Vos, H.I. , van der Straaten, T. , Coenen, M.J. , Flucke, U. , te Loo, D.M. , Guchelaar, H.J. , 2015. High-quality genotyping data from formalin-fixed, paraffin-embedded tissue on the drug metabolizing enzymes and transporters plus array. (Electronic version) J. Mol. Diagn. 17, (1) 4–9. [DOI] [PubMed] [Google Scholar]
- Xie, B. , Freudenheim, J.L. , Cummings, S.S. , Singh, B. , He, H. , McCann, S.E. , 2006. Accurate genotyping from paraffin-embedded normal tissue adjacent to breast cancer. (Electronic version) Carcinogenesis. 27, (2) 307–310. [DOI] [PubMed] [Google Scholar]
- Zhang, S. , Tan, I.B. , Sapari, N.S. , Grabsch, H.I. , Okines, A. , Smyth, E.C. , 2015. Technical reproducibility of single-nucleotide and size-based DNA biomarker assessment using DNA extracted from formalin-fixed, paraffin-embedded tissues. (Electronic version) J. Mol. Diagn. 17, (3) 242–250. [DOI] [PMC free article] [PubMed] [Google Scholar]
Associated Data
This section collects any data citations, data availability statements, or supplementary materials included in this article.
Supplementary Materials
The following are the supplementary data related to this article:
Supplementary data
Supplementary Figure 1 Tumor DNA concentration vs. call rate. Each FFPE‐T sample is depicted by a single dot. The horizontal line is the call rate threshold (<80%) below which samples were eliminated. Eliminated samples are labeled with their DNA concentration and call rate. There was a significant correlation between FFPE‐T DNA concentration and call rate (r = 0.48, p < 0.0001), and samples with call rate <80% (n = 3) had lower average concentration (median: 1.7% vs. 11.0%, p = 0.027).
Supplementary Figure 2 No‐call rate in each sample type. Histogram of no‐call rate in each sample type across all 247 SNPs included in the analysis. The no‐call rates in all three tissues were below 5% for the vast majority of SNPs in all three samples. There are a small number of SNPs in which the no‐call rate in FFPE‐T and/or FFPE‐LN exceeded thresholds of acceptability (5%, 10%, or 20%). Footnote: 24 SNPs with blood no‐call rate >5% were eliminated during quality control.
Supplementary Figure 3 FFPE‐T DNA concentration vs. discordance rate. Each FFPE‐T sample is depicted by a single dot comparing DNA concentration and strict discordant call rate. Samples with the greatest discordance tended to have the lowest DNA concentration (r = −0.20, p = 0.031).
Supplementary Figure 4 Analytic validation of SNPs in FFPE‐tumor genotyping. The purpose of this analysis was to identify SNPs that could not be genotyped in FFPE‐T samples on our custom multiplex array. Of the 247 SNPs included in the analysis, 29 failed FFPE‐T genotyping due to unacceptably high rates of strict (>5%) and/or possible (>10%) discordance. The remaining 218 SNPs passed all performance metrics in FFPE‐T and were considered analytically validated for inclusion in future pharmacogenetic analyses.