Abstract
We used magnetofection (MF) to achieve high transfection efficiency into human mesenchymal stem cells (MSCs). A custom-made magnet array, matching well-to-well to a 24-well plate, was generated and characterized. Theoretical predictions of magnetic force distribution within each well demonstrated that there was no magnetic field interference among magnets in adjacent wells. An optimized protocol for efficient gene delivery to human hair follicle derived MSCs (hHF-MSCs) was established using an egfp-encoding plasmid, reaching approximately ~50% transfection efficiency without significant cytotoxicity. Then we applied the optimized MF protocol to express the pluripotency-associated transcription factor NANOG, which was previously shown to reverse the effects of organismal aging on MSC proliferation and myogenic differentiation capacity. Indeed, MF-mediated NANOG delivery increased proliferation and enhanced the differentiation of hHF-MSCs into smooth muscle cells (SMCs). Collectively, our results show that MF can achieve high levels of gene delivery to MSCs and, therefore, may be employed to moderate or reverse the effects of cellular senescence or reprogram cells to the pluripotent state without permanent genetic modification.
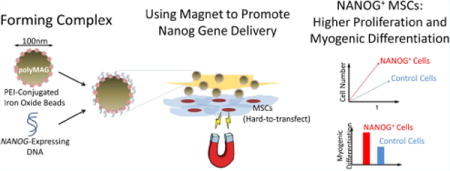
Graphical abstract
INTRODUCTION
Mesenchymal Stem Cells (MSCs) have the potential to differentiate into multiple lineages including osteocytes, chondrocytes, adipocytes, and myocytes. They can be isolated from various autologous sources such as bone marrow,1 adipose tissue,2 or hair follicle.3–6 In addition, the immune-privilege and paracrine effects of MSCs are great advantages for many regenerative medicine applications.7–9 However, donor aging and culture senescence reduce the proliferation and differentiation potential of MSCs significantly, limiting their culture time to about 8–10 passages and preventing their expandability to the large cell numbers required for cellular therapies.10–14 This is a major concern, as the patients mostly in need for cellular therapies are elderly.
NANOG is a divergent homeodomain transcription factor that is necessary to maintain embryonic stem cell (ESC) pluripotency and self-renewal in synergy with OCT4 and SOX2.15,16 Whereas ectopic expression of NANOG enhanced proliferation of NIH-3T317,18 or bone marrow derived (BM)-MSCs,19–21 the effects of NANOG on differentiation are unclear and context-dependent. Terminal differentiation of myogenic progenitors into muscle was not affected by NANOG expression but transdifferentiation into osteocytes was impaired.22 Interestingly, coexpressing NANOG and OCT4 lowered the efficacy of myoblast progenitor terminal differentiation.23 On the other hand, in human BM-MSCs, ectopic expression of NANOG enhanced chondrogenesis and osteogenesis but inhibited adipogenesis.19,20 Our group previously demonstrated that ectopic expression of NANOG in adult MSCs using lentivirus enhanced MSC proliferation and completely restored the diminished myogenic differentiation potential, as evidenced by expression of SMC marker proteins and contractile function.21 These data suggest that ectopic expression of NANOG may be employed as a strategy to overcome the effects of cellular senescence, either due to aging or extensive in vitro culturing, thereby increasing the potential of MSCs for use in regenerative medicine.
Despite these promising results, using lentivirus has some drawbacks including permanent integration of lentiviral vector into the target cell genome, which increases the likelihood of activating oncogenes or inactivating tumor suppressor genes,24 thereby hampering clinical applications. This prompted us to seek alternative strategies to overexpress NANOG in MSCs. Although nonviral delivery of plasmid DNA into cells is considered safer,25 the efficiency of gene transfer into difficult-to-transfect cells such as MSCs is very low.26 Several strategies have been proposed to enhance the transfection efficiency in primary cells including MSCs such as using cationic liposome based methods, e.g., Lipofectamine 2000,27 Fugene6, or PEI,28 but some of them suffer from cytotoxic effects and their efficiency remains cell type dependent.
On the other hand, physical methods may be used to enhance gene transfer efficiency. In particular, magnetofection (MF) uses magnetic nanoparticles (MPs) to form complexes with DNA, and then shuffle the DNA toward the cells in the presence of magnetic force, thereby significantly increasing the transfection efficiency. This simple method has been shown to yield higher transfection efficiency both in vitro and in vivo.29,30 Different MP surface modifications including cell penetrating peptide (CPPs)31 or endosomal escaping reagents (e.g., PEI) have also been proposed for further enhancement of MF efficiency.32 Although MF demonstrated dose-dependent toxicity on cells, using suitable MP:DNA ratios and proper magnetic field intensities/exposure times can decrease the detrimental impacts of MF on cells,33 resulting in successful transfection to stem cells and other difficult-to-transfect cells such as human endothelial cells,29,34,35 neural stem cells,36,37 neurons,38,39 and other primary cell types.40
In this study, we hypothesized that MF may be employed for efficient gene transfer to MSCs, enabling ectopic expression of NANOG to levels necessary to promote proliferation and enhance the differentiation potential into smooth muscle cells (SMCs). To this end, an effective MF protocol was established using an egfp-encoding plasmid for gene transfer to human hair follicle derived mesenchymal stem cells (hHF-MSCs), a relatively easily accessible source of stem cells. Unlike epidermal stem cells that originated from the epidermal compartment of the hair follicle, these cells were derived from the dermal papilla or dermal sheath and have been shown to be able to differentiate into bone, cartilage, fat, and SMCs under proper differentiation conditions.3–6,41–43 The optimization parameters included the MP:DNA ratio, the duration of MP:DNA complex incubation with cells, and the number of MF applications. The optimal MF protocol was then employed to deliver NANOG-encoding plasmid and to investigate its effects on proliferation and myogenic differentiation of hHF-MSCs.
RESULTS
Magnetic Field and Force Analysis
To perform magnetofection (MF), cells were seeded in a 24-well tissue culture plate overnight, followed by addition of the transfection complex. Subsequently, the plate was aligned with a custom-designed magnetic plate containing an array of 24 cylindrical rare-earth magnets, which matched well-to-well to a 24-well plate (Figure S1). Each magnet produces a nonuniform magnetic field exerting an attractive force on magnetic nanoparticles within each respective cell culture well. Based on the dimensions and properties of the magnets (see Experimental Procedures), the magnetic field produced by these structures was characterized (Figure 1A). It is noteworthy that when using our theoretical model to back-calculate the intensity of the magnetic field, Br,44–46 it resulted in a value of 1.26 T, which was very close to the maximum remnant magnetization value of 1.28 T. This indicated that the magnets were essentially magnetized to saturation. The measured field components Bx, By, and Bz on different planes above the magnet are also shown (Figure 1A). The theoretical field predictions are in excellent agreement with the measured data as demonstrated in Figure 1B, which shows both sets of data for Bz over a 24 mm × 24 mm square area at distance z = 1 mm above the magnet.
Figure 1.
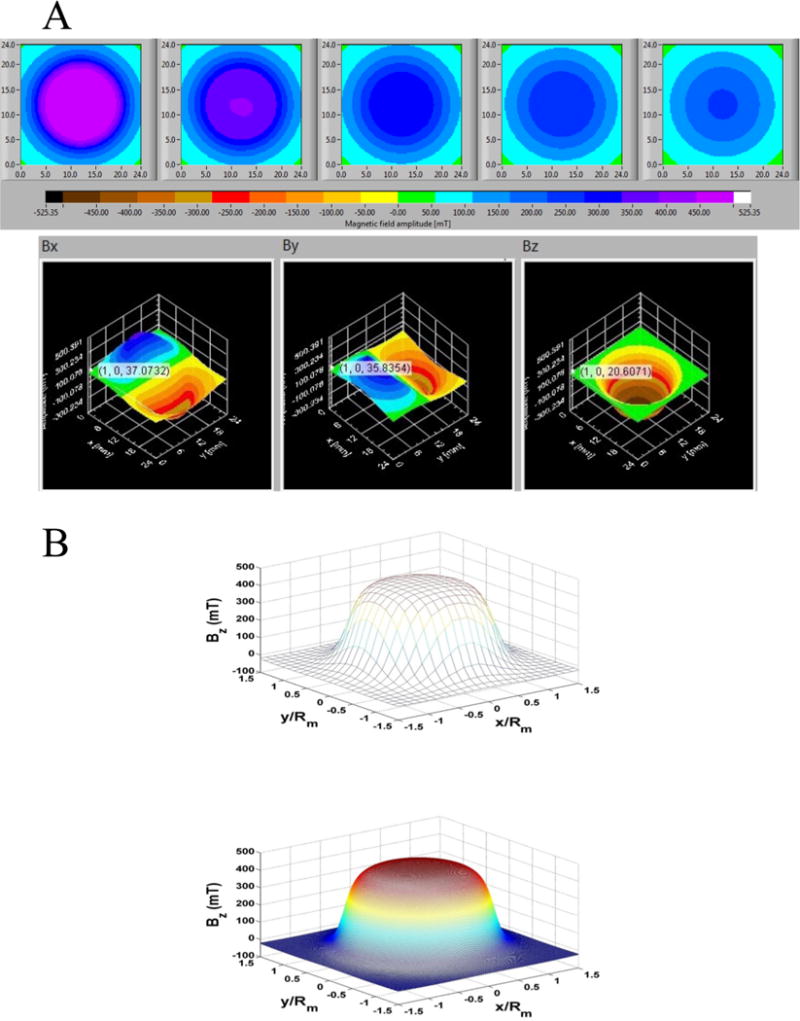
(A) Measured field data from the SENIS 3D magnetic field mapping system. The top panel (from left to right) contains plots of Btotal over a 24 mm × 24 mm area at distance z = 1, 2, 3, 4, and 5 mm. The three plots in the bottom panel are (from left to right) the spatial distribution of the field components Bx, By, and Bz over a 24 mm × 24 mm area at a distance z = 1 mm above the magnet. (B) Analysis of Bz at z = 1 mm above the magnet: (top) measured data, (bottom) theoretical predictions.
Next, the force experienced by the magnetic particles was determined by using eqs 1–3 (see Experimental Procedures). The radial and axial force components Fmr and Fmz on the particle were plotted along a line that spans the diameter of the magnet. It should be noted that these forces are axisymmetric due to the cylindrical symmetry of the magnet, and hence Fmr and Fmz (Figure 2A) were displayed here in a cross-sectional view as a function of normalized distance x/Rm from the center of the magnet. Note that the magnetic force on the particle is on the order of femto-Newtons (fN). It is instructive to compare field-directed particle transport with Brownian motion. To this end, we compare the magnetic energy expended in moving a particle a distance equal to its diameter (Dp), i.e., Emag = Fmag • Dp, with the thermal energy, kT. For this analysis we use the average magnetic force 1 mm above the magnet (Figure 2A) and find that, near the magnet, Emag is on the same order as kT. Thus, particles close to the magnet will be captured and the concentration gradient that results will accelerate the downward diffusion of more distant particles, which will ultimately be captured as well. Moreover, the particles can aggregate into clusters during transport due to attractive dipole—dipole interactions. This would result in accelerated capture due to a stronger effective magnetic force on the particle cluster.
Figure 2.
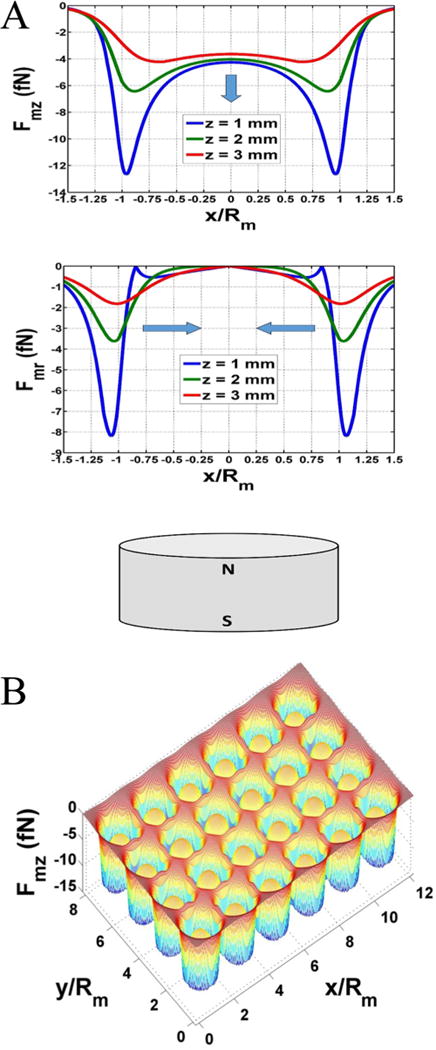
(A) Magnetic force at different distances above a magnet. Axial force = Fmz and radial force = Fmr. (B) Surface plot of axial force Fmz at z = 1 mm above the array of magnets.
Finally, a surface plot of Fmz at z = 1 mm above the entire array of 24 magnets is shown in Figure 2B. This analysis shows that there is negligible overlap in the forces of neighboring magnets, i.e., the magnetic field of a given magnet does not impact particle motion in the neighboring wells.
MF293T Significantly Improved Gene Delivery Efficiency in 293T Cells but Had Detrimental Effects on MSCs
First, we used 293T cells to develop an MF protocol for efficient gene transfer to target cells. After a series of optimization steps, we derived a protocol that resulted in almost 100% transfected cells and significant enhancement in transgene copies delivered to cells, as evidenced by increased green fluorescence intensity (GFI) (Figure S2). Briefly, 0.5:2 (μg of magnetic particles (MPs):μg of DNA) were first mixed in serum free DMEM for 20 min to allow MP:DNA complex formation before applying on top of each well of 293T cells that were cultured in DMEM supplemented with 10% FBS. Subsequently, the magnetic field was applied under the cells for 20 min followed by 20 h of incubation at 37 °C before replenishing with fresh medium. One day later, the cells were ready for analysis (Figure 3A). Our data demonstrated that the optimized MF293T protocol significantly enhanced the percentage of transfected cells as well as the number of gene copies per cell as compared to the conventional calcium phosphate precipitation method (CP) (Figure 3B). The percentage of EGFP+ cells increased significantly from 83.42 ± 4.66% with CP to 99.60 ± 0.64% with MF293T (p < 0.05, n = 3) and the GFI was enhanced by 9.47 ± 2.0-fold (p < 0.05, n = 3) from 53.63 ± 9.0 with CP to 507.96 ± 56.2 with MF293T. Fluorescence images further supported these data (Figure 3C).
Figure 3.
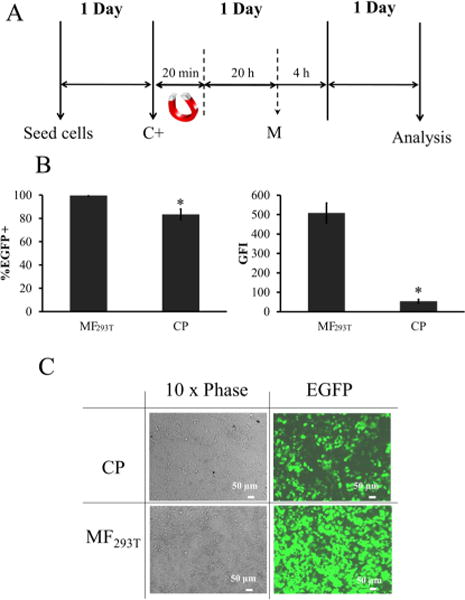
Comparison of MF293T to CP. (A) Schematic of the optimized protocol for 293T cells (MF293T). C+: addition of MP:DNA complexes and M: media change. (B) Transfection efficiency and mean GFI of 293T cells after transfection with MF293T or CP. (C) Representative images of 293T cells after transfection with MF293T or CP. All values are the mean ± SD of triplicate samples in a representative experiment (n = 3). The symbol * denotes p < 0.05 between MF293T and CP.
Next, we applied the same MF protocol to deliver the egfp gene into human hair follicle MSCs (hHF-MSCs). As shown in Figure 4, the percentage of EGFP+ cells was significantly lower (36.66 ± 1.25%) (Figure 4A) and cytotoxicity was high (74.36 ± 3.96% cell death among transfected cells, p < 0.05 compared to nontreated cells, n = 3; Figure 4B). Toxicity was the result of treatment with the MP:DNA complexes, as neither MP nor DNA treatment alone resulted in significant cell death (Figure 4B,C). These observations prompted us to seek ways to optimize the MF protocol for hHF-MSCs.
Figure 4.
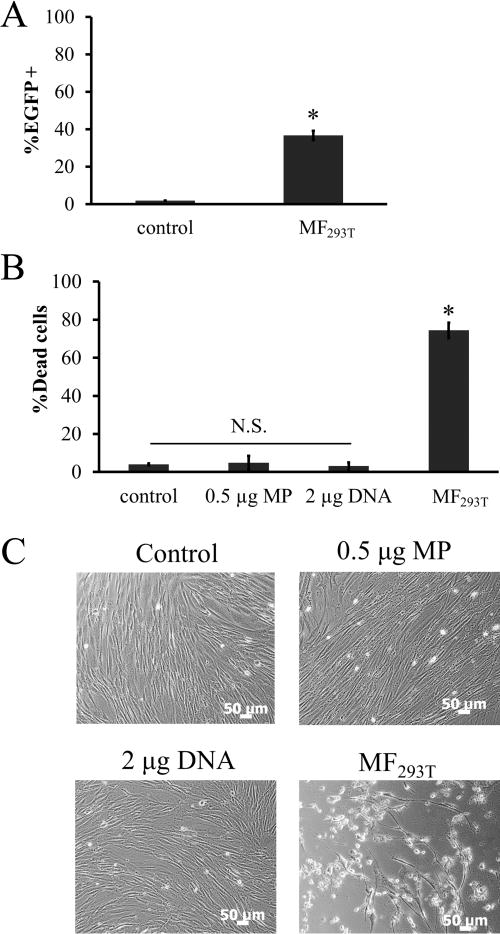
Transfection efficiency and cytotoxicity of MF are cell type dependent. (A) Transfection efficiency of hHF-MSCs using MF293T. (B–C) hHF-MSCs were incubated with 0.5 μg MP, 2 μg DNA, or 0.5 μg:2 μg DNA complexes (MF293T) followed by 20 min exposure to a magnetic field: (B) percentage of cell death, and (C) representative phase contrast images. hHF-MSCs exposed to magnetic field without MP served as control. All values are the mean ± SD of triplicate samples in a representative experiment (n = 3). The symbol * denotes p < 0.05 between MF293T and control. N.S.: not significant (p ≥ 0.05).
Effects of MP:DNA Ratios on Transfection Efficiency and MSC Viability
Due to the toxicity and low transfection efficiency observed in hHF-MSCs, the MF protocol required further optimization. First, the medium used for MP:DNA complex formation was switched from serum-free DMEM to OPTI-MEM, a medium that was formulated for enhanced transfection. Consequently, we observed higher GFI (Figure 5A) and lower toxicity (Figure 5B). Then, we examined the effects of the MP:DNA ratio on transfection efficiency and toxicity of hHF-MSCs. We found that, for each amount of MP (0.3, 0.4, or 0.5 μg), increasing the amount of DNA in each well increased the transfection in a dose dependent manner (MP = 0.3 μg: 9.07 ± 0.50 to 17.6 ± 2.76% EGFP+ cells; MP = 0.4 μg: 12.49 ± 1.04 to 25.5 ± 2.78% EGFP+ cells; MP = 0.5 μg: 20.62 ± 1.34 to 29.06 ± 0.76% EGFP+ cells; Figure 5C). However, for each amount of MP the cytotoxicity also increased with increasing DNA concentration, and it was highest at the highest MP and DNA amount (Figure 5D). Therefore, we selected the 0.3 μg:0.3 μg MP:DNA ratio for further optimization as it exhibited very low toxicity (cell viability: 96.25 ± 0.2% as compared to 96.02 ± 0.4% for nontreated cells), albeit at the expense of the transfection efficiency (9.07 ± 0.50%).
Figure 5.
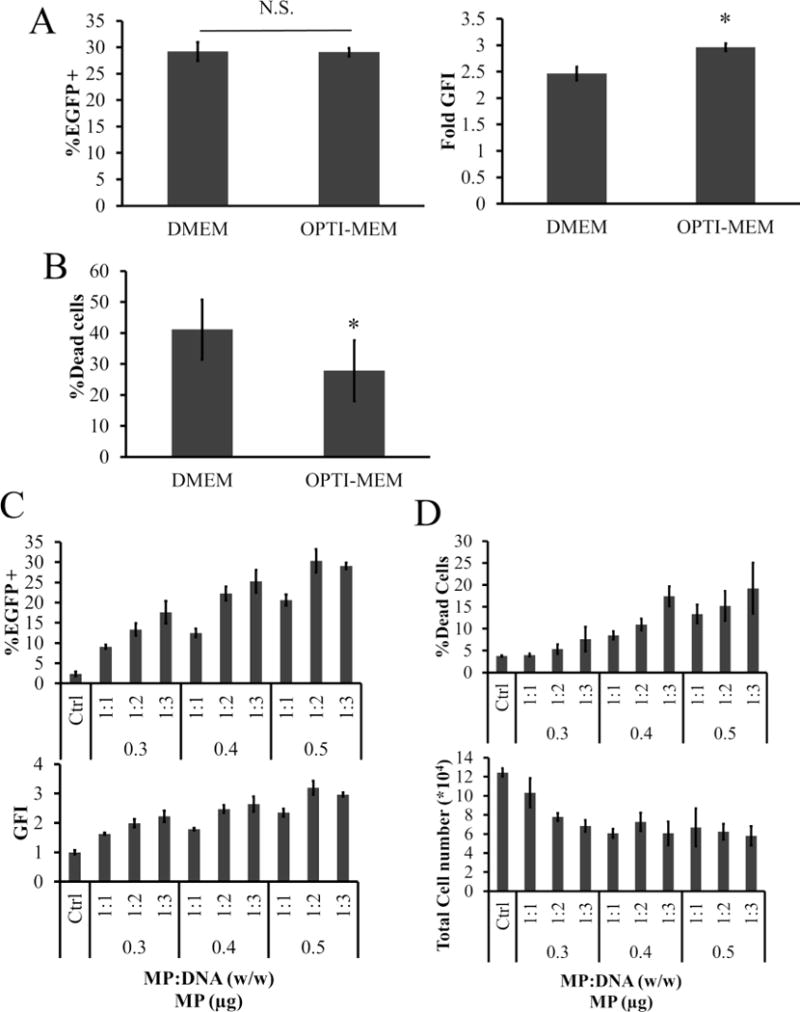
Optimization of MP:DNA complex formation. (A,B) Effects of serum free medium on MF: (A) transfection efficiency and GFI in hHF-MSCs, and (B) percentage of dead cells following application of the MF293T protocol with two serum free media, DMEM or OPTI-MEM. (C,D) Effects of MP:DNA ratio on transfection efficiency and toxicity of hHF-MSC: (C) percentage of EGFP+ cells and GFI, and (D) percentage of dead cells and total cell count of hHF-MSCs after MF with different ratios of MP:DNA in OPTI-MEM. All values are the mean ± SD of triplicate samples in a representative experiment (n = 3). The symbol * denotes p < 0.05 between DMEM and OPTI-MEM serum free medium. N.S.: not significant (p ≥ 0.05).
Multiple Magnetofection Significantly Increased MSC Transfection Efficiency
Multiple transfection treatments (termed by some as multifection) using Lipofectamine47 and NeuroMAG36 was shown to increase transfection efficiency. Since viability was not compromised at the 0.3 μg:0.3 μg MP:DNA ratio, we hypothesized that repeated transfection treatments might increase transfection efficiency without compromising cell viability. To address this hypothesis, hHF-MSCs were treated with MP:DNA complexes at a ratio of 0.3 μg:0.3 μg for one, two, or three times (1×, 2×, or 3×) as shown in Figure 6A. To eliminate the difference in fluorescence expression observed due to different culture times, cells were kept in culture for a total of 5 days and then analyzed (Figure 6A). Repeated MF administration increased transfection efficiency significantly (Figure 6B) without increasing toxicity (Figure 6C). Compared to single MF, two or three applications increased the %EGFP+ cells by 1.25 ± 0.04-fold and 1.40 ± 0.24-fold, respectively, while GFI increased by 1.08 ± 0.06-fold and 1.11 ± 0.06-fold, respectively. Therefore, three administrations were employed in all subsequent experiments.
Figure 6.
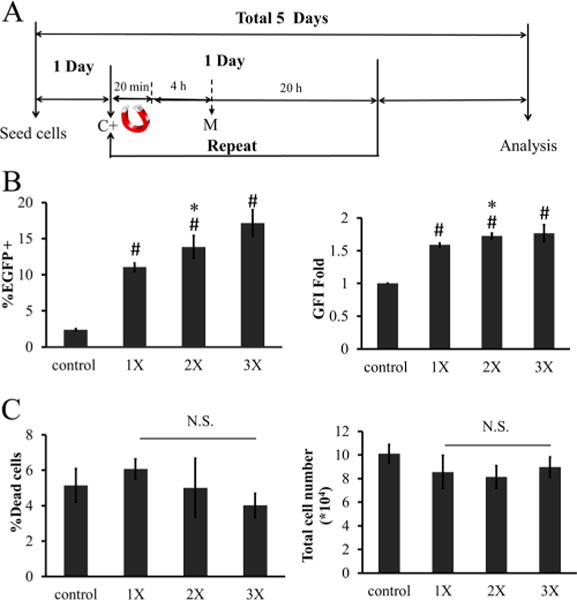
Effects of multifection on MF efficiency. (A) Timeline for multifection. C+: add MP:DNA complexes; M: media change. (B) Percentage of EGFP+ cells and GFI. 1×, 2×, or 3× refers to one, two, or three applications of MF. (C) Percentage of dead cells and total cell count after different multiple MF treatment on hHF-MSCs. The symbol # denotes p < 0.05 between nontransfected cells (control) and 1×, 2×, or 3×. The symbol * denotes p < 0.05 between 1× and 2× or 3×. All values are the mean ± SD of triplicate samples in a representative experiment (n = 3). N.S.: not significant (p ≥ 0.05).
Effects of Incubation Time on MF Efficiency
Further, we examined the effect of MP:DNA complex incubation time with the cells after application of the magnetic force (Figure 7A). Increasing MP:DNA incubation from 4 to 20 h enhanced the MF efficiency by 3.18 ± 0.60-fold to 48.86 ± 1.79% EGFP+ cells (p < 0.05, n = 3) and GFI by 1.75 ± 0.12-fold (p < 0.05, n = 3) (Figure 7B). Representative flow cytometry histograms for hHF-MSCs are shown (Figure 7C). It is also noteworthy that no toxicity was observed when compared to nontreated cells (Figure 7D).
Figure 7.
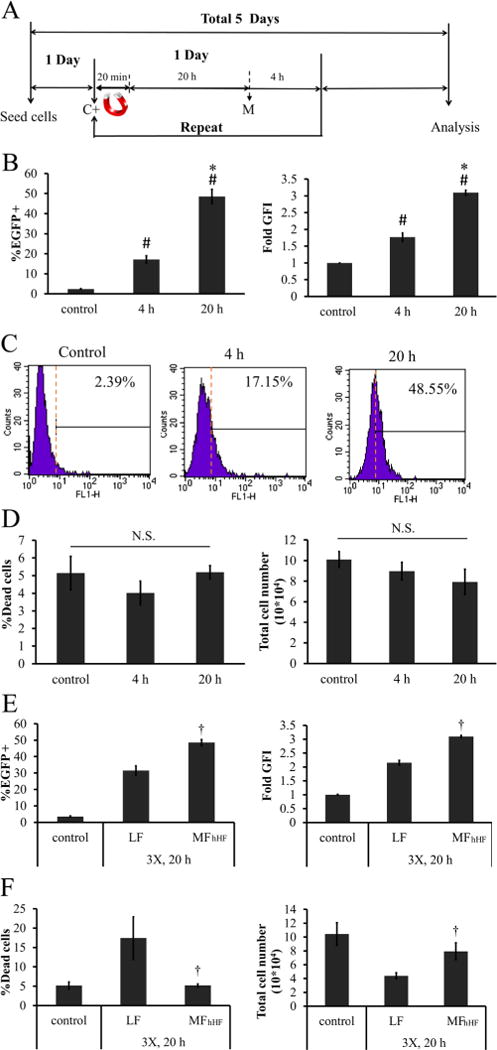
Effects of MP:DNA incubation time on MF efficiency. (A) Timeline for multifection. C+: add MP:DNA complexes M: media change. (B—D) hHF-MSCs were incubated with MP:DNA for 4 or 20 h following withdrawal of the magnetic field: (B) transfection efficiency and GFI, (C) representative flow cytometry histograms, and (D) percentage dead cells and total cell count. (E,F) Comparison of optimized MF for hHF-MSCs (MFhHF) with the commercially available transfection reagent, Lipofectamine 2000 (LF): (E) percentage of EGFP+ cells and GFI, (F) percentage of dead cells and total cell number. The symbol # denotes p < 0.05 between nontransfected cells (control) and 4 or 20 h of incubation. The symbol * denotes p < 0.05 between 4 and 20 h incubation. The symbol † denotes p < 0.05 between LF and MFhHF. All values are the mean ± SD of triplicate samples in a representative experiment (n = 3). N.S.: not significant (p ≥ 0.05).
Lipofectamine 2000 is widely used for DNA delivery to a variety of cell types. It has been shown that Lipofectamine 2000-mediated transfection (lipofection, LF) leads to more effective gene delivery to MSCs than other commercially available reagents such as FuGENE HD, Effecten, Superfect, and Polyfect.48 Therefore, we compared the optimal MF protocol for hHF-MSCs (MFhHF) with three LF administrations. Notably, LF resulted in significantly lower transfection efficiency (31.56 ± 5.77% EGFP+ cells, p < 0.05, n = 3; Figure 7E) and higher cell death (17.40 ± 2.74% dead cells, p < 0.05, n = 3; Figure 7F), as compared to MFhHF.
Magnetofection Can Effectively Overexpress NANOG in hHF-MSCs
Recently, our laboratory showed that ectopic expression of the NANOG gene, using recombinant lentivirus, increased the proliferation and myogenic differentiation potential of MSCs, especially senescent MSCs. Here, we examined whether MF could effectively replace lentiviral gene delivery into mesenchymal cells. To this end, we used a vector in which NANOG expression was driven by the CMV promoter and followed by IRE-egfp to enable quantitation of the gene transfer efficiency using flow cytometry (Figure 8A). A vector without NANOG was used as negative control.
Figure 8.
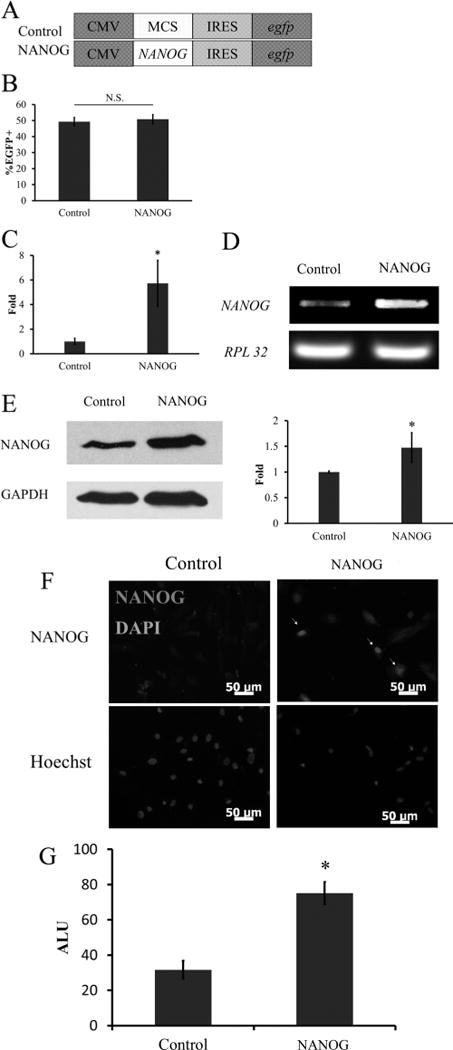
MFhHF mediated NANOG delivery to hHF-MSCs. (A) Schematics of plasmids used in the experiments. NANOG expression was driven by CMV promoter and followed by IRES–egfp to enable quantitation of the transfection efficiency. Empty vector without NANOG was used as control for comparison. (B) Gene delivery was confirmed by flow cytometry (%EGFP+ cells). NANOG overexpression was demonstrated by using (C) quantitative real-time PCR (qRT-PCR), (D) reverse transcription polymerase chain reaction (RT-PCR), (E) Western blot, (F) immunocytochemistry, and (G) luciferase reporter assay. For the latter, hHF-MSCs were modified to express luciferase under the control of NANOG response element (NANOG-RE: NANOG-binding DNA motif). (D) RPL32 and (E) GAPDH served as a loading control for qRT-PCR and Western blot, respectively. The symbol * denotes p < 0.05 between control and NANOG-expressing cells. All values are the mean ± SD of triplicate samples in a representative experiment (n = 3).
Application of three rounds of MFhHF (optimal protocol) resulted in ~50% EGFP+ cells (Figure 8B). In addition, qRT-PCR showed that NANOG transfected cells expressed 5.73 ± 1.86-fold higher levels of NANOG mRNA as compared to cells transfected with control plasmid (p < 0.05, n = 3) (Figure 8C). Gel electrophoresis of the PCR product is shown in Figure 8D. NANOG protein production also increased as evidenced by Western blot analysis (Figure 8E). Immunocytochemistry illustrated that the NANOG protein was localized in the cell nucleus (Figure 8F), as expected.
To examine whether NANOG was biologically active, we transduced cells with a dual-promoter lentivirus49 that was modified to encode for the luciferase gene under the NANOG Response Element/CMV minimal promoter (LVDP-NANOG-RE-CMVmin, NANOG-RE: NANOG-binding DNA motif) and for the puromycin N-acetyl transferase gene under the hPGK promoter. After selection, the cells were transfected by the NANOG-expressing plasmid using the optimal MFhHF protocol. Notably, the luciferase activity increased significantly in NANOG-overexpressing hHF-MSCs as compared to control cells, suggesting that the NANOG protein was biologically active (Figure 8G).
MF Mediated NANOG Expression Enhanced hHF-MSC Proliferation and Decreased Senescence
We have previously shown that donor aging and culture senescence decreased the proliferation and myogenic differentiation potential of MSCs. In addition, we showed that ectopic expression of NANOG using recombinant lentivirus increased proliferation and completely reversed the differentiation potential of MSCs into contractile SMC.21 Based on these results, we hypothesized that nonviral and, therefore, transient delivery of NANOG using MFhHF could have similar effects on MSC proliferation and dif ferentiation potential.
To this end, we employed the optimal MFhHF protocol to transduce hHF with the NANOG-encoding plasmid and measured cell proliferation as well as expression of p16INK4a, a well-known cell cycle suppressor that is upregulated in senescent cells.50 Interestingly, MFhHF of NANOG-expressing plasmid decreased p16INK4a mRNA significantly as evidenced by RT-PCR and qRT-PCR (Figure 9A and B). Concomitantly, the hHF-MSC proliferation rate was enhanced. Specifically, the doubling time of NANOG-expressing cells decreased by approximately 18 h for 7 consecutive passages (28 days) (Figure 9C), indicating that ectopic NANOG overexpression using the optimal MFhHF protocol promoted hHF-MSC proliferation.
Figure 9.
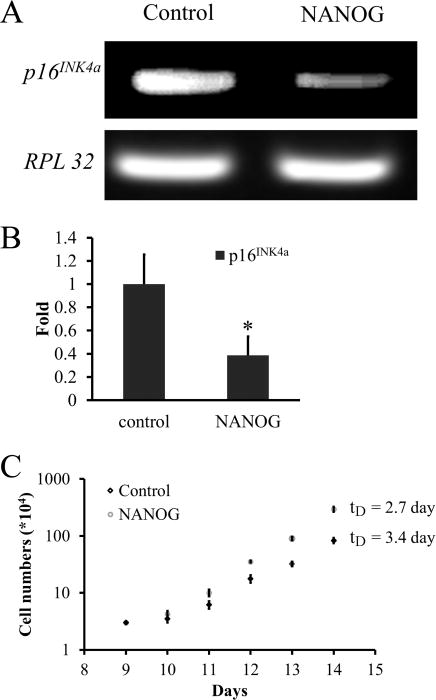
NANOG overexpression enhances the proliferation potential of hHF-MSCs. (A) RT-PCR and (B) real-time quantitative PCR (qRT-PCR) for p16INK4a mRNA in NANOG-expressing and control hHF-MSCs. (C) Cells were seeded at constant density (3 × 10³/cm2) and every 4 days they were trypsinized and counted for a total of 28 days. The results were plotted as cumulative cell number over time for the NANOG-overexpressing cells or for the mock transfected cells (control). The symbol * denotes p < 0.05 between control and NANOG samples. All values are the mean ± SD of triplicate samples in a representative experiment (n = 3).
MF Mediated NANOG Expression Enhanced hHF-MSC Differentiation into Contractile SMC
We also tested whether MFhHF with the NANOG-expressing plasmid increased the differentiation potential of hHF-MSCs into SMC. Indeed, NANOG MFhHF increased expression by 1.5- to 3.1-fold (Figure 10A) and improved filamentous organization of the early SMC marker protein, αSMA (Figure 10B).
Figure 10.
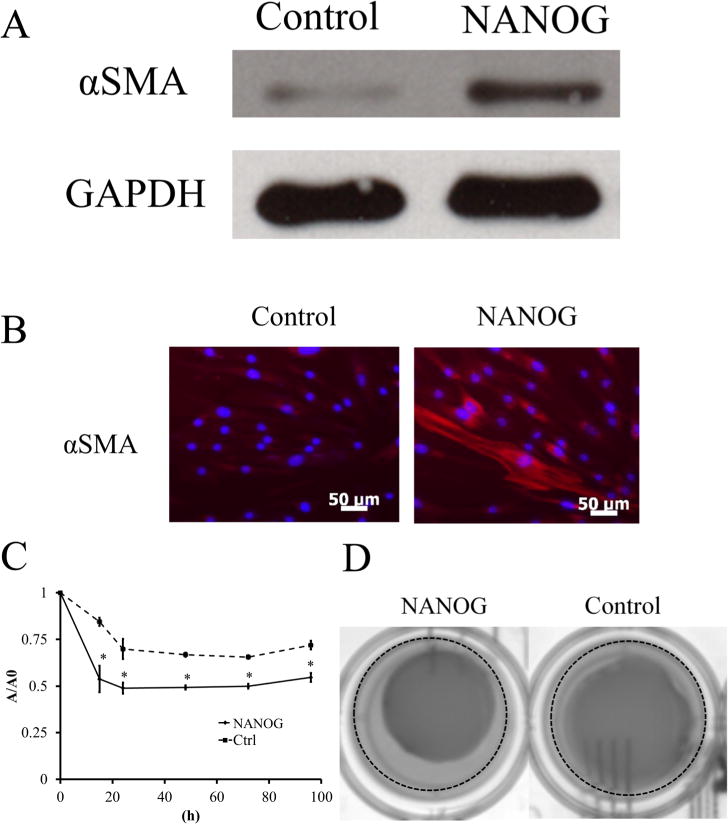
NANOG-overexpressing hHF-MSCs have higher myogenic differentiation potential. (A) Western blot for αSMA; GAPDH served as the loading control. (B) Immunostaining of NANOG-overexpressing or mock transfected hHF-MSCs for αSMA. (C) Kinetics of hydrogel compaction by NANOG-expressing or mock transfected hHF-MSCs. The symbol * denotes p < 0.05 between control and NANOG-expressing cells. (D) Representative pictures of hydrogels at t = 15 h. The dotted line denotes the edge of the well. All values are the mean ± SD of triplicate samples in a representative experiment (n = 3).
In addition, we tested whether NANOG MFhHF increased the ability of MSCs to generate contractile force using a hydrogel compaction assay. To this end, MF-control or MF-NANOG transfected hHF-MSCs were embedded in fibrin gels (106 cells/mL), and 1 h after polymerization, the gels were released from the well walls and allowed to compact. At the indicated times the area of each gel was measured using ImageJ and normalized to its initial area.
As shown in Figure 10C,D, NANOG-expressing cells increased both the initial rate as well as the final extent of gel compaction. Specifically, the initial rate of compaction (t = 15 h) increased significantly with NANOG-expressing cells, as the gel area decreased from 84.5 ± 2.2% to 53.77 ± 7.1% (n = 3, p < 0.05) of their original gel area. Similarly, the final extent of compaction (t = 4 days) decreased from 72.0 ± 2.3% to 54.7 ± 2.4% of their original gel area (n = 3, p < 0.05). Collectively, our results clearly indicate that MF-mediated delivery of NANOG enhanced proliferation and myogenic differentiation potential of MSCs similarly to lentiviral gene delivery.
DISCUSSION
Adult stem cells, in particular, MSCs provide a promising cell source for regenerative medicine, as they are multipotent, nontumorigenic and immune-privileged, and have been used successfully in clinical trials.51–53 However, MSCs undergo senescence in culture and lose their proliferation capacity and multipotency, limiting their expansion to the large numbers necessary for regenerative medicine applications. We and others demonstrated that MSCs from older donors exhibited significantly decreased proliferation and diminished myogenic differentiation potential.5,13 Notably, ectopic expression of NANOG using recombinant lentivirus improved the proliferation and completely restored the impaired differentiation potential of senescent MSCs.21 However, random integration of lentivirus sequences into the genome of target cells hinders their application in regenerative medicine.24 To overcome this concern, we employed MF to deliver genes into MSCs in a highly efficient yet nonviral means.
Nanoparticles have shown promising results in biomolecule delivery into cells or tissues. In particular, iron oxide magnetic particles (MPs), such as magnetite Fe3O4, show high potential for transfection applications because (1) they are biocompatible,54 as shown by lack of toxicity after in vivo administration of iron oxide MPs into rats or dogs,55 and (2) iron oxide MPs exhibit superparamagnetic behavior. MPs are magnetized only upon application of a magnetic field, thereby enabling local delivery to the site of interest. In addition, MF has shown improved transfection efficiency as compared to traditional nonviral transfection methods, such as Lipofectamine 2000 and calcium phosphate precipitation.56 MF has been shown to be effective with some primary cells such as human endothelial cells,29,34,35 neural stem cells,36,37 neurons,38,39 and fibroblasts,40 suggesting that MF might be effective in delivering genes into MSCs as well.
To address this hypothesis, we employed a commercially available MP that comprises an iron oxide magnetite decorated with PEI-derivate (PolyMAG). PEI can bind negatively charged DNA and trigger endosomal escape, perhaps due to the proton sponge effect, thereby promoting efficient gene delivery.57,58 After optimization, MF to 293T cells (MF293T) enhanced gene delivery by approximately 10-fold as compared to the traditional calcium phosphate precipitation method. Despite its effectiveness, MF293T had detrimental effects on hHF-MSC viability, in agreement with previous studies showing that different cell types may exhibit different levels of toxicity in response to MP.59 Interestingly, it was the combination of MP with plasmid DNA that induced cellular toxicity, as neither the plasmid DNA nor the MP alone in the presence or absence of magnetic field caused cytotoxicity.
One possible explanation for high cytotoxic effects may be that higher levels of MP and DNA led to the formation of larger MP:DNA complexes. Upon application of the magnetic field these complexes might have caused cell death either by disrupting the cellular membranes or by leading to high levels of MP and DNA uptake in short times (high uptake rates). Interestingly, the “safe dose” of MP:DNA complexes that could be tolerated very well by MSCs was 0.3 μg:0.3 μg. At the time of the first magnetofection, there were ~1 × 10⁵ cells. Hence, this corresponds to a “safe dose” of 3 pg MP:3 pg DNA per cell. With a concentration of 1.375 × 10¹⁴ particles/mL the optimal mixture contained ~4 × 10¹⁰ MPs and ~2.5 × 10¹⁰ DNA molecules (using 11 kb as plasmid length and average molecular weight per base of 650 Da). This is in contrast to the highly toxic mixture (0.5 μg MP:2 μg DNA), which contained ~6.9 × 10¹⁰ MPs and ~1.68 × 10¹¹ DNA molecules. This calculation suggests that the source of toxicity might be the high amounts of MPs and especially DNA delivered to the target cells in short times.
On the other hand, multiple exposures of cells to the safe MP:DNA dose (multifection) increased transfection efficiency with no significant increase in cell death. However, after the first round of MF, hHF-MSCs became resistant to further gene delivery as shown by the small improvement in the number of transfected cells and GFI after each additional round of MF. This could be due to a large number of complexes that had accumulated on the cell surface, preventing further accumulation of MP:DNA complexes. Indeed, when incubation of MP:DNA complexes with hHF-MSCs was prolonged from 4 to 20 h before the next application, transfection efficiency improved significantly without increasing cytotoxicity. This result suggested that, while the magnetic field might bring the MP:DNA complexes to the cells surface quickly, efficient uptake may require longer times. In the end, despite the additional time required to achieve maximum gene transfer, the optimized MF protocol yielded about 50% transfected hHF-MSCs with minimal toxicity, showing that, under optimal conditions, using MF for gene delivery is more effective and less toxic than the commercially available Lipofectamine 2000.
These results suggested that MF provides a promising alternative to deliver genes to MSCs without the safety concerns associated with viral-mediated gene delivery. In fact, we found that MF-mediated NANOG delivery had significant effects on the myogenic differentiation potential of MSCs similar to lentiviral gene transfer. Therefore, MF may provide a more clinically relevant approach to reverse MSC senescence without permanent genetic modification or reprogramming to the pluripotent state. On the other hand, efficient and nontoxic gene delivery strategies such as MF may also have applications in the field of cellular reprogramming without the long-term effects of lentiviral integration into the genome of induced pluripotent stem cells.
CONCLUSION
In summary, this study demonstrated that magnetofection is a promising tool for efficient DNA delivery into hHF-MSCs without detrimental cytotoxic effects. Using our optimized protocol, NANOG was successfully overexpressed in hHF-MSCs, leading to enhanced proliferation, SMC gene expression, and contractility. Therefore, MFhHF has the potential to deliver therapeutic genes to MSCs for cellular reprograming, regenerative medicine and gene therapy without the safety concerns associated with viral-based gene delivery strategies.
EXPERIMENTAL PROCEDURES
Plasmids and Cell Cultures
pcDNA3.1-egfp was generated for magnetofection (MF) optimization. First, the egfp sequence was extracted from pCS-6Hegfp-IRES-puro using PCR (Table 1). Subsequently, the PCR product was inserted into pcDNA3.1 (Invitrogen, Carlsbad, CA). pCS-NANOG-IRES-egfp plasmid was used for NANOG overexpression. The NANOG DNA sequence was taken from pSIN-EF2-NANOG-puro (Addgene, Cambridge, MA) using PCR (Table 1). A Kozak sequence was introduced right before the NANOG sequence for enhanced transcription. Subsequently, this PCR product was inserted between NheI and AgeI of the lentiviral vector pCS-mcs-IRES-egfp that was previously established in our laboratory.60 Plasmid DNA was purified using the NucleoBond Xtra Midi Kit (Macherey-Nagel, Bethlehem, PA).
Table 1.
Primers Used for Cloning
| For_HEGFP | AATCAGGATCCATGCACCATCACCATCACCACCACGGCGGTGGAAG (BamHI) |
| Rev_HEGFP | ATAGCGAATTCCTTGTACAGCTCGTCCATGCCGTGAGT (EcoRI) |
| For_NANOG | ATCGAGCTAGCGCCGCCACCATGAGTGTGGATCCAGCTTGTC (NheI) |
| Rev_NANOG | AGCGGACCGGTTTACACGTCTTCAGGTTGCATGTTC (AgeI) |
293T cells were cultured in Dulbecco’s modified Eagle’s medium (DMEM; Gibco, Grand Island, NY), supplemented with 10% (v/v) fetal bovine serum (FBS; Gibco). hHF-MSCs were isolated as described previously3,4 and were cultured in growth medium (DMEM containing 10% (v/v) MSC qualified FBS (GIBCO) supplemented with 1 ng/mL basic fibroblast growth factor (bFGF; BD Biosciences, San Jose, CA)). The culture medium was replenished every other day unless otherwise indicated.
Magnetofection (MF) Optimization
One day before MF treatment, 5 × 10⁵ 293T cells/well or 6.5 × 10⁴ hHF-MSCs/well were seeded in 24-well tissue culture treated plates. For 293T cells, the optimization factors include magnetic nano-particles (MP, polyMAG, 100 nm, weight per volume = 1 mg/mL, Chemicell, Berlin, Germany) -to-DNA ratio, serum supplement, magnet exposure time, and the time that MP:DNA complexes were allowed to incubate with the cells following the removal of the magnetic field. The magnet used in this study was a Neodymium–iron–boron (NdFeB) permanent magnet (13 200 G, CMS Magnetics, TX). For hHF-MSCs, the effects of medium, MP:DNA ratio, number of MF applications (multifection), and MP:DNA complex incubation time with cells were evaluated. Flow cytometry was used to determine the transfection efficiency (see below). Cellular toxicity was determined by counting the total cell number and the percentage of cells with compromised membrane (see Cell Count for details).
The optimized protocols were compared with conventional transfection methods. For the optimized MF protocol for 293T cells (MF293T), calcium phosphate precipitation (CP) was used for comparison. For the optimized magnetofection protocol for hHF-MSCs (MFhHF), the commercially available transfection agent Lipofectamine 2000 (Life Technologies, Grand Island, NY) was used for comparison. Briefly, cells were transfected using Lipofectamine 3 times for a fair comparison of gene transfer efficiency between Lipofectamine-mediated transfection and the optimized MF protocol. For each transfection, 0.3 μL of Lipofectamine 2000 was mixed with 0.3 μg of DNA and used to transfect cells according to the manufacturer’s suggestion.
Flow Cytometry
Transfected cells were trypsinized, resuspended in PBS, and analyzed for transfection efficiency (%EGFP+ cells) and fluorescence intensity (GFI) using flow cytometer (FACSCalibur; Becton Dickinson, San Jose, California) as described previously.61
Cell Count
After MF treatment, cells were trypsinized and stained with 0.2% Trypan blue (Gibco). The number of membrane-comprised cells (Trypan blue positive cells) and the total number of cells were determined using a hemacytometer. The extent of cytotoxicity is reported as the percentage of Trypan blue positive cells. To examine the proliferation of cells after MF, 1 day after the optimal MF process, transfected hHF-MSCs were seeded (3000 cells/cm2) in triplicate wells and medium was replenished every other day. On the fourth day and every 4 days thereafter for a total of 28 days, cells were counted and replated at 3000 cells/cm2. The number of population doublings was calculated assuming geometric growth.
RNA Isolation and cDNA Synthesis
Total RNA was isolated using RNeasy Mini kit (Qiagen, Germantown, MD) according to the manufacturer’s instructions. The amount of RNA was quantified using a spectrophotometer (BIO-RAD Laboratories, Hercules, CA). First strand cDNA was synthesized using QuantiTect Reverse Transcription Kit (Qiagen) per manufacturer’s protocol.
Quantitative Real Time PCR
To determine the gene expression level after MF treatment, quantitative real time PCR was performed using iCycler (BIO-RAD) with the SYBR Green Kit (Bio-Rad) according to manufacturer’s instructions (see Table 2 for primer sets). The expression level of each mRNA was normalized to the expression level of the housekeeping gene, RPL32. The normalized values were further normalized to the value of nontransfected (control) cells. The specificity of each product was verified by gel electrophoresis through a 1% (w/v) agarose gel.
Table 2.
RT-PCR and qRT-PCR Primers
| target gene | forward primer (5′ to 3′) | reverse primer (5′ to 3′) |
|---|---|---|
| NANOG | GAGATGCCTCACACGGAGAC | GGTCTGGTTGCTCCACATTG |
| P16ink4a | CTTCCTGGACACGCTGGT | GCATGGTTACTGCCTCTGGT |
| Ribosomal Protein L32 (RPL32) | AGCGTAACTGGCGGAAAC | CGTTGTGGACCAGGAACTTC |
Immunostaining
Immunostaining was performed as described previously.5 Briefly, 1 day post transfection, hHF-MSCs were trypsinized and split equally onto 4 glass slides. To verify for the presence of NANOG, cells were cultured under growth conditions for 2 days. For detection of αSMA, cells were cultured in myogenic differentiation medium (DMEM + 10% (v/v) MSC qualified FBS + 2 ng/mL transforming growth factor-β1 (TGF-β1; BioLegend, San Diego, CA)) for 4 days with medium changed every other day. Then, cells were fixed in 4% (v/v) paraformaldehyde and permeabilized with 0.1% (v/v) Triton X-100 in PBS. Subsequently, they were blocked with 10% (v/v) goat serum in PBS for at least 2 h and continuously incubated at 4 °C overnight with a mouse anti-human NANOG antibody (1:200 in blocking buffer, BD Biosciences Pharmigen, San Diego, CA) or a mouse anti-human smooth muscle αSMA antibody (1:200 in blocking buffer, Sigma-Aldrich, St. Louis, MO). On the following day, the cells were incubated with Alexa Fluor 594-conjugated goat anti-mouse secondary antibody (1:200 in blocking buffer; 1 h at RT), and then counterstained with Hoechst nuclear dye (1:400 in PBS; 5 min at RT; Sigma–Aldrich). Samples were imaged with Zeiss Axio Observer.Z1 fluorescence microscope (Carl Zeiss, Thornwood, NY) equipped with a digital camera (ORCA-ERC4742–80; Hamamatsu, Bridgewater, NJ).
Western Blot (WB)
Cell lysates were subjected to WB analysis as described previously61,62 using the following antibodies that were diluted in 5% (w/v) BSA in TBST buffer: NANOG (1:1000; BD Biosciences, San Jose, CA) and αSMA (1:1000, Serotec, Raleigh, NC). The intensity of the bands was quantified using ImageJ (v 1.48, National Institute of Health, Bethesda, MD).
Luciferase Assay
HF-MSCs were transduced with a lentiviral dual-promoter reporter modified from our previously developed constructs (LVDP).49,63 In this construct, the constitutive human PGK promoter drives the expression of the pac (puromycin N-acetyl transferase) gene and confers the cells with puromycin resistance. The NANOG binding nucleotide sequence (NANOG response element: NANOG-RE) followed by the CMVmin promoter controls expression of the firefly luciferase gene. After selection in 1 μg/mL puromycin for 4 days, cells were transfected with the NANOG-encoding or control plasmid using MFHF. At the end of MFHF the activity of luciferase was measured using a commercial kit (Dual-Luciferase Reporter Assay System, Promega, Madison, WI) according to the manufacturer’s instructions. Luminescence was detected by Synergy HT microplate reader (Biotek, Winooski, VT).
Fibrin Gel Compaction Assay
Fibrin gel compaction assay was previously described.3 Briefly, 1 mL fibrin gel containing 1 × 10⁶ cells, 2.5 mL fibrinogen, and 2.5U/mL thrombin was polymerized in a BSA-coated well in a 24-well plate at 37 °C for 1 h. Subsequently, the gel was released from the wall of each well and 1 mL of medium was added. Thereafter, fresh medium was replenished daily. The culture medium was DMEM supplemented with 10% (v/v) FBS, and ɛ-amino-n-caproic acid (2 mg/mL; Sigma–Aldrich). The gels were photographed by a digital camera (UVP, Upland, CA) at the indicated times. The gel area (A) was determined using ImageJ, normalized to the initial gel area (A0), and the ratio (A/A0) was plotted as a function of time.
Magnetic Force and Magnetic Field Analysis
The magnets used for MF are cylindrical rare-earth magnets of 0.625 in (15.88 mm) in diameter and 0.5 in (12.7 mm) in height. They were made from grade 42N neodymium iron boron (NdFeB), which has a maximum remnant magnetization of Br = 1.28 T. The magnetic field produced by these structures was characterized using a 3D magnetic field mapping instrument, the MMS-1-R from SENIS GmbH (www.senis.ch). A three-dimensional probe was used to scan the magnetic field at z = 1 mm above the upper surface of magnet with 1 mm resolution in the x–y plane. In addition, the field and force provided by the magnets were predicted using computational models as described previously.44–46 The operating point of the magnets, i.e., their residual magnetization, was determined by measuring the axial field Bz at z = 1 mm above the center of the magnet, which is in close proximity to the cells at the bottom of the culture well, and then using this in the computational models to back-calculate Br.
The force on the particles was predicted using an “effective” dipole moment approach in which a magnetized particle was replaced by an “equivalent” point dipole with a moment mp,eff, i.e.
| (1) |
where μf is the permeability of the fluid and Ha is the applied magnetic field intensity at the center of the particle. The moment is given by mp,eff = VpMp where Vp = 4/3πRp3 and Mp are the volume and magnetization of the particle, respectively. The moment can be determined using a magnetization model that takes into account self-demagnetization and magnetic saturation of the particles64,65
| (2) |
where
| (3) |
In this expression, χf is the susceptibility of the fluid, χp is the intrinsic magnetic susceptibility of the particle, and Msp is the saturation magnetization of the particle. The particles used in this study were the PolyMAG particles (100 nm in diameter) from Chemicell Corp.; however, the magnetic properties of these particles have not been reported in the literature. Based on data provided by the manufacturer (private communication), the magnetic core of a typical 100 nm PolyMAG particle is not an ideal sphere but rather an irregularly shaped spheroidal-like structure, which has an average diameter that ranges from 65 to 85 nm. The core contains a compact cluster of several single domain Fe3O4 nanoparticles approximately 8 to 13 nm in diameter. According to the manufacturer, the magnetic properties of the particles are essentially the same as those of the fluidMAG-D (hydrodynamic diameter 100 nm). The weight per volume of the particles is 25 mg/mL and number of 100 nm particles per gram is 1.8 × 10¹⁵/g. Thus, the number of such particles per volume is 4.5 × 10¹⁹/m3, which represents a volume fraction of ϕp = 2.356%. The saturation magnetization of fluidMAG-D is reported to be Ms,fluid = 2.9 × 10³ A/m. It follows that the saturation magnetization of an individual PolyMAG particle is Msp = Ms,fluid/ϕp = 1.23 × 10⁵ A/m. The intrinsic susceptibility of the particles is χp = (3χa)/(3 − χa) = 0.59 where χa is the apparent susceptibility of the particles, which was determined from the fluidMAG-D magnetization curve.
Statistical Analysis
All experiments were performed three times with triplicate samples for each condition. Pairwise comparison was analyzed by two-tailed Student t-test and the data was considered statistically different when p < 0.05.
Supplementary Material
Acknowledgments
This work was supported by a grant from the National Institutes of Health (R01 HL086582) to S.T.A.
Footnotes
Supporting Information
An image of our custom-made magnet array and the results of magnetofection optimization for 293T cells. This material is available free of charge via the Internet at http://pubs.acs.org.
Author Contributions
Seoyoung Son and Mao-Shih Liang contributed to this work equally.
Notes
The authors declare no competing financial interest.
References
- 1.Pittenger MF, Mackay AM, Beck SC, Jaiswal RK, Douglas R, Mosca JD, Moorman MA, Simonetti DW, Craig S, Marshak DR. Multilineage potential of adult human mesenchymal stem cells. Science. 1999;284:143–147. doi: 10.1126/science.284.5411.143. [DOI] [PubMed] [Google Scholar]
- 2.Zuk PA, Zhu M, Mizuno H, Huang J, Futrell JW, Katz AJ, Benhaim P, Lorenz HP, Hedrick MH. Multilineage cells from human adipose tissue: implications for cell-based therapies. Tissue Eng. 2001;7:211–28. doi: 10.1089/107632701300062859. [DOI] [PubMed] [Google Scholar]
- 3.Liu JY, Peng HF, Andreadis ST. Contractile smooth muscle cells derived from hair-follicle stem cells. Cardiovasc Res. 2008;79:24–33. doi: 10.1093/cvr/cvn059. [DOI] [PubMed] [Google Scholar]
- 4.Liu JY, Peng HF, Gopinath S, Tian J, Andreadis ST. Derivation of functional smooth muscle cells from multipotent human hair follicle mesenchymal stem cells. Tissue Eng, Part A. 2010;16:2553–64. doi: 10.1089/ten.tea.2009.0833. [DOI] [PMC free article] [PubMed] [Google Scholar]
- 5.Bajpai VK, Mistriotis P, Andreadis ST. Clonal multipotency and effect of long-term in vitro expansion on differentiation potential of human hair follicle derived mesenchymal stem cells. Stem Cell Res. 2012;8:74–84. doi: 10.1016/j.scr.2011.07.003. [DOI] [PMC free article] [PubMed] [Google Scholar]
- 6.Mistriotis P, Andreadis ST. Hair follicle: a novel source of multipotent stem cells for tissue engineering and regenerative medicine. Tissue Eng, Part B: Rev. 2013;19:265–78. doi: 10.1089/ten.teb.2012.0422. [DOI] [PMC free article] [PubMed] [Google Scholar]
- 7.Alagesan S, Griffin MD. Autologous and allogeneic mesenchymal stem cells in organ transplantation: what do we know about their safety and efficacy? Curr Opin Organ Transplant. 2014;19:65–72. doi: 10.1097/MOT.0000000000000043. [DOI] [PubMed] [Google Scholar]
- 8.Griffin MD, Elliman SJ, Cahill E, English K, Ceredig R, Ritter T. Concise review: adult mesenchymal stromal cell therapy for inflammatory diseases: how well are we joining the dots? Stem Cells (Dayton, Ohio) 2013;31:2033–41. doi: 10.1002/stem.1452. [DOI] [PubMed] [Google Scholar]
- 9.Malgieri A, Kantzari E, Patrizi MP, Gambardella S. Bone marrow and umbilical cord blood human mesenchymal stem cells: state of the art. Int J Clin Exp Med. 2010;3:248–69. [PMC free article] [PubMed] [Google Scholar]
- 10.Stenderup K, Justesen J, Clausen C, Kassem M. Aging is associated with decreased maximal life span and accelerated senescence of bone marrow stromal cells. Bone. 2003;33:919–26. doi: 10.1016/j.bone.2003.07.005. [DOI] [PubMed] [Google Scholar]
- 11.Baxter MA, Wynn RF, Jowitt SN, Wraith JE, Fairbairn LJ, Bellantuono I. Study of telomere length reveals rapid aging of human marrow stromal cells following in vitro expansion. Stem Cells (Dayton, Ohio) 2004;22:675–82. doi: 10.1634/stemcells.22-5-675. [DOI] [PubMed] [Google Scholar]
- 12.Hacia JG, Lee CC, Jimenez DF, Karaman MW, Ho VV, Siegmund KD, Tarantal AF. Age-related gene expression profiles of rhesus monkey bone marrow-derived mesen-chymal stem cells. J Cell Biochem. 2008;103:1198–210. doi: 10.1002/jcb.21498. [DOI] [PubMed] [Google Scholar]
- 13.Han J, Liu JY, Swartz DD, Andreadis ST. Molecular and functional effects of organismal ageing on smooth muscle cells derived from bone marrow mesenchymal stem cells. Cardiovasc Res. 2010;87:147–55. doi: 10.1093/cvr/cvq024. [DOI] [PMC free article] [PubMed] [Google Scholar]
- 14.Scruggs BA, Semon JA, Zhang X, Zhang S, Bowles AC, Pandey AC, Imhof KM, Kalueff AV, Gimble JM, Bunnell BA. Age of the donor reduces the ability of human adipose-derived stem cells to alleviate symptoms in the experimental autoimmune encephalomyelitis mouse model. Stem Cells Transl Med. 2013;2:797–807. doi: 10.5966/sctm.2013-0026. [DOI] [PMC free article] [PubMed] [Google Scholar]
- 15.Do JT, Scholer HR. Regulatory circuits underlying pluripotency and reprogramming. Trends Pharmacol Sci. 2009;30:296–302. doi: 10.1016/j.tips.2009.03.003. [DOI] [PubMed] [Google Scholar]
- 16.Boyer LA, Lee TI, Cole MF, Johnstone SE, Levine SS, Zucker JP, Guenther MG, Kumar RM, Murray HL, Jenner RG, Gifford DK, Melton DA, Jaenisch R, Young RA. Core transcriptional regulatory circuitry in human embryonic stem cells. Cell. 2005;122:947–56. doi: 10.1016/j.cell.2005.08.020. [DOI] [PMC free article] [PubMed] [Google Scholar]
- 17.Piestun D, Kochupurakkal BS, Jacob-Hirsch J, Zeligson S, Koudritsky M, Domany E, Amariglio N, Rechavi G, Givol D. Nanog transforms NIH3T3 cells and targets cell-type restricted genes. Biochem Biophys Res Commun. 2006;343:279–85. doi: 10.1016/j.bbrc.2006.02.152. [DOI] [PubMed] [Google Scholar]
- 18.Zhang J, Wang X, Chen B, Suo G, Zhao Y, Duan Z, Dai J. Expression of Nanog gene promotes NIH3T3 cell proliferation. Biochem Biophys Res Commun. 2005;338:1098–102. doi: 10.1016/j.bbrc.2005.10.071. [DOI] [PubMed] [Google Scholar]
- 19.Go MJ, Takenaka C, Ohgushi H. Forced expression of Sox2 or Nanog in human bone marrow derived mesenchymal stem cells maintains their expansion and differentiation capabilities. Exp Cell Res. 2008;314:1147–54. doi: 10.1016/j.yexcr.2007.11.021. [DOI] [PubMed] [Google Scholar]
- 20.Liu TM, Wu YN, Guo XM, Hui JH, Lee EH, Lim B. Effects of ectopic Nanog and Oct4 overexpression on mesenchymal stem cells. Stem Cells Dev. 2009;18:1013–22. doi: 10.1089/scd.2008.0335. [DOI] [PMC free article] [PubMed] [Google Scholar]
- 21.Han J, Mistriotis P, Lei P, Wang D, Liu S, Andreadis ST. Nanog reverses the effects of organismal aging on mesenchymal stem cell proliferation and myogenic differentiation potential. Stem Cells (Dayton, Ohio) 2012;30:2746–59. doi: 10.1002/stem.1223. [DOI] [PMC free article] [PubMed] [Google Scholar]
- 22.Kochupurakkal BS, Sarig R, Fuchs O, Piestun D, Rechavi G, Givol D. Nanog inhibits the switch of myogenic cells towards the osteogenic lineage. Biochem Biophys Res Commun. 2008;365:846–50. doi: 10.1016/j.bbrc.2007.11.073. [DOI] [PubMed] [Google Scholar]
- 23.Lang KC, Lin IH, Teng HF, Huang YC, Li CL, Tang KT, Chen SL. Simultaneous overexpression of Oct4 and Nanog abrogates terminal myogenesis. Am J Physiol Cell Physiol. 2009;297:C43–54. doi: 10.1152/ajpcell.00468.2008. [DOI] [PubMed] [Google Scholar]
- 24.Rothe M, Modlich U, Schambach A. Biosafety challenges for use of lentiviral vectors in gene therapy. Curr Gene Ther. 2013;6:453–68. doi: 10.2174/15665232113136660006. [DOI] [PubMed] [Google Scholar]
- 25.Razi Soofiyani S, Baradaran B, Lotfipour F, Kazemi T, Mohammadnejad L. Gene therapy, early promises, subsequent problems, and recent breakthroughs. Adv Pharm Bull. 2013;3:249–255. doi: 10.5681/apb.2013.041. [DOI] [PMC free article] [PubMed] [Google Scholar]
- 26.Chen CK, Jones CH, Mistriotis P, Yu Y, Ma X, Ravikrishnan A, Jiang M, Andreadis ST, Pfeifer BA, Cheng C. Poly(ethylene glycol)-block-cationic polylactide nano-complexes of differing charge density for gene delivery. Biomaterials. 2013;34:9688–99. doi: 10.1016/j.biomaterials.2013.08.063. [DOI] [PubMed] [Google Scholar]
- 27.Madeira C, Mendes RD, Ribeiro SC, Boura JS, Aires-Barros MR, Silva CLd, Cabral JMS. Nonviral gene delivery to mesenchymal stem cells using cationic liposomes for gene and cell therapy. J Biomed Biotechnol. 2010;2010 doi: 10.1155/2010/735349. Article ID 735349. [DOI] [PMC free article] [PubMed] [Google Scholar]
- 28.Krause CD, Izotova LS, Ren G, Yuan ZR, Shi Y, Chen CC, Ron Y, Pestka S. Efficient co-expression of bicistronic proteins in mesenchymal stem cells by development and optimization of a multifunctional plasmid. Stem Cell Res Ther. 2011;2:15. doi: 10.1186/scrt56. [DOI] [PMC free article] [PubMed] [Google Scholar]
- 29.Krotz F, de Wit C, Sohn HY, Zahler S, Gloe T, Pohl U, Plank C. Magnetofection–a highly efficient tool for antisense oligonucleotide delivery in vitro and in vivo. Mol Ther. 2003;7:700–10. doi: 10.1016/s1525-0016(03)00065-0. [DOI] [PubMed] [Google Scholar]
- 30.Sapet C, Laurent N, Le Gourrierec L, Augier S, Zelphati O. In vitro and in vivo Magnetofection: a move towards gene therapy. Ann Biol Clin (Paris) 2010;68:133–42. doi: 10.1684/abc.2010.0417. [DOI] [PubMed] [Google Scholar]
- 31.Song HP, Yang JY, Lo SL, Wang Y, Fan WM, Tang XS, Xue JM, Wang S. Gene transfer using self-assembled ternary complexes of cationic magnetic nanoparticles, plasmid DNA and cell-penetrating Tat peptide. Biomaterials. 2010;31:769–78. doi: 10.1016/j.biomaterials.2009.09.085. [DOI] [PubMed] [Google Scholar]
- 32.Prosen L, Prijic S, Music B, Lavrencak J, Cemazar M, Sersa G. Magnetofection: a reproducible method for gene delivery to melanoma cells. Biomed Res Int. 2013;2013:209452. doi: 10.1155/2013/209452. [DOI] [PMC free article] [PubMed] [Google Scholar]
- 33.Lee CH, Kim EY, Jeon K, Tae JC, Lee KS, Kim YO, Jeong MY, Yun CW, Jeong DK, Cho SK, Kim JH, Lee HY, Riu KZ, Cho SG, Park SP. Simple, efficient, and reproducible gene transfection of mouse embryonic stem cells by magnetofection. Stem Cells Dev. 2008;17:133–41. doi: 10.1089/scd.2007.0064. [DOI] [PubMed] [Google Scholar]
- 34.Krotz F, Sohn HY, Gloe T, Plank C, Pohl U. Magnetofection potentiates gene delivery to cultured endothelial cells. J Vasc Res. 2003;40:425–34. doi: 10.1159/000073901. [DOI] [PubMed] [Google Scholar]
- 35.Namgung R, Singha K, Yu MK, Jon S, Kim YS, Ahn Y, Park IK, Kim WJ. Hybrid superparamagnetic iron oxide nanoparticle-branched polyethylenimine magnetoplexes for gene transfection of vascular endothelial cells. Biomaterials. 2010;31:4204–13. doi: 10.1016/j.biomaterials.2010.01.123. [DOI] [PubMed] [Google Scholar]
- 36.Pickard MR, Barraud P, Chari DM. The transfection of multipotent neural precursor/stem cell transplant populations with magnetic nanoparticles. Biomaterials. 2011;32:2274–2284. doi: 10.1016/j.biomaterials.2010.12.007. [DOI] [PubMed] [Google Scholar]
- 37.Guzman R, Uchida N, Bliss TM, He D, Christopherson KK, Stellwagen D, Capela A, Greve J, Malenka RC, Moseley ME, Palmer TD, Steinberg GK. Long-term monitoring of transplanted human neural stem cells in developmental and pathological contexts with MRI. Proc Natl Acad Sci U S A. 2007;104:10211–6. doi: 10.1073/pnas.0608519104. [DOI] [PMC free article] [PubMed] [Google Scholar]
- 38.Buerli T, Pellegrino C, Baer K, Lardi-Studler B, Chudotvorova I, Fritschy JM, Medina I, Fuhrer C. Efficient transfection of DNA or shRNA vectors into neurons using magnetofection. Nat Protoc. 2007;2:3090–101. doi: 10.1038/nprot.2007.445. [DOI] [PubMed] [Google Scholar]
- 39.Fallini C, Bassell GJ, Rossoll W. High-efficiency transfection of cultured primary motor neurons to study protein localization, trafficking, and function. Mol Neurodegener. 2010;5:17. doi: 10.1186/1750-1326-5-17. [DOI] [PMC free article] [PubMed] [Google Scholar]
- 40.Kamau Chapman SW, Hassa PO, Koch-Schneidemann S, von Rechenberg B, Hofmann-Amtenbrink M, Steitz B, Petri-Fink A, Hofmann H, Hottiger MO. Application of pulsed-magnetic field enhances non-viral gene delivery in primary cells from different origins. J Magn Magn Mater. 2008;320:1517–1527. [Google Scholar]
- 41.Lako M, Armstrong L, Cairns PM, Harris S, Hole N, Jahoda CA. Hair follicle dermal cells repopulate the mouse haematopoietic system. J Cell Sci. 2002;115:3967–74. doi: 10.1242/jcs.00060. [DOI] [PubMed] [Google Scholar]
- 42.Jahoda CA, Whitehouse J, Reynolds AJ, Hole N. Hair follicle dermal cells differentiate into adipogenic and osteogenic lineages. Exp Dermatol. 2003;12:849–59. doi: 10.1111/j.0906-6705.2003.00161.x. [DOI] [PubMed] [Google Scholar]
- 43.Koobatian MT, Liang MS, Swartz D, Andreadis ST. Differential effects of culture senescence and mechanical stimulation on the proliferation and leiomyogenic differentiation of MSC from different sources: implications for engineering vascular grafts. Tissue Eng, Part A. 2014 doi: 10.1089/ten.tea.2014.0535. [DOI] [PMC free article] [PubMed] [Google Scholar]
- 44.Furlani EP, Xue X. A model for predicting field-directed particle transport in the magnetofection process. Pharm Res. 2012;29:1366–79. doi: 10.1007/s11095-012-0681-0. [DOI] [PubMed] [Google Scholar]
- 45.Furlani E, Xue X. Field, force and transport analysis for magnetic particle-based gene delivery. Microfluid Nanofluid. 2012;13:589–602. [Google Scholar]
- 46.Xue X, Furlani EP. Template-assisted nanopatterning of magnetic core-shell particles in gradient fields. Phys Chem Chem Phys. 2014;16:13306–17. doi: 10.1039/c4cp01563k. [DOI] [PubMed] [Google Scholar]
- 47.Yamamoto M, Okumura S, Schwencke C, Sadoshima J, Ishikawa Y. High efficiency gene transfer by multiple transfection protocol. Histochem J. 1999;31:241–243. doi: 10.1023/a:1003598614323. [DOI] [PubMed] [Google Scholar]
- 48.Gheisari Y, Soleimani M, Azadmanesh K, Zeinali S. Multipotent mesenchymal stromal cells: optimization and comparison of five cationic polymer-based gene delivery methods. Cytotherapy. 2008;10:815–23. doi: 10.1080/14653240802474307. [DOI] [PubMed] [Google Scholar]
- 49.Tian J, Andreadis ST. Independent and high-level dual-gene expression in adult stem-progenitor cells from a single lentiviral vector. Gene Ther. 2009;16:874–84. doi: 10.1038/gt.2009.46. [DOI] [PMC free article] [PubMed] [Google Scholar]
- 50.Serrano M, Lin AW, McCurrach ME, Beach D, Lowe SW. Oncogenic ras provokes premature cell senescence associated with accumulation of p53 and p16INK4a. Cell. 1997;88:593–602. doi: 10.1016/s0092-8674(00)81902-9. [DOI] [PubMed] [Google Scholar]
- 51.Giordano A, Galderisi U, Marino IR. From the laboratory bench to the patient’s bedside: An update on clinical trials with mesenchymal stem cells. J Cell Physiol. 2007;211:27–35. doi: 10.1002/jcp.20959. [DOI] [PubMed] [Google Scholar]
- 52.Salem HK, Thiemermann C. Mesenchymal stromal cells: current understanding and clinical status. Stem Cells (Dayton, Ohio) 2010;28:585–96. doi: 10.1002/stem.269. [DOI] [PMC free article] [PubMed] [Google Scholar]
- 53.Trounson A, Thakar RG, Lomax G, Gibbons D. Clinical trials for stem cell therapies. BMC Med. 2011;9:52. doi: 10.1186/1741-7015-9-52. [DOI] [PMC free article] [PubMed] [Google Scholar]
- 54.Jeng HA, Swanson J. Toxicity of metal oxide nanoparticles in mammalian cells. J Environ Sci Health, Part A: Toxic/Hazard Subst Environ Eng. 2006;41:2699–711. doi: 10.1080/10934520600966177. [DOI] [PubMed] [Google Scholar]
- 55.Weissleder R, Stark DD, Engelstad BL, Bacon BR, Compton CC, White DL, Jacobs P, Lewis J. Superparamagnetic iron oxide: pharmacokinetics and toxicity. Am J Roentgenol. 1989;152:167–73. doi: 10.2214/ajr.152.1.167. [DOI] [PubMed] [Google Scholar]
- 56.Kamau SW, Hassa PO, Steitz B, Petri-Fink A, Hofmann H, Hofmann-Amtenbrink M, von Rechenberg B, Hottiger MO. Enhancement of the efficiency of non-viral gene delivery by application of pulsed magnetic field. Nucleic Acids Res. 2006;34:e40. doi: 10.1093/nar/gkl035. [DOI] [PMC free article] [PubMed] [Google Scholar]
- 57.Godbey WT, Wu KK, Mikos AG. Tracking the intracellular path of poly(ethylenimine)/DNA complexes for gene delivery. Proc Natl Acad Sci U S A. 1999;96:5177–81. doi: 10.1073/pnas.96.9.5177. [DOI] [PMC free article] [PubMed] [Google Scholar]
- 58.Godbey WT, Wu KK, Mikos AG. Poly(ethylenimine)-mediated gene delivery affects endothelial cell function and viability. Biomaterials. 2001;22:471–80. doi: 10.1016/s0142-9612(00)00203-9. [DOI] [PubMed] [Google Scholar]
- 59.Sohaebuddin SK, Thevenot PT, Baker D, Eaton JW, Tang L. Nanomaterial cytotoxicity is composition, size, and cell type dependent. Part Fibre Toxicol. 2010;7:22. doi: 10.1186/1743-8977-7-22. [DOI] [PMC free article] [PubMed] [Google Scholar]
- 60.Lee MH, Padmashali R, Koria P, Andreadis ST. JNK regulates binding of alpha-catenin to adherens junctions and cell-cell adhesion. FASEB J. 2011;25:613–23. doi: 10.1096/fj.10-161380. [DOI] [PMC free article] [PubMed] [Google Scholar]
- 61.Bajpai VK, Mistriotis P, Loh YH, Daley GQ, Andreadis ST. Functional vascular smooth muscle cells derived from human induced pluripotent stem cells via mesenchymal stem cell intermediates. Cardiovasc Res. 2012;96:391–400. doi: 10.1093/cvr/cvs253. [DOI] [PMC free article] [PubMed] [Google Scholar]
- 62.Liang MS, Koobatian M, Lei P, Swartz DD, Andreadis ST. Differential and synergistic effects of mechanical stimulation and growth factor presentation on vascular wall function. Biomaterials. 2013;34:7281–91. doi: 10.1016/j.biomaterials.2013.05.073. [DOI] [PMC free article] [PubMed] [Google Scholar]
- 63.Padmashali RM, Mistriotis P, Liang MS, Andreadis ST. Lentiviral arrays for live-cell dynamic monitoring of gene and pathway activity during stem cell differentiation. Mol Ther. 2014;22:1971–82. doi: 10.1038/mt.2014.103. [DOI] [PMC free article] [PubMed] [Google Scholar]
- 64.Furlani EP. Analysis of particle transport in a magnetophoretic microsystem. J Appl Phys. 2006;99:024912. [Google Scholar]
- 65.Furlani EP, Ng KC. Nanoscale magnetic biotransport with application to magnetofection. Phys Rev E: Stat Nonlin Soft Matter Phys. 2008;77:061914. doi: 10.1103/PhysRevE.77.061914. [DOI] [PubMed] [Google Scholar]
Associated Data
This section collects any data citations, data availability statements, or supplementary materials included in this article.


