Abstract
How the brain selects appropriate sensory inputs and suppresses distractors is a central unsolved mystery in neuroscience. Given the well-established role of prefrontal cortex (PFC) in executive function1, its interactions with sensory cortical areas during attention have been hypothesized to control sensory selection2–5. To test this idea and more generally dissect the circuits underlying sensory selection, we developed a cross-modal divided attention task in mice enabling genetic access to this cognitive process. By optogenetically perturbing PFC function in a temporally-precise window, the ability of mice to appropriately select between conflicting visual and auditory stimuli was diminished. Surprisingly, equivalent sensory thalamo-cortical manipulations showed that behavior was causally dependent on PFC interactions with sensory thalamus, not cortex. Consistent with this notion, we found neurons of the visual thalamic reticular nucleus (visTRN) to exhibit PFC-dependent changes in firing rate predictive of the modality selected. visTRN activity was causal to performance as confirmed via subnetwork-specific bi-directional optogenetic manipulations. Through a combination of electrophysiology and intracellular chloride photometry, we demonstrated that visTRN dynamically controls visual thalamic gain through feedforward inhibition. Combined, our experiments introduce a new subcortical model of sensory selection, where prefrontal cortex biases thalamic reticular subnetworks to control thalamic sensory gain, selecting appropriate inputs for further processing.
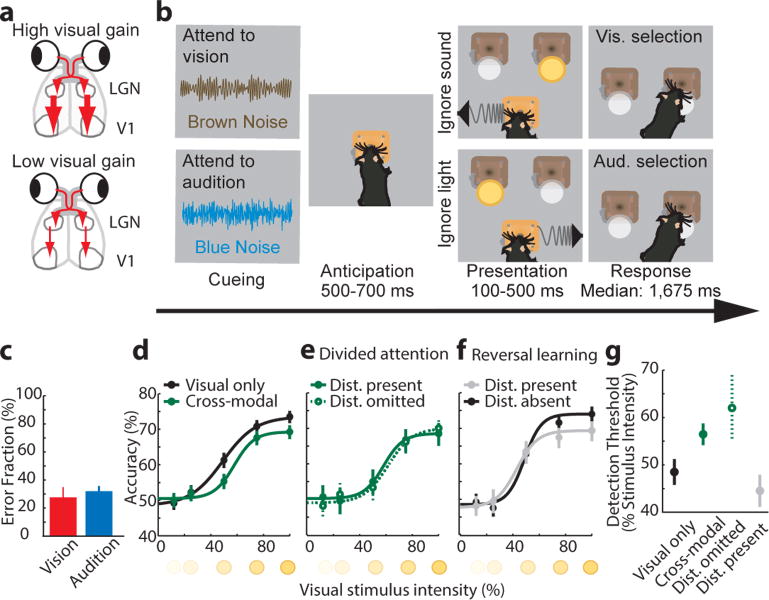
To dissect the circuit basis of sensory selection, we sought a behavior capable of dividing attention across modalities in the freely behaving mouse. Building on the rich history of visual neuroscience6–8, we focused our investigations on visual processing under conditions where vision was behaviorally selected or suppressed (Fig. 1a). As such, we developed and validated a two-alternative forced choice cross-modal task where mice selected between conflicting visual and auditory stimuli on a trial-by-trial basis. Stimuli indicated the location where a mouse had to nose-poke in order to obtain reward. Trial availability and target modality were signaled through binaurally emitted noise. In some mice, brown noise signaled a visual target (Fig. 1b top) while blue noise signaled an auditory target (Fig. 1b bottom). Cueing was counterbalanced across mice with no effect on performance noted. By design, the task was asymmetric, with a visual detection component (LED flash, appearing to the right or left) and an auditory discrimination component (upsweep; 10–14 kHz or downsweep; 10–14 kHz). Multiple quality control metrics ensured that mice performed this task using the biasing cues (brown and blue noise), rather than low-level alternating strategies (Extended Data Fig. 1). Performance on the two modalities was balanced (n = 15 mice, Fig. 1c).
Figure 1. Cross-modal divided attention in the mouse.
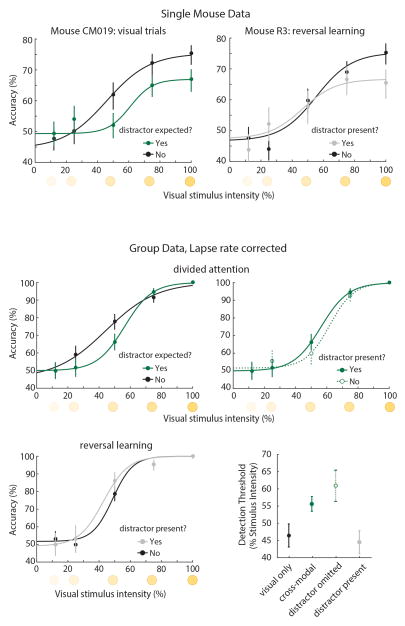
(a) Hypothesized control of visual gain under cross-modal conditions (LGN; lateral geniculate nucleus; V1: primary visual cortex). (b) Task design. A mouse is simultaneously informed about trial availability and the nature of the target stimulus through binaurally delivered noise. In this schematic, brown noise denotes ‘attend to vision’ and blue noise denotes ‘attend to audition’. Following a variable anticipation where the mouse is required to hold its snout in a centrally located poke, conflicting auditory and visual stimuli are presented. By design, the task is asymmetric, having a visual detection component (presence or absence of light at the reward location) and an auditory discrimination component (upsweep; turn left, downsweep; turn right). (c) Mice exhibited comparable performance on visual and auditory trials (mean ± s.e.m., n = 15 mice). (d) Visual detection performance in cross-modal trials compared to visual-only trials (n = 4 mice, ≥421 trials per condition). Note that both detection threshold and peak performance were lower in the cross-modal condition. (e) Eliminating auditory distractor in the cross-modal condition did not impact the visual detection psychometric function (n = 4 mice, ≥211 trials per condition). (f) When mice were not differentially cued but instead ignored the auditory stimulus by learning that it was not rewarded over a full session (reversal learning) visual detection threshold did not change (n = 6 mice, ≥242 trials per condition). (g) Visual detection threshold (bootstrap computed) of the pertinent psychometric functions in c–e. Error bars in (d–g) are 95% confidence intervals, and therefore, non-overlap denotes significance of p < 0.05.
Comparing visual detection under cross-modal and visual-only conditions suggested divided attention between vision and audition in the cross-modal task (Fig. 1d). Specifically, visual detection threshold was higher in cross-modal trials (n = 4 mice, p < 0.05, bootstrap comparison, see Extended Data Fig. 2 for single mouse examples and fixed lapse rate analysis). Strikingly, this difference persisted even when the conflicting auditory stimulus was randomly but systematically removed (Fig. 1e; Extended Data Fig. 3), suggesting that diminished visual perception under cross-modal conditions is a result of expectation (top-down) not sensory interference (bottom-up). Conversely, when mice selected targets based on reward history, detection threshold was unaffected (Fig. 1f, n = 6 mice). Selective suppression of the visual detection threshold in cross-modal trials was observed both in the raw (Fig. 1d–e) and fitted (Fig. 1g) data. Together, these findings suggest that a cued, trial-by-trial task design is required for investigating sensory selection in divided attention.
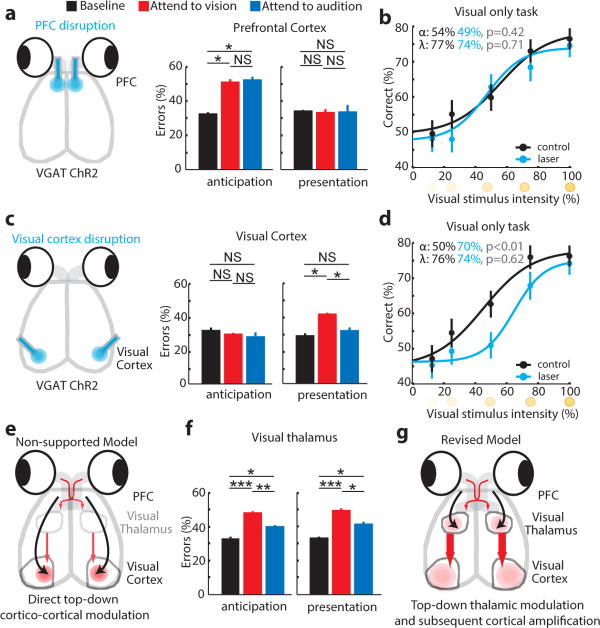
Given the known role of PFC in top-down control of sensory processing, and that our psychophysical measurements revealed top-down engagement in the cross-modal task, we asked whether cross-modal performance was PFC-dependent. We targeted the prelimbic cortex, given its known homology to primate dorsolateral PFC9. We used the VGAT-ChR2 animal to disrupt PFC function in a temporally precise manner. In this mouse, the light-activated ion channel, channelrhodopsin-2 (ChR2) is expressed under the vesicular GABA transporter promoter (VGAT)10. Optogenetic drive in this mouse is known to exert intensity- and duration-dependent inhibition of excitatory neural activity11, 12. Using this approach, we observed behavioral disruption only when the PFC activity was perturbed during stimulus anticipation (Fig. 2a, n = 4 mice). This effect was dependent on the cross-modal nature of the task as perturbing PFC in a visual-only task had no effect on performance regardless of task difficulty (Fig. 2b, n = 3 mice, ≥ 246 trials per condition).
Figure 2. Evidence for top-down thalamic modulation in divided attention.
(a) Disrupting PFC activity by delivering blue laser pulses (50Hz, 18msec; 90% duty cycle) impaired task performance at 100% stimulus intensity on both modalities equally only when manipulation was performed during stimulus anticipation (n = 4 VGAT-ChR2 mice, * p < 0.05, Wilcoxon rank-sum test). (b) Effect was related to the cross-modal nature of the task, not its difficulty, as PFC inhibition did not impact performance on a visual-only task. (c) Disruption of primary visual cortex during stimulus presentation impaired performance on visual trials (n = 4 mice). (d) Effect in c was related to task difficulty, as it increased visual detection threshold in a visual-only task. (e) The data in a and c do not support a causal role for PFC interactions with primary visual cortex in performance. (f) Perturbing visual thalamic function in a manner similar to cortical perturbations in VGAT-ChR2 mice preferentially diminished performance on visual trials both during anticipation and presentation of target stimuli (n = 12 sessions from 3 mice, * p < 0.05, ** p < 0.01, *** p < 0.001, Wilcoxon rank-sum test). (g) Finding in f supports a model in which PFC activity influences thalamic sensory processing. Bar graphs represent mean ± s.e.m. Error bars for psychometric curves are 95% confidence intervals.
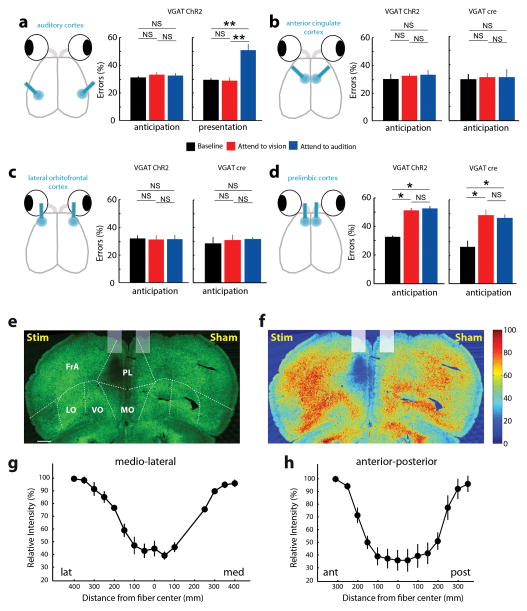
We reasoned that the PFC might be exerting its effect on performance by biasing sensory circuits towards target stimulus processing and distractor suppression. Several studies have suggested that this top-down bias is exerted at the level of sensory cortex4, 13. We did not find this to be the case in our task; perturbing visual cortical activity diminished visual performance only during stimulus presentation (Fig. 2c). This effect, unlike that of the PFC, was not cross-modal task specific, as it increased detection threshold in a visual-only task (Fig. 2d, n = 3 mice, ≥ 239 trials per condition, p<0.01, bootstrap comparison). An analogous manipulation of auditory cortex resulted in a qualitatively similar impact on performance, but with a larger effect size (Extended Data Fig. 4a, n = 4 mice, **p<0.01, Wilcoxon Rank-Sum Test), likely due to auditory cortical requirement for stimulus discrimination14. Overall, these findings support the role of sensory cortical areas in stimulus amplification and discrimination, but are inconsistent with them being a locus for top-down bias of sensory processing. Moreover, optogenetic perturbations of frontal regions that directly project to visual and auditory cortices such as anterior cingulate cortex (ACC) and lateral orbitofrontal cortex (OFC), did not impact cross-modal performance (Extended Data Fig. 4b, c, n = 8 sessions, 2 mice). In contrast, localized viral injection of AAV-hSyn-DIO-ChR2 to prelimbic cortex of VGAT-Cre mice followed by optical manipulation disrupted performance (Extended Data Fig. 4d; Extended Data Fig. 4e–h).
Having shown that direct prefrontal-sensory cortical interaction is unlikely to account for top-down control of visual processing (Fig. 2e), we sought to find the locus of attentional modulation observed in the cross-modal task (Fig. 1c). The sensory thalamus has been implicated in attentional modulation in primates15–17, raising the possibility that it could be a locus of top-down sensory bias. Using a similar VGAT-ChR2 strategy, we found that optogenetic perturbation of visual thalamus (lateral geniculate nucleus; LGN) either during stimulus anticipation or presentation, impaired cross-modal performance (Fig. 2f, n = 12 sessions, 3 mice). This suggested that top-down bias of visual detection may be thalamic-based (Fig. 2g). Visual thalamic manipulation resulted in worsening performance on both auditory and visual trials, implicating intra-thalamic interactions in this behavioral effect. Intra-thalamic interactions are mediated by a shell of GABAergic neurons surrounding thalamic nuclei known as the thalamic reticular nucleus (TRN)18. In addition, these neurons have been hypothesized to control the gain of thalamic output in a behaviorally relevant manner19, 20. As such, we asked whether the TRN could be a locus of top-down modulation of sensory thalamus.
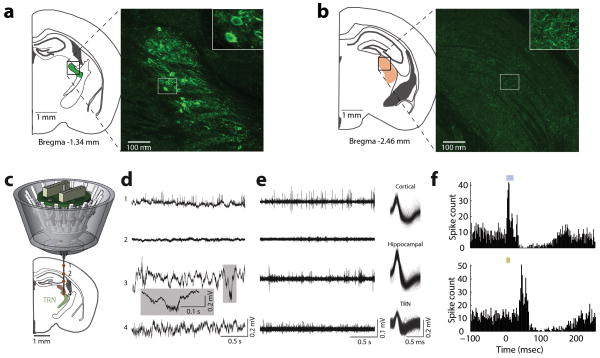
To investigate the role of TRN in visual gain control under divided attention conditions, we used a previously employed intersectional genetic/connectivity strategy to label inhibitory (VGAT-positive) neurons that projected to the lateral geniculate nucleus (LGN) with retrograde lentiviruses20 (Fig. 3a, Extended Data Fig. 5a,b), and optogenetically tagged them during extracellular recordings in freely behaving mice (Extended Data Fig. 5c–f).
Figure 3. PFC-dependent visTRN modulation suggests PFC-TRN functional coupling is required for visual gain control.
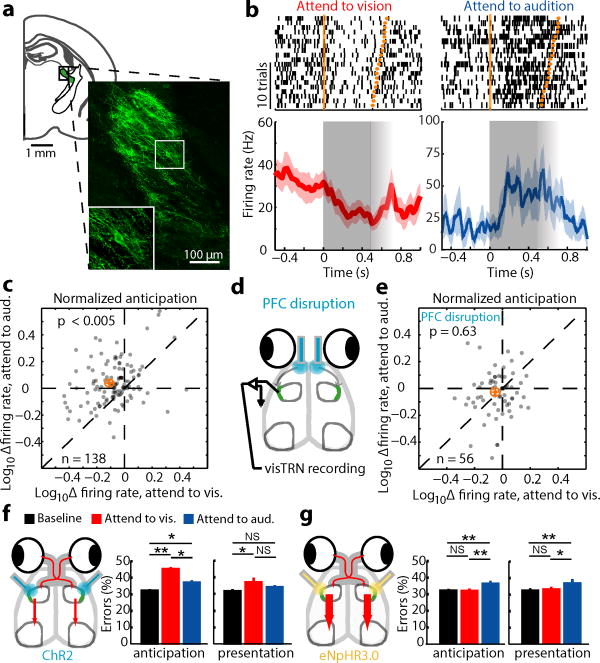
(a) Intersectional tagging of visTRN based on connectivity and genetic identity. Inset: Maximum projection of ten 1μm confocal images. Cells were labeled with ChR2-EYFP and stained with anti-GFP. (b) Raster of two visTRN neurons triggered on task initiation. Note the reduction of firing rate between the first trigger (trial initiation) and second one (stimulus presentation) during the ‘attend to vision’ condition, but the opposite during ‘attend to audition’ condition. Fading gray boxes denote the jitter of the anticipatory period. (c) Group analysis of b, showing a scatter plot of 138 visTRN neurons (n = 4 animals, p < 0.005, Wilcoxon rank-sum test performed over all cells). Orange crosshair indicates mean ± 95% confidence interval. (d) PFC activity was disrupted during stimulus anticipation to examine impact on visTRN activity. (e) PFC disruption diminished visTRN attentional modulation. (f–g) Behavioral performance is causally dependent on visTRN attentional modulation. (f) Optogenetic activation of retrogradely tagged visTRN neurons resulted in preferential diminishing of visual trials (mean ± s.e.m., n = 12 sessions from 3 mice, * p < 0.05, ** p < 0.01, *** p < 0.001, Wilcoxon rank-sum Test), consistent with this manipulation lowering visual gain. (g) In contrast, optogenetic inhibition of visTRN preferentially diminished auditory trials, consistent with inappropriate visual gain increase (n = 12 sessions from 3 mice).
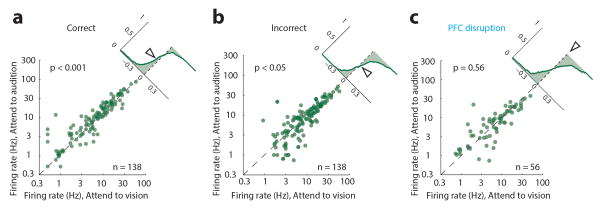
During cross-modal performance, we observed bi-directional modulation of visual TRN (visTRN) neurons consistent with their hypothesized role in behaviorally-relevant visual gain control. Specifically, during ‘attend to vision’ trials, firing rates of these neurons were reduced. In contrast their rates were elevated during ‘attend to audition’ trials (examples Fig. 3b, population Fig. 3c, n = 138 cells; Extended Data Fig. 6). Importantly, visTRN attentional modulation was eliminated by optogenetic PFC disruption (Fig. 3d, e, n = 56 cells). While PFC disruption diminished performance, the effects on visTRN firing rates were not simply a covariant of inaccurate performance (Extended Data Fig. 7). Meaning, in contrast to naturally occurring error trials where diminished visTRN firing rate modulation was observed in both ‘attend to vision’ and ‘attend to audition’ trials, PFC disruption had a greater effect on ‘attend to audition’ trials. This result may reflect a role for PFC in distractor suppression.
To examine whether the physiological effects observed in visTRN were causal to behavior, we bi-directionally manipulated this subnetwork. While activating visTRN resulted in similar effects as driving LGN inhibition in VGAT-ChR2 mice (Fig. 3f, n = 12 sessions, 3 mice), the effect size was smaller, likely reflecting the weaker nature of the genetic manipulation (Extended Data Fig. 8). This result supports the notion that elevated visTRN firing reduces visual thalamic gain. In contrast, inhibiting visTRN using the light activated Cl− pump, eNpHR3.0 diminished performance on ‘attend to auditory’ trials, suggesting it inappropriately enhanced visual thalamic gain when it needed to be suppressed (Fig. 3g, n = 12 sessions, 3 mice).
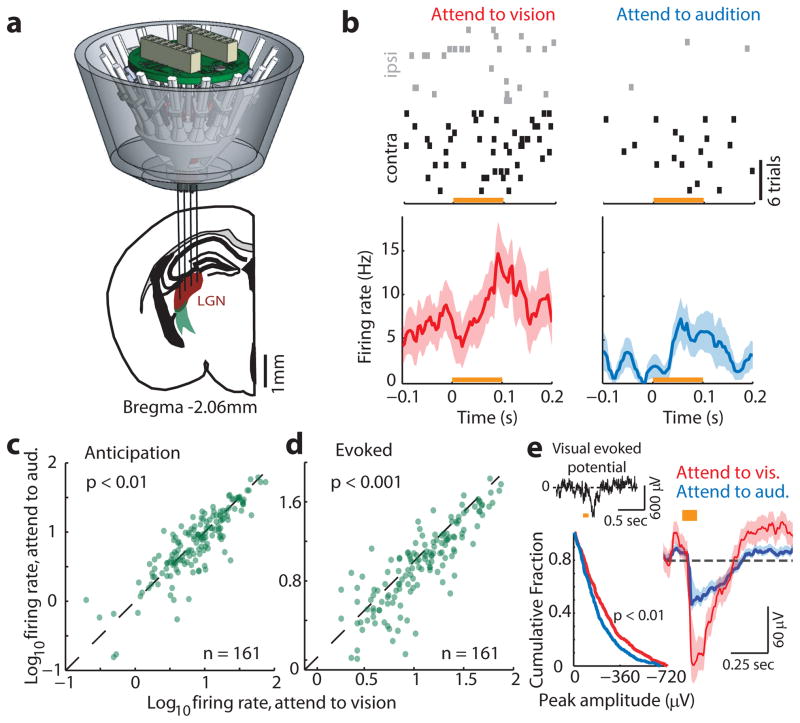
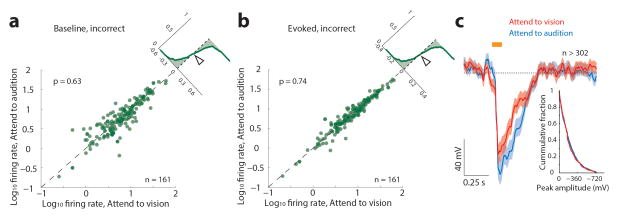
To ask whether visTRN firing rate modulation impacted visual processing, we investigated LGN spiking in response to well-controlled visual stimuli. We implanted mice with multi-electrode arrays targeted to LGN (Fig. 4a). To minimize trial-to-trial variability related to slight changes in head and eye position, we changed the nature of visual stimuli from wall-mounted to head-mounted LEDs. LGN neurons showed enhanced baseline and evoked activity when attention was directed to vision (example, Fig. 4b, population, Fig. 4c, d, n = 161 cells, 4 mice), consistent with baseline and evoked neuroimaging results observed in the human LGN21. Differences in evoked responses were also observed in the visual evoked potential (Fig. 4e, n = 684 visual and 633 auditory trials, 4 mice). These physiological effects were not observed during error trials (Extended Data Fig. 9).
Figure 4. Direct evidence for visual thalamic gain modulation in divided attention.
(a) Cartoon depiction of multi-electrode targeting of LGN in freely behaving mice. (b) Example of differential modulation of a single LGN cell spiking under the two anticipatory task conditions. Note that contralateral eye stimulation (with respect to recording electrodes) resulted in more robust visual drive. More importantly, the cell discharged more spikes during anticipation and presentation when attention was directed towards vision. (c–d) Group analysis of phenomenon in b (n = 161 cells, 4 mice, Wilcoxon rank-sum test). (e) Enhanced visual responses were similarly observed at the level of visual evoked potentials (top left, example VEP; bottom left, cumulative distribution of VEP amplitudes, showing higher values for ‘attend to vision’ trials (p < 0.01, KS test). Right, average VEP from 4 mice (684 visual and 633 auditory trials from 29 sessions), shaded errors are 95% confidence intervals.
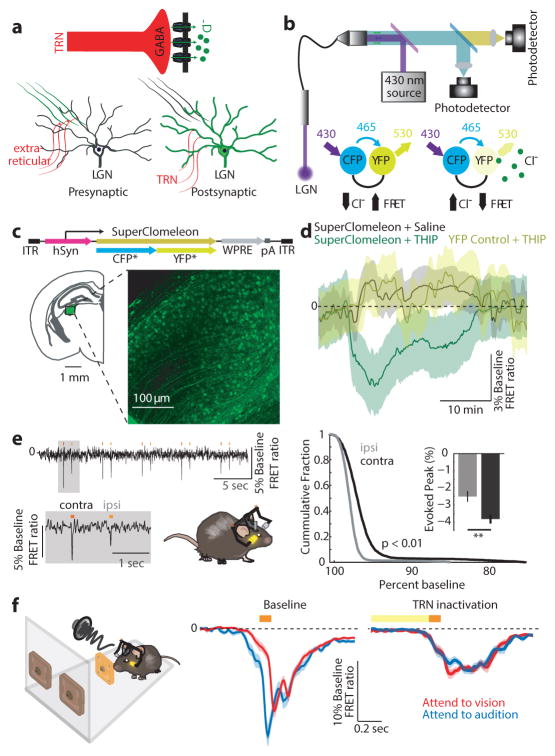
Suppression of LGN spiking in ‘attend to audition’ trials could be a result of direct feedforward inhibition or reduction in feedforward excitation. In contrast to many extra-reticular inhibitory inputs22, visTRN is known to exert direct feedforward inhibition on LGN neurons23 (Fig. 5a). As such, we sought to measure LGN inhibition directly. To do so, we leveraged a newly developed technique known as fiber photometry, which had been used to measure bulk changes of intracellular [Ca2+]24. We modified two aspects of traditional photometry to allow interrogation of [Cl−], a proxy for synaptic inhibition and an otherwise inaccessible measure. First was the genetic labeling of neurons with the Cl− indicator superclomeleon25. This FRET indicator contains cyan fluorescent protein (CFP; FRET donor) and yellow fluorescent protein (YFP; FRET acceptor). As such, under conditions of elevated [Cl−], YFP is quenched and FRET is reduced (Fig. 5b). Second was the light path; we excited superclomeleon with 430 nm light, and collected both CFP and YFP emission to subsequently perform the ratiometric measurements offline (Fig. 5b). To use this technology in vivo, we generated a viral construct harboring superclomeleon (AAV-hSyn-superclomeleon), and injected it into the LGN (Fig. 5c).
Figure 5. Measuring bulk intracellular [Cl−] in vivo shows dynamic changes in LGN inhibition during behavior.
(a) Possible mechanisms for LGN firing rate modulation; extra-reticular inputs can change activity by presynaptic inhibition of feedforward excitation while visTRN inhibits LGN directly. (b) FRET photometry setup and schematic of CFP-to-YFP FRET. (c) Cloning of the FRET-based Cl− indicator superclomeleon into an AAV followed by in vivo expression in the LGN. (d) Pharmacological confirmation of the technical feasibility of superclomeleon FRET for GABAa mediated increase in intracellular [Cl−] by injection of the GABAa agonist THIP. Note that the YFP control mice did not show similar signals (n = 3 mice per condition, shaded errors are 95% confidence intervals). (e) Mice showed visual-evoked superclomeleon FRET responses that are stronger for the contralateral eye, as would be predicted (n = 3 mice, p < 0.05, Wilcoxon Rank-sum Test). Yellow bars mark the display of the light stimuli. (f) Left Cartoon depiction of photometry in the cross-modal task, where the visual stimulus was signaled through a head-mounted LED as in Fig. 4 (see Supplementary Video 1 for illustration). Middle Differential visual-evoked [Cl−] LGN responses in relation to the modality anticipated (363 visual and 274 auditory correct trials from 6 mice). Shaded errors are 95% confidence intervals. Note that ‘attend to audition’ trials showed an earlier increase in [Cl−] (decreased superclomeleon FRET) and the separation between the two traces started prior to stimulus onset, consistent with differential anticipatory changes of visTRN activity. Right Optogenetic TRN inactivation eliminates this differential response (101 visual and 82 auditory correct trials from 3 mice).
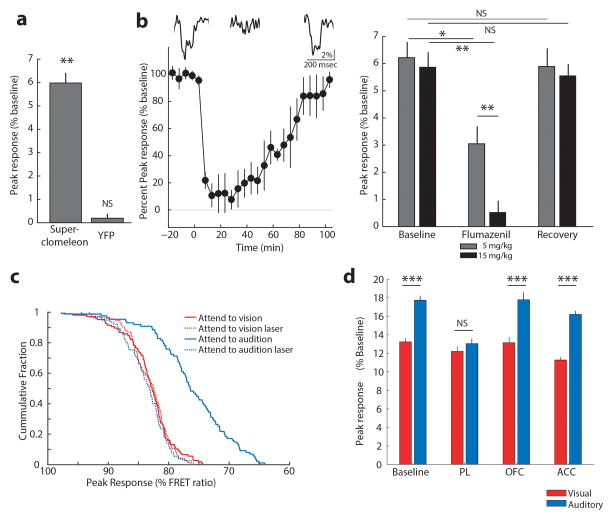
We validated superclomeleon FRET as measure of inhibition by two methods. First, we reasoned that pharmacological activation of GABAa receptors would increase intracellular [Cl−] and reduce YFP emission. Indeed, intraperitoneal injection of the GABAa agonist 4,5,6,7-tetrahydroisoxazolo(5,4-c)pyridin-3-ol (THIP, 8mg/kg) reduced superclomeleon FRET in a pharmacokinetically predicted manner26 (Fig. 5d, n = 3 mice). Second, we expected visual drive to result in inhibition of LGN neurons that balanced excitation. This indeed was the case and importantly these signals were larger when visual stimuli were delivered to the side contralateral to the recorded LGN compared to the ipsilateral side (Fig. 5e, n = 3 mice). These rapid events were not observed in YFP control mice (Extended Data Fig. 10a). Superclomeleon visual transients were sensitive to the GABAa receptor antagonist Flumazenil in a dose-dependent manner (Extended Data Fig. 10b), confirming that they reflect GABAergic inhibition.
Having validated Cl− photometry, we asked whether changes in visual gain associated with sensory selection were explained by opposing changes in LGN feedforward inhibition. We found this to be the case; visual-evoked Cl− photometry showed significantly larger responses in ‘attend to audition’ trials compared to ‘attend to visual’ trials (Fig. 5f, 363 visual and 274 auditory trials, 6 mice, example trials shown in Supplementary Video 1). Importantly, signal kinetics in these two conditions were distinct; auditory selection showed an earlier reduction in FRET ratio than visual selection trials, consistent with the differential baseline spiking observed in visTRN. Optogenetic visTRN inactivation eliminated this differential inhibitory response (Fig 5f, Extended Data Fig. 10c, n = 3 mice, > 82 trials). Overall, our data support the model that thalamic gain control can be explained by feedforward inhibition, and that TRN is the source of this inhibition. More generally, to our knowledge, this experiment constitutes the first measurement of inhibitory dynamics in freely behaving animals.
Seminal studies have shown the thalamus to be much more than a cortical relay27, 28. By providing a mechanistic circuit dissection of thalamic involvement in divided attention, we extend these studies in two important dimensions. First, our findings in mice show the generality of thalamic attentional modulation across mammalian brains. Second, we provide a first description, with causal circuit dependence, of how prefrontal top-down control changes thalamic inhibitory dynamics to modulate sensory gain. The specific involvement of prelimbic cortex in this behavior, which we further demonstrate through combined optogenetics and chloride photometry (Extended Data Fig. 10d), does not eliminate the possibility that OFC and ACC may be engaged in other types of top-down control, potentially via cortico-cortical interactions5. In addition to regulating sensory gain, prelimbic control of thalamic inhibition may regulate the degree by which relay nuclei participate in large scale functional interactions17.
The ability to directly measure [Cl−] dynamics provided access to a critical biological variable: GABAa-mediated synaptic inhibition. While photometry has already been introduced into neuroscience for measurement of [Ca2+] in cell bodies and terminals25, FRET-based Cl− had never been previously performed. In this study, developing Cl− photometry was essential for establishing a direct physiological link between visTRN and LGN spiking (technical discussion in Supplementary Information).
Thirty years ago, Francis Crick proposed that the TRN functions as a searchlight, directing the internal spotlight of attention to thalamo-cortical circuits that process ongoing behavioral demands19. Due to technical limitations, this transformative model has been difficult to test, particularly under conditions where the attentional spotlight shifts. Our study combined novel and established technology to provide mechanistic details for Crick’s ‘searchlight hypothesis’. As such, we have taken important step in understanding the circuit mechanisms of sensory selection.
Online Content Methods, along with additional Extended Data display items are available in the online version of the paper; references unique to these sections appear only in the online paper
Methods
Animals
VGAT-ChR2 mice were purchased from the Jackson Labs and maintained on a C57Bl6/J background. VGAT-Cre mice were backcrossed to C57Bl6/J mice for at least six generations. For experiments in Figure 1, a total of fifteen animals were trained, ten of which were later used to establish psychometric functions (four for divided attention, and six for reversal learning). For Figure 2, four VGAT-ChR2 mice were used for disruption of PFC and primary sensory cortices and three mice were used for inactivating LGN. In Figure 3, four VGAT-cre mice were used for electrophysiological recordings from optogenetically identified visTRN neurons of which two were used for combined electrophysiologial recordings with optogenetic PFC inactivation (Fig 3c–e). An additional six mice were used for optogenetic activation or inhibition of visTRN (three per manipulation) during behavior (Fig 3f–g). Four wild type mice were used for LGN recordings (Figure 4). For Figure 5 (fiber photometry experiments) six mice were injected with AAV-hSyn-superclomeleon for behavior and pharmacology experiments and three YFP control mice were used. Including all animals used for extended data figures, a total of 28 male mice, 1.5–6 months old, were trained on the cross-modal task. All experimental procedures involving animals were performed according to the guidelines of the Institutional Animal Care and Use Committee at the New York University Langone Medical Center and the US National Institutes of Health.
Behavioral Training and Testing
Behavioral setup
Experiments were conducted in a custom-built trapezoidal testing chamber (base1: 12cm, base2: 25cm, height: 25cm) positioned over a grid floor. The testing chamber contained three nose pokes, each of which consisted of an IR LED/IR phototransistor pair (Digikey, Thief River Falls, MN) for response detection. Activation of a central nose-poke located on the grid floor, 6 cm away from the reward wall, was required for trial initiation. Two headphone speakers (Skullcandy, Park City, UT) embedded in the floor delivered biasing cues binaurally. Two white light emitting diodes (Mouser, El Cajon, CA) were mounted 6.5cm apart on the base wall below two additional nose-pokes. Liquid reward consisting of 10μl of evaporated milk was delivered directly to these wall-mounted nose-pokes via a single-syringe pump (New Era Pump Systems, Farmingdale, NY). Access to these response nose-pokes was restricted by a rotating, servo-controlled (Tower Hobbies, Champaign, IL) disk (radius 7cm). Rewards could only be accessed from these nose-pokes when two holes in the rotating disk were aligned with the underlying nose-pokes. Trial logic was controlled by custom software running on an Arduino Leonardo microcontroller (Ivrea, Italy).
Training
Mice were food restricted to 85%–90% of their ad libitum body weight prior to training. Training consisted of multiple levels. First, mice were habituated to the test box and allowed to collect reward freely. Reward availability was signaled by the rotation of the aforementioned wall-mounted disk. The location of reward (left or right poke) was indicated by either a visual or an auditory stimulus.
For ‘attend to vision’ (visual) trials, the rewarded response poke was indicated by illumination of the LED mounted underneath it. In ‘attend to audition’ (auditory) trials, an upsweep (10–14kHz, 500ms) indicated left and a downsweep (16–12kHz, 500ms) indicated right reward. To facilitate discrimination learning, sweeps were initially presented in a directional manner.
Trials were given in single-modality blocks of six, with alternating block type (i.e. six visual trials followed by six auditory trials) as in Extended Data Fig. 1 (top). The stimulus was presented until the animal collected the reward. An individual trial was terminated 20 s after reward collection, and a new trial became available 5 s later. Second, mice learned to poke in order to receive reward. All other parameters remained constant. An incorrect poke had no negative consequence. By the end of this training phase, all mice collected at least 20 rewards per 30 minute session.
Third, mice were trained to initiate individual trials, allowing for the establishment of a temporal window in which they could anticipate subsequent delivery of the stimuli. For successful initiation, mice had to briefly (50 ms) break the infra-red beam in the initiation poke to trigger stimulus presentation and rotation of the wall-mounted disk. Mice were informed about trial availability and modality type by brown noise (10 kHz low-pass filtered white noise, visual trial) or blue noise (11 kHz high-pass filtered white noise, auditory) delivered binaurally. At this stage, modality types were arranged in a non-conflicting block design (Extended Data Fig. 1, top). Correct poking resulted in reward delivery, while incorrect poking resulted in immediate termination of the trial by disk rotation, blocking access to reward. Rewards were available for 15 s following correct poking, followed by a 5 s inter-trial interval (ITI). Incorrect poking was punished with a time-out, which consisted of a 30 s ITI. Mice could not initiate new trials during an ITI. To avoid development of side preferences, on trials following an incorrect response the target stimulus would appear at the same location as it did on the previous trial. After one week of training on this stage, mice successfully associated the target stimuli with appropriate reward location (Extended Data Fig. 1, top row). At this stage directionality of sound stimuli did not impact performance.
Fourth, mice had to resolve sensory conflict. Auditory and visual target stimuli were presented always in a conflicting fashion (Extended Data Fig. 1, middle). The brown and blue noise cues indicated the modality to be selected. Within a session, four different trial types were presented in blocks in repeating order: (1) three auditory trials, (2) three visual trials, (3) six conflict trials with auditory target, and (4) six conflict trials with visual target. To prevent modality preferences, an incorrect response resulted in the repetition of the same trial type, thereby specifically increasing the block length of the trial types with weak performance. This training stage was introduced to teach mice to only attend to the target modality during a conflict trial. Over the course of this training stage (1 week), the duration of the target stimuli was successively shortened to 3s, 1s, and 0.5s. In parallel, the time that mice had to break the IR barrier in the initiation nose-poke was continuously increased and randomized to a final range of 0.5–0.7s, rendering the precise target stimuli presentation time unpredictable. Once mice performed successfully on conflict trials (Extended Data Fig. 1, middle) the single-modality trials were removed and block length was reduced to three trials. This change in the training paradigm was made to facilitate learning of the trial type cueing (brown and blue noise).
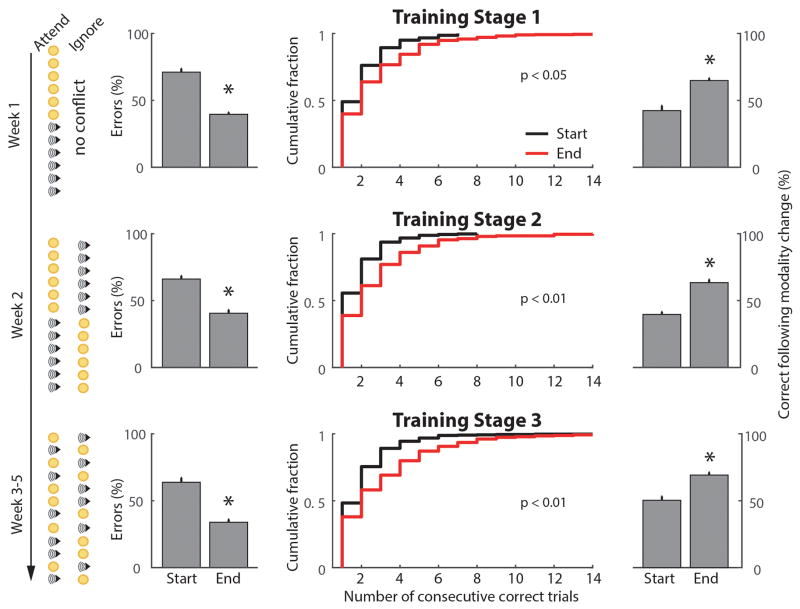
On the fifth and final stage of training, all block structure was removed and trial type was randomized (Extended Data Fig. 1, bottom). We used three measures to ensure that mice followed the trial type cueing and did not employ simple alternating strategies. In addition to computing overall accuracy (Extended Data Fig. 1, left) we quantified the number of consecutive correct trials (Extended Data Fig. 1, middle) and calculated the fraction of correct modality switches (Extended Data Fig. 1, bottom). At this final stage, rewards were only available for 5 s.
Psychophysics
For experiments determining visual detection psychometric function, the ratio between visual and auditory trials was adjusted from the typical 1:1 to a 4:1 ratio in order to facilitate the acquisition of a larger number of visual trials while maintaining the divided attention nature of the task. In addition, visual stimulus duration was shortened to 0.1s and the light was randomly displayed at one of five different intensities (0.15, 0.3, 0.6, 0.9, 1.2 lumens). To establish the comparison between psychometric functions of visual-only and divided attention trials (Fig. 1c) we trained mice that reached criterion (>70% accuracy) on the cross-modal task to perform a visual-only task. For one week, mice were trained on a visual-only task every other day where trials containing only visual target stimuli were cued by broadband white noise. Subsequently, visual-only trials were introduced into the cross-modal task at a 1:4 ratio and in a random interleaved fashion. Mice were found to differentially anticipate visual-only and visual target with auditory conflict trials (Fig. 1c) while they continued to perform similarly well on conflict trials with auditory target (Extended Data Fig. 3).
To separate the effect of anticipating a conflicting stimulus (top-down) from the presence or absence of a distracting stimulus itself (bottom-up) we performed two experiments. In the first experiment, mice performed the cross-modal task with 70% conflict trials and 30% in which conflict was expected but auditory distraction was removed (Fig 1d). In the second experiment, mice trained on the cross-modal task had the biasing cues replaced with broadband white noise and the modality rewarded was changed on a session by session basis such that mice would only deduce it based on reward history (Fig. 1e).
Behavioral analysis and determination of visual detection threshold
Performance in behavioral tests was assessed based on the fraction of correct responses relative to chance level or guess rate (50%, γ). Estimation of visual detection threshold (α) and maximum performance (λ) was made by fitting performance across stimulation intensities with a logistic function29, 30:
where x corresponds to the five stimulus levels expressed as a percentage of maximum stimulus intensity. The fraction of correct trials as a percentage of all trials was summed across sessions and the overall performance as a function of stimulus intensity was fit using maximum likelihood estimation30 implemented in the Palamedes psychophysical toolbox (http://www.palamedestoolbox.org/). Estimation of the distribution of the α parameter was made via Non-Parametric bootstrap analysis of curve fits (Figure 1). For normalization to adjust for variable lapse rates (Extended Data Fig. 2), the fraction correct was normalized so that the minimum and maximum performance rates corresponded to 50 and 100% respectively31. Curve fitting and estimation of the alpha parameter then proceeded as described above. Model selection for the number of psychophysical parameters was based on the Aikaike information criterion (AIC)20, 32.
Optogenetics in Behavior
For experiments with optical stimulation (Figure 2), testing conditions were equivalent to the final stage of training. Laser trains of either blue (for ChR2 activation) or yellow (for eNpHR3.0 activation) light consisting of 50Hz, 18-ms pulses (90% duty cycle) at an intensity of 5–6mW (measured at tip of the optic fibers) were delivered on every other trial. On laser trials, stimulation occurred either during the anticipatory period (0.5–0.7s) or during stimulus presentation (0.5s). Because behavior and recording systems were automated and stimulus sequence and optogenetic manipulations varied on a trial by trial basis, researchers were not blinded to the conditions. In the case of multiple sequential pharmacological or optogenetic manipulations within the same animals, tests were performed in a predefined pseudorandom order. For comparisons of multiple groups, Kruskal-Wallis one way analysis of variance (ANOVA) was used to assess variance across groups prior to pairwise comparisons. Power analysis based on effect size estimates was used to determine sample size required for statistical significance with a power of β: 0.7; more than three samples were required to detect significant differences.
Electrophysiology and Optical Chloride Measurements in Behavior
For combined TRN recordings with optogenetic PFC disruption (Fig. 3d–e), laser trains of blue light (as described above) were delivered during the anticipatory period on every other trial. For electrophysiological recordings of LGN units and fiber photometry measurements, visual stimuli were presented through illumination of diffusion coated wide-angle 3 mm flat top LED lights (LightHouseLEDS, Washington) fixed directly on the head of the mice, centered 8 mm from the eyes, while the LEDs mounted on the base wall of the behavioral box were turned off. These changes allowed emitted light to activate ~150° of visual angle when the eye is centered at rest33.
Viruses
For retrograde optogenetic tagging and TRN manipulation, FuGB2-pseudotyped retrograde lentiviruses (RG-LV) were used as previously described20. VisTRN neurons were labeled through injections (0.4–0.6 μl) of RG-LV-EF1α-DIO-ChR2-GFP (for activation) or RG-LV-EF1α-DIO-eNpHR3.0-eYFP (for inactivation) into primary visual thalamus (A/P, −2.1 mm, M/L, ±2 mm, D/V, 2.5 mm) using a quintessential stereotactic injector (QSI, Stoelting, Wood Dale, IL). For combined electrophysiological recordings with optogenetic PFC disruption during behavior, 0.4 μl of AAV2-hsyn-DIO-ChR2-GFP (titer 1012 VG/ml) was injected into PFC (A/P, 2.6 mm, M/L, ±0.25 mm, D/V, −1.25 mm). To measure chloride flux in the LGN, the transgene SuperClomeleon (gift from G.J. Augustine25) was cloned into the AgeI and EcoRI restriction sites of an AAV-hSyn-SSFO-EYFP plasmid to obtain AAV-hSyn-SuperClomeleon. SuperClomeleon rAAV was packaged as serotype 2 (University of North Carolina vector core facility, titer 1012 VG/ml) and 0.6–0.7μl virus was injected into visual thalamus. Following injections, mice were allowed to recover for 2–4 weeks to allow for virus expression.
Optic fiber implants experiments
Mice were anesthetized using 1% isoflurane and mounted on a stereotactic frame. For cortical inactivation experiments, up to three pairs of optic fibers (Doric Lenses, Quebec, Canada), 4–5 mm long, were inserted bilaterally to target up to three different brain areas per mouse (see table 1). Two to three stainless-steel screws were implanted into the skull to anchor the implant and fixed with dental cement. Animals were allowed to recover and training resumed one week later. For ChR2 activation a 473nm laser and for eNpHR3.0 activation a 561nm laser was used (Omicron-Laserage, Dudenhofen, Germany).
Table 1.
Coordinates for optic fiber implantation (in mm)
| Brain area | A/P (from Bregma) | M/L | D/V |
|---|---|---|---|
| Prelimbic cortex | 2.6 | ±0.25 | −1.25 |
| Primary visual cortex | −3.5 | ±2.50 | −0.50 |
| Primary auditory cortex | −2.8 | ±4.00 | −2.00 |
| Anterior cingulate cortex | 0.5 | ±0.25 | −1.00 |
| Lateral orbitofrontal cortex | 2.6 | ±1.50 | −2.00 |
| Primary visual thalamus | −2.1 | ±2.00 | −2.50 |
| Visual TRN | −1.6 | ±2.20 | −3.00 |
Drive Construction
Custom drive housings were designed using 3D CAD software (SolidWorks, Concord, MA) and printed in Accura 55 plastic (American Precision Prototyping, Tulsa, OK) as described previously20, 34. Prior to implantation each drive was loaded with 8–12 independently movable microdrives carrying 1–3 nichrome (12.5 micron) and/or tungsten (25 micron) stereotrodes (California Fine Wire Company, Grove Beach, CA). Stereotrodes were pinned to custom designed 32- or 64-channel electrode interface boards (EIB, Sunstone Circuits, Mulino, OR) along with a common reference wire (A-M systems, Carlsborg, WA). For optogenetic tagging, an optical fiber was embedded adjacent to the stereotrode array. In these cases, the optic fiber extended 3.5 mm from the base of the drive so that it could be stereotactically positioned above the TRN during implantation. Targeting of the TRN or LGN was achieved by guiding stereotrodes and optic fibers through a square array of polyimide sleeves attached to the base of the drive body.
Drive and Fiber Implantation for Optical Activity Measurements
Prior to surgical implantation, mice were anesthetized with isofluorane and placed in a stereotaxic frame. Stainless steel screws were implanted into the skull to provide electrical and mechanical stability for drives. For drive implantations, craniotomies (~3×2 mm) were drilled centered at A/P −2 mm, M/L 2.5 mm for TRN recordings (15 degree angled implantation) and at A/P −2.3, M/L −2.5 for LGN recordings. The dura was carefully removed and drives were centered at the craniotomy coordinates using a custom stereotaxic arm. Drive bodies were slowly lowered into the craniotomy until stereotrode tips were ~500 microns below the cortical surface and optical fibers (TRN recordings) were positioned just above the TRN (2.5 mm D/V). For fiber photometry based optical recording, 400 mm diameter low internal fluorescence optic fibers (Doric Lenses, Canada) were implanted just dorsal to the LGN (−2.2 mm A/P, 2.15 mm M/L and 2.6 mm D/V) following virus injection.
Electrophysiological Recordings
Following recovery from implantation surgery, recordings were made using a Neuralynx multiplexing digital recording system (Neuralynx, Bozeman MT). Signals were acquired using 32- or 64-channel digital headstage connected to the implanted EIB. Signals from each electrode were amplified, filtered between 0.1 Hz and 9 kHz and digitized at 30 kHZ. Local field potential signals were obtained from one single wire per stereotrode. Following implantation, stereotrode sets were incrementally lowered over the course of 1–2 weeks from the cortex into the target thalamic structure (Extended Data Fig. 5). Spike sorting was performed offline following acquisition based on relative spike amplitude and energy within electrode pairs using the MClust toolbox (http://redishlab.neuroscience.umn.edu/mclust/MClust.html). Following manual clustering, cross-correlation and autocorrelation analyses were used to confirm adequate separation.
Optogenetically tagged visTRN units were identified based on ChR2 mediated response to stimulation using a 473 nm analog modulated laser (Omicron-Laserage, Dudenhofen, Germany)20. Laser light was delivered by a 200 micron optic fiber targeted to the TRN (Extended Data Fig. 5) connected to a fiber optic patch cord (200 micron core, Doric Lenses, Quebec, Canada). The laser intensity was set at ~8 mW optical output power measured at patch cord terminus. Fibers were polished prior to implantation so that the power at the tip was ≥50% maximum, resulting in ~4–5 mW laser light being delivered to the brain. Only neurons that showed clear transient responses to laser stimulation were included in the analysis.
Analysis of Firing Rate
Changes in firing rate during task performance were assessed for 138 identified visTRN neurons recorded from four animals and 119 LGN neurons in two animals. Peri-event time histograms (PETH) aligned to trial initiation and to stimulus presentation were computed using 5 ms bin width for individual neurons in each recording session4. Separate PETHs were created for correct and incorrect trials within auditory and visual target stimuli and convolved with a Gaussian kernel (8 ms half width at half height) to create a spike density function (SDF35, 36). Average firing rate across trials was determined within the anticipation window prior to stimulus presentation. Estimation of the evoked response amplitude was made by averaging the firing rate within a 100 ms window starting 20 ms after stimulus onset. Window duration was chosen based on the latency to peak response for point stimuli in the mouse LGN37.
For normalized rate changes in TRN neurons, firing rates during the attentional window in each trial were compared with the baseline firing rate (5 s window, 0.5 s prior to task initiation). Statistical comparison of firing rate changes was used to identify neurons with significant task-associated changes in firing rate via non-parametric comparison of firing rate during the attentional window and to baseline period38. The test statistic (W) was calculated based on ranking of all trials (N) and comparison using the sign function (sgn):
where x1 and x2 were the attentional window and baseline firing rate respectively and R denotes the rank. The threshold for significance was set at 0.05 and significantly modulated units were defined as neurons in which the test statistic was less than critical value for the sample size (Walpha(0.05)). Comparison of firing rate across trial types (e.g. visual versus auditory correct) was performed using Wilcoxon rank-sum test. Homogeneity of variance for firing rates across conditions was determined using Fligner and Killeen test of homoscedasticity.
Analysis of Visual Evoked Potentials
Visual evoked potentials (VEPs) were computed from the broadband LGN local field potential (LFP, 0.1 Hz – 10 kHz). The particular stereotrode used for VEP analysis in behavior was selected based on amplitude of responses in post-task recordings where there were many more trials included. Task related VEPs were averaged within correct auditory and visual trials across recording sessions. To determine peak response, the lowest negative-potential offsets associated with the visual response39 (0 – 250 ms window) were identified on a trial by trial basis. Signals from individual trials were smoothed with a 25 ms half-width filter over the response window prior to obtaining the peak offset40.
Histology
Mice were deeply anesthetized and transcardially perfused with phosphate buffered saline (PBS) followed by 4% paraformaldehyde. Brains were dissected, postfixed overnight at 4°C and sectioned using a vibratome (LEICA, Buffalo Grove, IL).
For GFP enhancement, immunofluorescent staining was carried out on 50μm thick sections using chicken anti-GFP (1:1000, GFP-1020, Aves). Sections were incubated overnight with primary antibody in PBS-T (10% Normal goat serum and 0.05% Tween20) at 4°C. Detection of primary antibodies was carried out with Alexa-fluor conjugated secondary antibodies (1:1000, A-11039, Invitrogen). All sections were imaged on a Zeiss LSM510 META confocal miroscope.
Fiber-Photometry Based Optical Chloride Measurements
Fluorescence resonance energy transfer (FRET) based measurement of chloride was made during behavior using a custom designed fiber photometry system24. A fiber coupled LED (Thorlabs, Newton, New Jersey) light source filtered using a 434 nm clean up filter (MF434-17 Thorlabs, Newton, New Jersey) was used for CFP excitation. Excitation light was split via a long pass dichroic mirror (DMLP425, Thorlabs, Newton, New Jersey) and coupled to a 400 (pharmacology) μm 0.48 NA optic patch cord (Doric lenses, Canada) linked to a 400 μm chronically implanted optical fiber. Excitation and emission light were conveyed by a single patch cord linking the FP system to the implanted fiber. Superclomeleon CFP and YFP emissions25 were separated using a single-edge beam splitter (FF511-Di01, Semrock, Rochester, New York). Each emission wavelength was independently focused onto a separate femtowatt silicon photoreceiver (Newport, Irvine, CA) using custom optics (12.7 mm FL Planoconvex lens mounted in Thorlabs SM1NR05 lens tube). Light signal was digitized and recorded using a TDT signal acquisition system (Tucker-Davis Technologies, Alachua, FL). Signal bandwidth was limited to < 750 Hz based on the photoreceiver response characteristics. Fluorescence ratio was calculated across the recording period. To minimize the impact of slow fluctuations, normalized delta fluorescence (df/F) was calculated for evoked responses relative to baseline fluorescence level prior to each event (1 s window). Traces were smoothed with a convolution filter (50 ms half-width). Peak response (Extended Data Fig. 10) was estimated as the minimum over a 500 ms window following stimulus onset. For pharmacological activation of GABAa receptors with 4,5,6,7-tetrahydroisoxazolo(5,4-c)pyridin-3-ol (THIP), baseline fluorescence was estimated over five minutes prior to injection. For visual stimulation, light pulses of 100 ms duration were displayed to the ipsi- or contra-lateral side of the recorded LGN. Effects of GABAa receptor antagonist flumazenil on visual evoked responses were quantified by comparing the average peak response within 5 min prior to injection (baseline) to one within a 5 min time window around the maximal response suppression (maximal drug effect) and at the end of the recording session (recovery, at least 100 min after injection). For optogenetic manipulations of frontal cortical structures, smaller diameter patch-cords (200 μm, 0.37 NA) were used to allow movement and prevent tangling. For these recordings, power analysis was performed to determine sample size required to detect significant differences with a power of β: 0.7 based on the observed differential signal in auditory and visual correct trials under baseline conditions. Analysis indicated that more than four independent samples would be required to detect a change in these differential responses.
Extended Data
Extended Data Figure 1. Cross-Modal Task Training and Performance Validation.
Quantification of performance across training stages for the cross-modal task. The trial sequence for each training stage is indicated on the left. Improved performance was observed in the last three days of training relative to the first three for each stage. Column 1 shows the reduction in the error fraction (n = 15 mice,* p < 0.05, Wilcoxon Rank-Sum Test), column 2 shows the number of consecutive correct responses (p values shown, KS-Test), column 3 shows the probability of correct response following a modality shift (* p<0.05, Wilcoxon Rank-Sum Test).
Extended Data Figure 2. Effects of cross-modal divided attention in the mouse.
Top: Single mouse examples of visual detection performance during cross-modal divided attention and reversal learning. Left: Comparison of performance under visual-only (black) and cross-modal (green) conditions. Although neither contained sensory conflict, the mere expectation of one increased detection threshold (≥124 trials per condition). Right: Detection threshold was not impacted by the presence of an auditory distractor during reversal learning (≥90 trials per condition). Bottom: Group data normalized to peak performance (lapse rate), showing that the effects of divided attention on detection threshold were persistent. Bootstrap estimation of visual detection threshold show a similar pattern as data in Figure 1 (error bars are 95% CI).
Extended Data Figure 3. Comparable performance on trial types and intact overall auditory performance despite auditory stimuli elimination on a subset of ‘attend to visual’ trials.
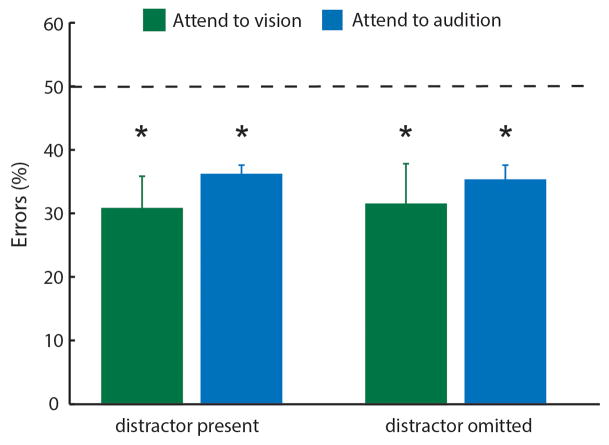
Left: Performance was comparable on auditory and maximum intensity visual trials (n = 4 mice, same as in Fig. 1d). Right: Mice exhibited comparable overall performance when auditory stimuli were eliminated from a subset of attend to visual trials.
Extended Data Figure 4. Region and timing specific effects of optogenetic manipulation on cross-modal task performance.
(a) Optogenetic disruption of auditory cortex during target stimulus anticipation disrupted performance specifically for auditory trials (n = 4 mice, ** p <0.01 Wilcoxson Rank-Sum Test). Disruption of anterior cingulate cortex (b) or lateral orbitofrontal cortex (c) in VGAT-ChR2 mice or following localized injection of ChR2 expressing virus did not affect performance (n = 4 mice, 2 VGAT-ChR2, 2 VGAT-cre, 4 sessions per manipulation) (d) In contrast, PL inactivation led to robust reduction in performance in both types of manipulations (n = 8 mice, 4 VGAT-ChR2 and 4 VGAT-cre, * p <0.05 Wilcoxson Rank-Sum Test). (e–h) Photobleaching experiment quantifying the spread of laser light. Example coronal section (e) showing GFP bleaching following two hour exposure to laser stimulation (6mW, 50Hz, 90% duty cycle). (f–h) Fluorescence intensity quantification shows that extent of light spread is limited to 300μm around the tip of the optic fiber (n = 3 mice).
Extended Data Figure 5. Independently adjustable, multi-electrode recording of visTRN neurons.
(a, b) Injection of retro-lenti-DIO-ChR2-EYFP into LGN labels visTRN neurons but not LGN interneurons. (a) Histological image is maximal projection of four 2μm confocal planes showing labelling of visTRN neurons (Inset: zoom in showing cell bodies). (b) Image as in (a), but from LGN of the same animal (Inset: zoom in showing terminals). (c) Schematic of independently adjustable multi-electrode drive. (d) Example activity recorded from different depths during adjustment. Distinct patterns of physiological activity are observed along the trajectory in the broadband LFP signal (0.1Hz–32KHz). (e) Highpass filtered signals (600Hz–10kHz) showing spiking activity with isolated, clustered units showing distinguishable waveform characteristics in distinct structures. (f) Example PETH of ChR2 mediated visTRN response to laser activation (top, 473 nM ~4mW stimulation, 20 ms) and to visual stimuli (bottom, 10 ms pulse).
Extended Data Figure 6. Distinct visTRN firing rate changes in natural errors compared to PFC disruption.
Scatter plots showing the change in absolute firing rate for visTRN neurons for correct (a) incorrect (b) or PFC disrupted trials (c). Insets show the cumulative probability plot of separation from the unity line (no change). While correct trials had a lower firing rate in ‘attend to vision’ than ‘attend to audition’ (n = 138, p < 0.001 Wilcoxon Sign-Rank Test) this pattern was reversed for incorrect trials (n = 138, p < 0.05, Wilcoxon Sign-Rank Test) suggesting that perhaps the animal was attending to the wrong modality. This reversal was not observed in trials with PFC disruption (despite mouse performance being at chance level).
Extended Data Figure 7. The impact of PFC disruption on visTRN activity is distinct from naturally-occurring errors.

(a) Scatter plots of visTRN neurons comparing their firing rate modulation (change from baseline) under the two distinct anticipatory conditions. Each sample is a single cell. Colors denote significance reached for each cell on a trial-by-trial basis (red, visual; blue, auditory; purple; both; rank-sum test comparison to baseline). Note that in correct performance (n = 138, 4 mice, p < 0.005, Wilcoxon Sign-Rank Test), ‘attend to vision’ resulted in a negative shift and ‘attend to audition’ resulted in a positive shift, consistent with examples shown in Fig. 3. During natural error trials, the modulation is partially reversed for both trial types, suggesting that at least a subset of errors are the result of attending to the wrong modality. On the other hand PFC disruption (n = 56 cells, 2 mice), results in weaker non-uniform effect (‘attend to visual trials’ are less impacted). (b) Quantification of effects seen in a.
Extended Data Figure 8. The magnitude of behavioral disruption co-varies with optogenetic manipulation strength of LGN/visTRN.
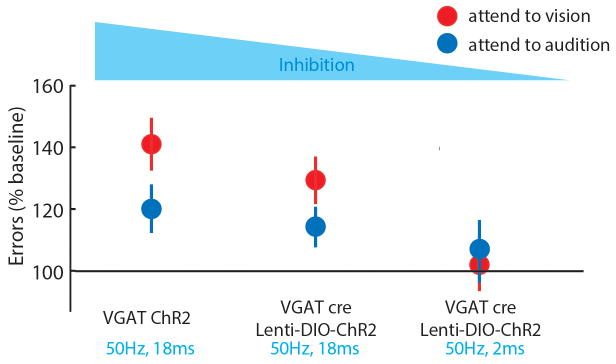
Activation of inhibitory terminals in LGN (Fig. 2), with 90% duty cycle resulted in maximal disruption of cross-modal performance. Activating visually labelled TRN with identical stimulation parameters resulted in a quantitatively lower behavioral impact. Reducing the duty cycle of visTRN stimulation to 10% resulted in no impact on accuracy, as previously shown4.
Extended Data Figure 9. LGN attentional modulation is not observed on error trials.
(a–b) No significant difference was observed in the average firing rate of LGN neurons during stimulus anticipation (p = 0.63, Wilcoxon Sign-Rank Test, n = 161 cells, 4 mice) or presentation (p =0.74, Wilcoxon Sign-Rank Test, n = 161) among trial types when behavioral outcomes were incorrect. C) Similar effects were observed for visual evoked potentials (VEPs; visual: 324, auditory: 302, n = 4 mice).
Extended Data Figure 10. Light-evoked fast chloride photometry transients measured in LGN are GABAa receptor dependent and sensitive to visTRN and PL inactivation in the cross-modal task.
(a) Peak superclomeleon FRET and YFP control responses to light stimuli (50ms, 0.1 Hz) delivered to the eye contralateral to the recorded LGN (n > 90 trials from 3 mice for superclomeleon and from 4 YFP mice, *** p<0.001, Friedman Test). (b) Chloride photometry transients are sensitive to GABAa receptor antagonist flumazenil in a dose-dependent manner. Left Injection of 15 mg/kg (i.p.) resulted in a 90% peak reduction of light evoked chloride photometry responses that recovered over the course of 90–100 min as predicted by flumazenil pharmacokinetics. Insets show example traces of single events recorded during baseline, peak suppression and recovery. Right Quantification of the maximal suppressive effects and recovery of 5 and 15 mg/kg flumazenil on chloride photometry responses (n > 90 trials from 3 mice, * p < 0.05, ** p < 0.01, Friedman Test). (c) Cumulative distributions of unitary visual evoked superchlomeleon FRET peaks in response to light stimuli in the cross-modal task. Under baseline conditions, ‘attend to audition’ trials exhibited significantly larger amplitudes than ‘attend to vision’ trials, consistent with average data in Fig 5f. Optogenetic silencing of visTRN eliminated the difference between trial types and resulted in peak amplitudes comparable to baseline ‘attend to vision’ trials (n = 3 mice, p < 0.005 for ‘attend to audition’ trials vs. all other trial types, Kolmogorov-Smirnov statistics with Bonferroni correction). (d) Combined optogenetic inactivation of different frontal cortical regions and chloride photometry in LGN while mice perform the cross-modal task. Only PL inactivation eliminates differential inhibition between visual and auditory trials (n = 6 mice, *** p<0.001, Wilcoxon Rank-Sum Test).
Supplementary Material
Acknowledgments
We thank J.A. Movshon, W. Ma, R.W. Tsien, G. Fishell and D. Rinberg for helpful comments on the manuscript and G.J. Augustine for providing us with the SuperClomeleon construct. The work was supported by the Swiss National Science Foundation (P2LAP3 151786) to R.D.W. and the Simons Foundation, the Sloan Foundation, the Brain and Behavior Research Foundation and the US National Institutes of Health (R00 NS078115) to M.M.H. M.M.H. is additionally supported by the Feldstein Medical Foundation, a Klingenstein-Simons Fellowship and a Biobehavioral Research Award for Innovative New Scientists (BRAINS) R01 (R01 MH107680) from the National Institute of Mental Health.
Footnotes
Supplementary Information is available in the online version of the paper
Competing financial interests
The authors declare no competing financial interests.
Author Contributions
M.M.H. conceived and designed all aspects of the study. R.D.W. devised the training paradigm for the cross-modal task and L.I.S. performed all programming associated. R.D.W. collected electrophysiological data. T.J.D. provided fiber photometry training, advice, and rig designs; LIS extended the method to FRET-based photometry, built the rig and collected data. R.D.W. analyzed behavioral data and L.I.S. analyzed psychophysical, electrophysiological and photometry data. M.N. generated the retro-grade lentiviruses in-house, performed SuperClomeleon cloning into AAV backbone and acquired confocal images. K.D. provided support for fiber photometry training. M.M.H. supervised the experiment, directed the analysis and wrote the paper. All authors read the final version of the manuscript.
References
- 1.Miller EK, Cohen JD. An integrative theory of prefrontal cortex function. Annu Rev Neurosci. 2001;24:167–202. doi: 10.1146/annurev.neuro.24.1.167. [DOI] [PubMed] [Google Scholar]
- 2.Buschman TJ, Miller EK. Top-down versus bottom-up control of attention in the prefrontal and posterior parietal cortices. Science. 2007;315:1860–2. doi: 10.1126/science.1138071. [DOI] [PubMed] [Google Scholar]
- 3.Fritz J, Shamma S, Elhilali M, Klein D. Rapid task-related plasticity of spectrotemporal receptive fields in primary auditory cortex. Nat Neurosci. 2003;6:1216–23. doi: 10.1038/nn1141. [DOI] [PubMed] [Google Scholar]
- 4.Rodgers CC, DeWeese MR. Neural correlates of task switching in prefrontal cortex and primary auditory cortex in a novel stimulus selection task for rodents. Neuron. 2014;82:1157–70. doi: 10.1016/j.neuron.2014.04.031. [DOI] [PubMed] [Google Scholar]
- 5.Zhang S, et al. Selective attention. Long-range and local circuits for top-down modulation of visual cortex processing. Science. 2014;345:660–5. doi: 10.1126/science.1254126. [DOI] [PMC free article] [PubMed] [Google Scholar]
- 6.Glickfeld LL, Histed MH, Maunsell JH. Mouse primary visual cortex is used to detect both orientation and contrast changes. J Neurosci. 2013;33:19416–22. doi: 10.1523/JNEUROSCI.3560-13.2013. [DOI] [PMC free article] [PubMed] [Google Scholar]
- 7.Hubel DH, Wiesel TN. Receptive fields, binocular interaction and functional architecture in the cat’s visual cortex. J Physiol. 1962;160:106–54. doi: 10.1113/jphysiol.1962.sp006837. [DOI] [PMC free article] [PubMed] [Google Scholar]
- 8.Newsome WT, Britten KH, Movshon JA. Neuronal correlates of a perceptual decision. Nature. 1989;341:52–4. doi: 10.1038/341052a0. [DOI] [PubMed] [Google Scholar]
- 9.Hoover WB, Vertes RP. Anatomical analysis of afferent projections to the medial prefrontal cortex in the rat. Brain Struct Funct. 2007;212:149–79. doi: 10.1007/s00429-007-0150-4. [DOI] [PubMed] [Google Scholar]
- 10.Vong L, et al. Leptin action on GABAergic neurons prevents obesity and reduces inhibitory tone to POMC neurons. Neuron. 2011;71:142–54. doi: 10.1016/j.neuron.2011.05.028. [DOI] [PMC free article] [PubMed] [Google Scholar]
- 11.Halassa MM, et al. Selective optical drive of thalamic reticular nucleus generates thalamic bursts and cortical spindles. Nat Neurosci. 2011;14:1118–20. doi: 10.1038/nn.2880. [DOI] [PMC free article] [PubMed] [Google Scholar]
- 12.Zhao S, et al. Cell type-specific channelrhodopsin-2 transgenic mice for optogenetic dissection of neural circuitry function. Nat Methods. 2011;8:745–52. doi: 10.1038/nmeth.1668. [DOI] [PMC free article] [PubMed] [Google Scholar]
- 13.Fritz JB, David SV, Radtke-Schuller S, Yin P, Shamma SA. Adaptive, behaviorally gated, persistent encoding of task-relevant auditory information in ferret frontal cortex. Nat Neurosci. 2010;13:1011–9. doi: 10.1038/nn.2598. [DOI] [PMC free article] [PubMed] [Google Scholar]
- 14.Letzkus JJ, et al. A disinhibitory microcircuit for associative fear learning in the auditory cortex. Nature. 2011;480:331–5. doi: 10.1038/nature10674. [DOI] [PubMed] [Google Scholar]
- 15.McAlonan K, Cavanaugh J, Wurtz RH. Guarding the gateway to cortex with attention in visual thalamus. Nature. 2008;456:391–4. doi: 10.1038/nature07382. [DOI] [PMC free article] [PubMed] [Google Scholar]
- 16.Purushothaman G, Marion R, Li K, Casagrande VA. Gating and control of primary visual cortex by pulvinar. Nat Neurosci. 2012;15:905–12. doi: 10.1038/nn.3106. [DOI] [PMC free article] [PubMed] [Google Scholar]
- 17.Saalmann YB, Pinsk MA, Wang L, Li X, Kastner S. The pulvinar regulates information transmission between cortical areas based on attention demands. Science. 2012;337:753–6. doi: 10.1126/science.1223082. [DOI] [PMC free article] [PubMed] [Google Scholar]
- 18.Pinault D. The thalamic reticular nucleus: structure, function and concept. Brain Res Brain Res Rev. 2004;46:1–31. doi: 10.1016/j.brainresrev.2004.04.008. [DOI] [PubMed] [Google Scholar]
- 19.Crick F. Function of the thalamic reticular complex: the searchlight hypothesis. Proc Natl Acad Sci U S A. 1984;81:4586–90. doi: 10.1073/pnas.81.14.4586. [DOI] [PMC free article] [PubMed] [Google Scholar]
- 20.Halassa MM, et al. State-dependent architecture of thalamic reticular subnetworks. Cell. 2014;158:808–21. doi: 10.1016/j.cell.2014.06.025. [DOI] [PMC free article] [PubMed] [Google Scholar]
- 21.O’Connor DH, Fukui MM, Pinsk MA, Kastner S. Attention modulates responses in the human lateral geniculate nucleus. Nat Neurosci. 2002;5:1203–9. doi: 10.1038/nn957. [DOI] [PubMed] [Google Scholar]
- 22.Chen C, Regehr WG. Presynaptic modulation of the retinogeniculate synapse. J Neurosci. 2003;23:3130–5. doi: 10.1523/JNEUROSCI.23-08-03130.2003. [DOI] [PMC free article] [PubMed] [Google Scholar]
- 23.Cox CL, Huguenard JR, Prince DA. Nucleus reticularis neurons mediate diverse inhibitory effects in thalamus. Proc Natl Acad Sci U S A. 1997;94:8854–9. doi: 10.1073/pnas.94.16.8854. [DOI] [PMC free article] [PubMed] [Google Scholar]
- 24.Gunaydin LA, et al. Natural neural projection dynamics underlying social behavior. Cell. 2014;157:1535–51. doi: 10.1016/j.cell.2014.05.017. [DOI] [PMC free article] [PubMed] [Google Scholar]
- 25.Grimley JS, et al. Visualization of synaptic inhibition with an optogenetic sensor developed by cell-free protein engineering automation. J Neurosci. 2013;33:16297–309. doi: 10.1523/JNEUROSCI.4616-11.2013. [DOI] [PMC free article] [PubMed] [Google Scholar]
- 26.Cremers T, Ebert B. Plasma and CNS concentrations of Gaboxadol in rats following subcutaneous administration. Eur J Pharmacol. 2007;562:47–52. doi: 10.1016/j.ejphar.2007.01.017. [DOI] [PubMed] [Google Scholar]
- 27.Casagrande VA, Sary G, Royal D, Ruiz O. On the impact of attention and motor planning on the lateral geniculate nucleus. Prog Brain Res. 2005;149:11–29. doi: 10.1016/S0079-6123(05)49002-0. [DOI] [PubMed] [Google Scholar]
- 28.Mitchell AS, et al. Advances in understanding mechanisms of thalamic relays in cognition and behavior. J Neurosci. 2014;34:15340–6. doi: 10.1523/JNEUROSCI.3289-14.2014. [DOI] [PMC free article] [PubMed] [Google Scholar]
- 29.Ress D, Heeger DJ. Neuronal correlates of perception in early visual cortex. Nat Neurosci. 2003;6:414–20. doi: 10.1038/nn1024. [DOI] [PMC free article] [PubMed] [Google Scholar]
- 30.Levitan CA, Ban YH, Stiles NR, Shimojo S. Rate perception adapts across the senses: evidence for a unified timing mechanism. Sci Rep. 2015;5:8857. doi: 10.1038/srep08857. [DOI] [PMC free article] [PubMed] [Google Scholar]
- 31.Mareschal I, Calder AJ, Dadds MR, Clifford CW. Gaze categorization under uncertainty: psychophysics and modeling. J Vis. 2013;13:18. doi: 10.1167/13.5.18. [DOI] [PubMed] [Google Scholar]
- 32.Franklin J. The elements of statistical learning: data mining, inference and prediction. Math Intell. 2008:83–85. [Google Scholar]
- 33.Wallace DJ, et al. Rats maintain an overhead binocular field at the expense of constant fusion. Nature. 2013;498:65–69. doi: 10.1038/nature12153. [DOI] [PubMed] [Google Scholar]
- 34.Brunetti PM, et al. Design and fabrication of ultralight weight, adjustable multi-electrode probes for electrophysiological recordings in mice. J Vis Exp. 2014:e51675. doi: 10.3791/51675. [DOI] [PMC free article] [PubMed] [Google Scholar]
- 35.Fries P, Neuenschwander S, Engel AK, Goebel R, Singer W. Rapid feature selective neuronal synchronization through correlated latency shifting. Nat Neurosci. 2001;4:194–200. doi: 10.1038/84032. [DOI] [PubMed] [Google Scholar]
- 36.Szucs A. Applications of the spike density function in analysis of neuronal firing patterns. J Neurosci Methods. 1998;81:159–67. doi: 10.1016/s0165-0270(98)00033-8. [DOI] [PubMed] [Google Scholar]
- 37.Piscopo DM, El-Danaf RN, Huberman AD, Niell CM. Diverse visual features encoded in mouse lateral geniculate nucleus. J Neurosci. 2013;33:4642–56. doi: 10.1523/JNEUROSCI.5187-12.2013. [DOI] [PMC free article] [PubMed] [Google Scholar]
- 38.de Araujo IE, et al. Neural ensemble coding of satiety states. Neuron. 2006;51:483–94. doi: 10.1016/j.neuron.2006.07.009. [DOI] [PubMed] [Google Scholar]
- 39.Ridder WH, 3rd, Nusinowitz S. The visual evoked potential in the mouse--origins and response characteristics. Vision Res. 2006;46:902–13. doi: 10.1016/j.visres.2005.09.006. [DOI] [PubMed] [Google Scholar]
- 40.Izaki Y, Fujiwara SE, Akema T. Rat prefrontal response and prestimulation local field potential power in vivo. Neuroreport. 2008;19:255–8. doi: 10.1097/WNR.0b013e3282f4cb3a. [DOI] [PubMed] [Google Scholar]
Associated Data
This section collects any data citations, data availability statements, or supplementary materials included in this article.


