

Abstract
Objective
Inflammatory mediators, such as PGE2 and IL-1β, are produced by osteoarthritic joint tissues, where they may contribute to disease pathogenesis. We examined whether inflammation, reflected in plasma and peripheral blood leukocytes (PBLs) reflected presence of osteoarthritis (OA), progression or symptoms in patients with symptomatic knee osteoarthritis (SKOA).
Methods
SKOA patients were enrolled in a 24-month prospective study of radiographic progression. Standardized knee radiographs were obtained at baseline and 24 months. Biomarkers assessed at baseline included plasma lipids PGE2 and 15-HETE, and transcriptome analysis of PBLs by microarray and qPCR.
Results
Baseline PGE synthases (PGES) by PBL microarray gene expression, and plasma PGE2 distinguished SKOA patients from non-OA controls (AUCs 0.87 and 0.89 respectively, p<0.0001). Baseline plasma 15-HETE was significantly elevated in SKOA versus non-OA controls (p<0.019). In the 146 patients who completed the 24-month study, elevated baseline expression of IL-1β, TNFα and COX-2 mRNA in PBLs predicted higher risk for radiographic progression by joint space narrowing (JSN). In a multivariate model, AUC point estimates of models containing COX-2 in combination with demographic traits overlap the confidence interval of the base model in two out of the three JSN outcome measures (JSN >0.0mm, >0.2mm and >0.5mm, AUC=0.62–0.67).
Conclusion
Inflammatory plasma lipid biomarkers PGE2 and 15-HETE identify patients with SKOA. PBL inflammatory transcriptome identifies a subset of SKOA patients at higher risk for radiographic progression. These findings may reflect low-grade inflammation in OA and may be useful as diagnostic and prognostic biomarkers in clinical development of disease-modifying OA drugs.
Keywords: interleukin, cyclooxygenase, prostaglandin, inflammation, joint space width, osteoarthritis
INTRODUCTION
Osteoarthritis (OA), a disease of the whole joint that affects cartilage, synovium, subchondral bone, menisci, muscle and ligaments, is the most common type of arthritis (1). A recent report from the Centers for Disease Control estimates that 52.5 million US adults had arthritis in 2010–2012, an increase from 2007–2009 (50 million); given its prevalence, OA likely accounts for at least half of this total. In addition, 22.7 million subjects (43.2% of adults with arthritis) reported activity limitations because of arthritis (2). While formerly considered a non-inflammatory joint disease, it now is well-appreciated that inflammatory mediators are produced by articular tissues in OA and have been implicated in its pathogenesis (3–5). Inflammatory cascades in OA joint tissues are driven by a variety of enzymes, prominently cyclooxygenase (COX), which catalyzes formation of prostaglandins from arachidonic acid. COX consists of at least two isoforms, constitutive (COX-1) and inducible (COX-2). In addition, two prostaglandin E2 (PGE2) synthases (constitutive PGES and inducible-membrane PGES) convert prostaglandin H2 (PGH2) into PGE2. We and others have shown that cartilage, synovium and infrapatellar fat pads from OA patients produce elevated levels of PGE2 and other inflammatory mediators in ex vivo cultures (5,6). Indeed, cytokines, nerve growth factor, chemokines and prostaglandins produced by joint tissues promote pain and cartilage degeneration, while synovitis has been associated with cartilage loss in patients with knee OA (7,8).
Currently, the US Food and Drug Administration considers slowing of joint space narrowing (JSN) as an outcome for trials of disease-modifying OA drugs (DMOADs), but to date no drugs are approved for this indication in the US or Europe. Radiographic changes occur well after histological and biochemical changes in joint tissues (9). Thus, future development of DMOADs would be facilitated by validated prognostic biomarkers that identify subsets of patients at risk for progressive disease. Additionally, early diagnosis of OA, ideally at a time that allows effective intervention and before radiographic damage has occurred, will require improved diagnostic imaging and biochemical markers.
We have previously reported, in a prospective study of patients with SKOA, that transcriptome profiling of circulating PBL could identify patients at risk for disease progression (4). In the current study, we expand those findings to show in three different populations that transcriptome analysis of PBLs identifies a subset of SKOA patients with elevation of IL-1β, TNFα and/or COX-2 who are at increased risk for radiographic progression at 24 months. Moreover, in a multivariate model, age/gender/body mass index (BMI) only did not predict progression, whereas addition of PBL expression data of two genes improved prediction of progression. Finally, our data show that plasma levels of PGE2 and 15-hydroxyeicosatetraenoic acid (15-HETE) are elevated in SKOA patients relative to non-OA controls. Thus, low-grade chronic inflammation in OA joint tissues is reflected systemically and can have both diagnostic and prognostic value.
PATIENTS AND METHODS
Three independent cohorts of SKOA patients were studied
NYUHJD Learning Cohort
Forty-four individuals with SKOA and 25 non-OA control subjects were enrolled in a cross-sectional study. Knee OA was diagnosed by referring physicians according to 1986 American College of Rheumatology (ACR) classification criteria (10), and patients met clinical and either radiographic (11) or laboratory criteria for diagnosis of idiopathic knee OA. This cohort was used as a discovery cohort for microarray gene expression studies. The preliminary observation of the association of OA with PBL inflammatory gene expression was published, as were patient characteristics and detailed inclusion/exclusion criteria (4).
NYUHJD Progression Cohort
As part of an NIH-funded study, an independent cohort of 181 patients with SKOA was assessed at baseline and enrolled in a 24-month prospective study. These individuals met ACR clinical symptomatic criteria (10,11). All patients underwent bilateral standardized weight-bearing fixed-flexion posteroanterior (PA) knee radiographs using the SynaFlexer™ X-ray positioning frame (Synarc). We also screened 41 age-matched healthy controls and enrolled 21 subjects who had KL score <1 and no pain in either knee. All patients were examined by one of two NYUHJD investigators (SK,JS) every 6 months during this study; 146 patients completed the 24-month observation period. Radiographic assessments at baseline and 24 months included bilateral (signal and non-signal knee) KL grade and medial joint space width (JSW), measured at the mid-portion of the joint space via electronic calipers by two musculoskeletal radiologists blinded to patient information. Disagreements between the two readers were resolved by consensus. Cohen’s kappa coefficients for inter-rater agreement for KL scores of right and left knees were 0.85 and 0.77, respectively, and >0.85 for most other radiographic outcome measures. Concordance correlation coefficients were >0.90 for JSW measurements. We collected heparinized plasma and RNA from PBLs from each subject (SKOA and non-OA) at baseline.
Pfizer Cohort
The Pfizer Cohort included 78 Caucasian subjects, 66 with OA and 12 non-OA controls. Mean(SD) age in the OA group was 61.2(8.7) years; 64% were female. In the non-OA control group, mean(SD) age was 58.8(2.9) years; 66% were female. The OA cases were derived from three Pfizer-sponsored studies in the US and UK, with radiologically confirmed painful knee OA. The non-OA control cohort (recruited from a single Canadian site) included subjects who were 55 years old or older, with no clinical signs or symptoms of OA. NSAID treatment in OA patients and controls was discontinued one week prior to plasma PGE2 determination. The study design has been described elsewhere in detail (12).
Laboratory Methods
Sample collection
Blood samples from NYUHJD cohorts were collected in serum collection tubes for serum and heparinized pyrogen-free tubes (BD Biosciences) for isolation of PBLs [as described previously (4)]. Blood was processed within 30–60 min of collection. Plasma samples were aliquoted and stored at −70°C until tested.
Whole blood incubation system
To determine whether PBLs from SKOA patients, which exhibit up-regulation of mPGES, were “primed” to produce PGE2, we measured production of PGE2 by whole blood cultured (24 h) ex vivo without any stimulus. Briefly, 1-milliliter blood samples were collected in heparinized pyrogen-free glass tubes, diluted 1:1 with PBS, and incubated for 24h in CO2 incubator as described (13). Samples were centrifuged at 3,500 rpm at 4°C, and clear plasma stored at −70°C until tested.
PGE2 measurements
Plasma samples from the two NYUHJD cohorts (Learning and Progression) were analyzed for PGE2 by the ACE EIA kit (Cayman Chemical Company). For the Pfizer cohort as well as subset of NYUHJD progression cohort and non-OA controls, plasma PGE2 and 15-HETE levels were measured using a two-dimensional liquid chromatography tandem mass spectrometry (LC-MS/MS) (Agilent Technologies) interfaced to API 4000 Qtrap mass spectrometer (MDS-Sciex) operated in the multiple-reaction monitoring mode. Plasma proteins were precipitated with 70% acetonitrile in the presence of deuterium-labeled PGE2 and 15-HETE internal standards; supernatants were analyzed for levels of PGE2 and 15-HETE. Selected analytes were specifically detected by monitoring retention times and ion pairs corresponding to parent and specific fragment ion mass-to-charge ratios.
Urinary type II collagen neoepitope (uTIINE) peptide measurements
For the Pfizer cohort, urinary levels of type II collagen neoepitope peptides were measured by LC-MS/MS assay in positive ion mode using multiple reactions monitoring on triple quadrupole mass spectrometer (14,15). Briefly, the assay measures urinary levels of a specific 45-amino-acid-long peptide with 5 hydroxylations on proline residues, a neoepitope peptide that has been shown, both in vitro and ex vivo, to be produced by MMPs.
Total RNA isolation
Total RNA was purified from PBLs by the QIAGEN RNeasy kit, aliquoted and stored at –70°C (4). Quality of RNA was assessed by reading of optical density at 260 and 280 nm.
Real Time PCR (qPCR)
Total RNA (1 μg) was primed with oligo(dT) 18 primers and cDNA synthesized using the cDNA synthesis kit (Clontech). Predesigned TaqMan primer sets (Applied Biosystems) were used and PCR reactions performed as described (4).
Labeling and hybridization of microarray
Five micrograms of total RNA were used for first-strand synthesis using a T7-(dT)24 oligomer. Complementary RNA was synthesized (Affymetrix) and purified using the QIAGEN RNeasy kit, fragmented at 95ºC for 35 min for target preparation, and hybridized on HG-U133A-1.0 human microarray (Affymetrix).
Normalization of microarray data
Microarray data were normalized using the Robust Multi-array Average (RMA) method (16,17).
Statistical Methods
We assessed associations and discrimination/predictive power of single biomarkers with outcomes of interest (OA incidence, KL severity, JSN) using the following statistical tools:
Analysis of partial correlations (adjusted for age, gender and BMI) of biomarkers with continuous outcome variables (e.g., JSN).
Assessing predictivity of biomarkers for dichotomized outcome variables (e.g., KL 1/2 vs. KL 3/4) with the area under receiver operating characteristic curve (AUC) and logistic regression (either unadjusted or adjusted for age, gender and BMI). The AUC (also known as c-statistic) (18) is independent of the prevalence of the positive class and therefore well-suited to case-control designs. To derive confidence intervals around AUC estimates and assess statistical significance under the null hypothesis (i.e., no predictive signal), we used DeLong’s non-parametric test (19).
Comparing the means of a continuous outcome variable (e.g., JSN) for groups of patients defined based on biomarker values using Student’s two-tailed t-test.
Statistical significance was assessed at 5% alpha level with correction for multiple comparisons using the approach of Benjamini and Hochberg (20).
For the JSN outcome variable, we defined non-progressors as having JSN≤0.0mm/24 months, and three subgroups of progressors with JSN >0.0, >0.2, and >0.5mm/24 months. We selected these JSN thresholds based on Emrani et al (21) and recommendations of The European Society for Clinical and Economic Aspects of Osteoporosis and Osteoarthritis (ESCEO) (22).
For building predictive multivariate models of a dichotomized outcome variable based on multiple biomarkers, we used support vector machines (23). The null model against which all other predictive models are compared and p-values are calculated is the random model (i.e., coin-flipping model). The random model has AUC of 0.5. For estimating future predictivity of multivariate predictive models, we used 10-fold stratified cross-validation repeated with 100 different splits of data into 10-folds (24,25). We used this model to further investigate the prognostic value of plasma biomarker PGE2 and PBL gene expression, with age, gender and BMI for predicting JSN. We did not use 15-HETE in this analysis because data were only available for 43 subjects.
We developed the following models for each predictive task based on:
only age, gender and BMI;
age/gender/BMI and PBL COX-2 gene expression;
age/gender/BMI and PBL IL-1β gene expression;
age/gender/BMI and PBL TNFα gene expression;
age/gender/BMI and 2 PBL (COX-2 and IL-1β);
age/gender/BMI and 2 PBL (COX-2 and TNFα);
age/gender/BMI and 2 PBL (IL-1β and TNFα);
age/gender/BMI and 3 PBL (COX-2, IL-1β, TNFα);
age/gender/BMI, 3 PBL (COX-2, IL-1β, TNFα), and plasma PGE2.
This multivariate method can fit both simple and complex functions, avoids overfitting by using effective regularization strategies, and has shown excellent empirical performance in a wide range of biomedical predictive modeling applications (26,27). This protocol provides unbiased estimates of predictivity, and has low variance as a result of using 100 different splits into 10-folds (25). We used Matlab libSVM (http://www.csie.ntu.edu.tw/~cjlin/libsvm/) implementation of SVMs, and R implementation of GLM. All other codes were custom-written and executed in Matlab.
RESULTS
NYUHJD Learning Cohort
Approximately 25% of participants were male, and 72% were non-Hispanic. Mean(SD) age of patients in the OA group was 65.7(10.7) years, 70% were female, and mean(SD) BMI was 27.4(4.0) kg/m2. In the non-OA control group, mean(SD) age was 54.6(9.5), 73% were female, and mean(SD) BMI was 24.9(3.9) kg/m2 (Supplemental Table 1).
NYUHJD SKOA Progression Cohort
Baseline demographic and clinical characteristics, and differences in these parameters between SKOA and control subjects, are shown in Supplemental Table 1. Mean(SD) age of patients in the OA group was 62.5(10.5) years, 64.5% were female, and mean(SD) BMI was 26.7(3.5) kg/m2. Mean total WOMAC (range 1–300) and VAS pain (range 1–100) scores were 114.6(67.8) and 43.6(28.6), respectively. In the control group, mean age was 56.2(8.8), 43% were female and mean BMI was 27.1(3.1) kg/m2.
Plasma PGE2 and 15-HETE levels are elevated in SKOA in three independent cohorts
We determined baseline plasma PGE2 levels in SKOA and control subjects from the NYUHJD Learning and Progression cohorts. As shown in Figure 1A-B, SKOA patients from both cohorts had significantly higher PGE2 levels [1.45-fold (p=0.0038) and 1.65-fold (p<0.0001), respectively] than non-OA controls. Not surprisingly, among SKOA patients in the Progression cohort, plasma PGE2 levels were lower in NSAID users (128.94 vs.160.67 pg/ml; p=0.044) than non-users. Elevations of plasma PGE2 (p<0.001) were also found in the separate Pfizer cohort of SKOA patients (Figure 1C) and distinguished SKOA cases from non-OA controls with 0.99 AUC (95% CI: 0.89–1.00; p<0.0001). Figure 1D also illustrates that plasma elevations of PGE2, along with age, gender and BMI, distinguished NYUHJD progression cohort SKOA cases from non-OA controls with 0.89 AUC (95% CI: 0.83–0.97; p<0.0001).
Figure 1.
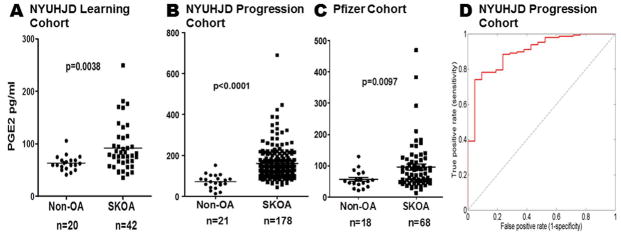
Baseline plasma PGE2 is elevated in NYUHJD learning, NYUHJD progression and Pfizer cohorts. Plasma levels of PGE2 were determined using ACE EIA kit as described in Methods. The NYUHJD learning cohort (A) consists of symptomatic knee osteoarthritis (SKOA) cases (n=42) and non-OA controls (n=20); the NYUHJD progression cohort (B, D) consists of SKOA cases (n=178) and non-OA controls (n=21). A) Mean PGE2 levels in the learning cohort were 91.8±44.9 pg/ml (range: 35.4–249.1) in SKOA and 63.2±14.22 (41.2–105.8) in controls. B) Mean PGE2 levels in the progression cohort were 159.0±83.8 (43.7–690.2) in SKOA and 72.4±33.5 (13.53–152.1) in controls. The solid horizontal bar in each group represents the mean. Non-parametric, Mann-Whitney test was performed to calculate statistical significance using GraphPad Prism 4.0. The p values for cases versus controls are shown for each biomarker. C) Baseline plasma PGE2 in Pfizer validation cohort consists of SKOA cases (n=66) and non-OA controls (n=12). D) ROC curve of NYUHJD progression cohort baseline plasma PGE2 for distinguishing NYUHJD progression cohort SKOA cases from non-OA controls with age, gender and BMI. The curve line depicts AUC in the 10-fold cross-validation repeated 100 times.
As shown in Figure 2A–B, another lipid molecule, 15-HETE, was significantly higher (p=0.0195 and p<0.0001) in plasma of SKOA cases than non-OA controls in both NYUHJD Progression and Pfizer cohorts. In the Pfizer cohort, as expected, urinary type II collagen neoepitope (uTIINE), measured as a positive control, was increased in SKOA (p<0.0001) (Figure 2C). Both 15-HETE and uTIINE distinguished Pfizer SKOA cases from non-OA controls, with 0.95 AUC (95% CI: 0.89–1.00; p<0.0001) and 0.85 AUC (95% CI: 0.72–0.98; p<0.0001), respectively. Significantly elevated PGE2 and 15-HETE (p=0.0097 and p=0.0195, respectively) in NYUHJD Progression SKOA cases versus non-OA controls were also confirmed by LC-MS/MS (data not shown).
Figure 2.
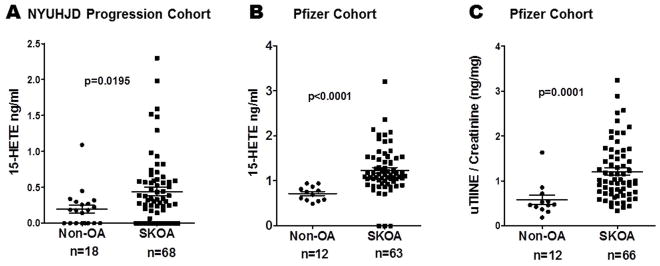
Baseline plasma 15-hydroxyeicosatetraenoic acid (15-HETE) is elevated in NYUHJD progression (A) and Pfizer validation cohorts (B). C) Baseline urinary type II collagen neoepitope (uTIINE) is elevated in Pfizer validation cohort [LC-MS/MS (Liquid Chromatography-Tandem Mass Spectrometry)]. The solid horizontal bar in each group represents the mean value. Non-parametric, Mann-Whitney test was performed to calculate statistical significance using GraphPad Prism 4.0. The p values for cases versus controls are shown for each biomarker.
Mean (±SD) 15-HETE (ng/ml) levels in NYUHJD progression SKOA cases were 0.44±0.48 (0.0–2.3) and in controls and 0.22±0.26 (0.0–1.1), respectively. Mean (±SD) 15-HETE (ng/ml) levels in Pfizer SKOA cases were 1.3±0.45 (0.71–3.2), and in controls 0.72±0.16 (0.49–0.94), respectively.
Elevated expression of prostaglandin E synthase (PGES) mRNA in PBLs from SKOA patients
Our previous studies using an Affymetrix array gene expression platform showed that COX-2 was differentially expressed in PBLs from a subset of OA patients in our NYUHJD learning cohort (4). We next explored, in the NYU learning cohort, microarray data for expression of PGES terminal enzymes in PGE2 synthesis. We examined membrane and cytosolic PGES (mPGES and cPGES, respectively) for expression and predictive utility to differentiate SKOA cases from non-OA controls using a multivariate predictive modeling methodology. As shown in Figure 3A, unsupervised hierarchical clustering of probe sets representing mPGES (probe set 207388_s_at, 210367_s_at, 218083_at) and cPGES (200627_at) distinguished SKOA cases from non-OA controls. The same probe sets distinguished NYUHJD learning cohort SKOA cases from controls along with age/gender/BMI with 0.87 AUC (95% CI: 0.78–0.95, p<0.0001) as estimated by 10-fold cross-validation protocol repeated 100 times (25). Among these four probe sets, the mPGES isoform 1 probe set 207388_s_at alone and with age/gender/BMI distinguished SKOA cases from non-OA controls with 0.82 AUC (95% CI: 0.71–0.94; p<0.0001) and 0.86 AUC (95% CI: 0.77–0.94; p<0.0001), respectively (Figure 3B).
Figure 3.
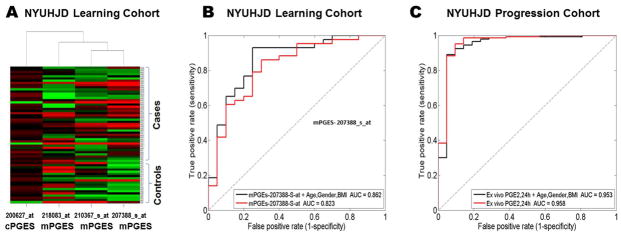
Prostaglandin E synthase mRNA is elevated in SKOA patients. A) Hierarchical clustering of NYUHJD learning cohort SKOA cases and non-OA controls based on prostaglandin E synthase U133A probe sets. B) Receiver operating characteristic (ROC) curve of membrane PGE synthase (Affymetrix U133A array probe sets (207388_s_at, 200627_at, 210367_s_at, 218083_at) for distinguishing NYUHJD Learning cohort SKOA cases from non-OA controls with and without age, gender and BMI. The curve line depicts the AUC in the 10-fold cross validation repeated 100 times. The dotted line represents the ROC curve of null model AUC (0.5). C) ROC curve of plasma PGE2 levels from ex vivo blood PBL cultures distinguishing NYUHJD progression cohort SKOA cases from non-OA controls with and without age, gender and BMI. The curve line depicts AUC in the 10-fold cross validation repeated 100 times.
Elevated expression of PGES is associated with increased PGE2 production in vitro. At 24h, PGE2 levels (121.7±46.73 pg/ml) did not change significantly in controls, but increased 3.5-fold over baseline in SKOA patients (430.2±211.4), indicating that the elevated expression of COX-2/mPGES mRNA was reflected in increased lipid product (PGE2) generation (p<0.0001). Similar to baseline plasma PGE2 levels (Figure 1A-B), PGE2 levels produced by PBLs following ex vivo culture (24h) also significantly distinguished SKOA patients from non-OA controls with 0.96 AUC (95% CI: 0.89–1.0; p<0.0001; Figure 3C).
Joint space narrowing (JSN) in NYUHJD SKOA completers
In our completer cohort (n=146), the mean JSN was 0.32 mm over 24 months. This rate of progression for the entire cohort of 0.16 mm/year is consistent with findings reviewed by Emrani et al (21). Out of 146 completers, 18 patients with predominantly lateral compartment disease and 17 with JSW 0mm at baseline were excluded. Lateral compartment OA differs from medial compartment OA with respect to risk factors for disease severity and progression (28). Therefore, in order to reduce heterogeneity of the SKOA population, we performed analyses restricted to patients with medial compartment disease (n=111). Of this subgroup of completers, 35% showed no JSN and were designated as “non-progressors”; 58% exhibited JSN ≥0.2mm/24 months; 40% exhibited JSN ≥0.5 mm/24 months, and were designated as “fast progressors.”
PBL IL-1β, TNFα and COX2 expression define SKOA patient subgroups with radiographic progression
We previously reported, in a smaller number of SKOA subjects (n=78), that increased PBL expression of IL-1β was associated with increased JSN at 24 months (4). These 78 subjects from the previous study are a subgroup of NYUHJD progression cohort (n=146 completers), and include the 18 subjects with lateral compartment OA disease excluded from certain analyses, as noted above. In the expanded NYUHJD progression cohort we performed our analysis with all 146 SKOA patients (gene expression data were available for 144) who had completed 24-month trials, and defined radiographic progression as change in radiographic JSW (JSN) over 24 months. As shown in Supplemental Table 2, we dichotomized SKOA patients based on median expression levels of IL-1β, TNFα and COX-2 determined by qPCR. Patients who expressed these inflammatory genes above median levels, labeled as OAIL-1β, OATNFα and OACOX-2, had more rapid radiographic progression (mean JSN >0.5 mm/24 months) than patients with median levels or lower.
We also examined SKOA patients with predominant medial compartment disease. As shown in Table 1, these SKOA patients with PBL inflammatory phenotype (OAIL-1, OATNFα or OACOX-2) had more rapid radiographic progression than patients whose PBL inflammatory gene expression was below the median. Statistical significance was achieved for all three genes. Furthermore, increased levels of IL-1β, TNFα, and COX-2 identified “fast progressors” (mean JSN 0=0.71, 0.75 and 0.71 mm/24 months, respectively, for each group), as opposed to “slow progressors” (mean JSN range 0.29–0.34 mm/24 months) (Table 1, Supplemental Table 2). Additionally, in a cross-sectional analysis of 178 patients studied at baseline, patients with elevated IL-1β mRNA levels (>2-fold) had significantly higher WOMAC and VAS pain scores (Supplemental Table 3).
Table 1.
Association of PBL transcriptome IL-1β, TNFα and COX-2 (relative gene expression levels were dichotomized by median), with joint space narrowing (JSN) at 24 months in 109 patients with symptomatic knee osteoarthritis in the medial compartment for whom gene expression data were available.
| IL-1β (PBL mRNA) | TNFα (PBL mRNA) | COX-2 (PBL mRNA) | |||||||
|---|---|---|---|---|---|---|---|---|---|
| OAIL-1 (n=54) | OAnl (n=55) | p value | OATNFα (n=54) | OAnl (n=55) | p value | OACOX-2 (n=54) | OAnl (n=55) | p value | |
|
Baseline Medial knee JSW (mm) |
3.85 (1.39) | 3.46 (1.29) | 0.131 | 3.60 (1.28) | 3.70 (1.45) | 0.706 | 3.76 (1.43) | 3.55 (1.27) | 0.418 |
|
24 month Medial knee JSW (mm) |
3.14 (1.58) | 3.12 (1.49) | 0.933 | 2.85 (1.58) | 3.41 (1.43) | 0.057 | 3.05 (1.57) | 3.21 (1.49) | 0.571 |
| JSN (mm) | 0.71 (0.93) | 0.34 (0.82) | 0.032 | 0.75 (1.03) | 0.30 (0.67) | 0.007 | 0.71 (0.90) | 0.34 (0.86) | 0.027 |
Biomarkers were dichotomized based on median levels to define two groups of subjects (e.g., with biomarker above vs. at or below the threshold); mean JSN values were compared in the two subject groups using a two-sample t-test. Of the 111 completers, gene expression data were available for 109 subjects.
Association of single biomarker(s) with JSN
We performed Fisher’s partial correlation analyses of biomarkers with JSN, adjusted for age, gender and BMI. Among lipid markers, 15-HETE was significantly correlated with JSN (r=0.374; p=0.022); among PBL transcriptome markers, PBL COX-2 levels were significantly correlated (r=0.214; p=0.029) (Supplemental Table 4).
As shown in Table 2, PBL COX-2 levels significantly predicted SKOA in all three progression groups with AUC=0.68–0.71 (p=0.001). However, PBL IL-1β significantly predicted only fast progressors (AUC=0.67; p=0.015) and approached significance in slow progressors. PBL TNFα and plasma PGE2 and 15-HETE did not significantly predict progressors in this analysis. Only PBL COX-2 expression significantly distinguished all groups of progressors from non-progressors independently of age, gender, BMI and KL score (Table 2), by both ROC and LR analysis. PBL IL-1β approached statistical significance in predicting fast progressors after adjustment for age, gender, and BMI (Table 2).
Table 2.
Relationship of plasma lipids (PGE2 and 15-HETE) and PBL inflammatory gene transcriptome biomarkers with JSN at 24 months in patients with symptomatic knee osteoarthritis (SKOA).
| Area under ROC (AUC) | Logistic Regression | |||||
|---|---|---|---|---|---|---|
| AUC | P value | P value adj. | (no adjust.) | Age, Gender, BMI | Age, Gender, BMI, KL | |
| JSN>0mm(N=72 vs. 39) | ||||||
| 15-HETE | 0.412 | 0.180 | 0.325 | 0.293 | 0.348 | 0.311 |
| PGE-2 | 0.490 | 0.435 | 0.461 | 0.774 | 0.618 | 0.909 |
| PBL IL-1β expression | 0.622 | 0.016 | 0.073 | 0.144 | 0.142 | 0.186 |
| PBL TNF-α expression | 0.579 | 0.096 | 0.212 | 0.436 | 0.396 | 0.338 |
| PBL COX-2 expression | 0.699 | 0.0001 | 0.0015 | 0.0005 | 0.0003 | 0.0002 |
| Age | 0.487 | 0.395 | 0.461 | |||
| Gender | 0.480 | 0.358 | 0.461 | |||
| BMI | 0.527 | 0.285 | 0.405 | |||
| KL | 0.585 | 0.066 | 0.161 | |||
| JSN>0.2mm (N=64 vs. 39) | ||||||
| 15-HETE | 0.410 | 0.177 | 0.325 | 0.311 | 0.339 | 0.306 |
| PGE-2 | 0.494 | 0.461 | 0.461 | 0.609 | 0.499 | 0.878 |
| PBL IL-1β expression | 0.609 | 0.032 | 0.123 | 0.135 | 0.124 | 0.181 |
| PBL TNF-α expression | 0.579 | 0.102 | 0.212 | 0.392 | 0.345 | 0.257 |
| PBL COX-2 expression | 0.681 | 0.0004 | 0.0035 | 0.0011 | 0.0007 | 0.0003 |
| Age | 0.509 | 0.429 | 0.461 | |||
| Gender | 0.481 | 0.368 | 0.461 | |||
| BMI | 0.534 | 0.243 | 0.364 | |||
| KL | 0.623 | 0.015 | 0.073 | |||
| JSN>0.5mm (N=44 vs. 39) | ||||||
| 15-HETE | 0.334 | 0.052 | 0.141 | 0.068 | 0.060 | 0.065 |
| PGE-2 | 0.492 | 0.453 | 0.461 | 0.535 | 0.436 | 0.684 |
| PBL IL-1β expression | 0.672 | 0.003 | 0.017 | 0.077 | 0.072 | 0.118 |
| PBL TNF-α expression | 0.611 | 0.045 | 0.141 | 0.449 | 0.378 | 0.284 |
| PBL COX-2 expression | 0.712 | 0.0001 | 0.0015 | 0.0005 | 0.0004 | 0.0003 |
| Age | 0.539 | 0.240 | 0.364 | |||
| Gender | 0.486 | 0.416 | 0.461 | |||
| BMI | 0.539 | 0.228 | 0.364 | |||
| KL | 0.604 | 0.050 | 0.141 | |||
For measuring a biomarker’s predictivity for radiographic progression in medial knee OA, we used the area under the receiver operating characteristic (ROC) curve. Generalized Linear Model (GLM) -based (logistic regression) p-values are provided after adjusting individually and in combination for three covariates: age, gender and body mass index (BMI) and KL score.
15-HETE data were available only for N=43 SKOA subjects. JSN=joint space narrowing; AUC=area under ROC curve.
Association of multiple markers with JSN
In these models, demographic traits and clinical characteristics alone did not predict progression. It is important to note that AUC point estimates of models containing COX-2 in combination with demographic traits and clinical characteristics overlap the confidence interval of the base model in 2 out of the 3 JSN outcome measures (Table 3) as estimated by 10-fold cross-validation protocol repeated 100 times (25).
Table 3.
Relationship of plasma lipid (PGE2), PBL inflammatory gene transcriptome and demographic traits with radiographic joint space narrowing (JSN) over 24 months in a multivariate analysis.
| Combined Predictors | AUC Estimate | AUC 95% Confidence Interval | p value | p value adjusted | ||
|---|---|---|---|---|---|---|
| JSN>0mm vs. JSN≤ 0mm (N=72 vs.39) | Age, Gender, BMI | 0.5 | 0.39 | 0.62 | 0.473 | 0.473 |
| Age, Gender, BMI, COX-2 | 0.65 | 0.55 | 0.76 | 0.002 | 0.017 | |
| Age, Gender, BMI, IL-1β | 0.51 | 0.39 | 0.62 | 0.446 | 0.464 | |
| Age, Gender, BMI, TNFα | 0.44 | 0.33 | 0.55 | 0.153 | 0.229 | |
| Age, Gender, BMI, COX-2, IL-1β | 0.65 | 0.54 | 0.76 | 0.005 | 0.022 | |
| Age, Gender, BMI, COX-2, TNFα | 0.61 | 0.5 | 0.72 | 0.027 | 0.072 | |
| Age, Gender, BMI, IL-1β, TNFα | 0.46 | 0.35 | 0.58 | 0.272 | 0.295 | |
| Age, Gender, BMI, COX-2, IL-1β, TNFα | 0.61 | 0.5 | 0.72 | 0.030 | 0.072 | |
| Age, Gender, BMI, COX-2, IL-1β, TNFα, PGE2 | 0.59 | 0.48 | 0.7 | 0.062 | 0.107 | |
| JSN>0.2mm vs. JSN≤ 0mm (N=64 vs. 39) | Age, Gender, BMI | 0.57 | 0.46 | 0.68 | 0.094 | 0.149 |
| Age, Gender, BMI, COX-2 | 0.67 | 0.56 | 0.78 | 0.002 | 0.017 | |
| Age, Gender, BMI, IL-1β | 0.6 | 0.48 | 0.71 | 0.047 | 0.089 | |
| Age, Gender, BMI, TNFα | 0.54 | 0.42 | 0.65 | 0.257 | 0.295 | |
| Age, Gender, BMI, COX-2, IL-1β | 0.67 | 0.56 | 0.77 | 0.001 | 0.017 | |
| Age, Gender, BMI, COX-2, TNFα | 0.65 | 0.55 | 0.76 | 0.003 | 0.017 | |
| Age, Gender, BMI, IL-1β, TNFα | 0.56 | 0.44 | 0.67 | 0.174 | 0.246 | |
| Age, Gender, BMI, COX-2, IL-1β, TNFα | 0.66 | 0.54 | 0.77 | 0.003 | 0.018 | |
| Age, Gender, BMI, COX-2, IL-1β, TNFα, PGE2 | 0.63 | 0.52 | 0.74 | 0.008 | 0.032 | |
| JSN>0.5mm vs. JSN≤ 0mm (N=44 vs. 39) | Age, Gender, BMI | 0.55 | 0.43 | 0.68 | 0.211 | 0.262 |
| Age, Gender, BMI, COX-2 | 0.62 | 0.49 | 0.74 | 0.032 | 0.072 | |
| Age, Gender, BMI, IL-1β | 0.56 | 0.43 | 0.68 | 0.182 | 0.246 | |
| Age, Gender, BMI, TNFα | 0.54 | 0.41 | 0.67 | 0.273 | 0.295 | |
| Age, Gender, BMI, COX-2, IL-1β | 0.64 | 0.52 | 0.76 | 0.012 | 0.041 | |
| Age, Gender, BMI, COX-2, TNFα | 0.61 | 0.48 | 0.73 | 0.048 | 0.089 | |
| Age, Gender, BMI, IL-1β, TNFα | 0.55 | 0.42 | 0.68 | 0.2136 | 0.2621 | |
| Age, Gender, BMI, COX-2, IL-1β, TNFα | 0.63 | 0.51 | 0.75 | 0.02 | 0.06 | |
| Age, Gender, BMI, COX-2, IL-1β, TNFα, PGE2 | 0.61 | 0.48 | 0.73 | 0.0496 | 0.0893 | |
For measuring a biomarker’s predictivity for radiographic progression in medial knee OA based on threshold of JSN progression (>0.0, >0.2 and >0.5 mm/24 months) as outcomes, we used the ROC curve with multivariate predictive model support vector machines. The null model against which all other predictive models are compared and p-values are calculated is the random model (i.e., coin-flipping model). The random model has AUC of 0.5.
DISCUSSION
In the present study, we examined patients with SKOA for evidence of inflammation as reflected by plasma levels of inflammatory mediators PGE2 and 15-HETE, and PBL expression of COX-2 and inflammatory cytokines IL-1β and TNFα. Elevated levels of PGE2 and 15-HETE were associated with incidence of SKOA, and PBL expression of the cytokines was associated with radiographic JSN over 24 months. Furthermore, we validated previous findings that patients with elevated PBL expression of IL-1β (OAIL-1 subclass) exhibit increased risk of radiographic progression (4). Based on the recently proposed BIPED system for classification of biomarkers in OA (29), we identified candidate diagnostic and prognostic biomarkers of OA.
The diagnostic plasma biomarkers that statistically differentiate OA patients from controls are the lipid mediators PGE2 and 15-HETE. Plasma PGE2 levels were 2-fold higher in SKOA patients versus non-OA controls in both NYUHJD (AUC 0.89; p<0.0001) and Pfizer cohorts (AUC 0.99; p<0.0001). Thus, eicosanoids of both the cyclooxygenase and lipoxygenase pathways are produced in sufficient quantities by joint tissues to be reflected in plasma in patients with SKOA. PGE2 plays a role in cartilage degeneration and/or synovial tissue inflammation in OA (30–34). High expression of COX-2 and its product PGE2 (a mediator of inflammation and pain in OA) has been reported in joint tissues such as cartilage, synovium and infrapatellar fat pads in OA (5,6). Inhibitors of cyclooxygenases provide anti-inflammatory/analgesic effects (35) and are routinely used for symptomatic treatment in OA. Chondrocytes and synovium also produce 15-HETE (36,37), which has both pro- and anti-inflammatory properties in various tissues (38,39).
Our data also indicate that a PBL inflammatory transcriptome identifies a subset of SKOA patients at higher risk for radiographic disease progression, and may therefore serve as a prognostic biomarker. Similarly, two other studies have also reported elevated expression of IL-1β and TNFα in PBLs of OA patients (40,41). SKOA patients with the inflammatory PBL transcriptome not only experienced more rapid progression of OA, but also exhibited more pain at presentation. Based on these findings, we speculate that PBLs are activated by exposure to inflammatory stimuli via repeated circulation through diseased synovium and subchondral bone of affected joints. This concept is consistent with the notion that OA is characterized by a state of chronic low-grade inflammation, wherein joint tissues are the site of production of cytokines, eicosanoids and activated complement components capable of stimulating PBLs that traverse these tissues (42). Hirohata et al (43) have shown increased expression of IL-6 and TNFα mRNAs by CD34+ hematopoietic precursors in bone marrow of both OA and RA patients relative to normal controls. Stannus et al (44) have reported that circulating levels of IL-6 and TNFα are associated with cartilage loss in OA. This finding raises the intriguing possibility that the activated PBLs observed in our studies originate from a pool of activated precursor cells in the bone marrow of SKOA joints.
Histologic analysis of synovial biopsies, as well as both contrast and non-contrast MRI imaging of knee joints, have shown that mild-to-moderate synovial inflammation is associated with increased likelihood of severe OA (3,7,45,46). Two independent groups have reported high levels of inflammatory cytokines in OA synovial fluid and plasma samples (42,47). High levels of inflammatory markers have been found systemically (blood cells) and locally (cartilage and synovium) in both murine and canine models of spontaneous OA (48,49). Additionally, synovial fluid IL-1β and IL-18 are associated with OA severity and progression (50). We (VBK) recently identified elevated levels of inflammatory synovial and plasma soluble macrophage markers (CD163 and CD14) associated with an inflammatory subset of knee OA patients with a worse prognosis (51).
OA is a disease of the joint that affects multiple tissues. Therefore, it is unlikely that a single biomarker could offer a broad description of this complex disease. A novel finding of our studies is that combinations of clinical and biological markers enhance the predictive capacity of individual biomarkers. Using a multivariate model, we show that the combination of demographic traits and clinical characteristics with PBL COX-2 gene expression, alone or in combination with IL-1β, predicts progressive radiographic JSN better than any individual biomarker. In the current study, associations of biomarkers with radiographic progression were revealed by different analytic approaches that included: 1) dichotomization of biomarkers at median level, and 2) threshold of radiographic progression by JSN.
Our studies do not show an independent effect of BMI on radiographic progression of SKOA. While a number publications have shown association of BMI with symptoms and incidence of OA, the literature is mixed regarding a clear association of BMI with OA progression (52–55). In our population with medial disease, only 17 patients had BMI >31, which may have attenuated the effects of obesity. Also, our study did not include assessment of alignment, which has been associated with progression linked to obesity. An interesting recent article by Wu et al (56) indicates that the relationship between BMI and progression may depend on genotype. In this study, consistent with the NYUHJD cohort, the rate of progression was not significantly higher in subjects with BMI greater than median (28.5 kg/m2) compared to those below the median. However, there was an interaction between IL1RN gene variations and BMI, such that BMI association with progression was only evident in subjects who carried the TGC haplotype (56). Recently, we (VBK) have reported that while BMI and WOMAC pain were diagnostically associated with OA, neither was prognostic (57).
In conclusion, our results indicate that increased plasma levels of the inflammatory biomarkers PGE2 and 15-HETE, as well as PBL transcriptome analyses, hold promise as early diagnostic and prognostic tests for OA. Furthermore, inflammatory biomarkers can be used to identify subgroups among subjects with clinical knee OA in whom the disease progresses at different rates. This can facilitate our understanding of OA pathogenesis and allow us to differentiate disease phenotypes within a heterogeneous knee OA population. A subgroup of OA with chronic, low-grade inflammation could be targeted for therapeutic interventions. Inflammatory biomarkers may be useful in the future to stratify the patients and develop personalized care for OA. Our longitudinal clinical study of OA indicates that biochemical biomarkers show significant promise with regard to prediction of radiographic JSN at 24 months. Finally, to advance success in treating and managing OA, efforts are needed to establish the temporal relationship between changes in inflammatory biomarkers or imaging and the progression of disease. Larger, longitudinally-followed and well-defined patient cohorts are necessary to validate our multivariate biomarker algorithm for prognostic use and to help screen appropriate participants for clinical trials of symptom- or disease-modifying agents.
Supplementary Material
Acknowledgments
This work was supported in part by research grants from the National Institute of Arthritis and Musculoskeletal and Skin Diseases (AR052873 to Dr. Abramson), National Center for Research Resources (1UL1 RR029893 to Dr. Aliferis), and National Library of Medicine (R01 LM011179-01A1 to Dr. Statnikov) of the U.S. National Institutes of Health. A provisional patent application has been filed for the use of inflammatory biomarkers in OA diagnosis and prognosis by Drs. Abramson and Attur. Drs. Friese and Hellio Le Graverand-Gastineau are employees of Pfizer WRD, Biotherapeutics PharmSci, St. Louis, MO 63017.
Footnotes
AUTHOR CONTRIBUTIONS
All authors were involved in drafting the article or revising it critically for important intellectual content, and all authors approved the final version to be published. Dr. Attur had full access to all of the data in the study, and takes responsibility for the integrity of the data and accuracy of the data analysis.
Study conception and design. Attur, Statnikov, Aliferis, Abramson.
Acquisition of data. Attur, Krasnokutsky, Statnikov, Samuels, Li, Friese, Hellio Le Graverand-Gastineau, Rybak, Aliferis, Abramson.
Analysis and interpretation of data. Attur, Krasnokutsky, Statnikov, Samuels, Kraus, Jordan, Aliferis, Abramson.
ADDITIONAL DISCLOSURES
Based on these studies, a provisional patent application has been filed for the use of inflammatory biomarkers in OA diagnosis and prognosis by Drs. Steven B. Abramson and Mukundan Attur. Dr. Olga Friese and Marie-Pierre Hellio Le Graverand-Gastineau are employees of Pfizer WRD, Biotherapeutics PharmSci, St. Louis, MO 63017.
References
- 1.Lotz M, Martel-Pelletier J, Christiansen C, Brandi ML, Bruyere O, Chapurlat R, et al. Value of biomarkers in osteoarthritis: current status and perspectives. Ann Rheum Dis. 2013;72:1756–63. doi: 10.1136/annrheumdis-2013-203726. [DOI] [PMC free article] [PubMed] [Google Scholar]
- 2.Prevalence of doctor-diagnosed arthritis and arthritis-attributable activity limitation--United States, 2010–2012. MMWR Morb Mortal Wkly Rep. 2013;62:869–73. [PMC free article] [PubMed] [Google Scholar]
- 3.Abramson SB, Attur M, Yazici Y. Prospects for disease modification in osteoarthritis. Nat Clin Pract Rheumatol. 2006;2:304–12. doi: 10.1038/ncprheum0193. [DOI] [PubMed] [Google Scholar]
- 4.Attur M, Belitskaya-Levy I, Oh C, Krasnokutsky S, Greenberg J, Samuels J, et al. Increased interleukin-1beta gene expression in peripheral blood leukocytes is associated with increased pain and predicts risk for progression of symptomatic knee osteoarthritis. Arthritis Rheum. 2011;63:1908–17. doi: 10.1002/art.30360. [DOI] [PMC free article] [PubMed] [Google Scholar]
- 5.Berenbaum F. Osteoarthritis as an inflammatory disease (osteoarthritis is not osteoarthrosis!) Osteoarthritis Cartilage. 2013;21:16–21. doi: 10.1016/j.joca.2012.11.012. [DOI] [PubMed] [Google Scholar]
- 6.Amin AR, Attur M, Patel RN, Thakker GD, Marshall PJ, Rediske J, et al. Superinduction of cyclooxygenase-2 activity in human osteoarthritis-affected cartilage. Influence of nitric oxide. J Clin Invest. 1997;99:1231–7. doi: 10.1172/JCI119280. [DOI] [PMC free article] [PubMed] [Google Scholar]
- 7.Krasnokutsky S, Belitskaya-Levy I, Bencardino J, Samuels J, Attur M, Regatte R, et al. Quantitative magnetic resonance imaging evidence of synovial proliferation is associated with radiographic severity of knee osteoarthritis. Arthritis Rheum. 2011;63:2983–91. doi: 10.1002/art.30471. [DOI] [PMC free article] [PubMed] [Google Scholar]
- 8.Guermazi A, Hayashi D, Roemer FW, Zhu Y, Niu J, Crema MD, et al. Synovitis in knee osteoarthritis assessed by contrast-enhanced magnetic resonance imaging (MRI) is associated with radiographic tibiofemoral osteoarthritis and MRI-detected widespread cartilage damage: the MOST study. J Rheumatol. 2014;41:501–8. doi: 10.3899/jrheum.130541. [DOI] [PMC free article] [PubMed] [Google Scholar]
- 9.Amin S, LaValley MP, Guermazi A, Grigoryan M, Hunter DJ, Clancy M, et al. The relationship between cartilage loss on magnetic resonance imaging and radiographic progression in men and women with knee osteoarthritis. Arthritis Rheum. 2005;52:3152–9. doi: 10.1002/art.21296. [DOI] [PubMed] [Google Scholar]
- 10.Altman R, Asch E, Bloch D, Bole G, Borenstein D, Brandt K, et al. Development of criteria for the classification and reporting of osteoarthritis. Classification of osteoarthritis of the knee. Diagnostic and Therapeutic Criteria Committee of the American Rheumatism Association. Arthritis Rheum. 1986;29:1039–49. doi: 10.1002/art.1780290816. [DOI] [PubMed] [Google Scholar]
- 11.Kellgren JH, Lawrence JS. Radiological assessment of osteo-arthrosis. Ann Rheum Dis. 1957;16:494–502. doi: 10.1136/ard.16.4.494. [DOI] [PMC free article] [PubMed] [Google Scholar]
- 12.Malfait AM, Seymour AB, Gao F, Tortorella MD, Le Graverand-Gastineau MP, Wood LS, et al. A role for PACE4 in osteoarthritis pain: evidence from human genetic association and null mutant phenotype. Ann Rheum Dis. 2012;71:1042–8. doi: 10.1136/annrheumdis-2011-200300. [DOI] [PMC free article] [PubMed] [Google Scholar]
- 13.Goekoop RJ, Kloppenburg M, Kroon HM, Frolich M, Huizinga TW, Westendorp RG, et al. Low innate production of interleukin-1beta and interleukin-6 is associated with the absence of osteoarthritis in old age. Osteoarthritis Cartilage. 2010;18:942–7. doi: 10.1016/j.joca.2010.03.016. [DOI] [PubMed] [Google Scholar]
- 14.Nemirovskiy OV, Dufield DR, Sunyer T, Aggarwal P, Welsch DJ, Mathews WR. Discovery and development of a type II collagen neoepitope (TIINE) biomarker for matrix metalloproteinase activity: from in vitro to in vivo. Anal Biochem. 2007;361:93–101. doi: 10.1016/j.ab.2006.10.034. [DOI] [PubMed] [Google Scholar]
- 15.Li WW, Nemirovskiy O, Fountain S, Rodney MW, Szekely-Klepser G. Clinical validation of an immunoaffinity LC-MS/MS assay for the quantification of a collagen type II neoepitope peptide: A biomarker of matrix metalloproteinase activity and osteoarthritis in human urine. Anal Biochem. 2007;369:41–53. doi: 10.1016/j.ab.2007.05.002. [DOI] [PubMed] [Google Scholar]
- 16.Irizarry RA, Hobbs B, Collin F, Beazer-Barclay YD, Antonellis KJ, Scherf U, et al. Exploration, normalization, and summaries of high density oligonucleotide array probe level data. Biostatistics. 2003;4:249–64. doi: 10.1093/biostatistics/4.2.249. [DOI] [PubMed] [Google Scholar]
- 17.Irizarry RA, Wu Z, Jaffee HA. Comparison of Affymetrix GeneChip expression measures. Bioinformatics. 2006;22:789–94. doi: 10.1093/bioinformatics/btk046. [DOI] [PubMed] [Google Scholar]
- 18.Fawcett T. An introduction to ROC analysis. Pattern Recognition Letters. 2006;27:861–74. [Google Scholar]
- 19.DeLong ER, DeLong DM, Clarke-Pearson DL. Comparing the areas under two or more correlated receiver operating characteristic curves: a nonparametric approach. Biometrics. 1988;44:837–45. [PubMed] [Google Scholar]
- 20.Benjamini Y, Hochberg Y. Controlling the False Discovery Rate: A practical and powerful approach to multiple testing. J Royal Stat Society Series B. 1995;57:289–300. [Google Scholar]
- 21.Emrani PS, Katz JN, Kessler CL, Reichmann WM, Wright EA, McAlindon TE, et al. Joint space narrowing and Kellgren-Lawrence progression in knee osteoarthritis: an analytic literature synthesis. Osteoarthritis Cartilage. 2008;16:873–82. doi: 10.1016/j.joca.2007.12.004. [DOI] [PMC free article] [PubMed] [Google Scholar]
- 22.Cooper C, Adachi JD, Bardin T, Berenbaum F, Flamion B, Jonsson H, et al. How to define responders in osteoarthritis. Curr Med Res Opin. 2013;29:719–29. doi: 10.1185/03007995.2013.792793. [DOI] [PMC free article] [PubMed] [Google Scholar]
- 23.Vapnik VN. Statistical learning theory. New York: Wiley; 1998. [Google Scholar]
- 24.Statnikov A, Tsamardinos I, Dosbayev Y, Aliferis CF. GEMS: a system for automated cancer diagnosis and biomarker discovery from microarray gene expression data. Int J Med Inform. 2005;74:491–503. doi: 10.1016/j.ijmedinf.2005.05.002. [DOI] [PubMed] [Google Scholar]
- 25.Braga-Neto UM, Dougherty ER. Is cross-validation valid for small-sample microarray classification? Bioinformatics. 2004;20:374–80. doi: 10.1093/bioinformatics/btg419. [DOI] [PubMed] [Google Scholar]
- 26.Statnikov A, Aliferis CF, Hardin DP, Guyon I. A Gentle Introduction to Support Vector Machines in Biomedicine, Volume 1: Theory and Methods. Singapore: World Scientific Publishing; 2011. [Google Scholar]
- 27.Statnikov A, Aliferis CF, Hardin DP, Guyon I. A Gentle Introduction to Support Vector Machines in Biomedicine, Volume 2: Case Studies and Benchmarks. Singapore: World Scientific Publishing; 2013. [Google Scholar]
- 28.Hunter DJ, Niu J, Felson DT, Harvey WF, Gross KD, McCree P, et al. Knee alignment does not predict incident osteoarthritis: the Framingham osteoarthritis study. Arthritis Rheum. 2007;56:1212–8. doi: 10.1002/art.22508. [DOI] [PubMed] [Google Scholar]
- 29.Bauer DC, Hunter DJ, Abramson SB, Attur M, Corr M, Felson D, et al. Classification of osteoarthritis biomarkers: a proposed approach. Osteoarthritis Cartilage. 2006;14:723–7. doi: 10.1016/j.joca.2006.04.001. [DOI] [PubMed] [Google Scholar]
- 30.Alstergren P, Kopp S. Prostaglandin E2 in temporomandibular joint synovial fluid and its relation to pain and inflammatory disorders. J Oral Maxillofac Surg. 2000;58:180–6. doi: 10.1016/s0278-2391(00)90335-5. [DOI] [PubMed] [Google Scholar]
- 31.Morton AJ, Campbell NB, Gayle JM, Redding WR, Blikslager AT. Preferential and non-selective cyclooxygenase inhibitors reduce inflammation during lipopolysaccharide-induced synovitis. Res Vet Sci. 2005;78:189–92. doi: 10.1016/j.rvsc.2004.07.006. [DOI] [PubMed] [Google Scholar]
- 32.Attur M, Al-Mussawir HE, Patel J, Kitay A, Dave M, Palmer G, et al. Prostaglandin E2 exerts catabolic effects in osteoarthritis cartilage: evidence for signaling via the EP4 receptor. J Immunol. 2008;181:5082–8. doi: 10.4049/jimmunol.181.7.5082. [DOI] [PubMed] [Google Scholar]
- 33.de Boer TN, Huisman AM, Polak AA, Niehoff AG, van Rinsum AC, Saris D, et al. The chondroprotective effect of selective COX-2 inhibition in osteoarthritis: ex vivo evaluation of human cartilage tissue after in vivo treatment. Osteoarthritis Cartilage. 2009;17:482–8. doi: 10.1016/j.joca.2008.09.002. [DOI] [PubMed] [Google Scholar]
- 34.Gosset M, Pigenet A, Salvat C, Berenbaum F, Jacques C. Inhibition of matrix metalloproteinase-3 and -13 synthesis induced by IL-1beta in chondrocytes from mice lacking microsomal prostaglandin E synthase-1. J Immunol. 2010;185:6244–52. doi: 10.4049/jimmunol.0903315. [DOI] [PubMed] [Google Scholar]
- 35.Crofford LJ, Lipsky PE, Brooks P, Abramson SB, Simon LS, van de Putte LB. Basic biology and clinical application of specific cyclooxygenase-2 inhibitors. Arthritis Rheum. 2000;43:4–13. doi: 10.1002/1529-0131(200001)43:1<4::AID-ANR2>3.0.CO;2-V. [DOI] [PubMed] [Google Scholar]
- 36.Amat M, Diaz C, Vila L. Leukotriene A4 hydrolase and leukotriene C4 synthase activities in human chondrocytes: transcellular biosynthesis of Leukotrienes during granulocyte-chondrocyte interaction. Arthritis Rheum. 1998;41:1645–51. doi: 10.1002/1529-0131(199809)41:9<1645::AID-ART16>3.0.CO;2-Z. [DOI] [PubMed] [Google Scholar]
- 37.Gheorghe KR, Korotkova M, Catrina AI, Backman L, af K E, Claesson HE, et al. Expression of 5-lipoxygenase and 15-lipoxygenase in rheumatoid arthritis synovium and effects of intraarticular glucocorticoids. Arthritis Res Ther. 2009;11:R83. doi: 10.1186/ar2717. [DOI] [PMC free article] [PubMed] [Google Scholar]
- 38.Burhop KE, Selig WM, Malik AB. Monohydroxyeicosatetraenoic acids (5-HETE and 15-HETE) induce pulmonary vasoconstriction and edema. Circ Res. 1988;62:687–98. doi: 10.1161/01.res.62.4.687. [DOI] [PubMed] [Google Scholar]
- 39.Kronke G, Katzenbeisser J, Uderhardt S, Zaiss MM, Scholtysek C, Schabbauer G, et al. 12/15-lipoxygenase counteracts inflammation and tissue damage in arthritis. J Immunol. 2009;183:3383–9. doi: 10.4049/jimmunol.0900327. [DOI] [PubMed] [Google Scholar]
- 40.Tchetina EV, Poole AR, Zaitseva EM, Sharapova EP, Kashevarova NG, Taskina EA, et al. Differences in Mammalian target of rapamycin gene expression in the peripheral blood and articular cartilages of osteoarthritic patients and disease activity. Arthritis. 2013;2013:461486. doi: 10.1155/2013/461486. [DOI] [PMC free article] [PubMed] [Google Scholar]
- 41.Ramos YF, Bos SD, Lakenberg N, Bohringer S, den Hollander WJ, Kloppenburg M, et al. Genes expressed in blood link osteoarthritis with apoptotic pathways. Ann Rheum Dis. 2014;73:1844–53. doi: 10.1136/annrheumdis-2013-203405. [DOI] [PubMed] [Google Scholar]
- 42.Sohn DH, Sokolove J, Sharpe O, Erhart JC, Chandra PE, Lahey LJ, et al. Plasma proteins present in osteoarthritic synovial fluid can stimulate cytokine production via Toll-like receptor 4. Arthritis Res Ther. 2012;14:R7. doi: 10.1186/ar3555. [DOI] [PMC free article] [PubMed] [Google Scholar]
- 43.Hirohata S, Yanagida T, Tomita T, Yoshikawa H. Enhanced expression of mRNA for interleukin 6 and tumor necrosis factor-alpha in CD34+ cells of the bone marrow in osteoarthritis. [abstract #1771] Arthritis Rheum. 2011;63(Suppl):S694. [Google Scholar]
- 44.Stannus O, Jones G, Cicuttini F, Parameswaran V, Quinn S, Burgess J, et al. Circulating levels of IL-6 and TNF-alpha are associated with knee radiographic osteoarthritis and knee cartilage loss in older adults. Osteoarthritis Cartilage. 2010;18:1441–7. doi: 10.1016/j.joca.2010.08.016. [DOI] [PubMed] [Google Scholar]
- 45.Benito MJ, Veale DJ, FitzGerald O, van den Berg WB, Bresnihan B. Synovial tissue inflammation in early and late osteoarthritis. Ann Rheum Dis. 2005;64:1263–7. doi: 10.1136/ard.2004.025270. [DOI] [PMC free article] [PubMed] [Google Scholar]
- 46.Pessler F, Dai L, Diaz-Torne C, Gomez-Vaquero C, Paessler ME, Zheng DH, et al. The synovitis of “non-inflammatory” orthopaedic arthropathies: a quantitative histological and immunohistochemical analysis. Ann Rheum Dis. 2008;67:1184–7. doi: 10.1136/ard.2008.087775. [DOI] [PubMed] [Google Scholar]
- 47.Honsawek S, Yuktanandana P, Tanavalee A, Chirathaworn C, Anomasiri W, Udomsinprasert W, et al. Plasma and synovial fluid connective tissue growth factor levels are correlated with disease severity in patients with knee osteoarthritis. Biomarkers. 2012;17:303–8. doi: 10.3109/1354750X.2012.666676. [DOI] [PubMed] [Google Scholar]
- 48.Kyostio-Moore S, Nambiar B, Hutto E, Ewing PJ, Piraino S, Berthelette P, et al. STR/ort mice, a model for spontaneous osteoarthritis, exhibit elevated levels of both local and systemic inflammatory markers. Comp Med. 2011;61:346–55. [PMC free article] [PubMed] [Google Scholar]
- 49.Colitti M, Gaspardo B, Della PA, Scaini C, Stefanon B. Transcriptome modification of white blood cells after dietary administration of curcumin and non-steroidal anti-inflammatory drug in osteoarthritic affected dogs. Vet Immunol Immunopathol. 2012;147:136–46. doi: 10.1016/j.vetimm.2012.04.001. [DOI] [PubMed] [Google Scholar]
- 50.Denoble AE, Huffman KM, Stabler TV, Kelly SJ, Hershfield MS, McDaniel GE, et al. Uric acid is a danger signal of increasing risk for osteoarthritis through inflammasome activation. Proc Natl Acad Sci U S A. 2011;108:2088–93. doi: 10.1073/pnas.1012743108. [DOI] [PMC free article] [PubMed] [Google Scholar]
- 51.Daghestani HN, Pieper CF, Kraus VB. Soluble macrophage biomarkers indicate inflammatory phenotypes in patients with knee osteoarthritis. Arthritis Rheumatol. 2015;67(4):956–65. doi: 10.1002/art.39006. [DOI] [PMC free article] [PubMed] [Google Scholar]
- 52.Zhou ZY, Liu YK, Chen HL, Liu F. Body mass index and knee osteoarthritis risk: a dose-response meta-analysis. Obesity (Silver Spring) 2014 Oct;22(10):2180–5. doi: 10.1002/oby.20835. [DOI] [PubMed] [Google Scholar]
- 53.Le Graverand MP, Brandt K, Mazzuca SA, Raunig D, Vignon E. Progressive increase in body mass index is not associated with a progressive increase in joint space narrowing in obese women with osteoarthritis of the knee. Ann Rheum Dis. 2009 Nov;68(11):1734–8. doi: 10.1136/ard.2007.085530. [DOI] [PubMed] [Google Scholar]
- 54.Niu J, Zhang YQ, Torner J, Nevitt M, Lewis CE, Aliabadi P, et al. Is obesity a risk factor for progressive radiographic knee osteoarthritis? Arthritis Rheum. 2009 Mar 15;61(3):329–35. doi: 10.1002/art.24337. [DOI] [PMC free article] [PubMed] [Google Scholar]
- 55.Yusuf E, Bijsterbosch J, Slagboom PE, Rosendaal FR, Huizinga TW, Kloppenburg M. Body mass index and alignment and their interaction as risk factors for progression of knees with radiographic signs of osteoarthritis. Osteoarthritis Cartilage. 2011 Sep;19(9):1117–22. doi: 10.1016/j.joca.2011.06.001. [DOI] [PubMed] [Google Scholar]
- 56.Wu X, Kondragunta V, Kornman KS, Wang HY, Duff GW, Renner JB, Jordan JM. IL-1 receptor antagonist gene as a predictive biomarker of progression of knee osteoarthritis in a population cohort. Osteoarthritis Cartilage. 2013;21:930–8. doi: 10.1016/j.joca.2013.04.003. [DOI] [PMC free article] [PubMed] [Google Scholar]
- 57.Karsdal MA, Bihlet A, Byrjalsen I, Alexandersen P, Ladel C, Michaels M, Andersen JR, Riis BJ, Kraus V, Bay-Jensen AC, Christiansen C. OA phenotypes, rather than disease stage, drive structural progression - identification of structural progressors from 2 phase III randomized clinical studies with symptomatic Knee OA. Osteoarthritis Cartilage. 2015;23(4):532–43. doi: 10.1016/j.joca.2014.12.024. [DOI] [PubMed] [Google Scholar]
Associated Data
This section collects any data citations, data availability statements, or supplementary materials included in this article.