

Abstract
Methionine synthase reductase (MTRR) is involved in the DNA synthesis and production of S-adenosylmethionine (SAM) and plays an important role in the carcinogenesis. However, the role of MTRR in the resistance of ovarian cancer (OC) to chemotherapy has yet to be elucidated. In order to investigate the clinical significance of MTRR in OC, MTRR expression was reduced by using the RNA interference technique, and therefore, and the tumor growth and cisplatin-resistance were evaluated in vitro and in vivo. Results showed MTRR expression increased orderly from normal tissues, benign ovarian tumor to OC tissue. MTRR over-expression in OC tissue was correlated with pathologic type (P=0.005), grade (P=0.037), FIGO stage (P=0.001), organ metastasis (P=0.009) and platinum resistance (P=0.038). MTRR silencing inhibited cell proliferation, cisplatin resistance and autophagy, and induced apoptosis of OC cells. In addition, MTRR silencing also affected the caspase expression as well as mTOR signaling pathway. Further, the tumor volume in MTRR-suppressed SKOV3/DDP mice treated with cisplatin significantly decreased when compared with controls (P<0.05). In summary, MTRR expression, which is increased in human OC, is related to the differentiation and cisplatin resistance of OC cells. MTRR silencing inhibits cell growth and cisplatin resistance by regulating caspase expression and mTOR signaling pathway in OC cells. It is suggested that MTRR may be a potential target for the therapy of OC.
Keywords: Methionine synthase reductase, ovarian cancer, cisplatin-resistance, apoptosis, autophagy
Introduction
Ovarian cancer (OC) is one of the most devastating gynecological cancers. Advanced OC is associated with a mortality of 60% in humans and with a five-year survival below 30% [1]. Platinum-based chemotherapy is the standard first-line treatment for stage IV OC. However, the 5-year survival rate of OC women is still 20% to 40%, and most patients may develop relapse within 18-28 months [2]. The drug resistance is still challenging in the treatment of OC [3]. Therefore, it is imperative to develop new drugs or strategies for the therapy of OC.
Methylation is able to control gene expression, stabilize chromatin structure and contribute to genomic stability. DNA methylation, the most widely studied epigenetic abnormality, is a key process mediating the silencing of gene transcription and carcinogenesis. Hypermethylation may silence the tumor suppressor genes at the their promoter in carcinogenesis and cancer progression [4]. In OC, the DNA methylation of several genes including HSulf-1 [5], ABCG2 [6] and EZH2 [7] has been found to be associated with drug resistance. Apoptosis in cisplatin-induced cell death is related to the expression of death-inducing genes and downregulation of ‘survival’ genes [8]. Autophagy has both pro-survival and pro-death activities. A variety of signaling pathways including epigenetic control phenomena have been implicated in the regulation of autophagy [9]. Overall, epigenetic silencing of critical genes by DNA methylation has been found to regulate the apoptosis and autophagy during carcinogenesis.
Methionine synthase reductase (MTRR) is an enzyme controlling the activity of MTR in the folate metabolism by transferring the methyl group of methyltetrahydrofolate to homocysteine via the methionine synthase. Methylcobalamin is an intermediate methyl carrier and essential for DNA methylation [10,11]. The missense mutation of MTRR gene, A66G (rs1801394), is one of the most widely investigated single-nucleotide polymorphisms (SNPs) and may result in the substitution of isoleucine with methionine at codon 22 [12]. MTRR gene polymorphisms are related to the development of breast cancer [13], head and neck cancer [14] and acute lymphoblastic leukemia [15]. To date, no studies have been conducted to evaluate the role of MTRR expression in OC, particularly with respect to its resistance to chemotherapy. In this study, we hypothesized that MTRR expression in OC tissue was correlated with some clinicopathological features and survival of OC patients, and MTRR silencing was able to suppress cell growth, platinum resistance and autophagy, and induce apoptosis of OC cells via modulating the caspase family members and mTOR signaling pathway.
Materials and methods
Clinical samples and follow-up
OC tissues and normal ovary tissues were collected from patients who were treated in the Department of Gynecologic Oncology of the Affiliated Tumor Hospital of Guangxi Medical University between 2004 and 2010. All the patients were pathologically diagnosed with OC. Pathological stage and histological subtype were determined according to the International Federation of Gynecology and Obstetrics (FIGO) criteria, and the World Health Organization criteria. Clinical and pathological data was collected from the medical records including age, surgical stage, metastasis, ascites, tumor grade and subtype, and drug resistance. Samples were collected from 80 cases of primary OC, 50 cases of benign ovarian tumors, and 30 normal ovarian tissues. The median age was 41.1 years (range: 13-76 years) in OC group; 40.1 years (range: 10-74 years) in benign ovarian tumor group; and 43.1 years (range: 29-60 years) in normal ovary group. The 80 OC patients underwent surgical intervention for OC of whom 61 patients with epithelial ovarian cancer received chemotherapy with cisplatin plus paclitaxel and 19 patients with non-epithelial ovarian cancer were treated with cisplatin, bleomycin and vincristine. The study was approved by the Ethics Committee of Guangxi Medical University. Written informed consent was obtained from all the subjects before study.
Immunohistochemistry
Paraffin-embedded sections (5-μm) of ovarian tissues were obtained, deparaffinized and rehydrated through a graded ethanol series. Antigen retrieval was done in 10 mM citrate buffer (pH 6.0) at 120°C for 2 min. The sections were allowed to cool to 30°C and washed with phosphate-buffered saline (PBS, pH 7.3). After inactivating the endogenous peroxidase with 3% H2O2 for 10 min and washing with PBS, sections were incubated at 4°C overnight with MTRR polyclonal antibody (1:100; sc-48889, Santa Cruz Biotechnology) in PBS and then washed with PBS. Sections were stained with an ultrasensitive streptavidin-peroxidase kit (MaiXin.Bio, Kit 9719, Fuzhou, China) and visualization was performed with 3, 3’-diaminobenzidine (DAB). Nuclei were stained with Harris Hematoxylin (Sairuida.Bio, Tianjin, China). In negative control, the primary antibody was replaced with PBS. A colon cancer sample was used as a positive control. Positive cells had brown granules in the cytoplasm. The MTRR positive cancer cells were semi-quantitatively determined based on the staining intensity and percentage of positive cells. Sections were scored based on the chromatic intensity: 0, no pigmentation; 1, light yellow; 2, buff; 3, brown. Five fields were randomly selected from each section, and the mean percentage of positive cells was determined: 0, <5%; 1, 5%-25%; 2, 26%-50%; 3, 51%-75%; 4, d>75%. The immunohistochemical scores were multiplied by the intensity score and percentage of positive cells: 0-2, (-); 3-4, (+); 5-8, (++); 9-12, (+++). The sections were independently assessed by two observers.
Cell lines and animals
SKOV3 cells and SKOV3/DDP OC cells were maintained in our lab [16]. SKOV3 cells, SKOV3/DDP cells and 293T cells were grown in DMEM (Invitrogen-Gibco, Carlsbad, CA) containing 2 mM L-glutamine, 10% fetal bovine serum (FBS; Invitrogen-Gibco, Carlsbad, CA) and penicillin/streptomycin (Sunshine Biotechnology, Nanjing, China) in a humidified environment with 5% CO2 at 37°C. BALB/c female nude mice aged 3 weeks were purchased from the Central Animal Center of Guangxi Medical University (Nanning, China).
Plasmid generation
Using duplexes of 21-nucleotide RNAs, RNA interference was performed in SKOV3/DDP cells. The four MTRR shRNAs (GenBank accession No. NM_002454) and a negative control shRNA with no homology to any known mammalian gene were provided by Shanghai GenePharma Co (Shanghai, China). Transfection was conducted in the presence of Lipofectamine 2000 (Invitrogen, Carlsbad, CA, United States) according to the manufacturer’s instructions. SKOV3/DDP cells were transfected with four shRNAs. After 48 h, the transfection efficiency was tested by visualizing cells under a fluorescence microscope. If 80% of cells had green fluorescence protein, Western blot assay was performed. The pSicoR-GFP plasmid was kindly provided by Guangxi University (Guangxi, China) and used for DNA vector-based shRNA construction [17]. shRNA-MTRR and shRNA-NC was designed using the pSICOLIGOMAKER 1.5 program (http://web.mit.edu/jacks-lab/protocols/pSico.html). Oligonucleotides were spliced into pSicoR retroviral vectors as described previously [18]. The PCR products were confirmed by sequencing. Recombinant lentiviral vectors and packaging vectors were then transfected into 293T cells [18]. Lentiviral constructs in pSicoR-MTRR and pSicoR-NC groups were used to transfect SKOV3/DDP cells, which were named shMTRR-SKOV3/DDP group and shNC-SKOV3/DDP (negative control) group, respectively. In addition, SKOV3/DDP cells without transfection served as a blank control group. After infection, flow cytometry was performed to screen GFP-positive SKOV3/DDP cells for following experiments [19].
Reverse transcription-polymerase chain reaction (RT-PCR)
Total RNA was independently extracted from shMTRR-SKOV3/DDP cells, shNC-SKOV3/DDP cells, and SKOV3/DDP cells using TRIzol Reagent (Invitrogen) and then subjected to semi-quantitative reverse-transcriptase polymerase chain reaction (RT-PCR). cDNAs were reverse-transcribed from 2 μg of total RNA. The MTRR primers were 5’-AGAGGTTCTGCGGAAGGGAG-3’ (forward) and 5’-ATGATGGGGATTGAGGGGTC-3’ (reverse). The PCR products were then subjected to agarose gel electrophoresis, and the mRNA expressions of MTRR was quantified and normalized to that of GAPDH.
Western blot assay
Cells were harvested and lysed with a standard buffer containing 0.1 M NaCl, 0.01 M Tris-Cl (pH 7.6), 0.001 M EDTA (pH 8.0), 1 μg/ml aprotinin, 100 μg/ml PMSF, and 1% (v/v) NP40. After measuring protein concentration by BCA protein assay, proteins were subjected to SDS-PAGE and then transferred onto PVDF membranes. After blocking, the membranes was treated with using 5% (w/v) BSA in PBST (PBS, pH 7.5, containing 0.1% Tween-20) and then incubated with primary antibodies overnight at 4°C. Anti-MTRR (1:1000) was from Santa Cruz Biotechnology, and other antibodies from Cell Signaling Technology (anti-Bax: 1:800; anti-Bcl-2: 1:800; anti-caspase-3: 1:1000; anti-caspase-9: 1:1000; anti-cleavage caspase-3: 1:1000; anti-cleavage caspase-9: 1:1000; anti-LC3B: 1:800; anti-p62: 1:800; anti-ERK1/2: 1:1000; anti-AMPK: 1:800; anti-PTEN: 1:1500; anti-AKT: 1:1000; anti-p-AKT: 1:1000; anti-mTOR: 1:1200; and anti-p-mTOR: 1:1200). These membranes were subsequently treated with PBST and incubated with peroxidase-conjugated secondary antibody (1:1000) (Santa Cruz Biotechnology) for 1 h. Visualization was detected by using a chemiluminescence system (Pierce, USA) according to the manufacturer’s instructions. The band intensities were quantified using the Image-QuanT software (Molecular Dynamics, Sunnyvale, CA, USA). Then, the membranes were stripped and re-incubated with anti-GAPDH (1:1000) for normalization.
Drug cytotoxicity assay
MTT assay was employed to determine the chemoresistance to cisplatin. Assay was performed in triplicate with cells at a density of 6×10³ cells per well (96-well plate). On the second day, cells were treated with cisplatin (Sigma-Aldrich) (1.56 to 100 μg/L). After 48 h, 20 μl of 5 mg/ml MTT was added to each well. After 4 h, dimethyl sulfoxide (DMSO) (200 μl) was added, followed by incubation for 10 min. The absorbance at 490 nm (A490) was measured on an Opsys MR™ microplate reader. The 50% inhibitory concentration (IC50) was calculated according to the survival curve of cells delineated on the basis of percentage of survived cells at each dose of cisplatin: mean A490 (drug-treated cells)/mean A490 (untreated cells) [20].
Cell proliferation assay
Cell viability and proliferation were measured by MTT and colony formation assays. MTT assay was conducted at 6×10³ cells/well in triplicate on 96-well plates. Cell viability was measured once every 24 h for seven consecutive days. Growth curves were delineated by determining the optical density at 490 nm with an Opsys MR™ microplate reader (ThermoLab Systems, Chantilly, VA, USA). Cell proliferation was quantified by colony formation assay. Cells were re-suspended in DMEM containing 10% FBS and immediately re-plated in 6-well plates at a density of 100 cells/cm2. When sufficient large colonies were present, they were fixed with cold methanol and stained with Giemsa. The plates were photographed for counting the colony number.
Apoptosis detection by flow cytometry
Cells (1×10⁶) were washed with ice-cold PBS twice, and then treated with trypsin and cold 70% ethanol at 4°C for 30 min. The cell pellets were incubated with 5 μl/mL Annexin V-PE and 5 μl/mL 7-amino-actinomycin D (7-AAD). Flow cytometry was performed by using an EPICS XL-MCL FACScan (Becton-Dickinson, Mountain View, CA, United States) and data were analyzed using MultiCycle Software for Windows (Phoenix Flow Systems, San Diego, CA, USA).
Immunofluorescent confocal microscopy
For immunofluorescence staining, cells were fixed in cold methanol for 30 min and then blocked in blocking buffer (1% BSA in PBS) for 1 h, followed by incubation overnight at 4°C or for 5 h at room temperature with rabbit polyclonal anti-LC3B antibody (1:400). After washing thrice (3 min for each) with washing buffer (in PBS), cells were labeled with Alexa Fluor 594 goat-anti-rabbit IgG (1:400). After incubation for 1 h at room temperature, cells were washed thrice and subjected to DAPI staining. After 10 min, cells were mounted and visualized under a laser scan confocal microscope (Nikon A1, Japan).
Transmission electron microscopy
After washing with PBS thrice, cells were collected into a 1.5-ml microcentrifuge tube following digestion with 0.5% pancreatin. The cells were treated with ice-cold 2.5% glutaraldehyde in PBS, post-fixed in 1% osmium tetroxide, dehydrated through a graded series of ethanol (30-90%) and embedded in 812 Epoxy Resin. Ultrathin sections (80 nm) were stained with 2% uranyl acetate and lead citrate, and observed under a H7650 TEM electron microscope (Hitachi, Japan).
Detection of tumor growth in vivo
All the animal studies were approved by the Animal Care and Use Committee of Guangxi Medical University. Cells in three groups were collected following trypsinization. Each BALB/c 3-week-old female nude mouse (Guangxi Animal Center, Nanning, China) was injected with 1×10⁷ cells to establish a tumor xenograft model, and 10 mice were used in each group. After seven days, when the tumor measured 3 to 5 mm in diameter, animals were intraperitoneally injected with cisplatin at 2.5 mg/kg on day 0 [21] once every two days. The tumors were monitored daily and the tumor diameter was measured every other day with a caliper. The tumor volume (TV) was calculated as follows: TV=W2×L/2, where L represents the length and W the width of the tumor. The relative tumor volume (RTV) was calculated as follows: RTV=Vt/V0, where V0 represents the TV on day 0, and Vt the TV measured at later days. The animals were killed at 42 days after chemotherapy and the tumors were collected for analysis. Tumors from three groups were analyzed by H&E staining and immunohistochemistry. Absence of Ki67 and MTRR expression was indicated by lack of staining, weak expression by less than 25% of positive cells, moderate expression by 25-75% of positive cells, and strong expression by >75% of positive cells [22]. Moderate and strong staining indicated a high expression, while negative and weak staining suggested a low expression.
Statistical analysis
÷2 test or Fisher’s exact test was used to evaluate the relationship between MTRR expression and clinicopathological variables. Unpaired Student’s t-test was used for comparisons of data between groups. One-way analysis of variance (ANOVA) was used for multiple comparisons (SPSS version 16.0). A value of P<0.05 was considered statistically significant.
Results
MTRR expression
Immunohistochemistry showed MTRR positive cells had brown granules in the cytoplasm (Figure 1A). The proportion of MTRR positive cells was 45.0%, 22.0%, and 33.0% in OC tissues, benign tumors, and normal ovaries, respectively (Table 1).
Figure 1.
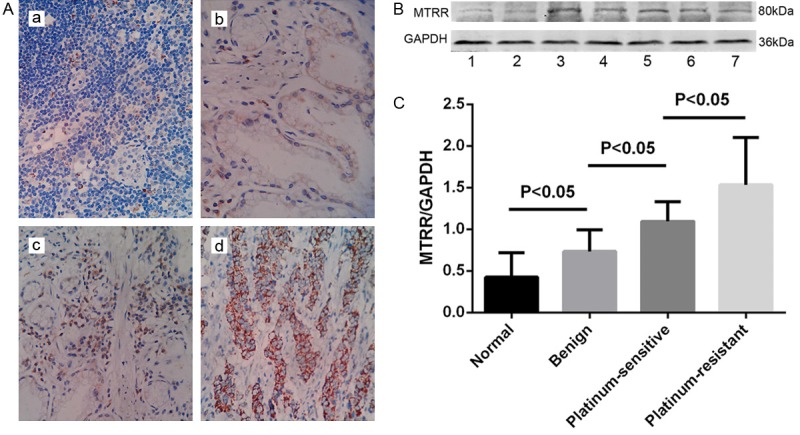
MTRR protein expression in different ovarian tissues. A. Immunohistochemistry for MTRR protein in different ovarian tissues (400×). a. MTRR expression was higher in OC than in benign ovarian tumors and normal ovarian tissues. Normal ovarian tissue; b. benign ovarian tumor; c. platinum-sensitive OC; d. platinum-resistant OC. B. Western blot assay of MTRR expression in different ovarian tissues. Lane 1: normal ovarian tissues; Lane 2: benign ovarian tumor; Lane 3-5: platinum-resistant OC and Lane 6-7: platinum-sensitive OC. Increased Beclin 1 protein expression in OC compared with normal ovarian tissues; C. Quantitative analysis of MTRR expression in normal ovarian tissues and OC. MTRR expression in Western blot assay is expressed as the ratio of OD of MTRR to that of GAPDH. Data are expressed as means ± standard error (SEM).
Table 1.
MTRR expression in ovarian tissues
| Groups | n | MTRR | Positive | P | |||
|---|---|---|---|---|---|---|---|
|
| |||||||
| - | + | ++ | +++ | ||||
| OC | 80 | 20 | 24 | 13 | 23 | 36 (45.0%) | 0.044* |
| Benign tumor | 50 | 19 | 20 | 6 | 5 | 11 (22.0%) | |
| Normal ovary | 30 | 14 | 6 | 6 | 4 | 10 (33.3%) | |
P<0.05 vs benign tumor or normal ovary group.
Western blot assay was performed to detect MTRR expression in OC tissues of 40 patients, including 10 patients with platinum-resistance, 10 patients with benign tumors, and 10 subjects with normal ovary. MTRR expression was significantly higher in OC tissues than in normal ovary (Figure 1B, 1C). MTRR expression in platinum-resistant OC was significantly higher than in other ovarian tissues.
MTRR expression and clinicopathological parameters
According to the MTRR expression, these 80 patients with OC were divided into MTRR low-expression (-/+) group and MTRR high-expression (++/+++) group. Table 2 shows the relationship between MTRR expression and clinicopathologic parameters. Higher MTRR expression was identified in OC with advanced FIGO stage (P=0.001), low grade (P=0.037), metastasis (P=0.009) and platinum resistance (P=0.038). Lower MTR expression was observed in mucinous ovarian cancers (P=0.005). MTRR expression was not correlated to lymph node metastasis (P=0.500), omentum metastasis (P=0.258), serum CA-125 (P=0.698), ascites (P=0.486) or outcome (P=0.138).
Table 2.
Correlation between clinicopathological variables and MTRR expression
| Variables | MTRR expression | P | ||
|---|---|---|---|---|
|
|
||||
| Positive (n=36) | Negative (n=44) | |||
| Histopathology | Serous | 19 | 16 | 0.005 |
| Mucinous | 4 | 20 | ||
| Endometrioid | 1 | 1 | ||
| Germ cell | 7 | 4 | ||
| Sex cord stromal | 3 | 0 | ||
| Metastatic | 2 | 3 | ||
| FIGO Stage | I-II | 9 | 28 | 0.001 |
| III-IV | 27 | 16 | ||
| Grade | G1 | 9 | 21 | 0.037 |
| G2-G3 | 27 | 23 | ||
| Lymph node metastasis | Yes | 11 | 12 | 0.500 |
| No | 32 | 25 | ||
| Omentum metastasis | Yes | 15 | 13 | 0.258 |
| No | 21 | 31 | ||
| Organ metastasis* | Yes | 14 | 6 | 0.009 |
| No | 22 | 38 | ||
| Serum CA-125 (U/mL) | <35 | 14 | 19 | 0.698 |
| ≥35 | 22 | 25 | ||
| Ascites | <500 ml | 15 | 15 | 0.486 |
| ≥500 ml | 21 | 29 | ||
| Platinum resistance | Resistant | 17 | 11 | 0.038 |
| Sensitive | 19 | 33 | ||
| Outcome | CR | 9 | 18 | 0.138 |
| PR | 10 | 15 | ||
| SD | 6 | 6 | ||
| PD | 36 | 44 | ||
Metastasis to the liver, lung, brain, bone or spleen.
Silencing of MTRR by lentivirus mediated transfection
MTRR expression was detected in SKOV3 cells and SKOV3-DDP cells (Figure 2A). To investigate the inhibitory effect of shRNAs in SKOV3/DDP cells, which had a high MTRR expression, Western blot assay was performed at 48 h after shRNA transfection. Results showed that MTRR-homo-1106 (5’-GGTACAAAGCCTACTCCAAAG-3’) significantly inhibited MTRR expression (Figure 2B), and was therefore selected as an optimal shRNA for following experiments. SKOV3/DDP cells were stably transfected with MTRR shRNA or NC-shRNA (Figure 2C-F). RT-PCR and Western blot assay were used to detect mRNA and protein expressions of MTRR in transfected cells, respectively. When compared with blank control (no siRNA) group and NC-shRNA group, the mRNA and protein expressions of MTRR were significantly inhibited in cells transfected with MTRR shRNA (P<0.05; Figure 2G-J).
Figure 2.
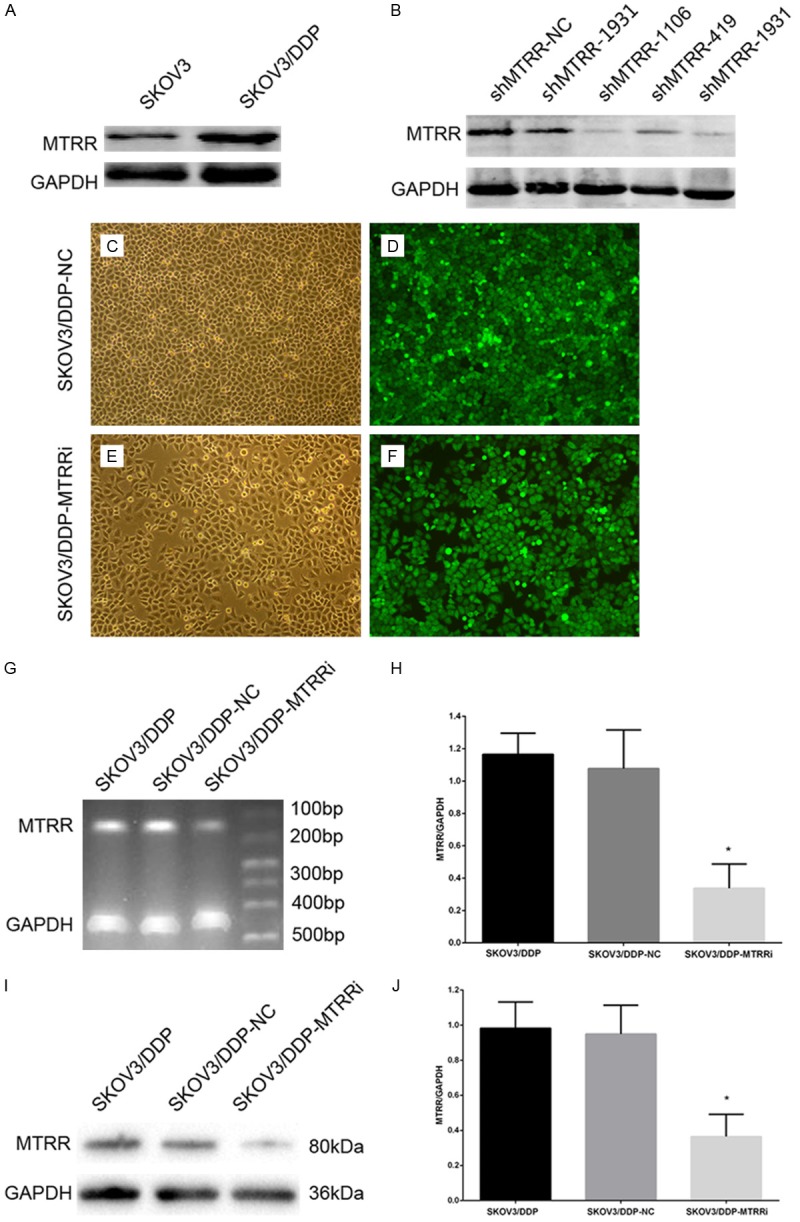
MTRR silencing down-regulates MTRR expression in SKOV3/DDP cells. A. Western blot assay of MTRR expression in four OC cell lines. Low MTRR expression was observed in SKOV3 cells and high expression in SKOV3/DDP cells. B. Western blot assay confirmed that MTRR expression was down-regulated in SKOV3/DDP cells at 48 h after transfection with MTRR shRNA. C-F. Transfection efficiency after screening by flow cytometry and evaluation by fluorescence microscopy. C, E. Under a light microscope (×100); D, F. Under a fluorescence microscope (×100). G, H. Semi-quantitative reverse-transcriptase polymerase chain reaction of MTRR mRNA expression. I, J. Quantitative analysis of MTRR expression in Western blot assay. The optical density of MTRR was normalized to that of GAPDH. Data are expressed as means ± SEM, *P<0.05, shMTRR-SKOV3/DDP cells vs shNC-SKOV3/DDP cells and SKOV3/DDP cells.
MTRR silencing restores cisplatin sensitivity
The effects of MTRR silencing on the cisplatin sensitivity, cell viability and cell growth were assessed by MTT assay. Cisplatin significantly inhibited the cell survival in shMTRR cells when compared with control cells (Figure 3A). MTRR silencing in SKOV3/DDP cells decreased the IC50 of cisplatin (P<0.05; Figure 3B), indicating that MTRR silencing restored the sensitivity of drug-resistant OC cells to cisplatin-induced cytotoxicity when compared with control cells (P>0.05). Cell growth curve revealed that MTRR silencing significantly lowered the cell viability at 5, 6 and 7 days when compared with control groups (P<0.05; Figure 3C). Colony formation assay is usually used to evaluate cell proliferation and tumorigenicity in vitro. In the present study, colony formation assay was employed to monitor the inhibition of OC following MTRR silencing. Results showed that the number of colonies produced by shMTRR-SKOV3/DDP cells remarkably reduced when compared with control cells (Figure 3D-F), indicating that MTRR silencing abrogated the transformed phenotype of OC cells in vitro.
Figure 3.

Effects of MTRR silencing on cisplatin resistance, viability, proliferation and apoptosis of SKOV3/DDP cells. A. Cells were treated with cisplatin for 48 h. MTT assay was used to determine chemoresistance. Cisplatin significantly inhibited the survival of shMTRR-SKOV3/DDP cells compared with control cells. B. IC50 of cisplatin. The IC50 of cisplatin significantly decreased in shMTRR-SKOV3/DDP cells compared with control cells. Data are expressed as mean ± SEM. *P<0.05, shMTRR-SKOV3/DDP cells vs shNC-SKOV3/DDP cells and SKOV3/DDP cells. C. MTT assay of cell viability. MTRR silencing in SKOV3/DDP cells significantly diminished cell growth at 5, 6 and 7 days, compared with control cells. *P<0.05 vs control cells. D-F. Colony formation assay of the shMTRR-SKOV3/DDP cells and control cells. Data are expressed as mean ± SEM. *P<0.05 vs control cells. F. A representative photograph (×40) showing colonies. G. Flow cytometry. shMTRR-SKOV3/DDP cells and control cells were treated with cisplatin (0-1-2-4 μg/ml) for 48 h and then stained with Annexin V-PE/7AAD followed by by flow cytometry. H. Quantitative analysis of shMTRR-SKOV3/DDP cells and control cells. Data are expressed as means ± SEM. *P<0.05 vs control cells.
MTRR silencing induces cell apoptosis
To test our hypothesis that MTRR silencing could induce the apoptosis of SKOV3/DDP cells, cells were stained with AnnexinV-PE and 7-AAD, and subjected to flow cytometry (Figure 3G). Treatment with cisplatin at different doss for 48 h was found to significantly increase the apoptosis of sh-MTRR-SKOV3/DDP cells as compared to shNC-SKOV3/DDP cells and SKOV3/DDP cells (Figure 3H), demonstrating that MTRR silencing is able to induce the apoptosis of SKOV3/DDP cells.
MTRR silencing attenuates autophagy in resistant OC cells
As MTRR silencing restored the drug sensitivity of SKOV3/DDP cells, we examined possible differences in autophagy. Fluorescence staining showed a spot-like LC3B-II fluorescence which increased in shMTRR-SKOV3/DDP cells and control cells after cisplatin treatment (0-1-2-4 μg/ml) for 48 h. shNC-SKOV3/DDP cells and SKOV3/DDP cells exhibited a higher level of autophagy (Figure 4A) suggesting that MTRR silencing reduces autophagosome formation in SKOV3/DDP cell lines. The expressions of LC3-I and its cleavage product LC3-II were measured in the autophagosome membrane after cisplatin treatment for 48 h (18). The ratio of LC3II to LC3I was lower in shMTRR-SKOV3/DDP cells than in shNC-SKOV3/DDP cells and SKOV3/DDP cells, indicating decreased autophagy in shMTRR-SKOV3/DDP cells. MTRR silencing also decreased both LC3I and LC3II when compared with shNC-SKOV3/DDP cells and SKOV3/DDP cells (Figure 4B). Furthermore, cisplatin-induced autophagy was accompanied by reduction in SQSTM1/p62 (Figure 4B). Electron microscopy also found that cisplatin treatment enhanced autophagosomes in three cell lines. However, a higher number of autophagosomes was observed in control cells when compared with shMTRR-SKOV3/DDP cells (Figure 4C). These results indicate that MTRR silencing decreases the conversion of LC3-I to LC3-II and the synthesis of LC3, and imply that cisplatin-induced autophagy in SKOV3/DDP cell lines is SQSTM1/p62-dependent.
Figure 4.
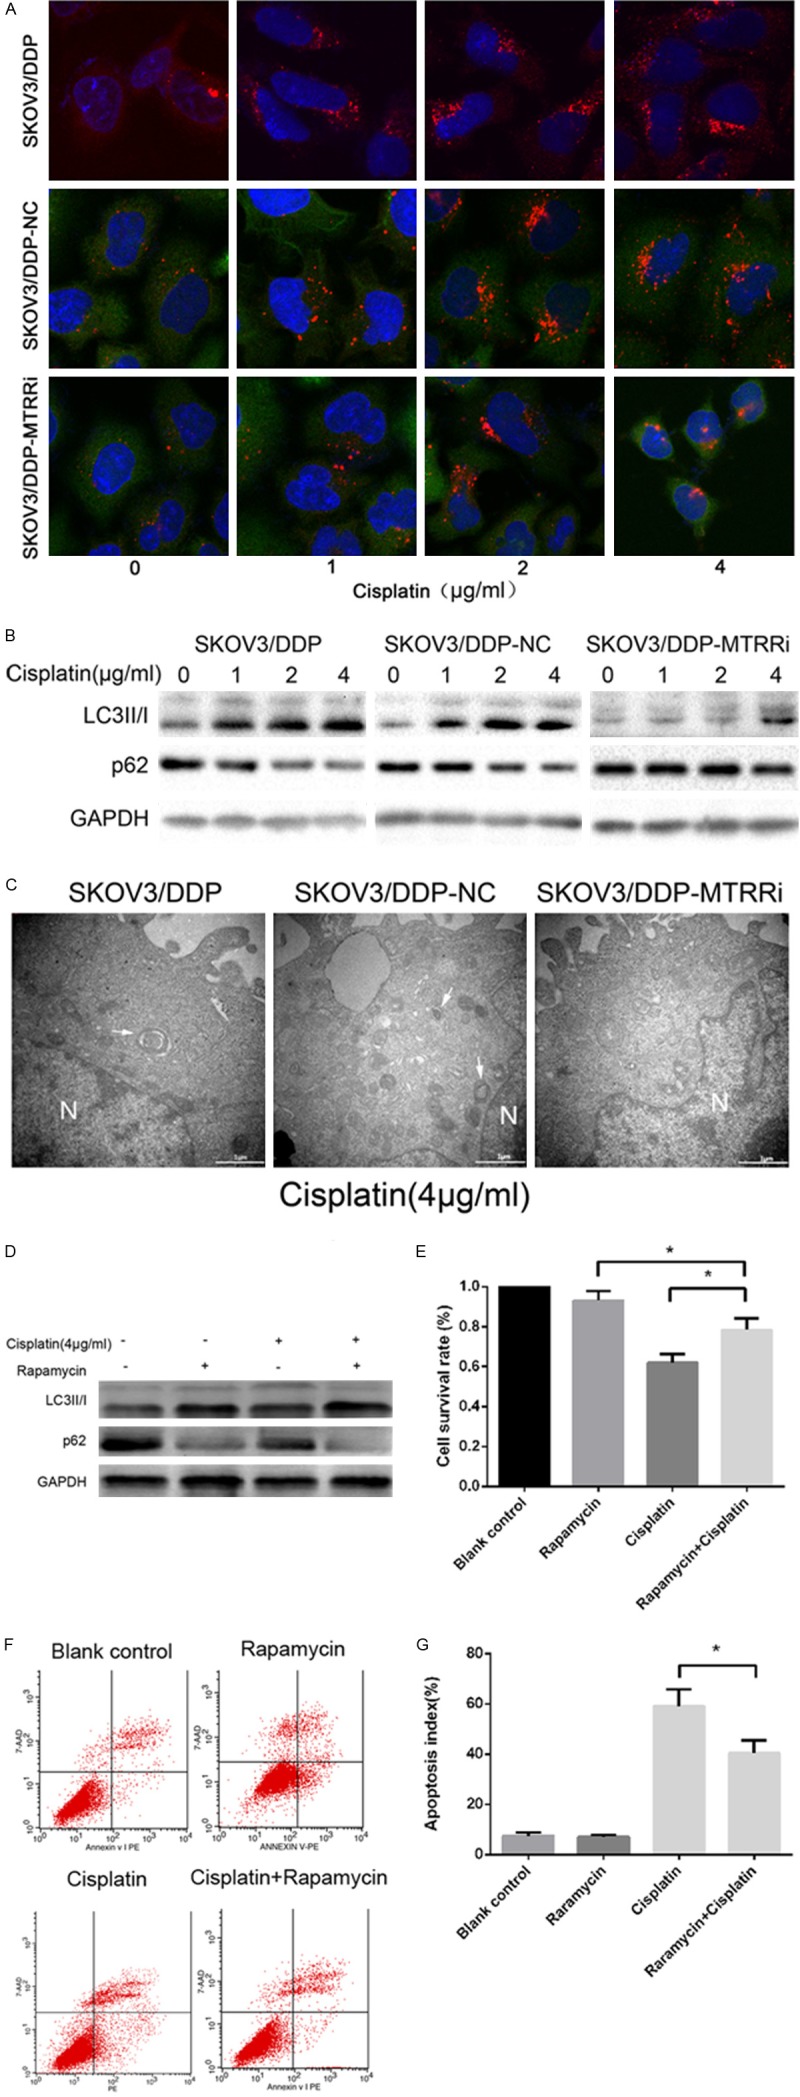
Cisplatin-induced autophagy in SKOV3/DDP cells and cisplatin-induced viability and apoptosis in shMTRR-SKOV3/DDP cells. A. Indirect immunofluorescence assay of LC3 was performed in three cell lines. Red: LC3 (magnification, 60×). B. Cells were treated with cisplatin (0-1-2-4 μg/ml) for 48 h. Cell lysates were subjected to Western blot assay using antibodies against LC3 and p62. C. Electron microscopy of three cell lines treated with 4 μg/ml cisplatin for 48 h (magnification, 30,000×). Scale bar: 1 μm. N, nucleus. Arrowhead, autophagosomes. D. Cells were treated with or without cisplatin (4 μg/ml) and rapamycin (50 nM) for 48 h. Cell lysates were collected for Western blot assay using antibodies against LC3 I and II. E. Detection of cell viability by MTT assay following rapamycin treatment (+/-). Data are expressed as mean ± SEM from three experiments. *P<0.05. F. Apoptosis of cells treated with or without cisplatin and rapamycin. Cells were stained with Annexin V-PE/7AAD and subjected to flow cytometry. G. Cells treated with or without cisplatin (4 μg/ml) and rapamycin (50 nM) for 48 h. Data are expressed as mean ± SEM from three experiments. *P<0.05.
Autophagy increases following MTRR silencing
Reduced autophagy and increased sensitivity to cisplatin were found in shMTRR-SKOV3/DDP cells. shMTRR-SKOV3/DDP cells were pretreated with 50 nM rapamycin (Sigma-Aldrich), a selective mTOR inhibitor, for 2 h, followed by cisplatin (4 μg/ml) for 48 h. Western blot assay was used to determine the LC3 I and II protein expressions (Figure 4D). Rapamycin enhanced LC3 II protein expression following cisplatin treatment and decreased cisplatin induced apoptosis in shMTRR-SKOV3/DDP cells (Figure 4E; MTT). Flow cytometry demonstrated that rapamycin significantly lowered the apoptosis of shMTRR-SKOV3/DDP cells (Figure 4F, 4G).
MTRR silencing restores sensitivity of human OC in vivo
Cisplatin treatment on day 0 significantly lowered the RTV of drug-treated shMTRR xenograft mice when compared with treated SKOV3/DDP and shNC-SKOV3/DDP xenograft mice at 5 and 6 weeks. However, no differences were noticed in TV between SKOV3/DDP group and shNC-SKOV3/DDP group from week 1 to week 6 (Figure 5B). At the end of cisplatin treatment (day 42), tumors were collected, imaged (Figure 5A), measured (Figure 5C) and weighed (Figure 5D). The tumors in control group were larger in size than in shMTRR-SKOV3/DDP group (Figure 5C). Consistently, the tumors in control group had a significantly higher weight than in shMTRR-SKOV3/DDP group (Figure 5D). HE staining (Figure 5E) and immunohistochemistry of tumor xenografts revealed the down-regulated MTRR expression and decreased Ki-67 expression in shMTRR-SKOV3/DDP group when compared with shNC-SKOV3/DDP group and SKOV3/DDP group (Figure 5F).
Figure 5.
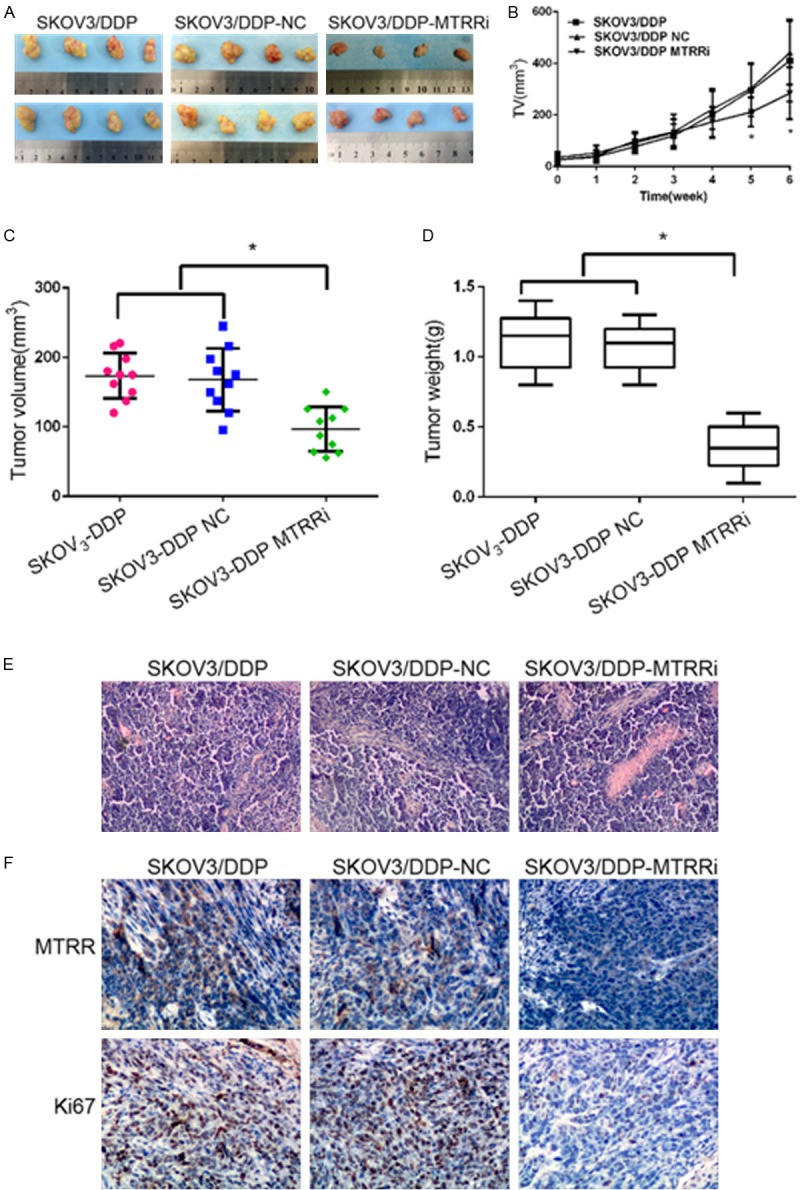
Effect of MTRR silencing on cisplatin sensitivity in vivo. (A, B) shMTRR significantly reduced tumor volume. Mice were sacrificed on day 42 (n=10). Representative images of tumors (A) and tumor growth curve (B). (C, D) The tumors were collected, measured (C), and weighed (D). *P<0.05 vs control cells. (E, F) Tumor cell proliferation was assessed by H&E staining (E) and immunohistochemistry (F). Immunohistochemistry for MTRR and Ki67 in shMTRR-SKOV3/DDP group, shNC-SKOV3/DDP group and SKOV3/DDP group (×200). Expressions of MTRR and Ki67 increased in control xenografts, but reduced in shMTRR xenografts.
MTRR silencing induces apoptosis by regulating Caspase and Bcl-2
The molecular mechanism underlying the MTRR silencing-induced apoptosis of SKOV3/DDP cells was further investigated in this study. The expressions of apoptosis-related proteins were measured by Western blot assay after cisplatin treatment for 48 h. MTRR silencing increased the expressions of Bax, proteolytic cleavage of caspase-9, caspase-3 and PARP. However, Bcl-2 expression decreased. In addition, the Bcl-2/Bax ratio significantly reduced in shMTRR-SKOV3/DDP group when compared with control group (Figure 6A, 6B).
Figure 6.
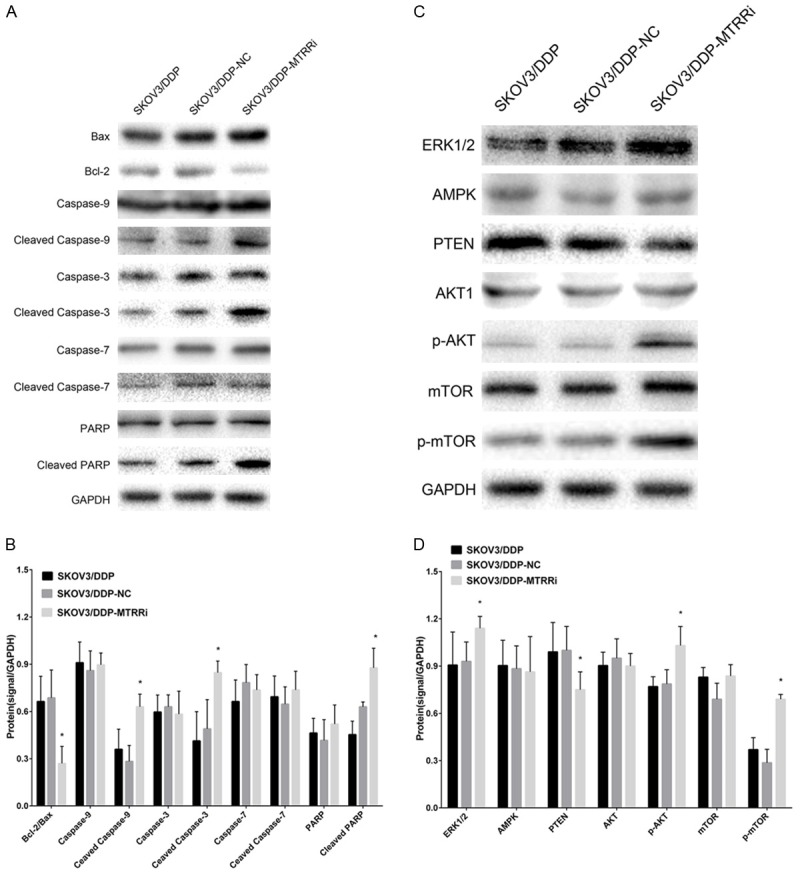
Cisplatin-induced apoptosis is mediated by caspase and Bcl-2, and cisplatin-induced autophagy is mediated by PI3K-AKT1 signaling in OC cells. A. Cisplatin (4 μg/ml) treatment for 48 h. Western blot assay of Bcl-2, Bax, caspase-9, cleaved caspase-9, caspase-3, cleaved caspase-3, PARP and cleaved PARP, using GAPDH as an internal reference. B. Ratios of Bcl-2 to Bax and Bcl-2, Bax, caspase-9, cleaved caspase-9, caspase-3, cleaved caspase-3, PARP, cleaved PARP protein levels (mean ± SEM). Data are from three independent experiments. *P<0.05 vs control cells. C. Cells were treated with cisplatin (4 μg/ml) for 48 h. Western blot assay of AKT1, p-AKT1, m-TOR, p-mTOR and PTEN using GAPDH as an internal reference. D. Protein expressions of AKT1, p-AKT1, m-TOR, p-mTOR and PTEN (mean ± SEM). Data are from three independent experiments. *P<0.05 vs control cells.
MTRR silencing attenuates autophagy via activating mTOR signaling
MAPK/ERK1/2/AKT/mTOR signaling plays a prominent role in the regulation of autophagy. Therefore, the expressions of MAPK, ERK1/2, AKT and mTOR were measured by Western blot assay in cells after MTRR silencing. Cisplatin treatment for 46 h significantly up-regulated the expression of ERK1/2, p-AKT and p-mTOR in shMTRR-SKOV3/DDP group when compared with SKOV3/DDP group and shNC-SKOV3/DDP group (Figure 6C, 6D).
Discussion
Resistance to chemotherapy in OC, as in many other cancers, is a major clinical challenge. Tumor drug resistance is mainly attributed to the genetic mutations and/or epigenetic mechanisms. Folate is a key factor regulating the SAM available for DNA methylation. MTRR reactivates MTR via reductive methylation using SAM as a methyl donor [23]. MTR ensures adequate intracellular folate pools, and catalyzes methionine synthesis, which is required for the production of SAM. MTRR IIe22Met (rs1801394) suggests that the A66G polymorphism leads to an amino acid alteration from isoleucine to methionine, resulting in a protein variant with a four-fold diminished activity than the wild-type protein in vivo [24]. Some polymorphic variants have been found to be associated with several disorders, including birth defects [25], cardiovascular diseases [26] and cancers [27], including head and neck cancer, lung cancer in smokers, esophageal squamous cell carcinoma, meningioma, colorectal carcinoma and pancreatic cancer in alcoholics [28-33]. Epidemiological and case-control studies have revealed that the MTRR A66G GG genotype is associated with a decreased risk for leukemia in Caucasian population, according to the results of seven pooled studies [34,35]. Only a few observational studies have previously investigated the association of folate intake or polymorphisms of folate-metabolizing genes with the survival of OC patients [36-38]. Currently, the role of MTRR IIe22Met polymorphisms in OC is unclear [10].
In vitro experiments have demonstrated that MTRR A66G genotype is related to the plasma homocysteine level and DNA hypomethylation in humans [24]. In epithelial OC, absence of DNA methylation was frequently found in tumor suppressor genes. Hypomethylating agents have demonstrated a therapeutic role in hematologic malignancies, especially the myelodysplastic syndromes [39,40]. Several preclinical studies suggest that hypomethylation is able to reverse platinum resistance in vitro and in vivo [41,42]. Decitabine-induced hypomethylation, in combination with carboplatin therapy, represents a promising strategy to restore the sensitivity to chemotherapy in patients with recurrent, drug-resistant OC [43]. To our knowledge, this study was for the first to evaluate the correlation between MTRR activity and cisplatin resistance in OC cells.
In our study, immunohistochemistry and Western blot assay were employed to determine the expressions of MTRR in 80 OC tissues, 50 benign ovarian tumors and 30 normal ovarian tissues. Results revealed a higher MTRR expression in OC and was related to advanced FIGO stage (P=0.001), low grade (P=0.037), organ metastasis (P=0.009) and platinum resistance (P=0.038), but had no relationship with lymph node metastasis (P=0.500), omentum metastasis (P=0.258), serum CA-125 (P=0.698), ascites (P=0.486) or outcome (P=0.138).
Thus, we hypothesized that MTRR was associated with cisplatin resistance. RNA interference was employed to silence MTRR expression in OC cells in vitro and inhibition of cell proliferation, improvement of cisplatin resistance, and increases in autophagy and apoptosis were observed in vitro and in vivo, suggesting that MTRR may serve as a novel therapeutic target for the treatment of OC. The multiple changes mediated by MTRR in OC cells may be attributed to its role in one-carbon metabolism and DNA methylation.
Bcl-2 expression is able to mediate the chemoresistance of OC. Bcl-2 family members, including pro-apoptotic (such as Bax) and antiapoptotic (such as Bcl-2) proteins, may induce cytochrome c release [44]. Cytochrome c released into the cytosol may activate caspase-9, which in turn activates caspase-3 [45]. Our study demonstrated Bcl-2 expression reduced following MTRR silencing. The elevated Bax: Bcl-2 ratio increased the expressions of caspase-9 and caspase-3, and induced the cleavage of caspase-3 substrate PARP, implying that the intrinsic apoptosis pathway was involved in MTRR-mediated, cisplatin-induced apoptosis.
PI3K-AKT1 signaling pathway is regulated by mTOR (PI3K-AKT-mTOR), which may inhibit autophagy [46]. Autophagy can induce the cell survival or death during the tumor development [47]. Recent studies indicate that acute cisplatin treatment triggers an autophagic response that serves as a survival factor to counteract cisplatin-induced death [48]. In lung cancer cells, autophagy promotes cisplatin resistance [49]. Inhibiting autophagy in osteosarcomas increases the sensitivity to chemotherapy, and concurrent radiation and autophagy inhibition increase cell death in A549 lung cancer model [50]. However, evidence supporting the role of autophagy in cisplatin resistance is still limited. In the present study, our findings indicated that MTRR silencing up-regulated the expressions of ERK1/2, p-AKT and p-mTOR in OC cells, suggesting that MTRR may mediate the autophagy of OC cells possibly via regulating the ERK1/2 and AKT signaling pathway-mediated mTOR expression.
Taken together, our study demonstrates increased MTRR expression in human OC is associated with tumor differentiation and platinum resistance. MTRR silencing reduces cell growth, platinum resistance and autophagy of OC cells via regulating caspase expression and mTOR signaling pathway in OC cells. MTRR may be a promising target in the therapy of OC.
Acknowledgements
This study was supported by a grant from the National High-Tech R&D program 863 (No. 2012AA02A507) and Guangxi scientific research and technological development program topics (No. 14124004).
Disclosure of conflict of interest
None.
References
- 1.Siegel R, Naishadham D, Jemal A. Cancer statistics, 2013. CA Cancer J Clin. 2013;63:11–30. doi: 10.3322/caac.21166. [DOI] [PubMed] [Google Scholar]
- 2.Mei L, Chen H, Wei DM, Fang F, Liu GJ, Xie HY, Wang X, Zou J, Han X, Feng D. Maintenance chemotherapy for ovarian cancer. Cochrane Database Syst Rev. 2013;6:CD007414. doi: 10.1002/14651858.CD007414.pub3. [DOI] [PMC free article] [PubMed] [Google Scholar]
- 3.Szakacs G, Paterson JK, Ludwig JA, Booth-Genthe C, Gottesman MM. Targeting multidrug resistance in cancer. Nat Rev Drug Discov. 2006;5:219–234. doi: 10.1038/nrd1984. [DOI] [PubMed] [Google Scholar]
- 4.Teodoridis JM, Strathdee G, Plumb JA, Brown R. CpG-island methylation and epigenetic control of resistance to chemotherapy. Biochem Soc Trans. 2004;32:916–917. doi: 10.1042/BST0320916. [DOI] [PubMed] [Google Scholar]
- 5.Staub J, Chien J, Pan Y, Qian X, Narita K, Aletti G, Scheerer M, Roberts LR, Molina J, Shridhar V. Epigenetic silencing of HSulf-1 in ovarian cancer: implications in chemoresistance. Oncogene. 2007;26:4969–4978. doi: 10.1038/sj.onc.1210300. [DOI] [PubMed] [Google Scholar]
- 6.Bram EE, Stark M, Raz S, Assaraf YG. Chemotherapeutic drug-induced ABCG2 promoter demethylation as a novel mechanism of acquired multidrug resistance. Neoplasia. 2009;11:1359–1370. doi: 10.1593/neo.91314. [DOI] [PMC free article] [PubMed] [Google Scholar]
- 7.Hu S, Yu L, Li Z, Shen Y, Wang J, Cai J, Xiao L, Wang Z. Overexpression of EZH2 contributes to acquired cisplatin resistance in ovarian cancer cells in vitro and in vivo. Cancer Biol Ther. 2010;10:788–795. doi: 10.4161/cbt.10.8.12913. [DOI] [PubMed] [Google Scholar]
- 8.Cheng JQ, Jiang X, Fraser M, Li M, Dan HC, Sun M, Tsang BK. Role of X-linked inhibitor of apoptosis protein in chemoresistance in ovarian cancer: possible involvement of the phosphoinositide-3 kinase/Akt pathway. Drug Resist Updat. 2002;5:131–146. doi: 10.1016/s1368-7646(02)00003-1. [DOI] [PubMed] [Google Scholar]
- 9.Liu H, He Z, Simon HU. Autophagy suppresses melanoma tumorigenesis by inducing senescence. Autophagy. 2014;10:372–373. doi: 10.4161/auto.27163. [DOI] [PMC free article] [PubMed] [Google Scholar]
- 10.Kelemen LE, Sellers TA, Schildkraut JM, Cunningham JM, Vierkant RA, Pankratz VS, Fredericksen ZS, Gadre MK, Rider DN, Liebow M, Goode EL. Genetic variation in the one-carbon transfer pathway and ovarian cancer risk. Cancer Res. 2008;68:2498–2506. doi: 10.1158/0008-5472.CAN-07-5165. [DOI] [PMC free article] [PubMed] [Google Scholar]
- 11.Kotsopoulos J, Hecht JL, Marotti JD, Kelemen LE, Tworoger SS. Relationship between dietary and supplemental intake of folate, methionine, vitamin B6 and folate receptor alpha expression in ovarian tumors. Int J Cancer. 2010;126:2191–2198. doi: 10.1002/ijc.24723. [DOI] [PMC free article] [PubMed] [Google Scholar]
- 12.Wilson A, Platt R, Wu Q, Leclerc D, Christensen B, Yang H, Gravel RA, Rozen R. A common variant in methionine synthase reductase combined with low cobalamin (vitamin B12) increases risk for spina bifida. Mol Genet Metab. 1999;67:317–323. doi: 10.1006/mgme.1999.2879. [DOI] [PubMed] [Google Scholar]
- 13.Suzuki T, Matsuo K, Hirose K, Hiraki A, Kawase T, Watanabe M, Yamashita T, Iwata H, Tajima K. One-carbon metabolism-related gene polymorphisms and risk of breast cancer. Carcinogenesis. 2008;29:356–362. doi: 10.1093/carcin/bgm295. [DOI] [PubMed] [Google Scholar]
- 14.Zhang Z, Shi Q, Liu Z, Sturgis EM, Spitz MR, Wei Q. Polymorphisms of methionine synthase and methionine synthase reductase and risk of squamous cell carcinoma of the head and neck: a case-control analysis. Cancer Epidemiol Biomarkers Prev. 2005;14:1188–1193. doi: 10.1158/1055-9965.EPI-04-0501. [DOI] [PubMed] [Google Scholar]
- 15.Gast A, Bermejo JL, Flohr T, Stanulla M, Burwinkel B, Schrappe M, Bartram CR, Hemminki K, Kumar R. Folate metabolic gene polymorphisms and childhood acute lymphoblastic leukemia: a case-control study. Leukemia. 2007;21:320–325. doi: 10.1038/sj.leu.2404474. [DOI] [PubMed] [Google Scholar]
- 16.Luan YZ, Li L, Li DR, Zhang W, Tang BJ. [Establishment of 5 resistant ovarian cancer cell strains and expression of resistance-related genes] . Zhonghua Fu Chan Ke Za Zhi. 2004;39:403–407. [PubMed] [Google Scholar]
- 17.Meylan E, Dooley AL, Feldser DM, Shen L, Turk E, Ouyang C, Jacks T. Requirement for NFkappaB signalling in a mouse model of lung adenocarcinoma. Nature. 2009;462:104–107. doi: 10.1038/nature08462. [DOI] [PMC free article] [PubMed] [Google Scholar]
- 18.Ventura A, Meissner A, Dillon CP, McManus M, Sharp PA, Van Parijs L, Jaenisch R, Jacks T. Cre-lox-regulated conditional RNA interference from transgenes. Proc Natl Acad Sci U S A. 2004;101:10380–10385. doi: 10.1073/pnas.0403954101. [DOI] [PMC free article] [PubMed] [Google Scholar]
- 19.Wang HR GC, Zhong JH, et al. Combined use of flow cytometry and G418 to screen the recombinant plasmid transfected cells. J Diagn Concep Pract. 2006;5:52–55. [Google Scholar]
- 20.Abbosh PH, Montgomery JS, Starkey JA, Novotny M, Zuhowski EG, Egorin MJ, Moseman AP, Golas A, Brannon KM, Balch C, Huang TH, Nephew KP. Dominant-negative histone H3 lysine 27 mutant derepresses silenced tumor suppressor genes and reverses the drugresistant phenotype in cancer cells. Cancer Res. 2006;66:5582–5591. doi: 10.1158/0008-5472.CAN-05-3575. [DOI] [PubMed] [Google Scholar]
- 21.Shi L, Yu H, Zhang W, Li L, Wang Q. [Establishment and biological characteristics of a platinum-resistance nude mouse model in epithelial ovarian cancer] . Zhonghua Fu Chan Ke Za Zhi. 2014;49:523–530. [PubMed] [Google Scholar]
- 22.Kleer CG, Cao Q, Varambally S, Shen R, Ota I, Tomlins SA, Ghosh D, Sewalt RG, Otte AP, Hayes DF, Sabel MS, Livant D, Weiss SJ, Rubin MA, Chinnaiyan AM. EZH2 is a marker of aggressive breast cancer and promotes neoplastic transformation of breast epithelial cells. Proc Natl Acad Sci U S A. 2003;100:11606–11611. doi: 10.1073/pnas.1933744100. [DOI] [PMC free article] [PubMed] [Google Scholar]
- 23.Leclerc D, Wilson A, Dumas R, Gafuik C, Song D, Watkins D, Heng HH, Rommens JM, Scherer SW, Rosenblatt DS, Gravel RA. Cloning and mapping of a cDNA for methionine synthase reductase, a flavoprotein defective in patients with homocystinuria. Proc Natl Acad Sci U S A. 1998;95:3059–3064. doi: 10.1073/pnas.95.6.3059. [DOI] [PMC free article] [PubMed] [Google Scholar]
- 24.Olteanu H, Munson T, Banerjee R. Differences in the efficiency of reductive activation of methionine synthase and exogenous electron acceptors between the common polymorphic variants of human methionine synthase reductase. Biochemistry. 2002;41:13378–13385. doi: 10.1021/bi020536s. [DOI] [PubMed] [Google Scholar]
- 25.Zeng W, Liu L, Tong Y, Liu HM, Dai L, Mao M. A66G and C524T polymorphisms of the methionine synthase reductase gene are associated with congenital heart defects in the Chinese Han population. Genet Mol Res. 2011;10:2597–2605. doi: 10.4238/2011.October.25.7. [DOI] [PubMed] [Google Scholar]
- 26.Vijaya Lakshmi SV, Naushad SM, Rupasree Y, Seshagiri Rao D, Kutala VK. Interactions of 5’-UTR thymidylate synthase polymorphism with 677C --> T methylene tetrahydrofolate reductase and 66A --> G methyltetrahydrofolate homocysteine methyl-transferase reductase polymorphisms determine susceptibility to coronary artery disease. J Atheroscler Thromb. 2011;18:56–64. doi: 10.5551/jat.5702. [DOI] [PubMed] [Google Scholar]
- 27.Han D, Shen C, Meng X, Bai J, Chen F, Yu Y, Jin Y, Fu S. Methionine synthase reductase A66G polymorphism contributes to tumor susceptibility: evidence from 35 case-control studies. Mol Biol Rep. 2012;39:805–816. doi: 10.1007/s11033-011-0802-6. [DOI] [PubMed] [Google Scholar]
- 28.Suzuki T, Matsuo K, Hasegawa Y, Hiraki A, Wakai K, Hirose K, Saito T, Sato S, Ueda R, Tajima K. One-carbon metabolism-related gene polymorphisms and risk of head and neck squamous cell carcinoma: case-control study. Cancer Sci. 2007;98:1439–1446. doi: 10.1111/j.1349-7006.2007.00533.x. [DOI] [PMC free article] [PubMed] [Google Scholar]
- 29.Suzuki T, Matsuo K, Hiraki A, Saito T, Sato S, Yatabe Y, Mitsudomi T, Hida T, Ueda R, Tajima K. Impact of one-carbon metabolism-related gene polymorphisms on risk of lung cancer in Japan: a case control study. Carcinogenesis. 2007;28:1718–1725. doi: 10.1093/carcin/bgm104. [DOI] [PubMed] [Google Scholar]
- 30.Stolzenberg-Solomon RZ, Qiao YL, Abnet CC, Ratnasinghe DL, Dawsey SM, Dong ZW, Taylor PR, Mark SD. Esophageal and gastric cardia cancer risk and folate- and vitamin B(12)-related polymorphisms in Linxian, China. Cancer Epidemiol Biomarkers Prev. 2003;12:1222–1226. [PubMed] [Google Scholar]
- 31.Bethke L, Webb E, Murray A, Schoemaker M, Feychting M, Lonn S, Ahlbom A, Malmer B, Henriksson R, Auvinen A, Kiuru A, Salminen T, Johansen C, Christensen HC, Muir K, McKinney P, Hepworth S, Dimitropoulou P, Lophatananon A, Swerdlow A, Houlston R. Functional polymorphisms in folate metabolism genes influence the risk of meningioma and glioma. Cancer Epidemiol Biomarkers Prev. 2008;17:1195–1202. doi: 10.1158/1055-9965.EPI-07-2733. [DOI] [PubMed] [Google Scholar]
- 32.Matsuo K, Hamajima N, Hirai T, Kato T, Inoue M, Takezaki T, Tajima K. Methionine Synthase Reductase Gene A66G Polymorphism is Associated with Risk of Colorectal Cancer. Asian Pac J Cancer Prev. 2002;3:353–359. [PubMed] [Google Scholar]
- 33.Suzuki T, Matsuo K, Sawaki A, Mizuno N, Hiraki A, Kawase T, Watanabe M, Nakamura T, Yamao K, Tajima K, Tanaka H. Alcohol drinking and one-carbon metabolism-related gene polymorphisms on pancreatic cancer risk. Cancer Epidemiol Biomarkers Prev. 2008;17:2742–2747. doi: 10.1158/1055-9965.EPI-08-0470. [DOI] [PubMed] [Google Scholar]
- 34.Metayer C, Scelo G, Chokkalingam AP, Barcellos LF, Aldrich MC, Chang JS, Guha N, Urayama KY, Hansen HM, Block G, Kiley V, Wiencke JK, Wiemels JL, Buffler PA. Genetic variants in the folate pathway and risk of childhood acute lymphoblastic leukemia. Cancer Causes Control. 2011;22:1243–1258. doi: 10.1007/s10552-011-9795-7. [DOI] [PMC free article] [PubMed] [Google Scholar]
- 35.Amigou A, Rudant J, Orsi L, Goujon-Bellec S, Leverger G, Baruchel A, Bertrand Y, Nelken B, Plat G, Michel G, Haouy S, Chastagner P, Ducassou S, Rialland X, Hemon D, Clavel J. Folic acid supplementation, MTHFR and MTRR polymorphisms, and the risk of childhood leukemia: the ESCALE study (SFCE) Cancer Causes Control. 2012;23:1265–1277. doi: 10.1007/s10552-012-0004-0. [DOI] [PubMed] [Google Scholar]
- 36.Zhang L, Liu W, Hao Q, Bao L, Wang K. Folate intake and methylenetetrahydrofolate reductase gene polymorphisms as predictive and prognostic biomarkers for ovarian cancer risk. Int J Mol Sci. 2012;13:4009–4020. doi: 10.3390/ijms13044009. [DOI] [PMC free article] [PubMed] [Google Scholar]
- 37.Gao S, Liu N, Ma Y, Ying L. Methylenetetrahydrofolate reductase gene polymorphisms as predictive and prognostic biomarkers in ovarian cancer risk. Asian Pac J Cancer Prev. 2012;13:569–573. doi: 10.7314/apjcp.2012.13.2.569. [DOI] [PubMed] [Google Scholar]
- 38.Goode EL, Maurer MJ, Sellers TA, Phelan CM, Kalli KR, Fridley BL, Vierkant RA, Armasu SM, White KL, Keeney GL, Cliby WA, Rider DN, Kelemen LE, Jones MB, Peethambaram PP, Lancaster JM, Olson JE, Schildkraut JM, Cunningham JM, Hartmann LC. Inherited determinants of ovarian cancer survival. Clin Cancer Res. 2010;16:995–1007. doi: 10.1158/1078-0432.CCR-09-2553. [DOI] [PMC free article] [PubMed] [Google Scholar]
- 39.Jones PA, Baylin SB. The epigenomics of cancer. Cell. 2007;128:683–692. doi: 10.1016/j.cell.2007.01.029. [DOI] [PMC free article] [PubMed] [Google Scholar]
- 40.Jabbour E, Issa JP, Garcia-Manero G, Kantarjian H. Evolution of decitabine development: accomplishments, ongoing investigations, and future strategies. Cancer. 2008;112:2341–2351. doi: 10.1002/cncr.23463. [DOI] [PMC free article] [PubMed] [Google Scholar]
- 41.Li Y, Hu W, Shen DY, Kavanagh JJ, Fu S. Azacitidine enhances sensitivity of platinumresistant ovarian cancer cells to carboplatin through induction of apoptosis. Am J Obstet Gynecol. 2009;200:177, e177–179. doi: 10.1016/j.ajog.2008.08.030. [DOI] [PubMed] [Google Scholar]
- 42.Gomyo Y, Sasaki J, Branch C, Roth JA, Mukhopadhyay T. 5-aza-2’-deoxycytidine upregulates caspase-9 expression cooperating with p53-induced apoptosis in human lung cancer cells. Oncogene. 2004;23:6779–6787. doi: 10.1038/sj.onc.1207381. [DOI] [PubMed] [Google Scholar]
- 43.Fang F, Balch C, Schilder J, Breen T, Zhang S, Shen C, Li L, Kulesavage C, Snyder AJ, Nephew KP, Matei DE. A phase 1 and pharmacodynamic study of decitabine in combination with carboplatin in patients with recurrent, platinum-resistant, epithelial ovarian cancer. Cancer. 2010;116:4043–4053. doi: 10.1002/cncr.25204. [DOI] [PMC free article] [PubMed] [Google Scholar]
- 44.Eskes R, Desagher S, Antonsson B, Martinou JC. Bid induces the oligomerization and insertion of Bax into the outer mitochondrial membrane. Mol Cell Biol. 2000;20:929–935. doi: 10.1128/mcb.20.3.929-935.2000. [DOI] [PMC free article] [PubMed] [Google Scholar]
- 45.Kim R, Emi M, Tanabe K. Role of mitochondria as the gardens of cell death. Cancer Chemother Pharmacol. 2006;57:545–553. doi: 10.1007/s00280-005-0111-7. [DOI] [PubMed] [Google Scholar]
- 46.Manning BD, Cantley LC. AKT/PKB signaling: navigating downstream. Cell. 2007;129:1261–1274. doi: 10.1016/j.cell.2007.06.009. [DOI] [PMC free article] [PubMed] [Google Scholar]
- 47.Yu L, Alva A, Su H, Dutt P, Freundt E, Welsh S, Baehrecke EH, Lenardo MJ. Regulation of an ATG7-beclin 1 program of autophagic cell death by caspase-8. Science. 2004;304:1500–1502. doi: 10.1126/science.1096645. [DOI] [PubMed] [Google Scholar]
- 48.O’Donovan TR, O’Sullivan GC, McKenna SL. Induction of autophagy by drug-resistant esophageal cancer cells promotes their survival and recovery following treatment with chemotherapeutics. Autophagy. 2011;7:509–524. doi: 10.4161/auto.7.6.15066. [DOI] [PMC free article] [PubMed] [Google Scholar]
- 49.Sirichanchuen B, Pengsuparp T, Chanvorachote P. Long-term cisplatin exposure impairs autophagy and causes cisplatin resistance in human lung cancer cells. Mol Cell Biochem. 2012;364:11–18. doi: 10.1007/s11010-011-1199-1. [DOI] [PubMed] [Google Scholar]
- 50.Palumbo S, Comincini S. Autophagy and ionizing radiation in tumors: the “survive or not survive” dilemma. J Cell Physiol. 2013;228:1–8. doi: 10.1002/jcp.24118. [DOI] [PubMed] [Google Scholar]