Abstract
Purpose
To use optical coherence tomography (OCT) angiography to monitor the short-term blood flow changes in choroidal neovascularization (CNV) in response to treatment.
Participants
One patient with exudative age-related macular degeneration (AMD)
Methods
In this retrospective report, a case of CNV was followed closely with OCT angiography over 3 cycles of anti-angiogenic treatment. Outer retinal flow index, CNV flow area and central macular retinal thickness were measured.
Results
Quantitative measurements of CNV flow area and flow index showed rapid shutdown of flow over the initial 2 week, followed by re-appearance of CNV channel by the 4th week, preceding fluid re-accumulation at 6 weeks.
Conclusions
Frequent OCT angiography reveals a previously unknown pattern of rapid shutdown and re-appearance of CNV channels within treatment cycles. OCT angiographic changes precede fluid re-accumulation and could be useful as leading indicators of CNV activity that could guide treatment timing. Further studies using OCT angiography in short intervals between anti-angiogenic treatments are needed.
Keywords: Optical coherence tomography angiography, imaging, neovascularization, retina, macula
Introduction
Treatment of choroidal neovascularization (CNV) with monthly injections of anti-vascular endothelial growth factor (VEGF) agents is highly successful.1 However, to reduce treatment burden, practice patterns tend towards individualized treatment based on disease activity using pro re nata (PRN)2 or treat-and-extend3 regimens. The intervals between injections are guided by fluid re-accumulation on structural optical coherence tomography (OCT). This fluid re-accumulation may be detrimental to the long-term outcome.4 OCT angiography is a novel technology that offers an alternative measurement of CNV activity that might be useful in guiding the customization of anti-VEGF regimen. Here we report a demonstration of OCT angiographic measurement of the CNV response to treatment.
Methods
This is a retrospective review of a case at Dr. Lumbroso’s clinic in Rome. OCT angiography (3×3 mm; 216 × 216 points; 3.8 sec) was obtained using a 70 KHz, 840 nm wavelength commercial spectral OCT (RTVue-XR Avanti, Optovue, Inc. USA) using the split-spectrum amplitude decorrelation angiography (SSADA) algorithm5 and three-dimensional orthogonal registration algorithm.6 The scans were exported for processing by custom software at Casey Eye Institute under an IRB-approved protocol.
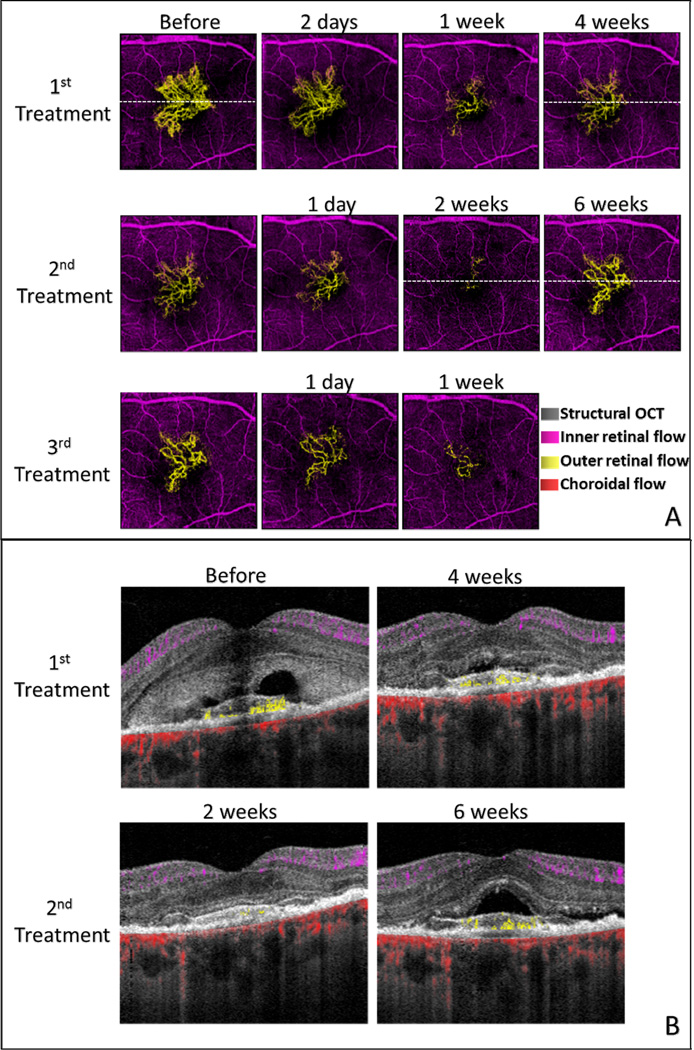
The OCT angiograms are primarily shown in en face views in which each pixel represent the maximum flow value detected within the relevant anatomy layers or “slabs”.7,8 We combine en face OCT angiograms from several slabs by the use of color coding (Fig. 1A). The purple inner retinal slab shows flow from the internal limiting membrane to the outer boundary of the outer plexiform layer (OPL). The yellow outer retinal slab shows flow from the outer OPL to the Bruch’s membrane. The red choroidal slab shows flow below Bruch’s membrane.
Figure 1.
Optical coherence tomography (OCT) angiography (3×3 mm) of choroidal neovascularization (CNV). (A) En face OCT angiograms showing time course of CNV response to anti-angiogenic treatment over 3 cycles. The dash lines indicate the locations of cross sections below. (B) Cross-sectional OCT angiography showing sub-retinal fluid and CNV flow simultaneously at selected time points. CNV is above the retinal pigment epithelium indicating Type II CNV. By 4 weeks after the initial injection, sub-retinal fluid had largely been resorbed but flow in CNV was again active. Two weeks after the second injection, CNV flow had nearly ceased and the retina appeared completely dry. Six weeks after the second injection, there was a return of both CNV flow and sub-retinal fluid. The color code is: inner retinal blood flow between the inner limiting membrane and outer plexiform layer – purple; outer retinal blood flow (CNV) between the outer plexiform layer and retinal pigment epithelium (RPE) – yellow; choroidal blood flow - red. Flow projection artifact in the RPE had been removed using a post-processing algorithm.
We also utilize composite cross-sectional OCT angiograms (Fig. 1B) in which the flow signal is represented by the color scheme explained above, and the reflectance signal intensity (structural OCT) is shown in gray scale. The cross-sectional angiograms allow more precise visualization of the depth of CNV relative to retina pigment epithelium (RPE).
The SSADA algorithm detects decorrelation (a normalized measure of variation) in OCT signal intensity over time, which could be produced by directly by blood flow or indirectly by flickering shadow cast by flow in the beam path. Thus blood vessels in the inner retinal slab cast shadowgraphic flow projection artifacts on the deeper layers, interfering with CNV detection in the outer retinal slab. We use an automated computer algorithm to remove these flow projection artifacts and recover a clean CNV flow pattern on the outer retinal angiograms.9 Briefly, projection artifacts were eliminated from the outer retinal angiograms by subtracting the inner retinal vascular patterns. A vascular pattern recognition algorithm then recovers the contiguous pattern of CNV network and removes scattered residual artifacts. CNV flow area was measured by the summation of pixel area with active CNV flow in the cleaned outer retinal angiogram. Outer retinal flow index was defined as the flow signal (decorrelation values)5 averaged within the cleaned outer retinal angiogram. Central macular retinal thickness, measured from the ILM to the RPE, was averaged in a 3-mm diameter circular zone centered on the fovea.
Results
A 73-year-old woman was initially referred 19 months prior to the current presentation, at which time fluorescein and indocyanine green angiography showed a medium-sized subfoveal classic CNV in the left eye, which had not been previously treated. She did not return for treatment until the current presentation, when she noted decreased vision in the left eye. The best-corrected visual acuity (BCVA) was 20/100. Slit lamp examination showed a small yellowish patch in the perifoveal region and retinal edema. Structural OCT revealed the retinal elevation, subretinal fluid and a hyper-reflective elongated area above RPE indicating type II CNV.
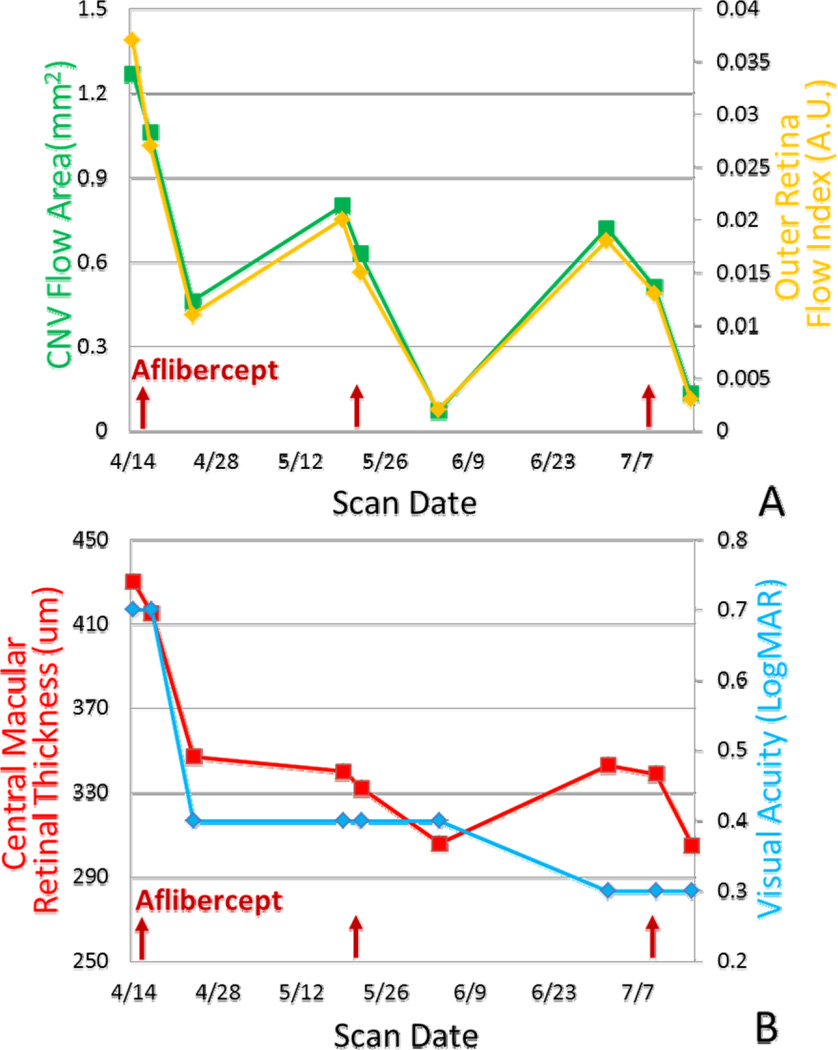
Anti-angiogenic treatment with intravitreal aflibercept injections were administered with a treat-and-extend regimen. OCT angiograms (Fig. 1) showed noticeable reduction in CNV flow area by 1–2 days post injection, with continued reduction at 1 week and 2 weeks. CNV flow area and vessel density were reduced, probably due to the decreased flow or temporary closure of the smaller anastomoses. Significant re-appearance of CNV was noticeable at 4 weeks after the first injection and again at 6 weeks after the second injection. The vascular pattern of the re-enlarged CNV (Fig. 1A) was very similar to the initial pretreatment CNV, suggesting that the recurrence may be reopening of original channels rather than growth of new vessels. Comparing the CNV network prior to the 3rd injection to the baseline, it is notable that there were fewer smaller channels, while the larger caliber channels remained. Quantitative measurements from OCT angiography (Fig. 2A) showed reduction in CNV flow area and flow index over the first 2 weeks with subsequent return. Retinal thickness (Fig. 2B) showed the fluid resorption over the first 4 weeks in the first treatment cycle continuing at least 2 weeks into the second treatment cycle, at which time no fluid remained (Fig. 1B). But fluid re-accumulated under the retina 6 weeks after the 2nd injection. Visual acuity (Fig. 2B) continued to improve over the 3 treatment cycles.
Figure 2.
Time course of CNV response to anti-angiogenic treatment over 3 cycles. (A) Quantitative OCT angiographic response. (B) Structural OCT and visual acuity response. Red arrows indicate the injection dates in year 2014.
Discussion
When we first studied CNV response to anti-angiogenic treatment using infrequent OCT angiography scans coincident with treatment intervals, we found only small month-to-month reduction in CNV flow area and flow index that mirrored the slow resorption of fluid, as other investigators have also found.10,11 This series showed that the apparent slow response was likely an artifact of infrequent imaging. When imaged more frequently, this case demonstrated dramatic shutdown of CNV flow in the initial 2 weeks after anti-angiogenic injection, followed by re-appearance of channels at 4 weeks and re-accumulation of fluids at 6 weeks. To our knowledge, this is the first known short-interval dynamic analysis of CNV treatment response using OCT angiography. Rebound of CNV flow area may be a leading indicator that precedes fluid re-accumulation and visual decline. The time course in this case suggests that OCT angiography scans every 14 to15 days may be appropriate for determining the direction and rate of CNV flow area change and could provide information on whether extension of treatment interval would be successful. More study is needed to confirm this finding. If confirmed, then OCT angiography might be useful in guiding the proper selection of interval between injections so that fluid re-accumulation does not occur. It is also intriguing whether more frequent injections or continuous depot delivery of anti-angiogenic medication that do not allow the re-appearance of CNV channels might affect earlier and more permanent CNV regression.
SUMMARY STATEMENT.
This is the first known short-interval dynamic analysis of choroidal neovascularization (CNV) treatment response using Optical coherence tomography (OCT) angiography. OCT angiography parameters provide leading indicators of CNV activity that may be useful in guiding treatment.
Acknowledgement
This work was supported by NIH Grants R01EY024544, DP3 DK104397, R01EY023285, P30 EY010572, Clinical and Translational Science Awards grant (UL1TR000128) and an unrestricted grant from Research to Prevent Blindness.
Oregon Health & Science University (OHSU), David Huang, Yali Jia and Ou Tan have a significant financial interest in Optovue, Inc., a company that may have a commercial interest in the results of this research and technology.
Footnotes
Author Contributions: Drs. Huang and Lumbroso had full access to all of the data in the study and take responsibility for the integrity of the data and the accuracy of the data analysis.
Study concept and design: Huang, Lumbroso.
Acquisition, analysis, or interpretation of data: All authors.
Drafting of the manuscript: Huang, Jia.
Administrative, technical, or material support: All authors.
Study supervision: Huang, Lumbroso.
Conflict of Interest Disclosures: These potential conflicts of interest have been reviewed and managed by OHSU. Bruno Lumbroso is a consultant for Optovue, Inc. Marco Rispoli has no financial interest.
Reference
- 1.Rosenfeld PJ, Brown DM, Heier JS, et al. Ranibizumab for neovascular age-related macular degeneration. New England Journal of Medicine. 2006;355(14):1419–1431. doi: 10.1056/NEJMoa054481. [DOI] [PubMed] [Google Scholar]
- 2.Martin DF, G.Maguire M, Ying G-s, et al. Ranibizumab and Bevacizumab for Neovascular Age-Related Macular Degeneration. New England Journal of Medicine. 2011;364(20):1897–1908. doi: 10.1056/NEJMoa1102673. [DOI] [PMC free article] [PubMed] [Google Scholar]
- 3.Shienbaum G, Gupta OP, Fecarotta C, et al. Bevacizumab for neovascular age-related macular degeneration using a treat-and-extend regimen: clinical and economic impact. American Journal of Ophthalmology. 2012;153(3):468–473. e461. doi: 10.1016/j.ajo.2011.08.011. [DOI] [PubMed] [Google Scholar]
- 4.Martin DF, Maguire MG, Fine SL, et al. Ranibizumab and bevacizumab for treatment of neovascular age-related macular degeneration: two-year results. Ophthalmology. 2012;119(7):1388–1398. doi: 10.1016/j.ophtha.2012.03.053. [DOI] [PMC free article] [PubMed] [Google Scholar]
- 5.Jia Y, Tan O, Tokayer J, et al. Split-spectrum amplitude-decorrelation angiography with optical coherence tomography. Opt. Express. 2012;20(4):4710–4725. doi: 10.1364/OE.20.004710. [DOI] [PMC free article] [PubMed] [Google Scholar]
- 6.Kraus MF, Potsaid B, Mayer MA, et al. Motion correction in optical coherence tomography volumes on a per A-scan basis using orthogonal scan patterns. Biomed. Opt. Express. 2012;3(6):1182–1199. doi: 10.1364/BOE.3.001182. [DOI] [PMC free article] [PubMed] [Google Scholar]
- 7.Jia Y, Bailey ST, Wilson DJ, et al. Quantitative Optical Coherence Tomography Angiography of Choroidal Neovascularization in Age-Related Macular Degeneration. Ophthalmology. 2014;121(7):1435–1444. doi: 10.1016/j.ophtha.2014.01.034. [DOI] [PMC free article] [PubMed] [Google Scholar]
- 8.Jia Y, Bailey ST, Hwang TS, et al. Quantitative optical coherence tomography angiography of vascular abnormalities in the living human eye. Proceedings of the National Academy of Sciences. 2015 May 5;112(18):E2395–E2402. doi: 10.1073/pnas.1500185112. 2015. [DOI] [PMC free article] [PubMed] [Google Scholar]
- 9.Liu L, Gao SS, Bailey ST, Huang D, Li D, Jia Y. Automated choroidal neovascularization detection algorithm for optical coherence tomography angiography. [2015/09/01];Biomedical optics express. 2015 6(9):3564–3576. doi: 10.1364/BOE.6.003564. [DOI] [PMC free article] [PubMed] [Google Scholar]
- 10.Spaide RF. Optical Coherence Tomography Angiography Signs of Vascular Abnormalization With Antiangiogenic Therapy for Choroidal Neovascularization. American Journal of Ophthalmology. 2015;160(1):6–16. doi: 10.1016/j.ajo.2015.04.012. [DOI] [PubMed] [Google Scholar]
- 11.de Carlo TE, Bonini Filho MA, Chin AT, et al. Spectral-Domain Optical Coherence Tomography Angiography of Choroidal Neovascularization. Ophthalmology. 2015;122(6):1228–1238. doi: 10.1016/j.ophtha.2015.01.029. [DOI] [PubMed] [Google Scholar]


