

Abstract
BACKGROUND & AIMS
Phosphatidylcholines (PCs) are structural and functional constituents of cell membranes. The activity of acyltransferase (LPCAT) is required for addition of polyunsaturated fatty acids to the sn-2 position of PCs, and is therefore required to maintain cell membrane structure and function. LPCAT3 is the most abundant isoform of LPCAT in the small intestine and liver—are important sites of plasma lipoprotein metabolism. We investigated the effects of Lpcat3 disruption on lipid metabolism in mice.
METHODS
We disrupted the gene Lpcat3 in C57BL/6J mice to create LPCAT3 knockout (KO) mice. Livers and small intestinal tissues were collected from LPCAT3 KO and C57BL/6J parental strain (controls), and levels of LPCAT mRNAs and protein were measured. Levels of lipids and lipoproteins were measured in plasma samples. We isolated enterocytes from mice and measured levels of RNAs and proteins involved in lipid uptake by real-time PCR and immunoblot assays, respectively. We assessed lipid absorption and PC subspecies in the enterocyte plasma membrane using liquid chromatography with tandem mass spectometry.
RESULTS
LPCAT3 KO mice survived only 3 weeks after birth. Oil Red O staining showed that the control but not LPCAT3 KO mice accumulated lipids in the small intestine; levels of Niemann-Pick C1-like 1 (NPC1L1) and fatty acid transporter protein 4 (FATP4), which regulate lipid uptake, were greatly reduced in the small intestines of LPCAT3 KO mice. Oral administration of PC and olive oil allowed the LPCAT3 KO mice to survive, with the same body weights as controls, but the KO mice had shorter and wider small-intestinal villi and longer and bigger small intestines. Plasma membranes of enterocytes from LPCAT3 KO mice also had significant reductions in the composition of polyunsaturated PCs and reduced levels of NPC1L1, CD36, and FATP4 proteins. These reductions were associated with reduced intestinal uptake of lipid by the small intestine and reduced plasma levels of cholesterol, phospholipid, and triglyceride.
CONCLUSIONS
LPCAT3 KO mice have longer and larger small intestines than control mice, with shorter wide villi, reduced lipid absorption, and lower levels NPC1L1, CD36, and FATP4 proteins. Inhibition of LPCAT3 in the small intestine could be developed as an approach to treat hyperlipidemia.
Keywords: mouse model, lipid regulation, PUFA, phosphatidylcholine remodeling
INTRODUCTION
Phospholipids comprise the major lipids of cell membranes1 and are constituents of plasma lipoprotein2. Saturated and monounsaturated fatty acids are usually esterified at the sn-1 position, whereas polyunsaturated fatty acids (PUFAs) are esterified at the sn-2 position3. Phosphatidylcholines (PCs) represent 70% of phospholipids, and are synthesized de novo by the Kennedy pathway 4. The asymmetrical distribution of fatty acids at the sn-1 and sn-2 positions is maintained in part by a deacylation-reacylation process first proposed by Lands 55 years ago and known as Lands cycle3, 5. The deacylation step of the Lands cycle is catalyzed by calcium-independent phospholipase A2 (iPLA2), which removes saturated or monosaturated fatty acids from the sn-2 position of PCs. The reacylation step is catalyzed by lysophosphatidylcholine acyltransferase (LPCAT), which adds PUFA at the sn-2 position of PCs.
Fatty acids within membrane phospholipids of mammalian cells exhibit considerable structural diversity6. Unsaturated phospholipid fatty acids have kinks that prevent the molecules from packing together, enhancing membrane fluidity. An alteration in cell membrane fatty acid saturation has been implicated in a variety of disorders, including diabetes, obesity, and heart disease 7, 8. A growing body of evidence indicates that PUFA composition in membrane phospholipids is regulated by LPCATs 9, 10. Thus, LPCAT activities are important for maintaining cell membrane structure and fluidity.
LPCAT has four isoforms10. LPCAT3 is the major isoform in the liver and small intestine 11–13. It belongs to the membrane-bound O-acyltransferase (MBOAT) family, and encodes a protein of 487 amino acids with a calculated molecular mass of 56 kDa 11. LPCAT3 has distinct substrate preferences, strikingly consistent with a role in the Lands’ cycle. LPCAT3 prefers lysoPC with a saturated fatty acid at the sn-1 position, and exhibits an acyl donor preference toward PUFA-CoA at the sn-2 position, such as linoleoyl-CoA and arachidonoyl-CoA 11, 14. It has been reported that LPCAT3 activity is involved in PC remodeling and in turn has an impact on cell function 15, 16. LPCAT3 is also a target of liver X receptor (LXR) 13, 17, which regulates endoplasmic reticulum (ER) stress and inflammation through the regulation of LPCAT3 13.
Since the liver and small intestine are two key tissues involved in plasma lipoprotein metabolism, it is conceivable that changes to PC saturation in membrane enterocytes and hepatocytes could influence the function of membrane-bound transporters or receptors in lipid metabolism, thus influencing plasma lipid levels. In this study, we created Lpcat3 gene knockout (KO) mice to evaluate the function of LPCAT3 in lipid uptake and plasma lipoprotein metabolism.
Materials and Methods
Generation of LPCAT3 Knockout Mouse
Lpcat 3 has 13 exons, with a translation start codon (ATG) in the first exon. This gene is 41 kb in length. We replaced exons 2–12 (5,550 bp) with a Neo cassette and generated the “null” Lpcat 3 allele. To rescue the lethality of LPCAT3 KO male and female mice, we gavaged the newborns, starting from day 3 after birth, with PCs (P3556, sigma)/olive oil (0.5mg/ml, first week 10 μl/day, second week 20μl/day; and third week 50μl/day). At age 4-weeks old, the supplementation was stopped and the KO mice were fed chow diet same as WT animals. All mice, male or female, used in this study were 8–12 weeks old, with a C57BL/6J genetic background. The SUNY Downstate Medical Center Animal Care and Use Committee approved all animal procedures.
Lipoprotein and Apolipoprotein Assays
Lipoprotein and apolipoprotein in male mice were measured as described previously12.
Cholesterol Absorption
Cholesterol absorption studies were performed in male mice using a conventional fecal dual-isotope ratio method18.
Preparation of Primary Enterocytes and Hepatocytes
Primary enterocytes and hepatocytes were isolated according to 2 previous reports18, 19.
Total LPCAT Activity Assay
Total LPCAT activity was measured as described previously12.
Plasma Membrane and Lipid Rafts Isolation from Primary Enterocytes
Plasma membrane and lipid rafts were isolated from primary enterocytes according two protocols published by us20.
PC Measurement by Infusion-Based High-Resolution MS
PC subspecies were measured as described previously12.
ApoB-containing Lipoprotein (BLp) Production Rate Measurement (in vivo)
The BLp production rate was measured as described previously19.
Statistical Analysis
Data are expressed as mean ± SD. Data between two groups were analyzed by the unpaired, two-tailed Student’s t test, and among multiple groups by ANOVA followed by the Student-Newman-Keuls (SNK) test. A P value of less than 0.05 was considered significant.
RESULTS
LPCAT3 Global Deficiency Exhibited Neonatal lethality Which Can Be Rescued
Mouse LPCAT3 mRNA levels were measured by real-time PCR. The highest expression was observed in the liver and small intestine (Supplemental Figure 1A). LPCAT3 KO mice had no detectable LPCAT3 mRNA in the liver or small intestine (Figure 1B) and no compensatory up-regulation of LPCAT1, LPCAT2, and LPCAT4 mRNA or protein levels (Supplemental Figure 1B, 1C, 2A, and 2B) were observed.
Figure 1. Generation and characterization of LPCAT3 KO mouse.

(A) Strategy used to disrupt mouse Lpcat 3 gene. (B) LPCAT3 mRNA in small intestine and liver from 2-weeks-old WT and LPCAT3 KO mice. (C) Total cholesterol, phospholipid, and triglyceride levels in the plasma from 10-days-old WT and LPCAT3 KO mice. (D) Small intestine Oil Red O staining from 10-days old mice. (E) Small intestine NPC1L1 immunofluorescence staining from 10-days-old mice. (F), Small intestine FATP4 immunofluorescence staining from 10-days-old mice. FATP4 signal was indicated by red arrows. Values are mean ± SD, n = 5, *P < 0.05.
We found that the targeted allele exhibited Mendelian segregation (Supplemental Figure 1D). However, homozygous KO mice exhibited neonatal lethality within 3 weeks of birth. In addition, homozygous KO mice had significantly lower body weight than WT and heterozygous animals beginning at day 3 (Supplemental Figure 3). To find the cause of the neonatal lethality, we first measured the plasma lipids from 10-days-old mice and found that LPCAT3 deficiency significantly decreased plasma lipid levels (Figure 1C). The Oil Red O staining showed that the WT but not the KO mice accumulate lipids in their small intestine (Figure 1D), suggesting that the LPCAT3 deficiency may block lipid uptake. To explore the mechanisms, we used immunohistochemistry staining for Niemann-Pick C1-like 1 (NPC1L1) and fatty acid transporter protein 4 (FATP4), both are involved in lipid uptake, and found that both were dramatically decreased in the small intestine from the KO mice compared with controls (Figure 1E and 1F).
To rescue the LPCAT3 KO mice (both male and female) we tried several approaches. We gavaged the newborns (n=15) with fish oil or Total Parenteral Nutrition (first week 10 μl/day and second week 20μl/day), but both treatments did not work. We then tried olive oil (first week 10 μl/day, second week 20μl/day; and third week 50μl/day) on 15 KO animals, 40% of them could be rescued and finally we found that the KO mice can be mostly rescued (80%) by supplementing the newborns with PCs/olive oil. The KO mice gradually reached the body weights of their littermates once they began self-feeding. Although there was still a difference in body weight between KO and WT mice at 4 weeks (Figure 2A), they were indistinguishable at 8 weeks (Figure 2A).
Figure 2. The comparison between LPCAT3 KO and WT mice.

LPCAT3 KO mice (both male and female) were rescued with PC/olive oil. (A) Body weight comparison. LPCAT3 KO mice indicated by red arrows. (B) and (C) Small intestine length comparison. (D) Diameter comparison. (E) Villi comparison. Wider villi were indicated by red arrow heads. Values are Mean ± SD, n = 5, *P < 0.05.
Interestingly, at 8 weeks, the small intestine in the KO mice (both sex) was significantly longer (44%, P < 0.01; Figures 2B and 2C) and larger in diameter (105%, P < 0.001; Figures 2B and 2D) than in controls, with shorter and wider villi (Figure 2E). In contrast, no morphological changes were observed in LPCAT3-deficient livers compared with controls (Supplemental Figure 4).
LPCAT3 Deficiency Significantly Decreases LPCAT Activity in the Small Intestine and Liver, and Decreases Plasma Lipoprotein Levels
We measured total LPCAT activity and found that LPCAT3 deficiency dramatically decreased total LPCAT activity in the small intestine (85%; Figures 3A) and liver (68%; Figures 3A), indicating that other LPCAT isoforms do not compensate for the loss of the major isoform in these tissues.
Figure 3. Measurements of total LPCAT activity and plasma lipoprotein levels in WT and LPCAT3 KO mice.

(A) Total LPCAT activity in small intestine and liver of WT and LPCAT3 KO male mice, measured as described in “Experimental Procedures”. (B) Total cholesterol, phospholipid, and triglyceride levels in plasma. (C) Fluorogram of plasma apolipoprotein levels by Western blotting. Plasma (0.2 μL) was separated by 4–15% SDS-PAGE, and immunoblotted with polyclonal antibodies against apoA-I, apoB, apoE, and albumin. (D) Quantitation of plasma apoA-I, apoB, and apoE levels. (E) Plasma lipoprotein distribution by fast protein liquid chromatography (FPLC). Total cholesterol, phospholipids, and triglycerides were determined in each fraction. Values are mean ± SD, n = 5, *P < 0.05.
Next, we measured fasting plasma lipid levels in male mice. We found that a complete deficiency (as in the homozygous KO) significantly decreased the levels of plasma cholesterol (50%, P < 0.01), total phospholipids (52%, P < 0.01), and triglycerides (55%, P < 0.01) compared with controls (Figure 3B). We did not find significant changes to lipid levels in heterozygous mice. The female mice had very similar phenotype (data not shown).
Assessment of plasma apolipoprotein levels in LPCAT3 KO and control mice by reducing SDS-PAGE revealed a dramatic decrease in plasma apoA-I levels (61%, P < 0.001; Figures 3C and 3D). No significant changes to apoB or apoE levels were observed (Figures 3C and 3D). Moreover, we found that apoA-I protein, but not mRNA, levels in the KO enterocytes were significantly reduced (50%) (Supplemental Figure 5A, 5B, and 5C).
Plasma lipid distributions were examined by fast protein liquid chromatography (FPLC) using pooled plasma. We observed decreased cholesterol and total phospholipid levels in HDL and non-HDL fractions from KO mice compared with controls (Figures 3E). Non-HDL triglycerides were also dramatically decreased (Figure 3E).
To evaluate the effect of LPCAT3 deficiency on PCs in the blood, we measured plasma PC subspecies using LC/MS/MS. We found that sn-2 polyunsaturated PCs (16:0/18:2, 18:1/18:2; 18:1/18:3, and 18:0/20:4) were significantly decreased (Table 1), suggesting that LPCAT3 contributes significantly to circulating polyunsaturated PCs.
Table 1.
Measurement of PC subspecies by LC/MS/MS
| 16:0/16:0 | 16:0/18:2 | 18:0/18:0 | 18:0/18:1 | 18:1/18:1 | 18:1/18:2 | 18:1/18:3 | 18:0/20:4 | |
|---|---|---|---|---|---|---|---|---|
| Plasma (μg/mL) | ||||||||
| WT | 4±0.5 | 116±15 | 3±0.3 | 16±2 | 70±8 | 41±6 | 47±5 | 28±3 |
| LPCAT3 KO | 5±0.7 | 47±6** | 7±1* | 30±4* | 62±7 | 18±2** | 7±0.9** | 6±0.7** |
| Enterocyte plasma membrane (ng/mg protein) | ||||||||
| WT | 128±33 | 2182±261 | 106±19 | 560±79 | 2469±410 | 593±81 | 680±77 | 687±69 |
| LPCAT3 KO | 183±18* | 909±71** | 409±69** | 1511±169** | 1890±391 | 344±29* | 178±30** | 198±35** |
| Hepatocytes (ng/mg protein) | ||||||||
| WT | 110±25 | 1301±190 | 30±5 | 154±21 | 570±39 | 583±61 | 786±91 | 391±51 |
| LPCAT3 KO | 146±18* | 734±98* | 51±10* | 212±16* | 665±71 | 287±35** | 145±27** | 116±20** |
Value, mean ± SD; n = 5;
P < 0.05;
P < 0.01.
LPCAT3 Deficiency-mediated Reduction of Polyunsaturated PCs in the Enterocyte Membrane Diminishes Lipid Absorption
Because a defect in lipid uptake could account for the observed plasma lipid profile, we next assessed the absorption of triglycerides and cholesterol in male KO and WT mice (10-weeks), using [3H]triolein and [14C]cholesterol simultaneously. Mice were gavaged with both radiolabeled lipids, and then radioactivity in the blood was monitored for 24 hr. LPCAT3 deficiency significantly decreased [3H]-labeled glycerolipids (Figure 4A) and [14C]cholesterol in the blood (Figure 4B). We also assessed phospholipid absorption, using a [14C]phosphatidylcholine (PC) and found the PC absorption was significant reduced in the KO mice compared with controls (Supplemental Figure 6). Moreover, we also performed cholesterol absorption studies in the KO and WT mice using a conventional fecal dual-isotope ratio method 18, 21, followed by collection of feces for 48 hr. We found that KO mice absorbed significantly less cholesterol than controls (Figure 4C). Moreover, we fed both KO and WT mice a high-fat, high-cholesterol diet for 10 days, then collected feces for last 2 days and measured the lipids. We found that feces from KO mice contained more lipids (Figures 4D), suggesting again that LPCAT3 KO mice absorb less lipids from the diet.
Figure 4. Triglyceride and cholesterol absorption in LPCAT3 KO mice.

(A) and (B) male mice, at age 10-weeks-old, were gavaged with 0.2 μCi [3H]triolein and 0.1 μCi [14C]cholesterol in 15 μL olive oil. Blood was collected over 24 hr and measured for the presence of [3H]glycerolipids and [14C]cholesterol. (C) Mice were gavaged with 0.1 μCi [14C]cholesterol and 0.2 μCi [3H]sitostanol in 15 μL olive oil. Feces were collected for 48 hr and lipids were extracted for counting. (D) Mice (male) were fed a high-fat/cholesterol diet for 10 days, then feces were collected for 2 days and lipids were extracted to determine total cholesterol, triglyceride and phospholipid levels. (E) and (F) Western blots fluorogram and quantitation of NPC1L1, CD36, FATP4, ABCG8, ABCA1, and MTP in enterocyte homogenates from LPCAT3 KO and WT small intestine. β-Actin was used as a loading control. Values are mean ± SD, n = 4, *P < 0.05.
To explore the mechanisms underlying these changes, we isolated enterocytes from LPCAT3 KO and control mice and performed real-time PCR to measure mRNA levels for proteins involved in lipid uptake, including Niemann-Pick C1-like 1 (NPC1L1), CD36, ATP-binding cassette transporters 5 and 8 (ABCG5/8), and ABCA1. We found no significant change in any of these genes (Supplemental Table 1), suggesting that LPCAT3 deficiency may regulate these genes post-translationally. Previously, we reported that a liver-specific LPCAT3 knockdown significantly up-regulates microsomal triglyceride transfer protein (MTP)12. Here, we found that MTP mRNA was significantly increased in enterocytes of KO mice (Supplemental Table 1).
We then hypothesized that LPCAT3 deficiency may decrease polyunsaturated PCs in enterocyte apical membranes, resulting in diminished receptor density or membrane-associated transporter protein levels, thus reducing dietary lipid uptake and plasma lipid levels. We analyzed PC subspecies populations in the enterocyte plasma membrane using LC/MS/MS, and found that LPCAT3 deficiency decreased the amount of polyunsaturated PCs (16:0/18:2, 18:1/18:2, 18:1/18:3, and 18:0/20:4) in the membrane (Table 1). These changes could impact apical membrane lipid uptake. We also measured lysoPCs, and we did not find any significant changes (Supplemental Table 2).
Next, we measured NPC1L1, CD36, ABCG8, FATP4, ABCA1, and MTP protein levels by western blotting, and found that NPC1L1, CD36, and FATP4 protein levels were significantly decreased (Figures 4E and 4F), whereas ABCG8 and ABCA1 were not significantly affected (Figures 4E and 4F). In addition, MTP levels were increased (Figure 4E and 4F).
We further examined NPC1L1 and FATP4 protein levels in enterocytes from KO and WT mice by immunohistochemistry staining, and found that the both protein expression levels were greatly reduced in the KO mice (Figure 5A and 5B). This suggests that changes in PC content in the apical membrane of intestinal cells may diminish NPC1L1, CD36, and FATP4 levels, thus reducing uptake of both triglyceride and cholesterol.
Figure 5. Measurement of NPC1L1 and FATP4 protein levels in 10-weeks-old LPCAT3 KO and WT mice.

(A) Small intestine NPC1L1 immuno-staining. (B) Small intestine FATP4 immuno-staining. (C) and (D) Western blot fluorogram and quantitation of NPC1L1 in lipid rafts fractions from primary enterocytes. Lyn Kinase was used as marker for lipid rafts and non-rafts. Values are mean ± SD, n = 4, *P < 0.01.
Lipid rafts are highly packed microdomains on the plasma membrane enriched in cholesterol and sphingomyelin. Lipid rafts contain more saturated PCs than that in non-rafts22. To investigate the impact of polyunsaturated PC reduction in NPC1L1 membrane distribution, we isolated lipid rafts from primary enterocytes and measured NPC1L1 protein levels in each fraction by Western blot. As indicated in Figures 5C and 5D, NPC1L1 levels in both lipid rafts and non-rafts regions were significantly decreased in the KO mice compared with controls. However, the reduction in non-rafts was much bigger than that in rafts, suggesting that LPCAT3 deficiency has much bigger influence on non-rafts regions.
Impact of Reduced Polyunsaturated PCs on the Liver
Plasma lipid levels are decreased in LPCAT3 KO mice (Figures 3B and 3E), which might be partially explained by a defect in liver lipoprotein production. Thus, we next asked whether LPCAT3 deficiency could also reduce polyunsaturated PC levels in hepatocyte membranes, and if this could prevent BLp and HDL production. We first measured PC subspecies from liver homogenates using LC/MS/MS, and found that LPCAT3 deficiency decreased polyunsaturated PCs (16:0/18:2, 18:1/18:2, 18:1/18:3, and 18:0/20:4) in the liver (Table 1). We also measured lysoPC levels, and we found that lysoPC20:4 was significantly decreased and lysoPC22:6 was significantly increased, which were similar to a previous report23 (Supplemental Table 2).
We next measured ABCA1, SR-BI, and MTP mass in liver homogenates, since ABCA1 and SR-BI are involved in HDL metabolism, while MTP is involved in BLp production. We found that ABCA1but not SR-BI was significantly reduced (Figures 6A and 6B). In addition, MTP protein levels were significantly increased in livers from KO mice (Figures 6A and 6B), suggesting that these changes may compensate for loss of LPCAT3 in the liver.
Figure 6. Western blot of ABCA1, SR-BI, and MTP in liver homogenates, as well as lipoprotein production in vivo.
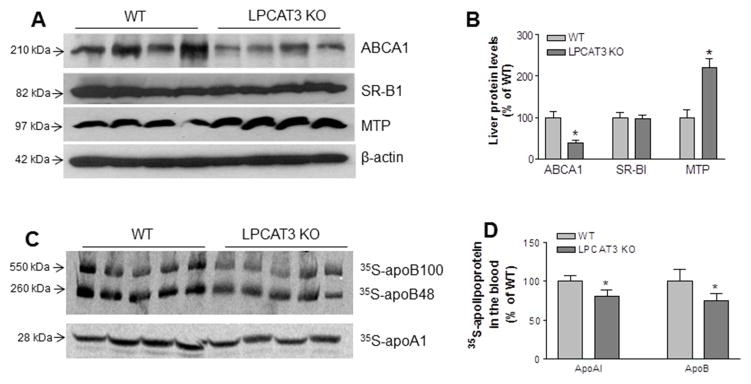
(A) Fluorogram of liver ABCA1, SR-BI, MTP, and β-actin (loading control). (B) Quantitation of ABCA1, SR-BI, and MTP in the liver. (C) In vivo VLDL and HDL production measurement. Fluorogram of plasma 35S-apoB and 35S-apoA-I on VLDL and HDL, respectively. (D) Quantitation of 35S-apoB and 35S-apoA-I in blood. Values are mean ± SD, n = 4–5, *P < 0.05.
We then analyzed nascent BLp and HDL production directly. LPCAT3 KO and WT mice, at age 12 weeks, were simultaneously injected with [35S]methionine (to label apoB and apoA-I) and Poloxamer 407 (to block clearance of VLDL from the circulation). Plasma was collected 120 min after injection, and VLDL and HDL were isolated by ultracentrifugation. Both [35S]apoB and [35S]apoA-I levels were slightly but significantly decreased in VLDL and HDL from LPCAT3 KO mice, respectively (Figures 6C and 6D).
LPCAT3 Can Be Regulated by Peroxisome Proliferator-Activated Receptorα (PPARα) and Liver X Receptor (LXR)
It has been reported that LPCAT3 is an important mediator of LXR-related metabolic effects 13. We confirmed this observation by using an LXR agonist (T0901317) (Supplemental Figures 7A and 7B). We also treated mice with a PPARα agonist (Fenobibrate) and found LPCAT3 mRNA levels could be up-regulated in the liver but not in small intestine (Supplemental Figures 7C and 7D).
Although it is known that PPARα agonists up-regulate LPCAT3 mRNA in the liver in vivo 24, the molecular mechanism governing this regulation is unknown. Through bioinformatics analysis of the proximal promoter of the human Lpcat 3 gene, we identified four potential PPARα-responsive elements (PPREs; Supplemental Figure 8A) and studied their functional relevance using a reporter system. A 1-kb promoter fragment covering all four responsive elements was subcloned into a pGL3 reporter construct, and a series of deletion constructs was made (Supplemental Figure 8B). The promoter-reporter constructs were transfected into Huh7 cells (human hepatoma cell line) with or without co-transfection with PPARα. The cultured cells were then treated with a PPARα agonist (WY14643) or vehicle (DMSO) as a control. Under basal conditions without nuclear receptor co-transfection, the PPARα agonist caused only minimal reporter activation. With co-transfection of PPARα, however, the agonist significantly increased reporter activity in all constructs, indicating that the responsive element may primarily reside within PPRE1. Using a gel shift assay, PPRE1 binding to a PPARα/RXRα heterodimer was confirmed. The WT oligonucleotide, but not the mutant oligonucleotide, effectively competed for binding, suggesting that PPARα and RXRα directly and specifically bind to PPRE1 to mediate Lpcat 3 transcription (Supplemental Figure 8C).
The transcriptional regulation of LPCAT3 by PPARα was further studied using chromatin immunoprecipitation (ChIP). We injected (i.p.) WT mice (C57BL/6) with fenofibrate (another PPARα agonist, 300 mg/kg/day) and found that the treatment significantly increased PPARα binding to PPRE1 in the liver, demonstrating the role of PPARα in regulating LPCAT3 in vivo (Supplemental Figure 8D).
It has been reported that LPCAT3 was protective against ER stress in the liver13. To see the same effect on the small intestine, we measured mRNA levels for ER stress markers, such as Ire1α, Bip, and Perk, and we did not find any significant changes between LPCAT3 KO and WT enterocytes (Supplemental Figure 9A). We also measured mRNA level of Ki-67, a cell proliferation marker, and did not find changes (Supplemental Figure 9B). Finally, we immuno-stained caspase-3 on the jejunum from the KO and WT mice and we also did not find significant changes, in terms of caspase-3 positive cells/crypt (Supplemental Figure 9C and 9D).
DISCUSSION
In this study, we have demonstrated a novel, essential role for LPCAT3 in modulating PC composition in enterocyte plasma membranes, thereby influencing lipid uptake and plasma lipoprotein metabolism. Our conclusions are based on the following observations: 1) LPCAT3 KO mice had neonatal lethality that was rescued by PC/olive oil supplementation; 2) the rescued LPCAT3 KO mice had a longer small intestine with a larger diameter and shorter, wider villi; 3) LPCAT3 deficiency diminished NPC1L1, CD36, and FATP4 protein levels in enterocytes and reduced lipid uptake in the small intestine; 4) LPCAT3 deficiency decreased both VLDL and HDL production from the liver; and 5) all plasma lipids (cholesterol, phospholipids, and triglycerides) and all plasma lipoproteins (HDL and non-HDL) were significantly decreased in LPCAT3 KO mice. LPCAT3-mediated PC remodeling was controlled by LXR in the liver and small intestine (Supplemental Figures 7A and 7B) and PPARs in the liver but not in the small intestine (Supplemental Figures 7C and 7D). We believe that whole-body LPCAT3 deficiency resulted mainly in reduced polyunsaturated PCs in enterocyte membranes (Table 1), which in turn increased membrane rigidity, leading to reduced levels of lipid absorption-related proteins on the membrane and less circulating lipid (Figures 4E–4F and Figure 5).
LPCAT3 deficiency–related neonatal lethality could be rescued. The targeted Lpcat3 allele segregated in a Mendelian fashion, with homozygous KO mice having phenotypically smaller bodies (Figure 2A) and exhibiting neonatal lethality. We successfully utilized PCs in olive oil to rescue these mice. These data suggest that LPCAT3 deficiency influences the normal function of the small intestine. There could be a defect of enterocyte apical surface due to less polyunsaturated PCs. The nutrients from the milk could not be normally absorbed by the small intestine, thus, the KO mice are much smaller than their littermates and died at age 2–3 weeks. Exogenous PCs, especially polyunsaturated varieties, may allow for abrogation of enterocyte rigidity and exogenous polyunsaturated fatty acid from olive oil could provide substrates for LPCATs other than LPCAT3.
Although the majority of LPCAT3 KO mice could be rescued, abnormalities were present in the survivors. This phenomenon is not uncommon. One good example is lipoprotein lipase (LPL)-deficient mice. Although the neonatal lethality of LPL deficiency can be rescued by crossing the KO mice with LPL transgenic mice, these animals have dramatically higher plasma triglyceride levels 25. Indeed, the rescued LPCAT3 KO mice have many abnormalities. It appears that the small intestines of KO mice have attempted to partially compensate for the lack of LPCAT3, and have longer small intestines with a larger diameter (Figures 2B–2D), shorter and wider villi (Figure 2E).
LPCAT3 activity in the small intestine and liver was closely related to lipid levels in the blood. We found that LPCAT3 deficiency significantly decreased all circulating lipids and lipoproteins (Figures 3B–3E). The lack of lipid absorption in the small intestine could be the major reason for the lack of circulating lipids and lipoproteins (Figures 4A–4D). However, apoB levels were an exception, as they were not significantly different in KO versus WT plasma (Figures 3C and 3D). Previously, we reported that a liver-specific LPCAT3 knockdown causes an increase in apoB production through up-regulation of MTP in the tissue 12. In LPCAT3 KO mice, MTP was also significantly up-regulated in small intestine and liver (Figures 4E and 6A); however, plasma triglyceride, total cholesterol, and phospholipid levels were significantly reduced (Figure 3B). Thus, the overwhelming defect appears to be in lipid uptake, and MTP up-regulation has only a minor or compensational effect.
LPCAT3 deficiency diminished lipid absorption in the small intestine. Cholesterol uptake in enterocytes is a balance between intake by NPC1L1 26 and excretion by ABCG5/8 27. Other proteins such as CD36 are also involved in cholesterol uptake at the apical surface of the small intestine 28, 29. Free fatty acid uptake in enterocytes is mediated by CD36 29, plasma membrane-associated fatty acid binding protein (FABPpm); 30, and fatty acid transport protein 4 (FATP4) 31. Except FATP4, all of these effectors are located in apical membranes of enterocytes28, making it conceivable that the LPCAT3 deficiency–mediated reduction of polyunsaturated PCs in enterocyte apical membranes could influence the levels of these proteins, thereby diminishing lipid uptake, absorption, and plasma lipid levels. Indeed, we found that NPC1L1, CD36, and FATP4 protein levels (Figures 4E and 4F), but not mRNA levels (Supplemental Table 1), were significantly decreased in LPCAT3-deficient small intestine, thus reducing both cholesterol and triglyceride absorption (Figures 4A–4D). Lowering plasma cholesterol is important because this factor relates to various cardiovascular and metabolic disorders. A sufficient amount of plasma cholesterol is derived by intestinal absorption 32.
The dramatic reduction of apoA-I (Figure 3C) can be mainly explained by the reduction of lipid absorption. It is well known that the small intestine is a source of apoA-I33, 34. After ingestion of fat, normal human subjects showed a significant increase of plasma apoA-I35. It has been reported that there is a rapid transfer of chylomicron apoA-I radioactivity into HDL36. The liver is also an important tissues in the synthesis and secretion of apoA-I37 which is the major apolipoprotein in HDL. It is conceivable that changes in polyunsaturated PC levels of plasma membranes could also influence apoA-I production as well as the levels of HDL metabolism-related receptors or transporters. Indeed, LPCAT3 deficiency significantly reduced ABCA1 but not SR-BI protein levels in the liver (Figures 6A and 6B) and slightly but significantly reduced apoA-I production in the liver (Figures 6C and 6D). Overall, the significant reduction of cholesterol, triglyceride, and phospholipid absorption in the small intestine is the major reason for the reduction of apoA-I levels, observed in LPCAT3 KO mice.
It has been shown that LXR regulates phospholipid fatty acyl composition through regulation of LPCAT3 in the liver and macrophages13, 17. We showed that LPCAT3 expression in the small intestine and liver could be up-regulated by LXR (Supplemental Figures 7A and 7B), illustrating that LPCAT3 is an important mediator of LXR effects on metabolism in both the liver and small intestine.
In this report, we have presented evidence that LPCAT3 was directly regulated by PPARα in the liver but not in small intestine (Supplemental Figures 7C and 7D). The authenticity of PPRE1 was corroborated in the PPARα reporter assay, gel shift assay, and ChIP study (Supplemental Figures 8B and 8D). Thus, LPCAT3 is also an important mediator of PPAR effects on metabolism in the liver, besides LXR.
While writing this manuscript, two related papers have been published. Rong et al. and Hashidate-Yoshida et al. indicated that Lpcat3-mediated enrichment of arachidonate on PC is critical in triglyceride-rich lipoprotein production23, 38. Although both groups also used LPCAT3 KO mice, they did not rescue the neonatal lethality and only described the phenotype in early newborns or later embryos. Moreover, Rong et al previously reported that acute knockdown of LPCAT3 expression in livers of genetically obese mice exacerbated lipid-induced ER stress13. However, the same group of researchers reported23 that genetic deletion of LPCAT3 from the liver did not influence the expression of ER stress markers. We also observed same phenomena (Supplemental Fig. 9A). These observations suggest that there may be compensatory responses in membrane composition that prevent induction of the ER stress response in the setting of chronic LPCAT3 deletion.
In summary, LPCAT3 deficiency caused neonatal lethality that could typically be rescued by PC/olive oil supplementation. LPCAT3 deficiency significantly reduced polyunsaturated PC levels in the plasma membrane of enterocytes, which in turn attenuated lipid absorption and decreased plasma lipid levels. Inhibition of LPCAT3 in the small intestine could be a novel approach for the treatment of hyperlipidemia.
Supplementary Material
Supplemental Figure 1. LPCAT3 is the major LPCAT in small intestine and liver. (A) LPCAT3 mRNA in different mouse tissues measured by real-time PCR using total RNA. Adi, adipose tissue; Pan, pancreas; SI, small intestine; Spl, spleen; and Stom, stomach. (B) and (C) LPCAT1-4 mRNAs in the liver and small intestine of WT and LPCAT3 KO mice. Values are mean ± SD, n = 5. (D) Mendelian segregation of targeted LPCAT3 KO allele. Genomic DNA was extracted from the tail tip of 2-week-old mice for PCR analysis. WT mice have a 222-bp fragment, homozygous KO mice have a 326-bp fragment, and heterozygous mice have both.
Supplemental Figure 2. Western blots of LPCAT1, LPCAT2, and LPCAT4. (A) LPCAT1, 2, and 4 protein levels in enterocytes from WT and LPCAT3 KO enterocyte homogenates. (B) LPCAT1, 2, and 4 protein levels in liver from WT and LPCAT3 KO liver homogenates. Values are mean ± SD, n = 4.
Supplemental Figure 3. LPCAT3 deficient mice are smaller than WT mice. A representative litter of mice was monitored at 3, 5, 7, and 10 d after birth. Red arrows indicate homozygous KO mice. This is the representative of more than 30 litters. The KO mice were male and female. The average body weight (WT vs. KO) for day 3, day 5, day 7, and day 10 were: 2.5 ± 0.08g vs 1.4 ± 0.05g; 3.8 ± 0.25 vs 2.5 ± 0.12g; 5 ± 0.9 vs 3 ± 0.5g; and 7 ± 1.2 vs 3.5 ± 0.8g. Values are mean ± SD, n = 6.
Supplemental Figure 4. LPCAT3 deficient mice have normal liver morphology. Livers from LPCAT3 KO and WT mice were sectioned and stained with H&E. Representative images are shown (n = 5 animals of each type).
Supplemental Figure 5. ApoA-I protein and mRNA in enterocytes. (A) Western blots of apoA-I in WT and LPCAT3 KO enterocyte homogenates. (B) Quantification of apoA-I protein levels. (C) apoA-I mRNA levels in WT and LPCAT3 KO enterocytes. Values are mean ± SD, n = 4. *P<0.01.
Supplemental Figure 6. Phospholipid absorption in LPCAT3 KO mice. Male mice, at age 10-weeks-old, were gavaged with 0.1 μCi L-α-1-palmitory-2-arachidonyl-phosphatidylcholin [arachidonyl-1-14C] in 15 μL olive oil. Blood was collected over 8 hr and measured for the presence of [14C]-glycerolipids. Values are mean ± SE, n = 4. *P<0.05.
Supplemental Figure 7. LPCAT3 can be regulated by LXR and PPARs. (A) and (B), WT mice (C57BL/6) were treated with LXR agonist (T0901317, 35 mg/kg/d) or vehicle for 4 days. (C) and (D), WT mice (C57BL/6) were treated with PPARα agonist (Fenofibrate, 300 mg/kg/d) or vehicle for 4 days. Liver and small intestine LPCAT3 mRNA was measured by real-time PCR. Values are mean ± SD, n = 5, *P < 0.05, **P < 0.01.
Supplemental Figure 8. LPCAT3 promoter region contains functional PPAR-responsive elements (PPREs). (A) Four candidate PPREs are illustrated within the 1-kb region of the human LPCAT3 promoter. PPRE1 is conserved in mouse, rat, bovine and human LPCAT3 promoters. (B) The proximal PPRE1 is sufficient for PPARα response. A series of promoter-reporter deletion constructs were made. Huh7 cells were co-transfected with PPAR-reporter vector or negative control (pGL3) vector along with PPARα expression vector. After 16 hr, transfection medium was changed to growth medium. After 24 hr of transfection, cells were treated with PPARα agonist (WY14643, 20 μM). After 18 hr treatment, luciferase assays were performed, and relative reporter activity (percentage) was determined. Values are mean ± SD, n = 3. (C) PPARα binds to PPRE1. Electrophoretic mobility shift assays were performed with 32P-labeled fragments of the LPCAT3 promoter extending from nt −133 to −97 in the presence of PPARα, RXRα, or both. Arrow indicates the position of the PPARα/RXRα complex. WT and mutant (mut) oligonucleotide competitors were included at a 5-fold or 25-fold molar excess. Sequences of the WT and mutant oligonucleotides are shown with putative nuclear receptor half-site sequences capitalized. A representative blot from three independent experiments is shown. (D) Chromatin immunoprecipitation (ChiP) assay on liver of WT mice. C57BL/6 mice were injected with fenofribrate (300 mg/kg/day) for 10 days. The ChiP analysis was carried out using IgG or anti-PPARα antibody. The procedure was as described in Experimental Procedures. A representative blot from three independent experiments is shown.
Supplemental Figure 9. Effect of LPCAT3 deficiency on apoptosis, ER stress, and proliferation. (A) Real-time PCR for ER stress markers: Ire1α, Bip, and Perk. (B) Real-time PCR for cell proliferation marker: Ki-67. (C) Small intestine caspase 3 immunostaining. (D) Quantification of caspase 3 levels. Values are mean ± SD, n = 4.
Supplemental Table 1. mRNA measurement by real-time PCR
Value, mean ± SD, n = 5, *P < 0.01.
Supplemental Table 2. Measurement of LysoPC subspecies by LC/MS/MS
Value, mean ± SD; n = 5; *P < 0.05.
Acknowledgments
This work was supported by grants VA Merit 000900-01 (XCJ), NIH-R56HL121409 (XCJ) and NSF China 31371190 (XCJ), as well as Scientist Development Grant 10SDG4040054 from the AHA (ZL).
Abbreviations used in this paper
- LPCAT
lysophosphatidylcholine acyltransferase
- PC
phosphatidylcholine
- FPLC
fast protein liquid chromatography
- NPC1L1
Niemann-Pick C1-like 1
- FATP4
fatty acid transport protein 4
- VLDL
very low density lipoprotein
- HDL
high density lipoprotein
- BLp
apoB-containing Lipoprotein
- LXR
liver X receptor
- PPAR
peroxisome proliferator-activated receptor
Footnotes
Contributions:
Zhiqiang Li prepared Lpcat 3 KO mice, used PC/olive oil to rescue the animals, measured plasma lipids and lipoproteins, measured lipid absorption in the small intestine and lipoprotein production from the liver, isolated enterocytes and enterocyte membrane, performed all the Western blots and real-time PCRs on the animals or isolated primary cells. Hui Jiang performed all PPAR and LXR experiments. Tingbo Ding performed LPCAT activity analysis. Caixia Lou performed partial plasma lipid analyses. Hai H. Bui and Ming-Shang Kuo performed LC/MS/MS for PC species measurement. Xian-Cheng Jiang, as the corresponding author, designed the whole project, interpreted the results, and wrote up the manuscript.
Conflict of interest:
None
Publisher's Disclaimer: This is a PDF file of an unedited manuscript that has been accepted for publication. As a service to our customers we are providing this early version of the manuscript. The manuscript will undergo copyediting, typesetting, and review of the resulting proof before it is published in its final citable form. Please note that during the production process errors may be discovered which could affect the content, and all legal disclaimers that apply to the journal pertain.
References
- 1.van Meer G, Voelker DR, Feigenson GW. Membrane lipids: where they are and how they behave. Nat Rev Mol Cell Biol. 2008;9:112–24. doi: 10.1038/nrm2330. [DOI] [PMC free article] [PubMed] [Google Scholar]
- 2.Schiller J, Zschornig O, Petkovic M, et al. Lipid analysis of human HDL and LDL by MALDI-TOF mass spectrometry and (31)P-NMR. J Lipid Res. 2001;42:1501–8. [PubMed] [Google Scholar]
- 3.Lands WE. Stories about acyl chains. Biochim Biophys Acta. 2000;1483:1–14. doi: 10.1016/s1388-1981(99)00177-8. [DOI] [PubMed] [Google Scholar]
- 4.Kennedy EP, Weiss SB. The function of cytidine coenzymes in the biosynthesis of phospholipides. J Biol Chem. 1956;222:193–214. [PubMed] [Google Scholar]
- 5.Lands WE. Metabolism of glycerolipides; a comparison of lecithin and triglyceride synthesis. J Biol Chem. 1958;231:883–8. [PubMed] [Google Scholar]
- 6.MacDonald JI, Sprecher H. Phospholipid fatty acid remodeling in mammalian cells. Biochim Biophys Acta. 1991;1084:105–21. doi: 10.1016/0005-2760(91)90209-z. [DOI] [PubMed] [Google Scholar]
- 7.Clandinin MT, Cheema S, Field CJ, et al. Dietary fat: exogenous determination of membrane structure and cell function. FASEB J. 1991;5:2761–9. doi: 10.1096/fasebj.5.13.1916101. [DOI] [PubMed] [Google Scholar]
- 8.Ntambi JM. The regulation of stearoyl-CoA desaturase (SCD) Prog Lipid Res. 1995;34:139–50. doi: 10.1016/0163-7827(94)00010-j. [DOI] [PubMed] [Google Scholar]
- 9.Lee HC, Inoue T, Imae R, et al. Caenorhabditis elegans mboa-7, a member of the MBOAT family, is required for selective incorporation of polyunsaturated fatty acids into phosphatidylinositol. Mol Biol Cell. 2008;19:1174–84. doi: 10.1091/mbc.E07-09-0893. [DOI] [PMC free article] [PubMed] [Google Scholar]
- 10.Hishikawa D, Shindou H, Kobayashi S, et al. Discovery of a lysophospholipid acyltransferase family essential for membrane asymmetry and diversity. Proc Natl Acad Sci U S A. 2008;105:2830–5. doi: 10.1073/pnas.0712245105. [DOI] [PMC free article] [PubMed] [Google Scholar]
- 11.Zhao Y, Chen YQ, Bonacci TM, et al. Identification and characterization of a major liver lysophosphatidylcholine acyltransferase. J Biol Chem. 2008;283:8258–65. doi: 10.1074/jbc.M710422200. [DOI] [PubMed] [Google Scholar]
- 12.Li Z, Ding T, Pan X, et al. Lysophosphatidylcholine acyltransferase 3 knockdown-mediated liver lysophosphatidylcholine accumulation promotes very low density lipoprotein production by enhancing microsomal triglyceride transfer protein expression. J Biol Chem. 2012;287:20122–31. doi: 10.1074/jbc.M111.334664. [DOI] [PMC free article] [PubMed] [Google Scholar]
- 13.Rong X, Albert CJ, Hong C, et al. LXRs regulate ER stress and inflammation through dynamic modulation of membrane phospholipid composition. Cell Metab. 2013;18:685–97. doi: 10.1016/j.cmet.2013.10.002. [DOI] [PMC free article] [PubMed] [Google Scholar]
- 14.Kazachkov M, Chen Q, Wang L, et al. Substrate preferences of a lysophosphatidylcholine acyltransferase highlight its role in phospholipid remodeling. Lipids. 2008;43:895–902. doi: 10.1007/s11745-008-3233-y. [DOI] [PubMed] [Google Scholar]
- 15.Jain S, Zhang X, Khandelwal PJ, et al. Characterization of human lysophospholipid acyltransferase 3. J Lipid Res. 2009;50:1563–70. doi: 10.1194/jlr.M800398-JLR200. [DOI] [PMC free article] [PubMed] [Google Scholar]
- 16.Ariyama H, Kono N, Matsuda S, et al. Decrease in membrane phospholipid unsaturation induces unfolded protein response. J Biol Chem. 2010;285:22027–35. doi: 10.1074/jbc.M110.126870. [DOI] [PMC free article] [PubMed] [Google Scholar]
- 17.Ishibashi M, Varin A, Filomenko R, et al. Liver x receptor regulates arachidonic acid distribution and eicosanoid release in human macrophages: a key role for lysophosphatidylcholine acyltransferase 3. Arterioscler Thromb Vasc Biol. 2013;33:1171–9. doi: 10.1161/ATVBAHA.112.300812. [DOI] [PubMed] [Google Scholar]
- 18.Iqbal J, Hussain MM. Evidence for multiple complementary pathways for efficient cholesterol absorption in mice. J Lipid Res. 2005;46:1491–501. doi: 10.1194/jlr.M500023-JLR200. [DOI] [PubMed] [Google Scholar]
- 19.Jiang XC, Qin S, Qiao C, et al. Apolipoprotein B secretion and atherosclerosis are decreased in mice with phospholipid-transfer protein deficiency. Nat Med. 2001;7:847–52. doi: 10.1038/89977. [DOI] [PubMed] [Google Scholar]
- 20.Li Z, Zhang H, Liu J, et al. Reducing plasma membrane sphingomyelin increases insulin sensitivity. Mol Cell Biol. 2011;31:4205–18. doi: 10.1128/MCB.05893-11. [DOI] [PMC free article] [PubMed] [Google Scholar]
- 21.Liu R, Iqbal J, Yeang C, et al. Phospholipid transfer protein-deficient mice absorb less cholesterol. Arterioscler Thromb Vasc Biol. 2007;27:2014–21. doi: 10.1161/ATVBAHA.107.149914. [DOI] [PubMed] [Google Scholar]
- 22.de Almeida RF, Fedorov A, Prieto M. Sphingomyelin/phosphatidylcholine/cholesterol phase diagram: boundaries and composition of lipid rafts. Biophys J. 2003;85:2406–16. doi: 10.1016/s0006-3495(03)74664-5. [DOI] [PMC free article] [PubMed] [Google Scholar]
- 23.Rong X, Wang B, Dunham MM, et al. Lpcat3-dependent production of arachidonoyl phospholipids is a key determinant of triglyceride secretion. Elife. 2015;4 doi: 10.7554/eLife.06557. [DOI] [PMC free article] [PubMed] [Google Scholar]
- 24.Zhao Y, Chen YQ, Bonacci TM, et al. Identification and characterization of a major liver lysophosphatidylcholine acyltransferase. J Biol Chem. 2008;283:8258–65. doi: 10.1074/jbc.M710422200. Epub 2008 Jan 14. [DOI] [PubMed] [Google Scholar]
- 25.Merkel M, Weinstock PH, Chajek-Shaul T, et al. Lipoprotein lipase expression exclusively in liver. A mouse model for metabolism in the neonatal period and during cachexia. J Clin Invest. 1998;102:893–901. doi: 10.1172/JCI2912. [DOI] [PMC free article] [PubMed] [Google Scholar]
- 26.Altmann SW, Davis HR, Jr, Zhu LJ, et al. Niemann-Pick C1 Like 1 protein is critical for intestinal cholesterol absorption. Science. 2004;303:1201–4. doi: 10.1126/science.1093131. [DOI] [PubMed] [Google Scholar]
- 27.Yu L, York J, von Bergmann K, et al. Stimulation of cholesterol excretion by the liver X receptor agonist requires ATP-binding cassette transporters G5 and G8. J Biol Chem. 2003;278:15565–70. doi: 10.1074/jbc.M301311200. [DOI] [PubMed] [Google Scholar]
- 28.Pan X, Hussain MM. Gut triglyceride production. Biochim Biophys Acta. 2012;1821:727–35. doi: 10.1016/j.bbalip.2011.09.013. [DOI] [PMC free article] [PubMed] [Google Scholar]
- 29.Nassir F, Wilson B, Han X, et al. CD36 is important for fatty acid and cholesterol uptake by the proximal but not distal intestine. J Biol Chem. 2007;282:19493–501. doi: 10.1074/jbc.M703330200. [DOI] [PubMed] [Google Scholar]
- 30.Stremmel W, Lotz G, Strohmeyer G, et al. Identification, isolation, and partial characterization of a fatty acid binding protein from rat jejunal microvillous membranes. J Clin Invest. 1985;75:1068–76. doi: 10.1172/JCI111769. [DOI] [PMC free article] [PubMed] [Google Scholar]
- 31.Stahl A, Hirsch DJ, Gimeno RE, et al. Identification of the major intestinal fatty acid transport protein. Mol Cell. 1999;4:299–308. doi: 10.1016/s1097-2765(00)80332-9. [DOI] [PubMed] [Google Scholar]
- 32.Gylling H, Miettinen TA. The effect of cholesterol absorption inhibition on low density lipoprotein cholesterol level. Atherosclerosis. 1995;117:305–8. doi: 10.1016/0021-9150(95)05566-f. [DOI] [PubMed] [Google Scholar]
- 33.Glickman RM, Kirsch K. Lymph chylomicron formation during the inhibition of protein synthesis. Studies of chylomicron apoproteins. J Clin Invest. 1973;52:2910–20. doi: 10.1172/JCI107487. [DOI] [PMC free article] [PubMed] [Google Scholar]
- 34.Glickman RM, Green PH. The intestine as a source of apolipoprotein A1. Proc Natl Acad Sci U S A. 1977;74:2569–73. doi: 10.1073/pnas.74.6.2569. [DOI] [PMC free article] [PubMed] [Google Scholar]
- 35.Glickman RM, Green PH, Lees RS, et al. Apoprotein A-I synthesis in normal intestinal mucosa and in Tangier disease. N Engl J Med. 1978;299:1424–7. doi: 10.1056/NEJM197812282992602. [DOI] [PubMed] [Google Scholar]
- 36.Tall AR, Green PH, Glickman RM, et al. Metabolic fate of chylomicron phospholipids and apoproteins in the rat. J Clin Invest. 1979;64:977–89. doi: 10.1172/JCI109564. [DOI] [PMC free article] [PubMed] [Google Scholar]
- 37.Wu AL, Windmueller HG. Relative contributions by liver and intestine to individual plasma apolipoproteins in the rat. J Biol Chem. 1979;254:7316–22. [PubMed] [Google Scholar]
- 38.Hashidate-Yoshida T, Harayama T, Hishikawa D, et al. Fatty acid remodeling by LPCAT3 enriches arachidonate in phospholipid membranes and regulates triglyceride transport. Elife. 2015;4 doi: 10.7554/eLife.06328. [DOI] [PMC free article] [PubMed] [Google Scholar]
Associated Data
This section collects any data citations, data availability statements, or supplementary materials included in this article.
Supplementary Materials
Supplemental Figure 1. LPCAT3 is the major LPCAT in small intestine and liver. (A) LPCAT3 mRNA in different mouse tissues measured by real-time PCR using total RNA. Adi, adipose tissue; Pan, pancreas; SI, small intestine; Spl, spleen; and Stom, stomach. (B) and (C) LPCAT1-4 mRNAs in the liver and small intestine of WT and LPCAT3 KO mice. Values are mean ± SD, n = 5. (D) Mendelian segregation of targeted LPCAT3 KO allele. Genomic DNA was extracted from the tail tip of 2-week-old mice for PCR analysis. WT mice have a 222-bp fragment, homozygous KO mice have a 326-bp fragment, and heterozygous mice have both.
Supplemental Figure 2. Western blots of LPCAT1, LPCAT2, and LPCAT4. (A) LPCAT1, 2, and 4 protein levels in enterocytes from WT and LPCAT3 KO enterocyte homogenates. (B) LPCAT1, 2, and 4 protein levels in liver from WT and LPCAT3 KO liver homogenates. Values are mean ± SD, n = 4.
Supplemental Figure 3. LPCAT3 deficient mice are smaller than WT mice. A representative litter of mice was monitored at 3, 5, 7, and 10 d after birth. Red arrows indicate homozygous KO mice. This is the representative of more than 30 litters. The KO mice were male and female. The average body weight (WT vs. KO) for day 3, day 5, day 7, and day 10 were: 2.5 ± 0.08g vs 1.4 ± 0.05g; 3.8 ± 0.25 vs 2.5 ± 0.12g; 5 ± 0.9 vs 3 ± 0.5g; and 7 ± 1.2 vs 3.5 ± 0.8g. Values are mean ± SD, n = 6.
Supplemental Figure 4. LPCAT3 deficient mice have normal liver morphology. Livers from LPCAT3 KO and WT mice were sectioned and stained with H&E. Representative images are shown (n = 5 animals of each type).
Supplemental Figure 5. ApoA-I protein and mRNA in enterocytes. (A) Western blots of apoA-I in WT and LPCAT3 KO enterocyte homogenates. (B) Quantification of apoA-I protein levels. (C) apoA-I mRNA levels in WT and LPCAT3 KO enterocytes. Values are mean ± SD, n = 4. *P<0.01.
Supplemental Figure 6. Phospholipid absorption in LPCAT3 KO mice. Male mice, at age 10-weeks-old, were gavaged with 0.1 μCi L-α-1-palmitory-2-arachidonyl-phosphatidylcholin [arachidonyl-1-14C] in 15 μL olive oil. Blood was collected over 8 hr and measured for the presence of [14C]-glycerolipids. Values are mean ± SE, n = 4. *P<0.05.
Supplemental Figure 7. LPCAT3 can be regulated by LXR and PPARs. (A) and (B), WT mice (C57BL/6) were treated with LXR agonist (T0901317, 35 mg/kg/d) or vehicle for 4 days. (C) and (D), WT mice (C57BL/6) were treated with PPARα agonist (Fenofibrate, 300 mg/kg/d) or vehicle for 4 days. Liver and small intestine LPCAT3 mRNA was measured by real-time PCR. Values are mean ± SD, n = 5, *P < 0.05, **P < 0.01.
Supplemental Figure 8. LPCAT3 promoter region contains functional PPAR-responsive elements (PPREs). (A) Four candidate PPREs are illustrated within the 1-kb region of the human LPCAT3 promoter. PPRE1 is conserved in mouse, rat, bovine and human LPCAT3 promoters. (B) The proximal PPRE1 is sufficient for PPARα response. A series of promoter-reporter deletion constructs were made. Huh7 cells were co-transfected with PPAR-reporter vector or negative control (pGL3) vector along with PPARα expression vector. After 16 hr, transfection medium was changed to growth medium. After 24 hr of transfection, cells were treated with PPARα agonist (WY14643, 20 μM). After 18 hr treatment, luciferase assays were performed, and relative reporter activity (percentage) was determined. Values are mean ± SD, n = 3. (C) PPARα binds to PPRE1. Electrophoretic mobility shift assays were performed with 32P-labeled fragments of the LPCAT3 promoter extending from nt −133 to −97 in the presence of PPARα, RXRα, or both. Arrow indicates the position of the PPARα/RXRα complex. WT and mutant (mut) oligonucleotide competitors were included at a 5-fold or 25-fold molar excess. Sequences of the WT and mutant oligonucleotides are shown with putative nuclear receptor half-site sequences capitalized. A representative blot from three independent experiments is shown. (D) Chromatin immunoprecipitation (ChiP) assay on liver of WT mice. C57BL/6 mice were injected with fenofribrate (300 mg/kg/day) for 10 days. The ChiP analysis was carried out using IgG or anti-PPARα antibody. The procedure was as described in Experimental Procedures. A representative blot from three independent experiments is shown.
Supplemental Figure 9. Effect of LPCAT3 deficiency on apoptosis, ER stress, and proliferation. (A) Real-time PCR for ER stress markers: Ire1α, Bip, and Perk. (B) Real-time PCR for cell proliferation marker: Ki-67. (C) Small intestine caspase 3 immunostaining. (D) Quantification of caspase 3 levels. Values are mean ± SD, n = 4.
Supplemental Table 1. mRNA measurement by real-time PCR
Value, mean ± SD, n = 5, *P < 0.01.
Supplemental Table 2. Measurement of LysoPC subspecies by LC/MS/MS
Value, mean ± SD; n = 5; *P < 0.05.