

Abstract
A well-established motor timing paradigm, the Synchronization-Continuation Task (SCT), quantifies how accurately participants can time finger tapping to a rhythmic auditory beat (synchronization phase) then maintain this rhythm after the external auditory cue is extinguished, where performance depends on an internal representation of the beat (continuation phase). In this study, we investigated the hypothesis that Parkinson’s disease (PD) patients with clinical symptoms of freezing of gait (FOG) exhibit exaggerated motor timing deficits. We predicted that dysrhythmia is exacerbated when finger tapping is stopped temporarily and then reinitiated under the guidance of an internal representation of the beat. Healthy controls and PD patients with and without FOG performed the SCT with and without the insertion of a 7-second cessation of motor tapping between synchronization and continuation phases. With no interruption between synchronization and continuation phases, PD patients, especially those with FOG, showed pronounced motor timing hastening at the slowest inter stimulus intervals during the continuation phase. The introduction of a gap prior to the continuation phase had a beneficial effect for healthy controls and PD patients without FOG, although patients with FOG continued to show pronounced and persistent motor timing hastening. Ratings of freezing of gait severity across the entire sample of PD tracked closely with the magnitude of hastening during the continuation phase. These results suggest that PD is accompanied by a unique dysrhythmia of measured movements, with FOG reflecting a particularly pronounced disruption to internal rhythmic timing.
Keywords: Parkinson’s disease, motor timing, paced finger tapping test, freezing of gait
1. Introduction
The ability to control and regulate the timing of rhythmic motor movements is not only necessary for pursuits such as dance and music, but is inherent to more commonplace activities such as speech and gait. Renewed interest in the biologic process of motor timing emphasizes that key brain regions, including the basal ganglia, cerebellum, and frontal cortex, are necessary for successful completion of rhythmic motor timing tasks (Coull and Nobre, 2008; Ivry and Spencer, 2004; Meck et al., 2008). Parkinson’s Disease (PD) manifests with a relative “dysrhythmia” of motor movements, and symptoms correlate with neurodegenerative changes to frontal and striatal regions necessary for optimal motor timing (Harrington et al., 1998; O’Boyle et al., 1996; Paster et al., 1992; Riederer and Wuketich, 1976). Early in PD, patients are unable to rhythmically coordinate alternating motor movements (the severity of dysmetria is routinely evaluated in the fingers, hands, and feet). Over time, more significant manifestations of abnormal motor timing evolve, and can include palilalia (where the timing of speech articulation is altered such that patients have a stuttering-type cadence to speech) and gait impairment (Heremans et al., 2013; Morris et al., 2008; Schaafsma et al., 2003; Skodda and Schlegel, 2008). In select cases, gait can even be an early manifestation of abnormal motor timing such as in the postural instability gait disorder (PIGD) variant of PD.
Gait dysfunction in PD is one of the greatest sources of morbidity in patients, and can manifest with stride-to-stride timing variation, slower cadence, motor festination (a rapid series of increasingly shortened strides that can result in a fall or cessation of movement), and freezing of gait- a complete arrest of movement in the lower extremities lasting up to twenty to thirty seconds at a time (Morris et al., 2008; Schaafsma et al., 2003). Patients often experience an episode of freezing when forced to adapt stride length and tempo such as with turning, transitioning from carpet to tile floor, or stopping and reinitiating movement (Nutt et al., 2011; Rahman et al., 2008). Freezing of gait (FOG) and gait festination are often seen in concert, as the PD neurodegenerative process results in impaired coordination of basal ganglia and cortical structures necessary for proficient internal motor cue production (Iansek et al., 2006; Morris et al., 2008). However, festination and freezing are not necessarily confined to the lower extremities, but similar phenomena are evident in speech such as palilalia (Moreau et al., 2007; Skodda and Schlegel, 2008) and fine motor tasks of the upper extremity (Almeida et al., 2002; Nakamura et al., 1976; Nieuwboer et al., 2009). Several studies looking at freezing in the upper extremities in patients with FOG have suggested that freezing is indicative of a global phenomenon of problems with motor control and timing (Nieuwboer et al., 2009; Vercruysse et al., 2012a; Vercruysse et al., 2012b). Patients with festination and FOG do experience considerable improvement when provided an external sensory cue such as a metronome or visual stimuli (Arias and Cudeiro, 2010; Lee et al., 2012; Spildooren et al., 2012). Clinical evidence suggests that unlike PD patients without freezing and festination, patients with these symptoms suffer an exaggerated disturbance in the maintenance of internally cued rhythmic motor movements (Iansek et al., 2006; Morris et al., 2008).
Experimentally, rhythmic motor timing is elegantly measured using the synchronization-continuation task (SCT). This task requires participants to first match their finger tapping to a series of uniformly spaced auditory beats, which is called the synchronization phase (Wing and Kristofferson, 1973). After a specified time period of synchronization tapping, the auditory beats are then extinguished, but the participant must continue tapping at the same rhythmic beat for another set time period, called the continuation phase (Wing and Kristofferson, 1973). Optimal performance is measured by how well a participant can entrain a rhythmic motor response to an external auditory stimulus and then maintain this timed motor response using an internal representation of the timing pace (Coull and Nobre, 2008; Jones et al., 2011). Using this task, we have shown that PD patients perform the synchronization phase better than the continuation phase and are prone to tap ahead of the beat, or “hasten” (Jones et al., 2011). We believe this hastening pattern resembles the clinical phenomena of festination seen in speech and gait as these are also characterized by the speeding up of movement. Experimentally, festination has classically been defined broadly as movement that exceeds an experimental control by a specified margin (Jones et al., 2011; Logigian et al., 1991; Moreau et al., 2007).
The overarching goal of this study was to better define motor timing deficits unique to PD patients with FOG (PD-FOG). We investigated the hypothesis that PD patients with FOG experience a particularly pronounced disruption in rhythmic motor timing. Based on our prior study, we predicted that PD patients with and without FOG would more accurately synchronize their motor timing to an externally paced auditory cue (synchronization phase). We also expected to replicate the pattern that PD patients, compared to healthy controls, would hasten their motor timing “ahead of the beat” in the absence of an auditory cue (continuation phase) when the rhythm was being maintained by internal cues. However, we predicted that this hastening pattern would be most pronounced in PD-FOG patients.
A further extension of this study was the introduction of a forced pause in tapping between synchronization and continuation phases of the SCT task. This sequence of rhythmic motor performance followed by stopping of movement and then re-initiation of rhythmic tapping was intended to pattern the difficulties with festinating motor movements that commonly occur with movement re-initiation in PD-FOG patients. We predicted that PD-FOG patients would exhibit even greater exaggeration of the festinating tapping pattern following the interruption and re-initiation of rhythmic motor movements (i.e., when synchronization and continuation phases were non-continuous).
2. Results
2.1 Clinical Variables
A total of 53 participants met appropriate criteria: 14 PD-FOG, 20 PD patients without FOG (PD-C), and 19 older healthy controls (OHC). Patient demographics are described in Table 1. With matched variables, groups were statistically similar in age and gender distribution, and PD groups had similar disease duration and years since diagnosis. The Freezing of Gait Questionnaire (FOG-Q) score was also significantly greater in the PD-FOG group compared to the PD-C group (p<0.0001). All participants had a similar Montreal Cognitive Assessment (MoCA) score and years of education. Subjective quality of life appeared worse in those with FOG as evidenced by higher Unified Parkinson’s Disease Rating Scale (UPDRS) Part II (p<0.0001), Parkinson’s Disease Questionaire-39 (PDQ-39) (p<0.0001), and Center for Epidemiological Studies Depression Scale (CES-D) scores (p<0.02). L-dopa equivalents were greater in the PD-FOG group than in the PD-C group (p=0.006).
Table 1.
Participant Demographics
| PD-FOG (N=14) | PD-C (N=20) | OHC (N=19) | p value | F-test | |
|---|---|---|---|---|---|
| ¥ Gender (Male:Female) | 10:4 | 10:10 | 13:6 | 0.35 | - |
| Age | 65.3 (9.8) | 62.5 (5.5) | 64.5 (8.1) | 0.55 | 0.60 |
| Education (years) | 15.5 (2.4) | 15.5 (3.0) | 16.5 (2.5) | 0.42 | 0.89 |
| MOCA | 25.3 (3.2) | 25.5 (3.1) | 27.4 (2.2) | 0.06 | 3.02 |
| Disease Duration (years) | 9.1 (6.5) | 7.3 (3.4) | - | 0.29 | 1.18 |
| Years since diagnosis | 6.5 (4.9) | 5.6 (3.2) | - | 0.50 | 0.46 |
| LEDD** | 1066.9 (333.9) | 715.9 (345.2) | - | 0.006 | 8.74 |
| FOG-Q** | 14.1 (3.3) | 1.6 (1.9) | - | 0.000 | 196.94 |
| PDQ-39** | 52.4 (21.7) | 20.3 (14.7) | - | 0.000 | 26.58 |
| UPDRS II** | 18.9 (3.8) | 7.6 (4.4) | - | 0.000 | 60.51 |
| UPDRS III | 25.3 (9.3) | 21.9 (13.3) | - | 0.41 | 0.69 |
| CES-D* | 17.6 (7.1)*** | 11.4 (9.6) | 7.2 (6.5) | 0.02 | 6.96 |
p<.05,
p<.005,
Post hoc confirmed significance between OHC
Results are presented as Mean (S.D.), MoCA=Montreal Cognitive Assessment, LEDD=Levodopa Equivalent Daily Dosage, FOG-Q=Freezing of Gait Questionnaire, PDQ-39=PD Questionaire-39, UPDRS-II= Unified PD Rating Scale Part II, UPDRS-III=Unified PD Rating Scale Part III, CES-D=Center for Epidemiological Studies Depression Scale.
Gender p value calculated using a chi square analysis. All others through independent t tests and ANOVA.
2.2 Synchronization Accuracy
Three fixed predictors—Group, Inter Stimulus Interval (ISI), and Tap Time (i.e. the relative error over the duration of the phase)—were used as fixed effects in modeling the LMM during synchronization. Two random effect parameters were also included: an intercept for subject-by-subject variation, and the slope based on Tap Time for each subject. The best fitting linear mixed model (LMM) based on Akaike information criterion (AIC) included all two-way interactions and main effects as fixed effects. Within both the fixed and random effects, Tap Time was best fit with a natural spline consisting of four degrees of freedom (see Supplementary Table 1 for the model coefficients and confidence intervals).
We focused on the three two-way interactions with particular focus on Group effect. During synchronization, relative accuracy was close to optimal (i.e., 1.00), and all participants were able to accurately sync their motor timing to an external auditory cue (Fig. 1). PD participants (both non-freezers and freezers) showed a tendency to be ahead of the beat. PD-FOG showed a tendency to have less of a hastening than PD-C during the 250ms interval, yet hastening was more severe in this group at the 500 ms and 750 ms ISIs intervals. To evaluate if certain ISIs were indeed more challenging to synchronize, we collapsed across all participants and evaluated accuracy in each ISI across the duration of the trial (i.e. two-way interaction of ISI by Tap Time, Fig. 2A). An initial hastening of motor timing was present across all three ISIs, but participants adjusted across the duration of the trial. Next, to evaluate how synchronization performance varied by group over time, we focused on the two-way interaction of Group by Tap Time (Fig. 2B). Differences emerged between PD and OHC groups in the first quarter of taps across trial runs. All PD patients began synchronization ahead of the beat, but rapidly adjust tapping rhythm to sync with the auditory beat rhythm, achieving high accuracy similar to OHC levels across the remainder of the phase. These results emphasize that all participants were able to synchronize, but distinctions between groups were more apparent early, rather than later during synchronization.
Figure 1.
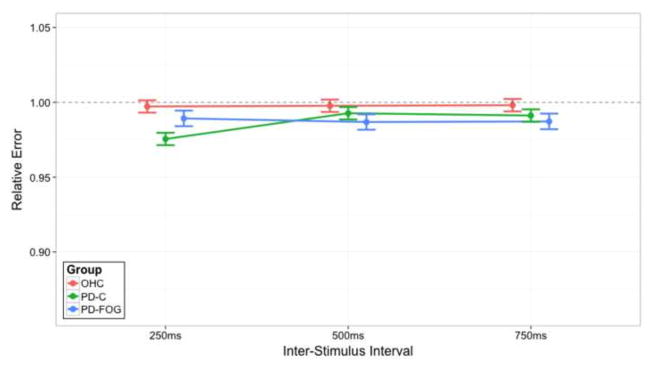
The two-way interaction of ISI and Group for relative errors within the synchronization Task Phase. On the x-axis are the three ISIs: 250 ms, 500 ms, and 750 ms. The lines indicate Group membership: older healthy controls (OHC; red), PD patients without clinical symptoms of FOG (PD-C; green), or PD patients with clinical symptoms of FOG (PD-FOG; blue). They do not imply that intermediate levels exist between the ISI but serve to visually assist in understanding the data. The y-axis represents relative error accuracy. Lower relative error scores occur when subjects are ahead of the beat, while higher relative errors occur when subjects are behind the beat; a relative error score of 1.00 indicates ideal performance, as demarcated by the dashed black line. Error bars represent a one standard error (1SE) interval of the model’s predicted fit.
Figure 2.
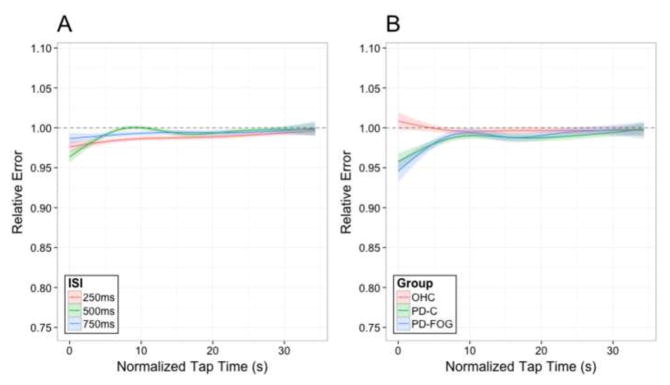
A) The two-way interaction of ISI and Tap Time for relative errors within the synchronization Task Phase. The three lines indicate the ISI: 250 ms (red), 500 ms (green), or 750 ms (blue). B) The two-way interaction of Group and Tap Time for relative error within the synchronization Task Phase. The three lines indicate Group membership: older healthy controls (OHC; red), PD patients without clinical symptoms of FOG (PD-C; green), or PD patients with clinical symptoms of FOG (PD-FOG; blue). For both figures, the y-axis represents relative error accuracy while the x-axis shows normalized Tap Time across the duration of the trial. Lower relative error scores occur when subjects are ahead of the beat while higher relative errors occur when subjects are behind the beat. Error shading represents a one standard error (1SE) interval of the model’s predicted fit.
2.3 Continuation Accuracy
To model relative error during continuation, we used four fixed effect predictors: Gap Presence, ISI, Group, and Tap Time. Two random effect parameters were also included: an intercept for subject-by-subject variation and a slope based on Tap Time for each subject. The best fitting LMM based on AIC included a full four-way interaction of the fixed effects, along with all lower order interactions and the main effects. Within both the fixed and random effects, Tap Time was best fit with a natural spline consisting of three degrees of freedom (see Supplementary Table 2 for the model coefficients and confidence intervals).
Figure 3 reveals clear group differences in relative error patterns during continuation. In the normal SCT without the gap (Fig. 3, left panel), OHCs showed slight hastening at the fastest 250 ms ISI, minimal relative error at the 500 ISI, and pronounced hastening during 750ms ISI. PD-Cs performed slightly ahead of the beat, with the most pronounced difference at the 750 ms ISI. PD-FOGs evidenced pronounced hastening at the two slowest ISIs, exceeded hastening patterns of PD-Cs.
Figure 3.
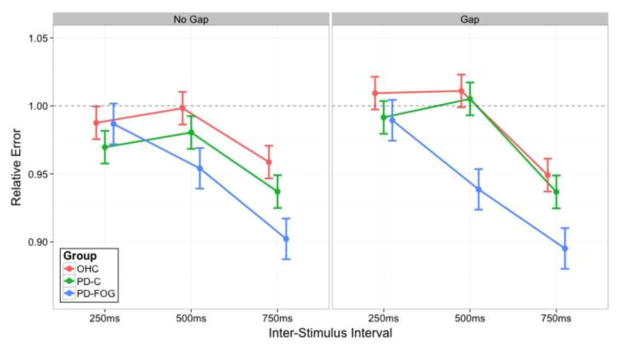
The three-way interaction of Gap Presence, ISI, and Group for relative error within the continuation Task Phase. The left panel shows conditions during the standard SCT whereas the right panel shows conditions where a gap occurred. On the x-axis, there are the three ISIs: 250 ms, 500 ms, and 750 ms. Within each panel, the three lines indicate Group membership: older healthy controls (OHC; red), PD patients without clinical symptoms of FOG (PD-C; green), or PD patients with clinical symptoms of FOG (PD-FOG; blue). They do not imply that intermediate levels exist between the ISI but serve to visually assist in understanding the data. The y-axis represents relative error accuracy. Lower relative error scores occur when subjects are ahead of the beat, while higher relative errors occur when subjects are behind the beat; a relative error score of 1.00 indicates ideal performance. Error bars are standard with prior figures.
Introducing an interruption in motor tapping between synchronization and continuation phases (i.e., the gap condition; Fig. 3, right panel) had several effects on motor timing patterns across groups during continuation. OHCs slowed down, showing a lag at 250 and 500 ms, but performance was close to optimal. Performance during the 750 ISI was unchanged compared to the non-gap SCT. Most interestingly, PD-Cs improved, and were more accurate following the gap at the 250 and 500 ms ISIs. In contrast, the PD-FOG group worsened in tapping performance at the 500 and 750 ms ISIs.
To better understand the change in accuracy performance over the length of the continuation phase, we illustrated relative error over Tap Time (Fig. 4). At the 250 ms ISI, there was little group separation. In the non-gaps trials, PD-Cs did appear to hasten early in the trial. When a gap was introduced, OHCs tended to lag early on, but all participants showed a similar pattern of lagging performance as the phase continued. The most apparent group differences occurred at the 500 ms interval (center column). At the 500 ms no-gap condition (top-center), OHCs showed close to ideal performance (i.e., a relative error of 1.00), whereas PD patients hastened ahead of the beat with freezers having the most dramatic hastening compared to both other groups. Following the gap interval between synchronization and continuation (bottom-center), PD-Cs improved performance to such an extent that they were indistinguishable from OHCs. In contrast, freezers maintained a hastening performance. They were far ahead of the beat for the first two thirds of the trial, slowing only in the last third to a level comparable to the other groups. While we speculate that this slowing in the latter parts of the trial may be fatigue, it is apparent that PD-FOG patients do not have a similar response after the gap as PD-Cs. Finally, within the longest ISI of 750 ms, (rightmost column), for both non-gap (top-right) and gap (bottom-right) trials, all groups showed a tendency towards hastening, with some slowing and improvement in accuracy noted in the latter half of the phase. Still, the pattern at 750 ms is similar to that seen at 500 ms ISI: OHCs, despite being ahead of the beat, demonstrated closest to ideal accuracy. PD patients hastened with the greatest degree of hastening seen in the PD-FOG group. Once again, the presence of a gap (bottom panel) resulted in PD-Cs recovering and performing more similarly to healthy controls. PD-FOG patients do not receive this benefit and may have some subtle worsening.
Figure 4.
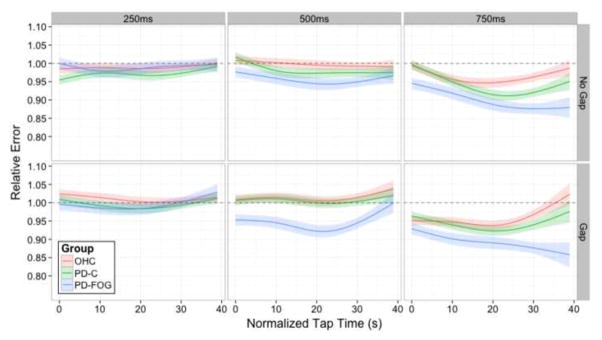
The full four-way interaction of Gap Presence, ISI, Group, and Tap Time for relative error within the continuation Task Phase. The top panel shows conditions in which a gap did not occur, whereas the bottom panels show conditions where a gap did occur. Each column represents one of the three ISIs: 250ms, 500ms, or 750ms. Within each panel, the three lines indicate Group membership: older healthy controls (OHC; red), PD patients without clinical symptoms of FOG (PD-C; green), or PD patients with clinical symptoms of FOG (PD-FOG; blue). The y-axis represents relative error accuracy while the x-axis shows normalized Tap Time across the duration of the trial. Lower relative error scores occur when subjects are ahead of the beat, while higher relative errors occur when subjects are behind the beat. Error shading standard with prior figures.
2.4 FOG-Q and Tapping Performance
As a secondary analysis, accuracy models of tapping performance were refit using the FOG-Q score as a performance predictor. This approach allowed us to assess if subjective severity of freezing symptoms predicted the extent of motor timing deficits. Since PD patients suffer a range of freezing severity, we included all PD patients in this analysis. Patients with greater symptom severity (higher FOG-Q scores) had a significantly worse hastening pattern during the continuation phase (Fig. 5). To illustrate, patients with FOG scores of zero showed nearly ideal performance at the 250 and 500 ISIs with hastening only at the 750 ISI, while patients with large FOG scores (> 15) demonstrated markedly worse hastening at the 500 and 750 ISIs. Again, there appeared to be no timing benefit following the gap in patients with higher FOG-Q scores. These findings emphasize that the clinical symptoms of freezing severity follow a pattern of exaggerated hastening of finger tapping.
Figure 5.
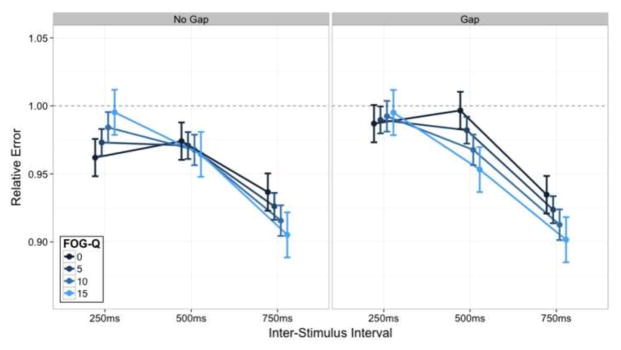
The three-way interaction of Gap Presence, ISI, and FOG-Q score for relative error within the continuation Task Phase. The left panel represents the standard SCT while the right panel represents the gap condition. The y-axis again demonstrates relative error. The x-axis represents the three ISI. The lines depict varying FOG-Q scores (see legend). Again, the lines between ISI are not indicative of intermediate values but are present for visual comparison of the data. Error bars standard with prior figures.
3. Discussion
The main objective of this study was to characterize motor timing deficits in PD, focusing on distinctions between PD patients with and without FOG symptoms. Study results emphasize that, while all participants can accurately tap in measured time to an external auditory cue, PD patients tap ahead of the beat when required to continue this pattern in the cue’s absence. The pattern of hastening is analogous to “finger-tapping festination,” which is more notable in patients with FOG and follows the severity of FOG symptoms as measured by the FOG-Q. Motor hastening continues in the PD-FOG group when there is a pause between synchronization and continuation (at the 500 and 750 ISI). A key difference in performance in the gap trials was that PD-Cs and OHCs experience timing benefit following a gap whereas the PD-FOG group do not. Taken together, disrupted control of measured movements appears a hallmark of PD, and the hastening pattern of rhythmic motor movements in the absence of an external cue seen in the upper extremities in this study mirrors the clinical phenomenology evident in PD patients with FOG. The inability for freezers to optimize performance following the gap phase suggests that internal rhythmic cue production—and possibly rhythmic temporal perception—is associated with symptoms of freezing and gait problems. We discuss these findings in the context of the neuronal control of motor timing as it relates to the neurodegenerative process in PD.
During the synchronization phase, all groups were able to accurately tap in time to the auditory cue, but PD patients began slightly ahead of the beat, adjusting over the duration of the phase to a more accurate performance. This finding replicates previous studies using the SCT (Avanzino et al., 2013; Freeman et al., 1993; Jones et al., 2011) and clinical observations that gait initiation failure and festinating gait cadence improves with the addition of an external auditory cue (Arias and Cudeiro, 2010; Lee et al., 2012; Praamstra et al., 1998; Spildooren et al., 2012). Other sensory cues, most commonly visual stimuli (e.g. laser-generated line from a walker, or visually identifying a designated point on a floor) can be used to improve gait initiation and stride (Donovan et al., 2010; Rahman et al., 2008). The neural process responsible for cue effectiveness in PD may include compensatory activation of distinct neural networks (Debaere et al., 2003; Samuel et al., 1997). In the case of auditory cue synchronization, cerebellar-frontal networks are recruited during synchronization in PD, but not in healthy controls (Jahanshahi et al., 2010). Overall, accurate performance during synchronization but not continuation emphasizes that while attentional processes to external cues are intact, the inability to maintain optimal performance in the absence of external cues is what differentiates PD patients from controls and mirrors the severity of gait symptoms.
During continuation, optimal tapping performance requires the integration of entrained internal rhythmic cues with appropriate motor output. Imaging studies emphasize that distinct frontal-striatal networks are required for optimal performance during continuation and included most predominantly the right dorsal-lateral prefrontal and supplementary motor cortex, putamen and thalamus (Jahanshahi et al., 2010; Koch et al., 2009; Rao et al., 1997). We show that during the continuation phase, PD patients perform in a “unidirectional” manner – tapping ahead of the predetermined cue frequency. Older healthy controls show a similar pattern only at the slower 750 ms interval, but even here PD-Cs and PD-FOGs show a larger hastening effect than controls. This unidirectional nature—ahead of the established cue frequency—fits with our a priori hypothesis that festinating movements are globally manifest (i.e., not confined to the lower extremities) and worse in PD patients who freeze (Claassen et al., 2013; Jones et al., 2011).
The pathophysiologic basis for festination requires more study, but abnormal oscillatory brain activity (Nakamura et al., 1978) and additive delays in internal motor cue production generated by the globus pallidus interna (a.k.a. “sequence effect”) may account for this stereotyped symptom (Iansek et al., 2006; Morris et al., 2008). This model postulates that altered motor cue production in the globus pallidus results in impaired signaling to the premotor and supplementary motor cortices, with progressive quickening of repetitive movements and then complete motor cessation or freezing episodes (Morris et al., 2008). Rhythmic generators are not limited to a cerebral localization as they include the spinal cord and higher supraspinal neural networks, but ultimately they are coordinated in basal ganglia regions (Meck et al., 2008; Meck, 2006; Nutt et al., 2011). FOG thus appears to be a clinical symptom characterized by dysrhythmia of measured movement, and associated with a progressive festinating pattern of motor timing (Heremans et al., 2013). Future studies are needed to better define neuronal correlates of festination in PD as well as the connection between upper and lower extremity movement, but progressive fronto-striatal dysfunction may explain the stratified nature of festination severity (Jones et al., 2011).
Patients often suffer freezing episodes when experiencing distracting stimuli (especially visual), resulting in an inability to restart and continue a habitual motor response (Nutt et al., 2011; Rahman et al., 2008). FOG is therefore theorized by some to be secondary to impairments to the automaticity of initiating a learned motor response (Nutt et al., 2011; Spildooren et al., 2010; Vandenbossche et al., 2013). Experimentally, we used different duration ISIs and presented a gap-phase to understand how re-initiation of a learned motor response was affected in PD – especially in those patients with FOG. Tapping at a faster ISIs (i.e. 250 ms) requires a habitual, automatic motor response, while tapping at slower ISIs (i.e. 500 ms and 750 ms) requires a more controlled motor response (Koch et al., 2009; Peters, 1989). We show that a more negative relative error occurs in PD patients particularly during ISIs of 500 ms and 750 ms. Even though there is less time to make errors in the short duration 250 ms interval, these findings emphasize that PD-FOG patients suffer from impairments in restarting habitual motor responses that require more cognitive control. We speculate that gait therapy strategies, which can improve cognitive coordination of gait, may provide significant benefit to patients.
With the introduction of the gap, performance in healthy controls and PD patients improved, especially at the 500 ms ISI interval, but this benefit was not evident in PD-FOG patients. We hypothesized that PD-FOG would indeed have more problems after a pause, given that difficulties with gait re-initiation characterize this population, but did not expect an improvement in the non–FOG groups (Nutt et al., 2011; Praamstra et al., 1998; Rahman et al., 2008). The lack of benefit in FOG patients may be explained by several factors including impairments to motor memory consolidation, accentuated deficits in internal motor cue generation, and altered temporal perception (Heremans et al., 2013; Nutt et al., 2011). This finding also argues against fatigue being the main driver of hastening performance, as all participants were able to “rest” from tapping for a fixed interval, but only FOG patients continued this hastening pattern.
In summary, this work provides compelling evidence that PD is a disorder characterized by motor timing deficits, and motor festination is a generalized phenomenon not linked to gait symptoms alone. The strong link between severity of unidirectional (hastening) dysrhythmia and clinical symptoms of FOG emphasizes that progressive frontal-striatal dysfunction may account for this clinical phenomena, and therapies targeting improvements of motor timing may offer improvements in gait symptoms of PD.
4. Experimental Procedure
4.1 Participants
Participants represented three groups: PD patients with clinical symptoms of FOG (PD-FOG), PD patients without FOG symptoms (PD-C), and older healthy controls (OHC). PD participants were examined by movement disorder Neurologists (C.T. and D.C.) and were identified based on the presence or absence of clinical symptoms consistent with FOG, as determined by clinical history and exam. All groups were matched for age and gender, and PD groups were additionally matched for disease duration and years since diagnosis. All PD patients met the UK Parkinson Brain Bank criteria for a diagnosis of PD (Hughes et al., 1992) and completed the FOG-Q (Giladi et al., 2000) to establish the extent of subjective FOG symptoms. Participants were excluded if demented (either a MoCA with a score less than 17 (Nasreddine et al., 2005) or a concerning clinical behavioral interview by S.W and D.C.), experienced concomitant neurologic or psychiatric co-morbidities, or could not complete a finger-tapping task due to musculoskeletal disability. All PD patients were taking dopamine therapy and were tested in the “On” medication state, but excluded if they had deep brain stimulation. Mood was assessed using the CED-S (Radloff, 1977). The UPDRS Part II and III (Fahn et al., 1987) and the PDQ-39 (Peto et al., 1998) were used to estimate the motor and clinical severity of PD. L-dopa daily equivalent was calculated to estimate daily dopamine requirements (Tomlinson et al., 2010). The Vanderbilt Institutional Review Board approved the study, and written informed consent was received from all participants.
4.2 Task
The SCT was administered to all participants in the same quiet room using the same study apparatus. Participants sat in front of a laptop computer and tapped on a drum pad connected to an amplifier, which recorded the tapping response. The participants were instructed to tap with the same preferred index finger throughout the entire task. During the initial synchronization phase, a constant metronome beat was presented through head phones for a total of 33 stimuli. Cessation of the beat signified the beginning of the continuation phase where the participant continued to tap at the same tempo. In the normal SCT, the transition between tapping in the synchronization and continuous phases was uninterrupted. In the gap-SCT, the participants ceased tapping for seven seconds after the synchronization phase before re-initiating tapping to complete the continuation phase. To convey these instructions, the word TAP was presented in green font on the screen to indicate that the participant should tap to the beat (synchronization) or at the same perceived beat frequency as before (continuation phase). The word PAUSE in orange font was presented between synchronization and continuation phases during the gap-SCT task to instruct the participant to cease tapping for the 7 second delay. The word TAP then reappeared to re-initiate tapping during the continuation phase. Each trial of taps (synchronization plus continuation phases) ended with the word STOP appearing on the screen in red font.
During the continuation phase, participants were instructed to tap at the same frequency of the beat heard during the preceding synchronization phase until the word STOP appeared on the screen, which occurred following 33 registered taps. Response times were recorded in milliseconds and compared to a running clock that began when the instructions to TAP appeared. The auditory beats for both the normal SCT and gap-SCT were presented at three different ISI: 250 ms, 500 ms and 750 ms. These were selected based on our previous study when PD patients showed differences to healthy control when ISIs were less than 1000 ms (Jones et al., 2011). Each participant completed the SCT and gap-SCT tasks four times at all three frequencies, resulting in a total of 24 trials. The normal SCT was completed before the gap-SCT, with a 10-minute break between the SCT and gap-SCT trials. ISIs were presented in a random order across tasks and participants. All patients began the experiment 30–45 minutes after their last L-dopa dose, which was done to optimize performance in the “On” medication state during the entire task.
4.3 Tapping data: outliers and cleanup
Inter Tap Intervals (ITIs) that exceeded the ISI by > 50% were removed, as these represented either missed taps or a failure of the program to record a tapping event. The experimental device and program captured 33 tapping events in each phase before advancing to the next phase or trial. At data analysis, certain taps intervals were excessively delayed, which are typically the result of reduced force (the device failed to record required taps) or high variability in the initial trials of a phase. To correct for these, we removed the first three tapping events in both phases and also applied a statistical method to remove outlier observations using the MAD approach. Identification of outlier observations was based on tempo, gap presence, and phase (12 total). To preserve the maximum amount of data, we identified a single optimal median absolute deviance (MAD) threshold. The optimum was reached by ‘repeatedly cleaning’ tapping data with thresholds ranging from one to three, by steps of 0.01, and determining the amount of data removed at each threshold. An optimal smoothing spline was fit to the resultant power curve, and an inflection point estimated an optimal threshold of 1.35 MAD around the median (Supplementary Fig. 1). Each combination of conditions was then cleaned based on this MAD threshold, leaving 79,016 taps (6.66% removed). Remaining data was cleaned on a trial-by-trial basis and trials removed where recorded tap count fell outside the range of three MAD around the median. Five participants were removed (three PD-FOG, one PDC and one OHC), as they had an excessive amount of trials removed (i.e., more than the median + three MAD trials, or >12 incomplete trials). This process resulted in the removal of 9,590 taps, or 12.14% of the data, leaving 53 participants with 69,426 taps in the final dataset.
4.4 Analysis
Descriptive data was analyzed by independent t tests when comparing the two PD groups. When comparing all three groups, an ANOVA was performed with a Bonferroni correction to account for multiple comparisons. We used LMMs to assess the repetitive tapping data. Analyses were conducted using the lme4 package (Bates et al., 2014) within R (R Core Team, 2014). For each reported model, we evaluated multiple models and selected the best-fitting model based on AIC (Burnham and Anderson, 2002). Like the method described in our prior work (Jones et al., 2011), we measured accuracy by calculating relative error for each tap based on inter-tap interval divided by inter-stimulus interval: ITI/ISI. The resultant relative error value could then be compared across different ISIs and possessed a directionality component: scores of one represented ideal tapping, whereas scores less than one were ahead of the beat (i.e., “leading” or “hastening”) and scores greater than one are behind the beat (i.e., “lagging”).
In creating the LMMs, a single model including both synchronization and continuation (i.e., both levels of Task Phase) was not possible as the presence or absence of a gap affected the outcome of the continuation phase only. The gap presence factor had no impact on synchronization because synchronization occurs prior to the presence or absence of a gap and is identical regardless of gap presence condition. Instead, we fit separate models for each Task Phase based on the relevant fixed effect factors within our paradigm, which are summarized as follows: 1) Synchronization Analysis: Group (categorical: OHC, PD-C, or PD-FOG), ISI (categorical: 250 ms, 500 ms, or 750 ms), and Tap Time (continuous); 2) Continuation Analysis: Gap Presence (categorical: gap or no gap), ISI, Group, and Tap Time. To avoid model convergence errors due to high parameter complexity, for both set of models we limited random effects to an intercept for each subject and a slope over tap time for each subject.
It was necessary to normalize tap time across the different ISIs to make meaningful comparisons across tap time. Consider the duration of trials across two different ISIs involving the same number of taps: a 250 ms and a 500 ms ISI trial, each consisting of 30 taps within synchronization. The 250 ms trial would take 7.5 seconds to complete 30 taps, while the 500 ms trial would take 15 seconds to complete 30 taps. To account for this, tap time was divided by ISI to create a normalized tap time (e.g. 7.5sec/250 ms = 0.03 and 15sec/500 ms = 0.03). Additionally, all continuation trials were aligned to start at 0s of normalized time to make direct comparisons meaningful irrespective of whether or not a gap occurred. All of the figures presented in these analyses reflect these transformations.
Supplementary Material
Supplementary Figure 1: Details on the optimization process used for cleaning the tapping data
Supplementary Table 1: Model coefficients and confidence intervals for the synchronization phase
Supplementary Table 2: Model coefficients and confidence intervals for the continuation phase
Highlights.
Parkinson’s patients are able to accurately tap in synchrony with an auditory cue
In the absence of a cue, all patients tap ahead of the beat (motor hastening)
Motor hastening worsens in patients with gait freezing, tracking clinical severity
Following a short cessation of movement, only freezers hasten more
Acknowledgments
This project was part of a Masters of Public Health degree (C.T), sponsored by the VICTR program at Vanderbilt University. The authors thank the patients and staff who made completion of this study possible.
FUNDING
NIH/NINDS K23 NS080988 and Michael J Fox Foundation to D.C. The funding source had no involvement in the conduction of the research.
Abbreviations
- AIC
Akaike information criterion
- CES-D
Center for Epidemiological Studies Depression Scale
- FOG
Freezing of Gait
- FOG-Q
Freezing of Gait Questionnaire
- ISI
Inter Stimulus Interval
- ITI
Inter Tap Intervals
- LMM
Linear Mixed Models
- MAD
Median Absolute Deviance
- ms
Millisecond
- MoCA
Montreal Cognitive Assessment
- OHC
Older Healthy Controls
- PIGD
Postural instability gait disorder
- PD-C
Parkinson’s disease Controls
- PD-FOG
Parkinson’s disease Patients with FOG
- PDQ-39
Parkinson’s Disease Questionaire-39
- SCT
Synchronization-Continuation Task
- UPDRS
Unified Parkinson’s Disease Rating Scale
Footnotes
COMPETING INTERESTS
There are no conflicts of interest to report.
CONTRIBUTORSHIP STATEMENT
All listed authors made substantial contributions to 1) The conception or design of the work and/or the acquisition, analysis or interpretation of data; 2) Drafting the work or revising it critically for important intellectual content. All authors provided final approval of the version published.
Publisher's Disclaimer: This is a PDF file of an unedited manuscript that has been accepted for publication. As a service to our customers we are providing this early version of the manuscript. The manuscript will undergo copyediting, typesetting, and review of the resulting proof before it is published in its final citable form. Please note that during the production process errors may be discovered which could affect the content, and all legal disclaimers that apply to the journal pertain.
References
- Almeida QJ, Wishart LR, Lee TD. Bimanual coordination deficits with Parkinson’s disease: the influence of movement speed and external cueing. Mov Disord. 2002;17:30–7. doi: 10.1002/mds.10030. [DOI] [PubMed] [Google Scholar]
- Arias P, Cudeiro J. Effect of rhythmic auditory stimulation on gait in Parkinsonian patients with and without freezing of Gait. PLoS One. 2010;5:e9675. doi: 10.1371/journal.pone.0009675. [DOI] [PMC free article] [PubMed] [Google Scholar]
- Avanzino L, Pelosin E, Martino D, Abbruzzese G. Motor timing deficits in sequential movements in Parkinson’s disease are related to action planning: a motor imagery study. PLoS One. 2013 Sep 23;8(9):e75454. doi: 10.1371/journal.pone.0075454. eCollection 2013. [DOI] [PMC free article] [PubMed] [Google Scholar]
- Bates D, Maechler M, Bolker B, Walker S. lme4: Linear mixed-effects models using Eigen and S4 (R package version 1.1–7) 2014 available at http://CRAN.R-project.org/package=lme4.
- Burnham KP, Anderson DR. Model selection and multimodel inference: a practical information-theoretic approach. New York: Springer-Verlag New York inc; 2002. [Google Scholar]
- Claassen DO, Jones C, Yu M, Dirnberger G, Malone T, Parkinson M, et al. Deciphering the impact of cerebellar and basal ganglia dysfunction in accuracy and variability of motor timing. Neuropsychologia. 2013;51:267–74. doi: 10.1016/j.neuropsychologia.2012.09.018. [DOI] [PubMed] [Google Scholar]
- Coull J, Nobre A. Dissociating explicit timing from temporal expectation with fMRI. Curr Opin Neurol. 2008;18:137–44. doi: 10.1016/j.conb.2008.07.011. [DOI] [PubMed] [Google Scholar]
- Debaere F, Wenderoth N, Sunaert S, Van Hecke P, Swinnen SP. Internal vs external generation of movements: differential neural pathways involved in bimanual coordination performed in the presence or absence of augmented visual feedback. Neuroimage. 2003;19:764–76. doi: 10.1016/s1053-8119(03)00148-4. [DOI] [PubMed] [Google Scholar]
- Donovan S, Lim C, Diaz N, Browner N, Rose P, Sudarsky LR, et al. LaserLight Cues for gait freezing in Parkinson’s disease: an open-label study. Parkinsonism Relat Disord. 2010;17:S475–81. doi: 10.1016/j.parkreldis.2010.08.010. [DOI] [PubMed] [Google Scholar]
- Fahn S, Elton RL . members of the UPDRS Development Committee. Unified Parkinson’s disease Rating Scale. In: Fahn S, Marsden CD, Calne DB, Goldstein M, editors. Recent Developments in Parkinson’s disease. Vol. 2. FlorhamPark (NJ): Macmillan Health Care Information; 1987. pp. 153–163. [Google Scholar]
- Freeman JS, Cody FW, Schady W. The influence of external timing cues upon the rhythm of voluntary movements in Parkinson’s disease. J Neurol Neurosurg Psychiatry. 1993;56:1078–84. doi: 10.1136/jnnp.56.10.1078. [DOI] [PMC free article] [PubMed] [Google Scholar]
- Giladi N, Shabtai H, Simon ES, Biran S, Tal J, Korczyn AD. Construction of freezing of gait questionnaire for patients with Parkinsonism. Parkinsonism Relat Disord. 2000;6 (3):165–70. doi: 10.1016/s1353-8020(99)00062-0. [DOI] [PubMed] [Google Scholar]
- Harrington DL, Haaland KY, Hermanowicz N. Temporal processing in the basal ganglia. Neuropsychology. 1998;12(1):3–12. doi: 10.1037//0894-4105.12.1.3. [DOI] [PubMed] [Google Scholar]
- Heremans E, Nieuwboer A, Vercruysse S. Freezing of Gait in Parkinson’s disease: Where Are We Now? Curr Neurol Neurosci Rep. 2013;13:350. doi: 10.1007/s11910-013-0350-7. [DOI] [PubMed] [Google Scholar]
- Hughes AJ, Daniel SE, Kilford L, Lees AJ. Accuracy of clinical diagnosis of idiopathic Parkinson’s disease: a clinico-pathological study of 100 cases. J Neurol Neurosurg Psychiatry. 1992;55:181–4. doi: 10.1136/jnnp.55.3.181. [DOI] [PMC free article] [PubMed] [Google Scholar]
- Iansek I, Huxham F, McGinley J. The sequence effect and gait festination in Parkinson disease: contributors to freezing of gait? Mov Disord. 2006;21:1419–24. doi: 10.1002/mds.20998. [DOI] [PubMed] [Google Scholar]
- Ivry R, Spencer R. The neural representation of time. Curr Opin Neurobiol. 2004;14:225–32. doi: 10.1016/j.conb.2004.03.013. [DOI] [PubMed] [Google Scholar]
- Jahanshahi M, Jones CRG, Zijlmans J, Katzenschlager R, Lee L, Quinn N, et al. Dopaminergic modulation of striato-frontal connectivity during motortiming in Parkinson’s disease. Brain. 2010;133:727–45. doi: 10.1093/brain/awq012. [DOI] [PubMed] [Google Scholar]
- Jones C, Claassen DO, Yu M, Spies JR, Malone T, Dirnberger G, et al. Modeling accuracy and variability of motor timing in treated and untreated Parkinson’s disease and healthy controls. Front Integr Neurosci. 2011;81 (5):1–12. doi: 10.3389/fnint.2011.00081. [DOI] [PMC free article] [PubMed] [Google Scholar]
- Koch G, Oliveri M, Caltagirone C. Neural networks engaged in milliseconds and seconds time processing: evidence from transcranial magnetic stimulation and patients with cortical or subcortical dysfunction. Phil Trans R Soc B. 2009;364:1907–18. doi: 10.1098/rstb.2009.0018. [DOI] [PMC free article] [PubMed] [Google Scholar]
- Lee SJ, Yoo JY, Ryu JS, Park HK, Chung SJ. The effects of visual and auditory cues on freezing of gait in patients with Parkinson disease. Am J Phys Med Rehabil. 2012;91:2–11. doi: 10.1097/PHM.0b013e31823c7507. [DOI] [PubMed] [Google Scholar]
- Logigian E, Hefter H, Reiners K, Freund HJ. Does tremor pace repetitive voluntary motor behavior in Parkinson’s disease? Ann. Neurol. 1991;30:172–79. doi: 10.1002/ana.410300208. [DOI] [PubMed] [Google Scholar]
- Meck WH. Neuroanatomical localization of an internal clock: a functional link between mesolimbic, nigrostriatal, and mesocortical dopaminergic systems. Brain Res. 2006;1109:93–107. doi: 10.1016/j.brainres.2006.06.031. [DOI] [PubMed] [Google Scholar]
- Meck WH, Penney TB, Pouthas V. Cortico-striatal representation of time in animals and humans. Curr Opin Neurobiol. 2008;18:145–52. doi: 10.1016/j.conb.2008.08.002. [DOI] [PubMed] [Google Scholar]
- Moreau C, Ozsancak C, Blatt JL, Derambure P, Destee A, Defebvre L. Oral festination in Parkinson’s disease: biomechanical analysis and correlation with festination and freezing of gait. Mov Disord. 2007;22:1503–06. doi: 10.1002/mds.21549. [DOI] [PubMed] [Google Scholar]
- Morris M, Iansek R, Galna B. Gait Festination and Freezing in Parkinson’s disease: Pathogenesis and Rehabilitation. Mov Disord. 2008;23 (Suppl 2):S451–S60. doi: 10.1002/mds.21974. [DOI] [PubMed] [Google Scholar]
- Nakamura R, Nagasaki H, Narabayashi H. Disturbances of rhythm formation in patients with Parkinson’s disease: Part I. Characteristics of tapping responses to the periodic signals. Percept Mot Skills. 1978;46:63–75. doi: 10.2466/pms.1978.46.1.63. [DOI] [PubMed] [Google Scholar]
- Nasreddine ZS, Phillips NA, Bédirian V, Charbonneau S, Whitehead V, Collin I, et al. The Montreal Cognitive Assessment, MoCA: a brief screening tool for mild cognitive impairment. J Am Geriatr Soc. 2005 Apr;53(4):695–9. doi: 10.1111/j.1532-5415.2005.53221.x. [DOI] [PubMed] [Google Scholar]
- Nieuwboer A, Vercruysse S, Feys P, Levin O, Spildooren J, Swinnen S. Upper limb movement interruptions are correlated to freezing of gait in Parkinson’s disease. Eur J Neurosci. 2009;29:1422–30. doi: 10.1111/j.1460-9568.2009.06681.x. [DOI] [PubMed] [Google Scholar]
- Nutt J, Bloem B, Giladi N. Freezing of Gait: moving forward on a mysterious clinical phenomenon. Lancet Neurol. 2011;10:734–44. doi: 10.1016/S1474-4422(11)70143-0. [DOI] [PMC free article] [PubMed] [Google Scholar]
- O’Boyle DJ, Freeman JS, Cody FW. The accuracy and precision of timing of self-paced, repetitive movements in subjects with Parkinson’s disease. Brain. 1996;119(Pt 1):51–70. doi: 10.1093/brain/119.1.51. [DOI] [PubMed] [Google Scholar]
- Pastor MA, Jahanshahi M, Artieda J, Obeso JA. Performance of repetitive wrist movements in Parkinson’s disease. Brain. 1992;115 (Pt 3):875–91. doi: 10.1093/brain/115.3.875. [DOI] [PubMed] [Google Scholar]
- Peters M. The relationship between variability of intertap intervals and interval duration. Psychol Res. 1989;51:38–42. [Google Scholar]
- Peto V, Jenkinson C, Fitzpatrick R. PDQ-39: A review of the development, validation and application of a Parkinson’s disease quality of life questionnaire and its associated measures. J Neurol. 1998;245 (S 1):S10–S14. doi: 10.1007/pl00007730. [DOI] [PubMed] [Google Scholar]
- Praamstra P, Stegeman DF, Cools AR, Horstink MW. Reliance on external cues for movement initiation in Parkinson’s disease. Evidence from movement-related potentials. Brain. 1998 Jan;121(Pt 1):167–77. doi: 10.1093/brain/121.1.167. [DOI] [PubMed] [Google Scholar]
- R Development Core Team. R:A language and environment for statistical computing. R Foundation for Statistical Computing; Vienna, Austria: 2014. Available from / http://www.R-project.org. [Google Scholar]
- Radloff LS. The CED-D scale: A self-report depression scale for research in the general population. Appl Psychol Meas. 1977;1:385–401. [Google Scholar]
- Rahman S, Grigffin HJ, Quinn NP, Jahanshahi M. The factors that induce or overcome freezing of gait in Parkinson’s disease. Behav Neurol. 2008;19:127–36. doi: 10.1155/2008/456298. [DOI] [PMC free article] [PubMed] [Google Scholar]
- Rao S, Harrington DL, Haaland KY, Bobholz JA, Cox RW, Binder JR. Distributed neural systems underlying the timing of movements. J Neurosci. 1997;17:5528–35. doi: 10.1523/JNEUROSCI.17-14-05528.1997. [DOI] [PMC free article] [PubMed] [Google Scholar]
- Riederer P, Wuketich S. Time course of nigrostriatal degeneration in Parkinson’s disease. J Neural Transm. 1976;38:277–301. doi: 10.1007/BF01249445. [DOI] [PubMed] [Google Scholar]
- Samuel M, Caballos-Baumann A, Blin J, Uema T, Boecker H, Passingham RE, et al. Evidence for lateral premotor and parietal overactivity in Parkinson’s disease during sequential and bimanual movements. A PET study. Brain. 1997;120:963–76. doi: 10.1093/brain/120.6.963. [DOI] [PubMed] [Google Scholar]
- Schaafsma J, Giladi N, Balash Y, Bartels AL, Gurevich T, Hausdorff JM. Gait dynamics in Parkinson’s disease: relationship to Parkinsonian features, falls and response to levodopa. J Neurol Sci. 2003;212:47–53. doi: 10.1016/s0022-510x(03)00104-7. [DOI] [PubMed] [Google Scholar]
- Skodda S, Schlegel U. Speech Rate and Rhythm in Parkinson’s disease. Mov Disord. 2008;23 (7):985–92. doi: 10.1002/mds.21996. [DOI] [PubMed] [Google Scholar]
- Spildooren J, Vercruysse S, Desloovere K, Vandenberghe W, Kerckhofs E, Nieuwboer A. Freezing of gait in Parkinson’s disease: the impact of dual-tasking and turning. Mov Disord. 2010;25:2563–70. doi: 10.1002/mds.23327. [DOI] [PubMed] [Google Scholar]
- Spildooren J, Vercruysse S, Meyns P, Vandenbossche J, Heremans E, Desloovere K, et al. Turning and unilateral cueing in Parkinson’s disease patients with and without freezing of gait. Neuroscience. 2012;207:298–306. doi: 10.1016/j.neuroscience.2012.01.024. [DOI] [PubMed] [Google Scholar]
- Tomlinson CL, Stowe R, Patel S, Rick C, Gray R, Clarke CE. Systematic Review of Levodopa Dose Equivalency Reporting in Parkinson’s disease. Mov Disord. 2010;25 (15):2649–85. doi: 10.1002/mds.23429. [DOI] [PubMed] [Google Scholar]
- Vandenbossche J, Deroost N, Soetens E, Coomans D, Spildooren J, Vercruysse S, et al. Freezing of gait in Parkinson’s disease: disturbances in automaticity and control. Front Hum Neurosci. 2013 Jan 10;6:356. doi: 10.3389/fnhum.2012.00356. [DOI] [PMC free article] [PubMed] [Google Scholar]
- Vercruysse S, Spildooren J, Heremans E, Vandenbossche J, Levin O, Wenderoth N, et al. Freezing in Parkinson’s disease: a spatiotemporal motor disorder beyond gait. Mov Disord. 2012a Feb;27(2):254–63. doi: 10.1002/mds.24015. [DOI] [PubMed] [Google Scholar]
- Vercruysse S, Spildooren J, Heremans E, Vandenbossche J, Wenderoth N, Swinnen SP, et al. Abnormalities and cue dependence of rhythmical upper-limb movements in Parkinson patients with freezing of gait. Neurorehabil Neural Repair. 2012;26(6):636–45. doi: 10.1177/1545968311431964. [DOI] [PubMed] [Google Scholar]
- Wing AM, Kristofferson AB. Response delays and the timing of discrete motor responses. Percept Psychophys. 1973;14:5–12. [Google Scholar]
Associated Data
This section collects any data citations, data availability statements, or supplementary materials included in this article.
Supplementary Materials
Supplementary Figure 1: Details on the optimization process used for cleaning the tapping data
Supplementary Table 1: Model coefficients and confidence intervals for the synchronization phase
Supplementary Table 2: Model coefficients and confidence intervals for the continuation phase