Abstract
Mammalian cells have two influx Cu transporters that form trimers in membranes. CTR1 is the high affinity transporter that resides largely in the plasma membrane, and CTR2 is the low affinity transporter that is primarily associated with vesicular structures inside the cell. The major differences between CTR1 and CTR2 are that CTR1 contains a HIS/MET-rich domain N-terminal of the METS that participate in the first two stacked rings that form the pore, and a longer C-terminal tail that includes a Cu binding HIS-CYS-HIS (HCH) motif right at the end. It has been reported that CTR1 and CTR2 are physically associated with each other in the cell. We used the CRISPR-Cas9 technology to knock out either CTR1 or CTR2 in fully malignant HEK293T and OVCAR8 human ovarian cancer cells to investigate the interaction of CTR1 and CTR2. We report here that the level of CTR2 protein is markedly decreased in CTR1 knockout clones while the CTR2 transcript level remains unchanged. CTR2 was found to be highly ubiquitinated in the CTR1 knock out cells, and inhibition of the proteosome prevented the degradation of CTR2 when CTR1 was not present while inhibition of autophagy had no effect. Re-expression of CTR1 rescued CTR2 from degradation in the CTR1 knockout cells. We conclude that CTR1 is essential to maintain the stability of CTR2 and that in the absence of CTR1 CTR2 is degraded by the proteosome. This reinforces the concept that the functions of CTR1 and CTR2 are inter-dependent within the Cu homeostasis system.
Keywords: genome engineering, CRISPR/Cas9, copper transporter 1, copper transporter 2, protein stability
Introduction
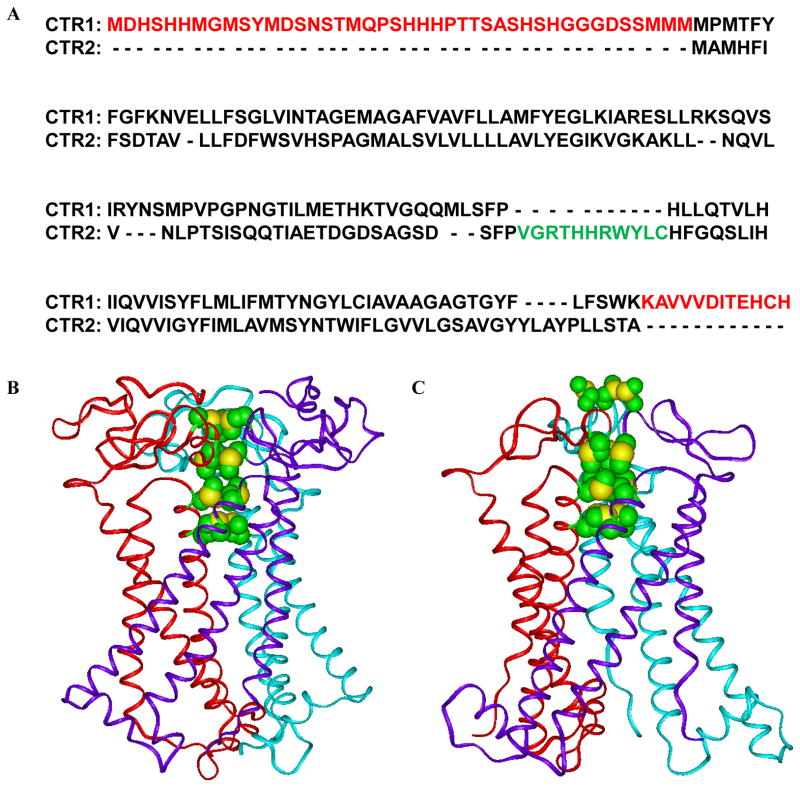
Cu is an essential element that cells must acquire from the environment. It is a cofactor for a large number of enzymes required for cell growth. Mammalian cells have two influx Cu transporters, CTR1 and CTR2. CTR1 is the high affinity transporter and resides largely in the plasma membrane. CTR2 has a lower affinity and, while some of it resides in the plasma membrane, the majority is associated with vesicular structures inside the cell 1. In yeast, CTR2 functions to mobilize Cu from the vacuole when Cu is scarce 2 but its role in mammalian cells is poorly defined. CTR1 and CTR2 share 41% amino acid homology and, as shown in Figure 1, their topology is very similar. Both have an extra-membranous N-terminal domain, 3 transmembrane domains and a C-terminal tail and when present in the plasma membrane the N-terminal is extracellular and the C-terminal intracellular 3–5. CTR1 contains 190 amino acids whereas CTR2 is only 143 amino acids long. Cryo-electron microscopy of CTR1 demonstrated that it forms a trimer in the plasma membrane 6, 7, and biochemical studies indicate that CTR2 does as well 1. Both proteins contain a set of four MET in homologous positions; in the case of CTR1 these are known to be essential for Cu transport. Building on the cryo-electron microscopic data we created all-atom models of both CTR1 and CTR2 which show that when assembled into a trimer they create four stacked rings of three MET each as shown in the lower panels of Figure 1 8. The four rings are perfectly aligned to form a pore, and the distances between the rings are such that Cu chelated by the upper ring can toggle down through the other rings in a series of transchelation reactions 9.
Figure 1.
Homology between CTR1 and CTR2, Red: the extracellular N-terminal domains and the C-terminal domains of the CTR1 that not exists in CTR2; Green: the intracellular domain of CTR2 which is lacking in CTR1 (A), the ribbon presentation of all-atom models of CTR1 showing the positions of the stacked methionine triads of MET45, MET43, MET154, and MET150 and the side chains of histidines 188 and 190 are located close to each other in the C-terminal tail of hCTR1. (B) The ribbon presentation of all-atom models of CTR2 showing the positions of the stacked methionine triads of MET3, MET1, MET115, and MET111. (C). The methionines surrounding the entrance channel at N-terminal parts of CTRs are presented in CPK model with green for carbon and yellow for sulfur atoms.
The major differences between CTR1 and CTR2 are that CTR1 contains a HIS/MET-rich domain N-terminal of the METS that participate in the first two stacked rings, and a longer C-terminal tail that includes a Cu binding HIS-CYS-HIS (HCH) motif right at the end. CTR1 transports Cu+1 but not Cu+2 in an ATP independent manner. The extra N-terminal region present in CTR1 has been proposed to concentrate Cu+2 ions and facilitate their reduction to Cu+1, whereas the HCH in the C-terminal tail appears to function as a switch to open and close the pore 7, 10–12. While the HCH motif is quite far away from the MET rings above them, biochemical studies indicate that these CYS bind Cu+1 and do influence Cu transport 13. Inward transport appears to be driven by an affinity gradient with the N-terminal domain having lower affinity Cu binding sites than the C-terminal end and the chaperones to which Cu+1 is handed 14. In addition to the affinity gradient, the electronic charge structure introduced by the additional N- and C-terminal sequences favors movement of Cu+1 from outside to inside through the CTR1 pore 8. The ability of CTR1 to transport Cu+1 but not Cu+2 may be due to the fact that Cu+2 binds much more tightly to MET than Cu+1 which may prevent Cu+2 from releasing from the first MET ring so that it can toggle to the next 9. Ag is the only other metal ion known to be transported by CTR1 and it too shares the characteristic of forming only weak bonds with MET 15.
CTR2 was identified as a Cu transporter on the basis of its homology to yCtr2, and its ability to rescue the Cu deficient phenotype of ctr1Δctr3Δ mutants 3. In yeast, Ctr2 is localized in vacuoles with the C-terminal tail oriented toward the cytosol. It has been shown that yCtr2 releases Cu from intercellular stores and delivers Cu to various chaperones under conditions of Cu starvation 3, 16, 17. However, the Ctr2-1 mutant of yeast Ctr2, that partially mislocalizes to the plasma membrane, mediates Cu transport across the plasma membrane in a manner similar to that of yCtr1 2. hCTR2 is also primarily localized to late endosomes and lysosomes, although it has been reported to be on the plasma membrane in some cells 1, 18. Mammalian CTR2 increases Cu influx in cells in which it localizes to the plasma membrane although its affinity for Cu is less than that of CTR1 1, 18. Like CTR1, CTR2 is able to bind Ag+; but not zinc, iron or manganese 1. Changes in CTR2 expression do not affect Cu efflux suggesting that it functions primarily as a regulator of influx perhaps via control of intracellular sequestration and Cu storage 1, 19–21. It has also been shown that CTR2 acts as an inhibitor of SOD1 protein expression, suggesting that CTR2 may be integral to the regulation of other Cu proteins involved in Cu homeostasis 1.
The fact that CTR2 lacks the HIS/MET-rich in the N-terminal region, and the HCH motif in the C-terminal end, has raised the question of whether it can really transport Cu or whether its ability to alter cellular Cu levels is due to an effect on CTR1 5. The all atom model of CTR2 suggests that the portion containing the four stacked MET rings (Figure 1C) may permit the movement of Cu+1 in either direction whereas the additional N- and C-terminal sequences present in CTR1 may provide directionality to the movement of Cu. Alternatively CTR2 may modulate Cu uptake by controlling the expression or function of CTR1. CTR2 has now been shown to heterotrimerize with CTR1 5 and control the level of a cleaved form of CTR1 that has lost the N-terminal 40–45 amino acids that includes much of the HIS/MET-rich region and the first two MET rings 22. It has been proposed that it is the cleaved form of CTR1 rather than CTR2 that mobilizes Cu from vesicular stores and that the ability of CTR2 to influence cellular Cu may be the result of its ability to regulate CTR1.
Prior studies of the interaction of CTR1 and CTR2 have relied on mouse embryo fibroblasts in which both alleles of CTR1 had been knocked out. These cells express very low levels of either protein, and with a very few exceptions 13, 23, it has been very difficult to develop antibodies that allow precise quantification or characterization of this transporter 24. The CRISPR/Cas9 technology has become a powerful tool for gene editing and genome engineering. A guide RNA can direct the Cas9 endonuclease to specific sites in the DNA where it creates a double strand break. Errors made during non-homologous end-joining repair produce insertions and/or deletions (indels) that can disrupt the targeted gene. To further investigate the interaction of CTR1 and CTR2 in a more tractable model that expresses higher levels of CTR1 we used the CRISPR-Cas9 technology to knock out either CTR1 or CTR2 in fully malignant HEK293 and OVCAR8 human ovarian cancer cells. We report here that the protein level of CTR2 was markedly decreased in CTR1 knock out clones partly as a result of increased ubiquitination and proteosomal degradation and that re-expression of CTR1 can rescue CTR2 from degradation. Thus, CTR1 is essential to maintain the protein stability of CTR2.
Results
Knockout of CTR1 and CTR2 in HEK293T cells
Guide RNAs were selected with the assistance of the CRISPR Design Tool from the Zhang laboratory at the Massachusetts Institute of Technology (http://crispr.mit.edu/) to target the second exon of SLC31A1, the gene coding for CTR1, or the third exon of SLC31A2, the gene coding for CTR2. Oligonucleotides homologous to the targeted sequences were ligated into the BbsI site in the pSpCas9(BB)-2A-GFP (pX458) or pSpCas9(BB)-2A-Puro (pX459) vectors. These vectors were transiently transfected into HEK293T cells and single surviving cells were sorted by FACS into 96 well plates and expanded into populations. The targeted region in each gene was amplified by PCR and the product sequenced. Approximately 15 clones were identified in which editing had occurred in SLC31A1 and 15 clones in which editing had occurred in SLC31A2. The specific mutations on the two alleles of candidate clones were identified by TOPO-TA cloning of the PCR products followed by sequencing of multiple clones. The sequence changes for the two CTR1−/− and two CTR2−/− clones selected for further study are presented in Table 1. Clone CTR1 KO-1 contained a 7 nucleotide deletion on one allele and a 1 nucleotide insertion on the other whereas clone CTR1 KO-2 contained a 1 nucleotide insertion on both alleles. Clone CTR2 KO-1 contained an 11 nucleotide deletion on both alleles whereas clone CTR2 KO-2 contained a 24 nucleotide deletion on one allele and a 1 nucleotide deletion on the other. The specific amino acid changes produced are shown in Table 2. In all cases, the genomic editing resulted in either a truncated, out of frame or unstable form of CTR1 and CTR2.
Table 1.
Genomic sequences of target sites in CTR1 and CTR2 knockout HEK293T and OVCAR8 clones.
| CTR1 | ||
|---|---|---|
| Allele 1 | Allele 2 | |
| WT | ATGGATCATTCCCACCATATGG GGATGAGCTATAT |
ATGGATCATTCCCACCATATGG GGATGAGCTATAT |
| HEK293T CTR1 KO-1 |
ATGGATCATTCCC - - - - - - - GG GGATGAGCTATAT(Δ7) |
ATGGATCATTCCCACCATATGG GGGATGAGCTATAT (+1) |
| HEK293T CTR1 KO-2 |
ATGGATCATTCCCACCATATGG GGGATGAGCTATAT (+1) |
ATGGATCATTCCCACCATATGG GGGATGAGCTATAT (+1) |
| OVCAR8 CTR1 KO-1 |
ATGGATCATTCCCACCATATG- GGATGAGCTATAT (Δ1) |
ATGGATCATTCCCACCATATG- GGAT GAGCTATAT (Δ1) |
| OVCAR8 CTR1 KO-2 |
ATGGATCATTCCCACCATATG - - - - - - - - - - ATAT(Δ10) |
ATGGATCATTCCCACCATATG - - - - - - - - - ATAT(Δ10) |
| CTR2 | ||
| Allele 1 | Allele 2 | |
| WT | CAGCAGACCATCGCAGAGACA GACGGGGACTCTGCAGGCTCAG ATTCATTCCC |
CAGCAGACCATCGCAGAGACA GACGGGGACTCTGCAGGCTCAG ATTCATTCCC |
| HEK293T CTR2 KO-1 |
CAGCAGACCA - - - - - - - - - - - GACGGGGACTCTGCAGGCTCAG ATTCATTCCC (Δ11) |
CAGCAGACCA - - - - - - - - - - - GACGGGGACTCTGCAGGCTCAG ATTCATTCCCT (Δ11) |
| HEK293T CTR2 KO-2 |
CAGCAGACCATCG- - - - - - - - - - - - - - - - - - - - - - - - GCTCAG ATTCATTCCC(Δ24) |
CAGCAGACCATC - CAGAGACA GACGGGGACTCTGCAGGCTCAG ATTCATTCCC (Δ 1) |
| OVCAR8 CTR2 KO-1 |
CAGCAG - - - - - - - AGAGACA GACGGGGACTCTGCAGGCTCAG ATTCATTCCC (Δ8) |
- - - - - - - - - - - - - CAGAGACA GACGGGGACTCTGCAGGCTCAG ATTCATTCCC(Δ13) |
| OVCAR8 CTR2 KO-2 |
CAGCAGACCATCG –AGAGACA GACGGGGACTCTGCAGGCTCAG ATTCATTCCC(Δ1) |
CAGCAGACCATCG – AGAGACA GACGGGGACTCTGCAGGCTCAG ATTCATTCCC(Δ1) |
Table 2.
Amino acid sequences of target sites in CTR1 and CTR2 knockout HEK293T and OVCAR8 clones.
| CTR1 | ||
|---|---|---|
| Allele 1 | Allele 2 | |
| WT | MDHSHHMGMSYMDSNSTMQPS HHHPTTSASHSHGGGDSSMMM MPMTFYFGF |
MDHSHHMGMSYMDSNSTMQPS HHHPTTSASHSHGGGDSSMMM MPMTFYFGF |
| HEK293T CTR1 KO-1 |
MDHSRG* | MDHSHHMGDELYGLQQYHATFS PSPNHFSLTLPWWRRQQHDDDA YDLLLWL* |
| HEK293T CTR1 KO-2 |
MDHSHHMGDELYGLQQYHATF SPSPNHFSLTLPWWRRQQHDDD AYDLLLWL* |
MDHSHHMGDELYGLQQYHATFS PSPNHFSLTLPWWRRQQHDDDA YDLLLWL* |
| OVCAR8 CTR1 KO-1 |
MDHSHHMG* | MDHSHHMG* |
| OVCAR8 CTR1 KO-2 |
MDHSHHMIWTPTVPCNLLTITQP LQPHTPMVEETAA* |
MDHSHHMIWTPTVPCNLLTITQP LQPHTPMVEETAA* |
| CTR2 | ||
| Allele 1 | Allele 2 | |
| WT | QQTIAETDGDSAGSDSFPVGRTH HRWYLCHFGQSLIHVIQVVIGYFI |
QQTIAETDGDSAGSDSFPVGRTH HRWYLCHFGQSLIHVIQVVIGYFI |
| HEK293T CTR2 KO-1 |
QQTRRGLCRLRFIPCWQ | QQTRRGLCRLRFIPCWQ |
| HEK293T CTR2 KO-2 |
QQTIGSDSFPVGRTHHRWYLCHF GQSLIHVIQVVIGYFI |
QQTIQRQTGTLQAQIHSLLAEPTT GGICVTLASL* |
| OVCAR8 CTR2 KO-1 |
QQRDRRGLCRLRFIPCWQNPPQV QAVGMGKGQKPHIHPRANSFKP |
QRQTGTLQAQIHSLLAEPTTGTG SGYGKGAEASHSPKGEFV* |
| OVCAR8 CTR2 KO-2 |
QQTIERQTGTLQAQIHSLLAEPTT GTGSGYGKGAEASHSPKGEFV* |
QQTIERQTGTLQAQIHSLLAEPTT GTGSGYGKGAEASHSPKGEFV* |
Premature stop codon that causes early termination
Knockout of CTR1 reduces CTR2 levels in HEK293T cells
The representative Western blot presented in Figure 2A shows that that there was no expression of CTR1 in either of two CTR1−/− clones, and no expression of CTR2 in either of two CTR2−/− clones indicating that lesions produced in the targeted sequences in each gene were effective in eliminating expression of CTR1 and CTR2 at the protein level. While knockout of CTR2 had no effect on the level of expression of CTR1, knockout of CTR1 unexpectedly decreased the level of CTR2 in both CTR1−/− clones. In the CTR1 KO-1 clone the level of CTR2 was only 22.3 ± 1.8 % of that in the wild type HEK293T cells, and in the CTR1 KO-2 clone it was only 9.8 ± 1.8 % (Figure 2B, n = 4, p<0.001). To exclude the possibility that the decrease in total CTR2 protein levels was due to a decrease in CTR2 mRNA, the CTR2 mRNA was quantified by qRT-PCR. No change was expected because the lesions in these alleles do not stop transcription of the gene and, as shown in Figure 2C, indeed there was no significant change in CTR2 mRNA level in the CTR1−/− or CTR2−/− clones. Thus, the reduction in CTR2 appears to be the result of a post-translation process.
Figure 2.
Effect of knocking out CTR1 on CTR2 protein levels in HEK293T cells. (A) Basal CTR1 and CTR2 protein levels in CTR1 and CTR2 knockout cells. (B) Quantification of CTR1 and CTR2 protein levels in CTR1 and CTR2 knockout cells (N = 4, p<0.001). (C) Relative levels of CTR2 mRNA in CTR1 and CTR2 knockout clones (n=6). Vertical, bars, ± SEM; ***, p<0.001
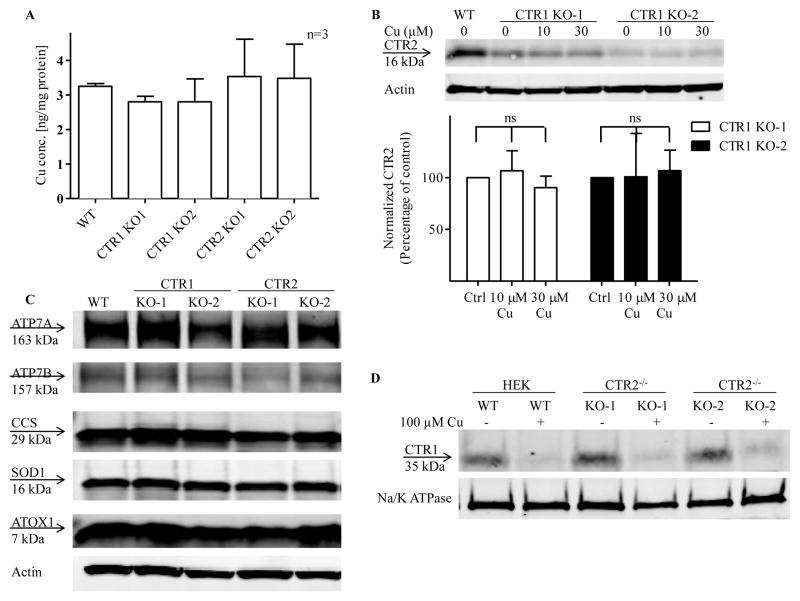
Three lines of evidence argue that the reduction in CTR2 was not due low intracellular Cu levels or a major perturbation of the Cu homeostasis system. First, as shown in Figure 3A there was no significant difference in basal Cu content among the cells. Second, treatment of the CTR1−/− cells with 10 or 30 μM Cu for 24 h did not restore the CTR2 protein levels (Figure 3B). Third, knockout of CTR1 did not produce major changes in the level of ATOX1, SOD1, CCS, ATP7A and ATP7B as determined by Western blot analysis of whole cell lysates (Figure 3C). Thus, the markedly reduced the level of CTR2 in the CTR1−/− cells did not appear to be the consequence of altered Cu homeostasis. This conclusion is buttressed by quantification of plasma membrane CTR1 as determined by cell surface biotinylation. There was no reduction in plasma membrane CTR1 in the CTR2−/− cells suggesting that trafficking from the trans-Golgi to the plasma membrane was intact in the absence of CTR2, and exposure to Cu triggered the normal loss of CTR1 from the plasma membrane indicating that the CTR1 endocytotic mechanism was intact (Figure 3D).
Figure 3.
Cu homeostasis in CTR1 and CTR2 KO cells (A) Whole cell Cu content in CTR1 and CTR2 knockout cells comparing to WT cells. (B) Effect of Cu supplementation on CTR2 protein levels in CTR1 knockout cells. The immunoblot shown is representative of 3 independent experiments. (C) ATOX1, SOD1, CCS, ATP7A and ATP7B protein levels in HEK293T WT, CTR1 and CTR2 KO cells. The immunoblot shown is representative of 3 independent experiments. (D) CTR1 plasma membrane levels and Cu-induced clearance of CTR1 from the plasma membrane of CTR2 KO cells. Vertical, bars, ± SEM
CTR2 is degraded by the ubiquitin-proteasome pathway in CTR1 KO cells
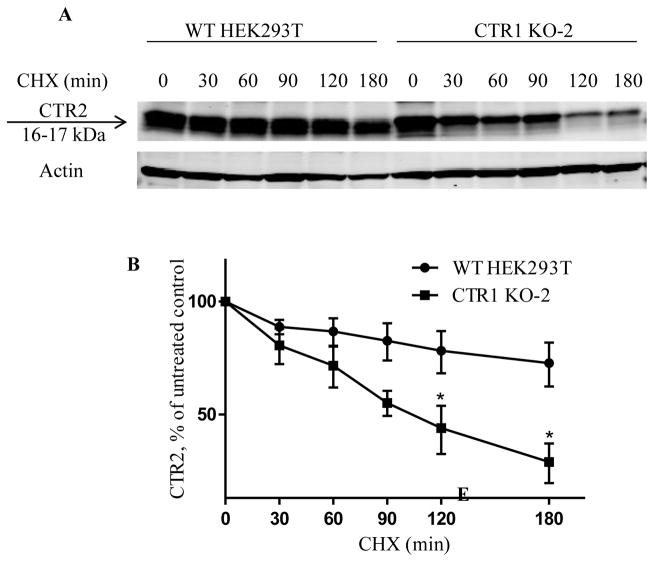
The observation that the decrease of CTR2 protein level in CTR1 knockout clones was not the result of a decrease in CTR2 mRNA or intracellular Cu level suggested that CTR1 is required to maintain the stability of CTR2 and prevent its degradation by the proteosome. To test this hypothesis, we first examined CTR2 half-life in wild type HEK293T and CTR1 KO-2 cells using cycloheximide (CHX) pulse-chase assay. The endogenous CTR2 level in CTR1 KO-2 cells was only 10% of that in wild type HEK293T cells. To accurately quantitate CTR2 protein level for the determination of its half-life, a vector expressing a FLAG-tagged CTR2 was transiently transfected into HEK293T and CTR1 KO-2 cells. Forty-eight h later the cells were treated with CHX to block new CTR2 synthesis, and the CTR2 levels were determined as a function of time by Western blot analysis using an anti-CTR2 antibody. The data presented in Fig. 4A and B demonstrate that, in the wild type HEK293T cells the CTR2 level fell to 68.6 ± 9.2 % of its initial level during the 3 h exposure to CHX. In contrast, in the CTR1 KO-2 cells the CTR2 level fell to only 34 ± 4.5 % of its initial level (n=3, p<0.05). These experiments indicated that the CTR2 half-life is significantly shortened in the absence of CTR1.
Figure 4.
Effect of CTR1 knockout on the stability of CTR2. (A) Representative Western blot showing CTR2 protein level in wild type HEK293T and CTR1 KO-2 cells after exposure to 5 μg/ml cycloheximide for 0, 30, 60, 90, 120 or 180 min. (B) Plot of the percentage of remaining CTR2 protein as a function of time after the start of cycloheximide treatment
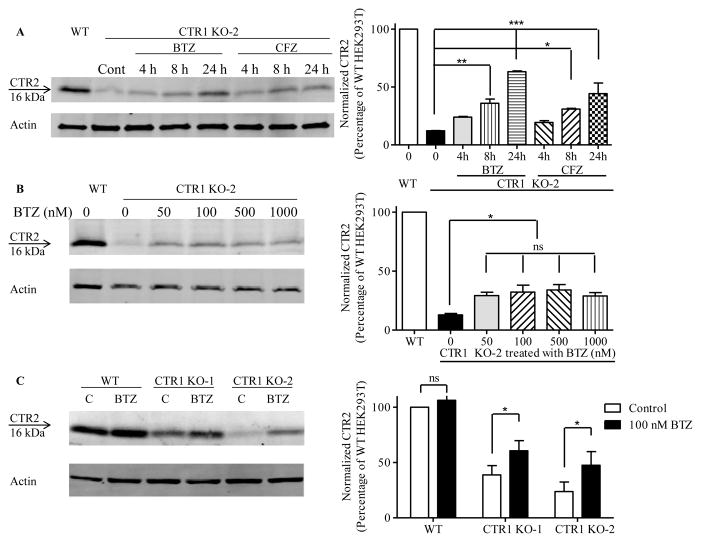
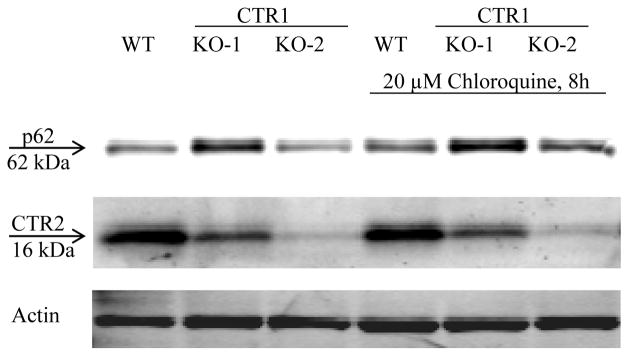
We next determined whether CTR1 protects CTR2 from proteasomal degradation by measuring CTR2 levels after treating the CTR1 knockout clones with either the reversible proteasomal inhibitor bortezomib (BTZ) or the irreversible proteasomal inhibitor carfilzomib (CFZ). First, CTR1 KO-2 cells were treated with 100 nM BTZ or CFZ for 4, 8 or 24 h (Figure 5A). The CTR2 level increased by 2.9 ± 0.3 and 5.1 ± 0.2-fold after 8 and 24 h exposures to BTZ, respectively; the level increased by 2.5 ± 0.009 and 3.6 ± 0.8-fold after equivalent exposures to CFZ. The effects of BTZ and CFZ were statistically equivalent. Although a 24 h exposure produced a larger increase in CTR2, ~40 % of cells were dead at this point so an 8 h exposure to BTZ was chosen for subsequent studies. Figure 5B shows that the maximal increase in CTR2 achieved with an 8 h exposure to BTZ was attained at 100 nM and thus this concentration was selected for subsequent experiments. These results establish that, in the absence of CTR1, CTR2 is degraded by the proteasome. An 8 h exposure of the wild type HEK293T cells to 100 nM BTZ produced no change in CTR2 level whereas it increased CTR2 by factors of 1.6 ± 0.2 and 2.2 ± 0.4 in the CTR1 KO-1 and CTR1 KO-2 cells, respectively (Figure 5C). This indicated that, in the presence of CTR1, inhibition of the proteasome had no effect on CTR2 level but that, in its absence, CTR2 is susceptible to proteosomal degradation. Thus, CTR1 protects and stabilizes CTR2 under normal conditions. To exclude the possibility that when CTR1 was absent CTR2 was also being degraded by autophagy the wild type HEK293T cells and the CTR1 KO-1 and CTR1 KO-2 clones were exposed to 20 μM chloroquine for 8 h. Unlike BTZ and CFZ, chloroquine failed to increase the CTR2 level in the CTR1 knockout cells when p62 was used as a positive control of the effectiveness of chloroquine (Figure 6).
Figure 5.
Proteasomal inhibitors block degradation CTR2 in CTR1 knockout HEK293T cells. (A) Effect of increasing duration of exposure to 100 nM BTZ or CFZ on CTR2 protein level in CTR1 KO-2 cells. (B) Effect of an 8 h exposure to increasing BTZ concentrations on CTR2 level in CTR1 KO-2 cells. (C) Effect of an 8 h exposure to 100 nM BTZ on CTR2 protein level in CTR1 knockout clones. N = 3 for each histogram. Vertical, bars, ± SEM; *, p<0.05; **p<0.01; ***p<0.001.
Figure 6.
The effect of chloroquine on CTR2 protein levels in wild type HEK293T, CTR1 KO-1 and CTR1 KO-2 cells. The immunoblot shown is representative of 3 independent experiments.
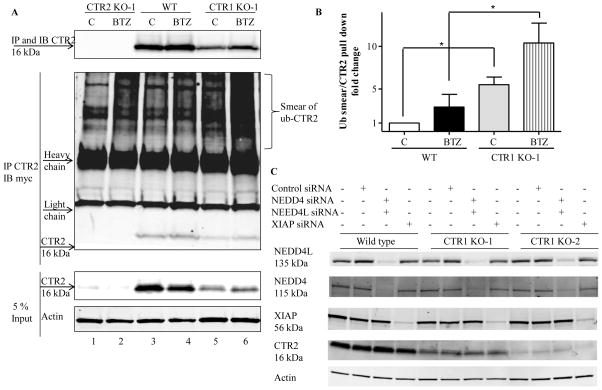
Proteins are marked for proteosomal degradation by ubiquitination. To determine whether loss of CTR1 enhanced the ubiquitination of CTR2, the wild type HEK293T and CTR1 KO-1 were transfected with myc-tagged ubiquitin and 16 h later they were treated with 100 nM BTZ for 8 h. Whole cell lysates were collected and equal amounts of total proteins were immunoprecipitated with anti-CTR2 and subjected to immunoblot analysis with anti-CTR2 and anti-myc antibody. Because there was no CTR2 in CTR2 KO-1 cells, CTR2 KO-1 cells were used as a negative control of the specificity of anti-CTR2 antibody (Figure 7A, lanes 1 and 2). When the anti-CTR2 antibody was used to pull down CTR2 from the wild type cells only a small amount of myc-tagged ubiquitin-CTR2 conjugate was immunoprecipitated. (The ubiquitin-CTR2 conjugate appears as a smear above the antibody heavy chain band in Figure 6A). We quantified the ubiquitin smear and normalized it to the amount of CTR2 pulled down in each precipitation and the results are shown in Figure 7B. In the absence of inhibition of the proteosome by BTZ, immunoprecipitation of CTR2 brought down 5.5 ± 1.6-fold more ubiquitin-CTR2 from the CTR1 KO-1 than the wild type cells. Following treatment with BTZ, immunoprecipitation of CTR2 brought down 10.4 ± 2.3-fold more ubiquitinated CTR2 from the CTR1 KO-1 than the wild type cells (n=3). This is consistent with the concept that when CTR1 protects CTR2 in the wild type cells such that only a minor fraction is ubiquitinated at steady-state whereas a much larger fraction is ubiquitinated when CTR1 is missing. We sought to determine whether NEDD4, NEDD4L or XIAP could be the potential ubiquitin E3 ligase responsible for the degradation of CTR2. NEDD4 and NEDD4L are the human homologs of RSP5, a yeast E3 ligase that degrades yCTR125, 26 and XIAP is a Cu binding protein with ubiquitin E3 ligase activity that degrades COMMD1 and CCS 27, 28. The wild type HEK293, CTR1 KO-1 and CTR1 KO-2 cells were transfected with a combination of NEDD4 and NEDD4L siRNAs, or with an XIAP siRNA. The knockdown efficiencies of three siRNAs were more than 90 % in each type of cell. However, none produced a significant increase in the CTR2 level in any of the 3 cell types (Figure 7C). Therefore, XIAP, NEDD4 or NEDD4L are probably not the key ubiquitin E3 ligase involved in the degradation of CTR2 in this model system.
Figure 7.
CTR2 is subject to ubiquitination in CTR1 knockdown cells. Wild type HEK293T cells and the CTR2 KO-1 and CTR1 KO-1 clones were transfected with a vector expressing myc-tagged ubiquitin and 16 h later treated with 100 nM BTZ for 8 h. (A) Whole cell lysates were collected and equal amounts of total proteins were immunoprecipitated (IP) with anti-CTR2 and subjected to immunoblot (IB) analysis with anti-CTR2 (upper) and anti-myc antibody (middle). Five percent of the total protein was used as input (bottom). CTR2 KO-1 cells were used as a negative control for the anti-CTR2 antibody. The immunoblot shown is representative of 3 independent experiments. (B) Quantitation of ubiquitinated CTR2 smear to amount of CTR2 in the immunoprecipitate (n=3). Vertical bars, ± SEM; *, p<0.05. (C) XIAP, NEDD4 and NEDD4L were knocked down using siRNA in HEK293T, CTR1 KO-1 and CTR1 KO-2 cells and CTR2 protein levels were measured. The immunoblot shown is representative of 3 independent experiments.
Re-expression of CTR1 in CTR1 KO cells rescues CTR2 from degradation
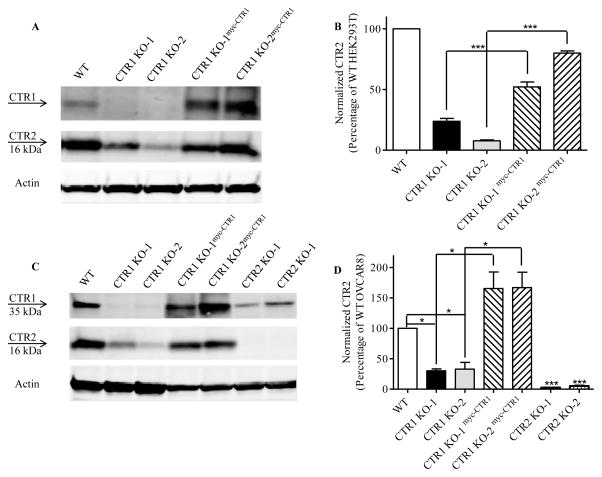
To provide further evidence that CTR1 stabilizes CTR2, CTR1 was re-expressed in the HEK293 CTR1 KO-1 and CTR1 KO-2 cells. A lentiviral vector containing a blastocidin resistance marker was constructed to express an N-terminal myc-tagged form of wild type hCTR1. CTR1 KO-1 and CTR2 KO-2 cells were infected and selected with blastocidin to generate the CTR1 KO-1myc-CTR1 and CTR1 KO-2myc-CTR1 cells. Figure 8A documents the re-expression of CTR1 by Western blot analysis using an anti-CTR1 antibody. The re-expression of CTR1 increased CTR2 by 2.2 ± 0.06 and 10.6 ± 0.8-fold in the CTR1 KO-1 and CTR1 KO-2 cells, respectively. These results further support the conclusion that CTR1 is required for the stability of CTR2.
Figure 8.
Re-expression of CTR1 in CTR1 knockout cells rescues CTR2 in HEK293T and OVCAR8 cells. (A) CTR1 and CTR2 protein levels were measured and quantified in HEK293T wild type (WT), CTR1 KO-1, CTR1 KO-2, CTR1 KO-1mycCTR1 and CTR1 KO-2mycCTR1 cells. N = 3. Vertical, bars, ± SEM; ***, p<0.001. (B) CTR1 and CTR2 protein levels were measured and quantified in OVCAR8, CTR1 KO-1, CTR1 KO-2, CTR1 KO-1mycCTR1, CTR1 KO-2mycCTR1, CTR2 KO-1 and CTR2 KO-2 cells. N = 3. Vertical, bars, ± SEM; *, p<0.05; ***, p<0.001
CTR1 is required to maintain the level of CTR2 in human ovarian cancer cells
CTR1 and CTR2 influence the cellular pharmacology of cisplatin and carboplatin 29. Although HEK293T cells are malignant they have an uncertain origin 30, 31. To establish the biologic relevance for a disease routinely treated with these drugs CTR1 and CTR2 were knocked out using the same CRISPR-Cas9 technology in the OVCAR8 ovarian cancer cell line. The nucleotide and amino acid changes found in two CTR1 and two CTR2 knockout OVCAR8 clones are presented in Table 1 and Table 2. The immunoblot analysis presented in Figure 8B shows that knockout of CTR1 reduced the level of CTR2 to 30.2 ± 3.1 % of control in the CTR1 KO-1 clone and to 32.9 ± 11.1 % of control in the CTR1 KO-2 clone. As for the HEK293T cells, knockout of CTR2 failed to affect the level of CTR1 in either the CTR2 KO-1 or the CTR2 KO-2 clone. Thus, the ability of CTR1 to stabilize CTR2 is not unique to the HEK293T cell line. CTR1 were also re-expressed in the CTR1 knockout OVCAR8 clones. The re-expression of CTR1 again restored CTR2 level increasing it by 5.5 ± 0.8 and 6.4 ± 2.1-fold in the CTR1 KO-1 and CTR1 KO-2 cells, respectively. These results support the conclusion that CTR1 is required for the stability of CTR2.
Discussion
Cu is required for the growth of human tumors and, although systemic depletion of Cu by administration of Cu chelators by themselves has limited activity, recent studies have disclosed situations in which oncogenic transformation creates demand for Cu that exposes unique vulnerabilities. In particular, melanomas harboring the BRAFV600E mutation are critically dependent on the function of CTR1 and are hypersensitive to the Cu chelator tetrathiomolybdate due to the fact that MEK1/2 is a Cu-dependent enzyme 32, 33. This example points up the need to understand the how CTR1 and CTR2 function to maintain Cu homeostasis in human tumors.
In part because of the difficultly in making high quality antibodies to CTR1 and CTR2, their interaction has been difficult to study. The CRISPR-Cas9 technology now provides a facile approach to definitively examining how the elimination of one protein affects the fate of the other. Although the transfection efficiency of the HEK293T cells is substantially higher than that of the OVCAR8 cells, little difficulty was encountered in isolating CTR1 and CTR2 knockout clones from either of these two malignant cell types.
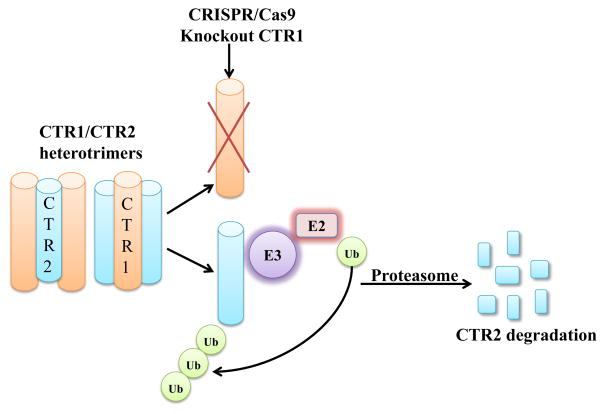
We report here the novel observation that CTR1 protects CTR2 against proteosomal degradation as shown schematically in Figure 8. We successfully knocked out CTR1 in HEK293T and OVCAR8 cells. CTR2 is decreased in the CTR1 KO cells in both cell lines. While the addition of Cu or inhibition of autophagy did not rescue CTR2 protein level, protesomal inhibitors did. Re-introduced CTR1 back to the CTR1 KO cells restored expression of CTR2 indicating that CTR1 protects CTR2 from proteosomal degradation. As shown in Figure 1, CTR1 and CTR2 exhibit substantial homology and our all-atom modeling suggests that CTR2, like CTR1, forms a homotrimer in the membrane. Using a FRET based approach with YFP on the carboxyl-terminal end of CTR1 and YFP on the amino-terminal end of CTR1, Ohrvik et al. reported that CTR1 can form a heteromeric complex with CTR2. Thus, there is evidence for a physical interaction that is likely to underlie the ability of each protein to protect the other. No information is currently available regarding what percent of either protein is complexed to the other, or the stoichiometry of the most abundant complexes. While more CTR1 is found in the plasma membrane than CTR2 by immunocytochemical analysis, there is a substantial amount of CTR1 on intracellular membranes in many cells that may reflect the distribution of heteromeric complexes. However, the observation that knockout of CTR1 resulted a large reduction in CTR2 suggests that a substantial fraction of CTR2 is bound to CTR1 in some fashion. In contrast, even in the CTR2 knockout cells, the majority of CTR1 is found in a non-cleaved form suggesting that a smaller fraction of the total CTR1 pool is bound to CTR2. Where the heteromeric complexes form during synthesis and intracellular distribution, and exactly how CTR1 limits the proteolysis CTR2 remain important questions for future investigation.
Ohrvik et al (5) reported that the level of CTR2 regulated the N-terminal cleavage of CTR1 in both mouse embryo fibroblasts and HEK293 cells. The anti-CTR1 antibody available to us does not detect the cleaved form of CTR1 and thus we were unable to assess the impact of the loss of CTR2 on CTR1 structure in our knockout cells.
The fact that knockout of CTR1 causes loss of CTR2 complicates assessment of the importance of each of these transporters as regulators of intracellular Cu and the cellular pharmacology of cisplatin and carboplatin. We have previously shown, in both murine embryo fibroblasts and in human ovarian cancer cells, that down regulation of CTR2 results in hypersensitivity to cisplatin that is accompanied by increased cellular accumulation of the drug 21, 34. Since knockdown of CTR2 did not alter the level of CTR1 this effect might be ascribed to CTR2 except for the possibility that if most of CTR2 exists in a heteromeic complex with CTR1 it may be the function of CTR1 that is changing. Likewise, the extent to which altering the expression of CTR1 in different types of cells alters sensitivity to cisplatin is quite variable, a result perhaps of the loss of CTR2 when CTR1 expression is suppressed.
No information is known about the ubiquitin E3 ligase that controls the degradation of CTR2. The only ubiquitin ligase known to degrade a Cu transporter is yeast Rsp5 which degrades yCTR135. We were led to consider NEDD4 (neural precursor cell-expressed developmentally down-regulated 4) and NEDD4-L (neural precursor cell-expressed developmentally down-regulated 4-like) since these are the human homologs of Rsp5. However, knock down of NEDD4 and NEDD4-L failed to increase the level of CTR2 in the CTR1 knockout cells and there is no other evidence to suggest that either NEDD4 or NEDD4L regulate the degradation of CTR1 or CTR2 in mammalian cells. CTR1 and CTR2 do not contain the PY motifs (PPxY or LPSY) which are identified as binding partners for the NEDD4 proteins. The X-linked inhibitor of apoptosis protein (XIAP) was identified as a Cu-binding protein and regulator of Cu homeostasis in addition to its well-known role as a potent suppressor of apoptosis. XIAP binds and ubiquitinates COMMD1 (copper metabolism domain containing 1) and CCS (copper chaperone for superoxide dismutase) both of which play important roles in regulating Cu homeostasis. The binding of XIAP to COMMD1 and CCS is via its BIR3 domain and there is no evidence to suggest that BIR3 domains can bind to CTR2. Thus, identification of the E3 ligase involved in CTR2 degradation will require further investigation.
Experimental
Drugs and Reagents
Detergent-compatible protein assay kit, DC™ Protein Assay was purchased from BioRad Laboratories, Inc. (Hercules, CA). Bortezomib (BTZ, Velcade; Millenium Pharmaceuticals) was obtained from the University of California San Diego Moores Cancer Center pharmacy. Carfilzomib (CFZ), cycloheximidie (CHX) and chloroquine were obtained from Sigma Aldrich (St. Louis, MO). Blasticidin and puromycin were both obtained from Thermo Fisher Scientific (Waltham, MA). Anti-CTR1 primary antibody was a gracious gift from Dr. Marcus Kuo 36. Mouse monoclonal antibody to hCTR2 was obtained from the National Cancer Institute 34. Anti-myc primary antibody 9B11, anti-Na+/K+ ATPase antibody and XIAP siRNA were purchased from Cell Signaling Technology, Inc. (Danvers, MA). Anti-SOD1 and anti-CCS antibody were purchased from Santa Cruz Biotechnology (Dallas, Texas). Anti-ATOX1 and ATP7B antibodies were purchased from Abcam (Cambridge, MA). Anti-ATP7A antibody was purchased from NeuroMAb (The UC Davis/NIH). Anti-p62 primary antibody was from BD Biosciences (San Jose, CA). TOPO TA cloning kit for sequencing was purchased from Life Technologies (Grand Island, NY). siRNA negative control, NEDD4 and NEDD4L siRNAs and Lipofectamine RNAiMAX were purchased from Life Technologies, Inc (Grand Island, NY)
Cell types, Culture and Engineering
HEK293T cells were obtained from the American Type Tissue Culture Collection. Parental HEK293T and sublines were cultured in DMEM medium (HyClone; Logan, UT) supplemented with 10 % fetal bovine serum (HyClone; Logan, UT), sodium pyruvate and glutamine. OVCAR8 ovarian cancer cells were obtained from Dr. Tom Hamilton, Fox Chase Cancer Center and cultured in RPMI 1640 medium (HyClone; Logan, UT) supplemented with 10 % fetal bovine serum at 37 °C, 5 % CO2. The wild-type myc-tagged hCTR1 was constructed in the vector pENTR/D-TOPO and then transferred to the pLenti6/V5-DEST by LR reaction as previously described 37. The myc-CTR1WT lentiviral particles were produced in HEK293T cells using the ViraPower™ packaging kit (Invitrogen; Carlsbad, CA) and then transduced into the HEK293T and OVCAR8 CTR1 KO-1 and CTR1 KO-2 cells under 8 μg/mL blasticidin selection.
Generation of CTR1 and CTR2 knock out cell lines using CRISPR Cas9 technology
The single guide RNA (sgRNA) construction and delivery was done according to the Nature Protocols 38. In brief, sgRNA design was based on CRISPR design (http://crispr.mit.edu/). The sequence targeted in SLC31A1 was TATGGGGATGAGCTATATGG on the coding strand in the second exon; the sequence targeted in SLC31A2 was TCGCAGAGACAGACGGGGAC on the coding strand in the third exon. A set of self-complementary gRNA oligos corresponding to these targets (SLC31A1: 5′-CACCGCATATAGCTCATCCCCATA-3′ and 5′-AAACTATGGGGATGAGCTATATGC3′) and SLC31A2 (5′-GTCCCCGTCTGTCTCTGCGATGG-3′ and 5′-AAACTCGCAGAGACAGACGGGGAC3-′) were purchased from Integrated DNA Technologies (Coralville, Iowa) and annealed and ligated into pSpCas9(BB)-2A-GFP (pX458) or pSpCas9(BB)-2A-Puro (pX459) (Addgene, Cambridge, MA) using T4 DNA ligase (New England Biolabs, Ipswich, MA) to generate GFP-Cas9 or puromycin-Cas9 fusion plasmids co-expressed with sgRNA to allow screening or selection of transfected cells. CRISPR plasmids were transiently transfected into HEK293T cells or OVCAR8 cells using Lipofectamine 2000 (Life Technologies, Inc Grand Island, NY) according to the manufacturer’s protocol. Cells transfected with GFP-Cas9 plasmids were sorted 48 h after transfection by fluorescence-activated cell sorting (FACS) based on GFP signal into individual wells of 96-well plates and incubated for 2–3 weeks. The sorted clones were then expanded in 12-well plates, followed by extraction of genomic DNA for genomic PCR using standard methods. Cells transfected with Puromycin-Cas9 plasmids were subject to 3 μg/mL puromycin selection 24 h after transfection for 48 h. Cells were then cultured in regular media until confluent. Single clones were acquired as mentioned above. The editing at the target site of candidate clones was confirmed by TOPO TA cloning of PCR products spanning the target site according to manufacturer’s protocol (Life Technologies, Grand Island, NY) followed by Sanger sequencing of a minimum of 10 clones for knockout cell line.
Quantitative real time PCR
Total cellular RNA was isolated using the RNeasy mini kit (QIAGEN, Valencia, CA). First-strand cDNA was synthesized using SuperScript II reverse transcriptase and random primers (Life Technologies, Grand Island, NY). Quantitative real-time PCR was performed using the Bio-Rad iCycler iQ detection system in the presence of SYBR Green I dye (Bio-Rad Laboratories, Inc, Hercules, CA). GAPDH was used as reference gene and relative mRNA levels were determined using the 2(−ΔΔCt) method. A 1-unit difference of Ct value represents a twofold difference in the level of mRNA.). The forward and reverse primers for CTR2 were: 5′-gtcctgctggcatggccctt-3′ and 5′-gtctgtctctgcgatggtct-3′, respectively.
Immunoprecipitation and Immunoblotting Procedure
Cells were harvested and washed twice with ice-cold PBS. The pelleted cells were lysed with RIPA buffer (50 mM Tris, 150 mM NaCl, 0.1 % SDS, 0.5 % sodium deoxycholate, 1 % Triton X-100) plus protease and phosphatase inhibitors (Thermo Scientific, Pittsburg, PA). Protein concentrations were determined by detergent-compatible protein assay kit, DC™ Protein Assay (Bio-Rad, Hercules, CA). Equal amount of proteins were incubated with either anti-CTR2 or anti-myc antibody and protein A/G beads (Thermo Scientific, Pittsburg, PA) overnight at 4°C with end-over-end rotation. The beads were then washed 5 times with ice-cold RIPA buffer and proteins were eluted by incubating the beads with Laemmli’s 2× sample buffer (125 mM Tris–HCl, pH 6.8, 2 mM EDTA, 6% SDS, 20% glycerol, 5% β-mercaptoethanol and 0.25% bromophenol blue) at 95 °C for 5 min and subjected to Western blot analysis using an antibody to the myc tag or to CTR2. Protein expression on the Western blots was quantified using an Odyssey Imaging System (Li-Cor Biosciences, Lincoln, NE) utilizing software version 3.0. Expression of CTR1 or CTR2 in the experimental cells was expressed as a percent of that in the control cells after normalization to the level of beta-actin 39.
Measurement of CTR2 half-Life
Wild type HEK293T cells and CTR1 KO-2 clone were transfected with a vector expressing FLAG-tagged hCTR2 and 48 h later they were exposed to 5 μg/mL cycloheximide for 0, 30, 60, 90, 120 or 180 min. Cells were then washed three times with PBS, and lysates were harvested for immunoblotting as described above.
Modeling of hCTR2 Structure
The structure of the hCTR2 transporter was modeled using our model of CTR1 using the PDB databank fragments substitution module of the Homology program (Accelrys, San Diego) 8. The model underwent 10,000 iterations using Steepest Descent minimization.
RNAi knock down
HEK293T, CTR1 KO-1 and CTR1 KO-2 cells were seeded in six-well plates at a density of 0.25 × 10⁶ cells/well. The following day siRNA was added to wells according to the manufacturer’s instructions and incubated for 48 h before collection of cells for Western blot analysis.
Measurement Cu content
Whole cell Cu content was measured as previously reported 40. All data presented are the means of at least 3 independent experiments, each performed with 6 cultures per concentration tested.
Cell surface Biotinylation
The plasma membrane localization of CTR1 was measured by cell surface biotinylation as previous reported37.
Statistical Analysis
All two-group comparisons utilized Student’s t-test with the assumption of unequal variance. Data are presented as mean ± SEM of a minimum of 3 independent experiments.
Figure 9.
Proposed model of the regulation of CTR2 by CTR1. When CTR1 is present CTR2 is protected from ubiquitination. When CTR1 is missing, CTR2 becomes ubiquitinated and is subsequently degraded in the proteosome.
Acknowledgments
This work was supported by grants R01-CA152185 and T32CA121938 from the National Institutes of Health.
References
- 1.van den Berghe PV, Folmer DE, Malingre HE, van Beurden E, Klomp AE, van de Sluis B, Merkx M, Berger R, Klomp LW. Biochem J. 2007;407:49–59. doi: 10.1042/BJ20070705. [DOI] [PMC free article] [PubMed] [Google Scholar]
- 2.Rees E, Lee J, Thiele D. J Biol Chem. 2004;279:54221–54229. doi: 10.1074/jbc.M411669200. [DOI] [PubMed] [Google Scholar]
- 3.Rees EM, Thiele DJ. J Biol Chem. 2007;282:21629–21638. doi: 10.1074/jbc.M703397200. [DOI] [PubMed] [Google Scholar]
- 4.Puig S, Lee J, Lau M, Thiele DJ. Journal of Biological Chemistry. 2002;277:26021–26030. doi: 10.1074/jbc.M202547200. [DOI] [PubMed] [Google Scholar]
- 5.Ohrvik H, Nose Y, Wood LK, Kim BE, Gleber SC, Ralle M, Thiele DJ. Proc Natl Acad Sci U S A. 2013 doi: 10.1073/pnas.1311749110. [DOI] [PMC free article] [PubMed] [Google Scholar]
- 6.De Feo CJ, Aller SG, Unger VM. Biometals. 2007;20:705–716. doi: 10.1007/s10534-006-9054-7. [DOI] [PubMed] [Google Scholar]
- 7.De Feo CJ, Aller SG, Siluvai GS, Blackburn NJ, Unger VM. Proceedings of the National Acadademy of Sciences of the United States of America. 2009;106:4237–4242. doi: 10.1073/pnas.0810286106. [DOI] [PMC free article] [PubMed] [Google Scholar]
- 8.Tsigelny IF, Sharikov Y, Greenberg JP, Miller MA, Kouznetsova VL, Larson CA, Howell SB. Cell Biochem Biophys. 2012;63:223–234. doi: 10.1007/s12013-012-9358-x. [DOI] [PMC free article] [PubMed] [Google Scholar]
- 9.Howell SB, Safaei R, Larson CA, Sailor MJ. Mol Pharmacol. 2010;77:887–894. doi: 10.1124/mol.109.063172. [DOI] [PMC free article] [PubMed] [Google Scholar]
- 10.Xiao Z, Loughlin F, George GN, Howlett GJ, Wedd AG. J Am Chem Soc. 2004;126:3081–3090. doi: 10.1021/ja0390350. [DOI] [PubMed] [Google Scholar]
- 11.Xiao Z, Wedd AG. Chemical Communications (Cambridge, England) 2002:588–589. doi: 10.1039/b111180a. [DOI] [PubMed] [Google Scholar]
- 12.Wu X, Sinani D, Kim H, Lee J. The Journal of Biological Chemistry. 2009;284:4112–4122. doi: 10.1074/jbc.M807909200. [DOI] [PMC free article] [PubMed] [Google Scholar]
- 13.Maryon EB, Molloy SA, Ivy K, Yu H, Kaplan JH. J Biol Chem. 2013 doi: 10.1074/jbc.M112.442426. [DOI] [PMC free article] [PubMed] [Google Scholar]
- 14.Banci L, Bertini I, Ciofi-Baffoni S, Kozyreva T, Zovo K, Palumaa P. Nature. 2010;465:645–648. doi: 10.1038/nature09018. [DOI] [PubMed] [Google Scholar]
- 15.Bertinato J, Cheung L, Hoque R, Plouffe LJ. Molecular Biology. 2010;24:178–184. doi: 10.1016/j.jtemb.2010.01.009. [DOI] [PubMed] [Google Scholar]
- 16.Kampfenkel K, Kushnir S, Babiychuk E, Inze D, Van Montagu M. J Biol Chem. 1995;270:28479–28486. doi: 10.1074/jbc.270.47.28479. [DOI] [PubMed] [Google Scholar]
- 17.Portnoy ME, Schmidt PJ, Rogers RS, Culotta VC. Mol Genet Genomics. 2001;265:873–882. doi: 10.1007/s004380100482. [DOI] [PubMed] [Google Scholar]
- 18.Bertinato J, Swist E, Plouffe LJ, Brooks SP, L’Abbe RM. Biochem J. 2008;409:731–740. doi: 10.1042/BJ20071025. [DOI] [PubMed] [Google Scholar]
- 19.Bertinato J, L’Abbe MR. J Biol Chem. 2003;278:35071–35078. doi: 10.1074/jbc.M302242200. [DOI] [PubMed] [Google Scholar]
- 20.Barhoom S, Kupiec M, Zhao X, Xu JR, Sharon A. Eukaryot Cell. 2008;7:1098–1108. doi: 10.1128/EC.00109-07. [DOI] [PMC free article] [PubMed] [Google Scholar]
- 21.Blair BG, Larson CA, Safaei R, Howell SB. Clin Cancer Res. 2009;15:4312–4321. doi: 10.1158/1078-0432.CCR-09-0311. [DOI] [PMC free article] [PubMed] [Google Scholar]
- 22.Maryon EB, Molloy SA, Kaplan JH. J Biol Chem. 2007 doi: 10.1074/jbc.M701806200. [DOI] [PubMed] [Google Scholar]
- 23.Nose Y, Wood LK, Kim BE, Prohaska JR, Fry RS, Spears JW, Thiele DJ. J Biol Chem. 2010;285:32385–32392. doi: 10.1074/jbc.M110.143826. [DOI] [PMC free article] [PubMed] [Google Scholar]
- 24.Quail JF, Tsai CY, Howell SB. J Trace Elem Med Biol. 2014;28:151–159. doi: 10.1016/j.jtemb.2013.12.003. [DOI] [PMC free article] [PubMed] [Google Scholar]
- 25.Yang B, Kumar S. Cell Death Differ. 2010;17:68–77. doi: 10.1038/cdd.2009.84. [DOI] [PMC free article] [PubMed] [Google Scholar]
- 26.Rotin D, Staub O, Haguenauer-Tsapis R. J Membr Biol. 2000;176:1–17. doi: 10.1007/s00232001079. [DOI] [PubMed] [Google Scholar]
- 27.Burstein E, Ganesh L, Dick RD, Van De Sluis B, Wilkinson JC, Klomp LW, Wijmenga C, Brewer GJ, Nabel GJ, Duckett CS. Embo J. 2004;23:244–254. doi: 10.1038/sj.emboj.7600031. [DOI] [PMC free article] [PubMed] [Google Scholar]
- 28.Brady GF, Galban S, Liu X, Basrur V, Gitlin JD, Elenitoba-Johnson KS, Wilson TE, Duckett CS. Mol Cell Biol. 2010;30:1923–1936. doi: 10.1128/MCB.00900-09. [DOI] [PMC free article] [PubMed] [Google Scholar]
- 29.Abada P, Howell SB. Met Based Drugs. 2010;2010:317581. doi: 10.1155/2010/317581. [DOI] [PMC free article] [PubMed] [Google Scholar]
- 30.Cheng JD, Valianou M, Canutescu AA, Jaffe EK, Lee HO, Wang H, Lai JH, Bachovchin WW, Weiner LM. Mol Cancer Ther. 2005;4:351–360. doi: 10.1158/1535-7163.MCT-04-0269. [DOI] [PubMed] [Google Scholar]
- 31.Jin G, Kawsar HI, Hirsch SA, Zeng C, Jia X, Feng Z, Ghosh SK, Zheng QY, Zhou A, McIntyre TM, Weinberg A. PLoS One. 2010;5:e10993. doi: 10.1371/journal.pone.0010993. [DOI] [PMC free article] [PubMed] [Google Scholar]
- 32.Turski ML, Brady DC, Kim HJ, Kim BE, Nose Y, Counter CM, Winge DR, Thiele DJ. Mol Cell Biol. 2012;32:1284–1295. doi: 10.1128/MCB.05722-11. [DOI] [PMC free article] [PubMed] [Google Scholar]
- 33.Brady DC, Crowe MS, Turski ML, Hobbs GA, Yao X, Chaikuad A, Knapp S, Xiao K, Campbell SL, Thiele DJ, Counter CM. Nature. 2014;509:492–496. doi: 10.1038/nature13180. [DOI] [PMC free article] [PubMed] [Google Scholar]
- 34.Huang CP, Fofana M, Chan J, Chang CJ, Howell SB. Metallomics. 2014;26:654–661. doi: 10.1039/c3mt00331k. [DOI] [PMC free article] [PubMed] [Google Scholar]
- 35.Liu J, Sitaram A, Burd CG. Traffic. 2007;8:1375–1384. doi: 10.1111/j.1600-0854.2007.00616.x. [DOI] [PubMed] [Google Scholar]
- 36.Kuo MT. Molecular Cancer Therapeutics. 2012;11:1221–1225. doi: 10.1158/1535-7163.MCT-11-0864. [DOI] [PMC free article] [PubMed] [Google Scholar]
- 37.Tsai CY, Larson CA, Safaei R, Howell SB. Biochem Pharmacol. 2014;90:379–387. doi: 10.1016/j.bcp.2014.06.019. [DOI] [PMC free article] [PubMed] [Google Scholar]
- 38.Ran FA, Hsu PD, Wright J, Agarwala V, Scott DA, Zhang F. Nat Protoc. 2013;8:2281–2308. doi: 10.1038/nprot.2013.143. [DOI] [PMC free article] [PubMed] [Google Scholar]
- 39.Tsai CY, Finley JC, Ali SS, Patel HH, Howell SB. Biochem Pharmacol. 2012;84:1007–1013. doi: 10.1016/j.bcp.2012.07.014. [DOI] [PMC free article] [PubMed] [Google Scholar]
- 40.Larson CA, Blair BG, Safaei R, Howell SB. Mol Pharmacol. 2009;75:324–330. doi: 10.1124/mol.108.052381. [DOI] [PMC free article] [PubMed] [Google Scholar]


