

Abstract
Objectives
To determine the effect on weight of two Mobile technology-based (mHealth) behavioral weight loss interventions in young adults.
Methods
Randomized, controlled comparative effectiveness trial in 18–35 year olds with BMI ≥ 25 kg/m2 (overweight/obese), with participants randomized to 24 months of mHealth intervention delivered by interactive smartphone application on a cell phone (CP); personal coaching enhanced by smartphone self-monitoring (PC); or Control.
Results
The 365 randomized participants had mean baseline BMI of 35 kg/m2. Final weight was measured in 86% of participants. CP was not superior to Control at any measurement point. PC participants lost significantly more weight than Controls at 6 months (net effect −1.92 kg [CI −3.17, −0.67], p=0.003), but not at 12 and 24 months.
Conclusions
Despite high intervention engagement and study retention, the inclusion of behavioral principles and tools in both interventions, and weight loss in all treatment groups, CP did not lead to weight loss and PC did not lead to sustained weight loss relative to control. Although mHealth solutions offer broad dissemination and scalability, the CITY results sound a cautionary note concerning intervention delivery by mobile applications. Effective intervention may require the efficiency of mobile technology, the social support and human interaction of personal coaching, and an adaptive approach to intervention design.
Trial Registration
ClinicalTrials.gov Identifier NCT01092364.
https://clinicaltrials.gov/ct2/show/NCT01092364?term=Cell+phone+intervention+for+you&rank=3
Keywords: weight loss, mHealth, behavioral intervention
Introduction
Obesity is present in 35% of U.S. young adults (defined as age 18–35 years)1 and deserves attention: Weight gain is most rapid during these years2,3; increasing body mass index (BMI) in young adulthood increases the risk of developing metabolic syndrome over the subsequent 15 years almost 20-fold4; and weight gain in early adulthood is also associated with increased coronary calcification in middle age5, forecasting future cardiovascular disease (CVD) events. These data suggest the need for effective and sustainable weight control strategies early in adult life.6
Effective behavioral weight loss strategies involve regular personal contact with a trained interventionist using behavioral techniques such as self-monitoring and goal-setting.6 Evidence-based obesity treatment recommendations endorse high intensity intervention: ≥14 in-person interventionist sessions over 6 months.6 However, the optimal behavioral “dose” is unclear7, and a smaller effect with lower intensity intervention might be off-set by the potential for increased scalability. In addition, trials testing comprehensive behavioral approaches have primarily included middle-aged adults, and suggest that intervention is more effective as age increases8,9. Thus the potential of personal coaching for weight loss in a younger population is unknown.
Similarly, commercial mHealth applications (“apps”) are widely downloaded for weight loss, but have not been rigorously tested for efficacy or effectiveness. Behavior change techniques known to produce clinically meaningful weight loss are often absent10,11, calling into question whether apps can have the desired effect.12,13
Because of the potential for scalability and wide dissemination, we sought to determine the weight loss potential of mobile technology on its own. In order to improve efficiency of behavior change methods known to be effective, we tested a low-intensity personal coaching intervention enhanced by mobile technology. The Cell Phone Intervention for You (CITY) study was a 3-arm randomized trial comparing the effect on weight over 24 months of behavioral intervention that was delivered almost entirely via a smartphone app of our design (CP) or behavioral intervention delivered through personal coaching enhanced by self-monitoring via smartphone (PC), each compared to Control. We hypothesized that CP and PC would each be superior to Control. We made no a priori hypothesis about CP relative to PC.
Methods
The CITY study was one of seven trials in the Early Adult Reduction of weight through LifestYle Intervention (EARLY) consortium, sponsored by NHLBI (1U01HL096720). Each EARLY trial was conducted independently. However, in order to facilitate future comparison, the EARLY trials had common eligibility criteria, measurement methods and primary outcome.14 The design of CITY is reported elsewhere.15
Study population
CITY was approved by the Duke Institutional Review Board and an NHLBI-appointed Protocol Review Committee/Data and Safety Monitoring Board (DSMB). Enrollment occurred between December 2010 and February 2012. Individuals were eligible if they were aged 18–35 years, overweight or obese (body mass index [BMI] ≥ 25 kg/m2) and currently using a mobile telephone. For logistical reasons, participants were required to receive service from either Verizon or AT&T.
Individuals were excluded if they were taking weight loss medications or corticosteroids, had weight loss surgery, weighed more than 440lbs (the limit of study scales) or had any condition deemed unsafe for the study. Recruitment occurred primarily by advertising and mass mailings.
Pre-screening assessment occurred by participants’ choice of telephone, Interactive Voice Response (IVR), Short Message Service (SMS) or online survey. Participants were further screened by telephone followed by a face-to-face visit, during which all participants provided written informed consent.
Randomization occurred at a separate face-to-face visit within 10 weeks of screening, at which baseline weight was obtained. Randomization was stratified by gender and BMI (overweight [BMI ≥25 and <30 kg/m2] vs. obese [BMI ≥30 kg/m2]) with equal allocation to each treatment group. Intervention lasted 24 months, with data collection at 6, 12, and 24 months post-randomization.
Outcomes
The primary outcome was weight change in kilograms (kg) at 24 months. Secondary outcomes included weight changes at 6 and 12 months, percent change in weight at each time-point, and weight changes in subgroups defined by self-identified race, sex, and age. Other pre-specified outcomes include change in dietary pattern and physical activity (PA).15
Interventions
Both the Cell Phone (CP) and Personal Coaching (PC) interventions were designed by our research team, based on social cognitive theory16 and the Transtheoretical model17. Both interventions used techniques of behavioral self-management18 and motivational enhancement19. Targeted goals and behaviors included moderate calorie restriction, healthy dietary pattern (based on the Dietary Approaches to Stop Hypertension (DASH) dietary pattern)20, ≥180 minutes/week of moderate PA, limited alcohol intake, and frequent self-monitoring of weight, diet and PA.6 Both interventions were designed with input from the target population obtained through focus groups that were conducted in the year before the trial began.21
The major difference between CP and PC was the source of intervention delivery and the use of the smartphone. In CP, the smartphone was used for both intervention delivery and self-monitoring. Specifically, the intervention was delivered exclusively through an investigator-designed smartphone app which included goal setting, challenge games, and social support through a “buddy system” that allowed exchange of pre-determined messages to a randomly assigned buddy participant. Self-management behaviors for CP were regularly and frequently prompted by the app according to a protocol-driven schedule; participants did not have a choice in the timing or frequency of prompts. Tailoring within the CP intervention occurred mainly via setting personal goals. Self-monitoring by smartphone was achieved by tracking weight, dietary intake and physical activity, with frequent prompts to self-monitor and feedback on the results.
In contrast, the PC intervention was delivered primarily by an interventionist during 6 weekly group sessions followed by monthly phone contacts. Intervention elements such as goal setting, challenges and social support were delivered through these personal coaching interactions, with extensive tailoring during the conversations with the interventionist. The smartphone was used exclusively for self-monitoring, with tracking of weight, dietary intake and physical activity initiated by the participant (i.e., without smartphone prompts), transmitted to the interventionist, and incorporated by the interventionist into the coaching sessions. The PC interventionists were dietitians trained in Motivational Interviewing. Fidelity to the intervention protocol was monitored by the intervention director (P-HL) during regular observation of the group sessions and review of audiotaped monthly calls.
In both CP and PC, participants received an Android smart phone, and their personal phone number was transferred to the CITY phone. Participants were expected to use the CITY phone as their sole personal phone. Because text and data service were required for both interventions, participants were reimbursed for this portion of their phone bill.. Participants were also provided a Bluetooth-enabled scale (Tanita HD-351BT) for weight self-monitoring, which automatically transmitted weight through their smartphone to the study database.
Participants randomized to the Control group were given three handouts on healthy eating and physical activity from the Eat Smart Move More NC program (http://www.eatsmartmovemorenc.com/), but otherwise received no intervention and were not asked to self-monitor. Use of these materials was not monitored.
Measurements
Study measurements were collected on-site in all randomized participants at baseline, 6, 12 and 24 months by trained, certified study personnel.
Weight was measured in duplicate to the nearest 0.1 lb, with the participant in light indoor clothes without shoes, using a high-quality calibrated digital scale.
Height was measured in duplicate to the nearest 0.1 cm, with the participant shoeless using a wall-mounted stadiometer.
Body Mass Index (BMI) was calculated as weight [kg]/height [m]2.
Waist circumference was measured in duplicate to the nearest 0.1 cm, at the level of the upper iliac crest at the end of a normal exhalation.
Dietary intake was assessed by duplicate self-administered 24-hour dietary recall22. Data are summarized as the Healthy Eating Index (HEI), reflecting adherence to DASH23 and future health outcomes.24
Each of the above duplicate measures was averaged at each visit.
Physical activity (PA) in kcal per week was assessed by the Paffenbarger questionnaire.25
Statistical Analysis
The primary analysis was based on intention-to-treat principles. The outcome for the two main study hypotheses (CP vs. Control and PC vs. Control) was absolute weight change in kilograms from baseline to 24 months. A constrained longitudinal data analysis model (cLDA) was used to estimate changes in absolute weight over time and test the primary hypotheses.26 The variables in the model included dichotomous stratification factors (BMI ≥25 to <30 vs. BMI ≥30 kg/m2, and male vs. female), a time effect, and the treatment-by-time interaction. The Holm sequential testing procedure27 maintained an overall type I error rate of 0.05 for the analysis of the primary hypotheses.
Secondary study outcomes were analyzed similarly. Models evaluating effects in pre-specified race, sex and age subgroups as well as post-hoc subgroups based on baseline BMI category, income and education also include the subgroup variable and its interaction with treatment, with a nominal type I error rate of 0.05.
Missing data was addressed in our primary statistical modeling approach by maximum likelihood methods.28 Sensitivity analyses included multiple imputation and a “benchmark” not missing at random (NMAR) analysis that assumes that CP and PC missing values are similar to those of non-missing controls.
Power and sample size calculations were based on estimates from previous behavioral weight loss trials:29,30 estimated common standard deviation of weight of 16.6kg at baseline, 0.8 correlation between weight measurements within individuals, and 25% attrition; and weight gain of 1.5kg/year in Controls.3 With these assumptions, a projected sample size of 120 participants per group (N=360) provided greater than 80% power at alpha 0.025 to detect a difference in weight change of 5kg.
Results
A total of 365 individuals were randomized. Figure 1 shows the flow of participants through the study. Weight was obtained at 24 months in 86%. (Those without 24 month data reported slightly higher income and perceived stress but were otherwise similar to the overall randomized population).
Figure 1.
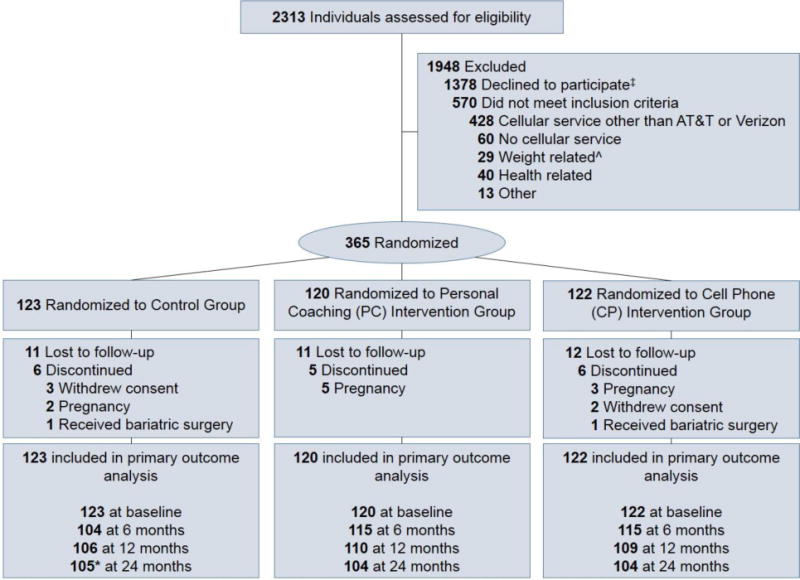
CONSORT diagram.
* 1 additional Control participant did not have 24-month weight but contributed data for other outcomes
ˆ Includes: weight loss surgery, program, intervention study (n=20); BMI < 25kg/mˆ2 (n=7); > 15 lbs weight loss in last 3 months (n=2)
‡ Participants were eligible at time in screening process when they declined
Study population (Table 1)
Table 1.
Baseline characteristics. There were no significant differences among treatment groups.
| Overall | Control | CP | PC | |
|---|---|---|---|---|
| Total, no. | 365 | 123 | 122 | 120 |
| Age (years), mean (SD) | 29.4 (4.3) | 29.6 (4.3) | 29.2 (4.2) | 29.4 (4.3) |
| Female, no. (%) | 254 (69.6) | 85 (69.1) | 84 (68.9) | 85 (70.8) |
| Race Category, no. (%) | ||||
| White | 205 (56.2) | 72 (58.5) | 68 (55.7) | 65 (54.2) |
| Black | 132 (36.2) | 42 (34.1) | 42 (34.4) | 48 (40.0) |
| Other | 28 (7.7) | 9 (7.3) | 12 (9.8) | 7 (5.8) |
| Hispanic Ethnicity, no. (%) | 21 (5.8) | 5 (4.1) | 9 (7.4) | 7 (5.8) |
| Education Level, no. (%) | ||||
| Some college or less | 130 (35.6) | 40 (32.5) | 39 (32.0) | 51 (42.5) |
| College Degree or higher | 235 (64.4) | 83 (67.5) | 83 (68.0) | 69 (57.5) |
| Personal Income Category, no. (%) | ||||
| <24,999 | 121 (34.0) | 43 (35.5) | 38 (31.9) | 40 (34.5) |
| 25,000 – 49,999 | 150 (42.1) | 50 (41.3) | 55 (46.2) | 45 (38.8) |
| ≥ 50,000 | 85 (23.9) | 28 (23.1) | 26 (21.8) | 31 (26.7) |
| In Committed Relationship, no. (%) | 217 (59.8) | 72 (59.0) | 72 (59.0) | 73 (61.3) |
| Student, no. (%) | 124 (34.3) | 42 (34.1) | 43 (35.8) | 39 (32.8) |
| Working, no. (%) | 308 (85.1) | 96 (79.3) | 107 (88.4) | 105 (87.5) |
| Weight in kg, mean (SD) | 101.0 (23.7) | 101.3 (22.6) | 102.4 (25.2) | 99.3 (23.4) |
| Body Mass Index (kg/m2), mean (SD) [min, max] | 35.2 (7.8) [24.9, 62.4] | 35.1 (7.5) [25.3, 61.6] | 35.7 (8.2) [25.1, 62.4] | 34.9 (7.5) [24.9, 58.9] |
| BMI Category, no. (%) | ||||
| Overweight, 25–29.99 kg/m2 | 109 (29.9) | 38 (30.9) | 36 (29.5) | 35 (29.2) |
| Class I obese, 30–34.99 kg/m2 | 110 (30.1) | 33 (26.8) | 34 (27.9) | 43 (35.8) |
| Class II obese, 35–39.99 kg/m2 | 52 (14.2) | 19 (15.4) | 16 (13.1) | 17 (14.2) |
| Class III obese, 40+ kg/m2 | 94 (25.8) | 33 (26.8) | 36 (29.5) | 25 (20.8) |
| Waist circumference in cm, mean (SD) | ||||
| Males | 111.7 (16.3) | 109.8 (14.6) | 113.8 (17.9) | 111.5 (16.4) |
| Females | 108.2 (16.8) | 107.9 (15.7) | 109.3 (18.4) | 107.4 (16.4) |
| Hypertensiona, no. (%) | 59 (16.2) | 20 (16.3) | 20 (16.4) | 19 (15.8) |
| HEIb Score, mean (SD) | 51.0 (4.1) | 50.7 (4.4) | 51.6 (4.2) | 50.8 (3.6) |
| Leisure time physical activity (kcal/week), mean (SD)C | 879.7 (1,134.2) | 865.9 (1,133.9) | 1,009.3 (1,346.4) | 756.0 (846.1) |
Abbreviations: CP, Cell Phone Intervention; PC, Personal Coaching Intervention; SD, standard deviation; BMI, body mass index, calculated as weight in kilograms divided by height in meters squared; HEI, Healthy Eating Index.
Missing Values: Income:9; Relationship Status:2; Student:3; Work:3; HEI:32; Physical Activity:18
Hypertension defined as SBP > 140 or DBP > 90 mmHg or taking BP Meds.
Healthy eating index (HEI-2005) (http://riskfactor.cancer.gov/tools/instruments/asa24/)
Reports of > 10 flights climbed per day were considered implausible and excluded from analysis.
At entry, mean age was 29.4 years, 69.6% were women, 43.9% were non-white race (36.2% of total were Black), and 5.8% were Hispanic ethnicity. The majority were college-educated and employed. Mean baseline BMI was 35.2 kg/m2. One fourth of study participants were overweight (BMI ≥25 to <30 kg/m2); one fourth had class III obesity (BMI ≥40 kg/m2).
Intervention adherence variables are shown in Table 2. The CP group self-weighed an average of 4.0 times/week for the first 6 months, and continued at 2.1 times/week during months 13 through 24. CP participants interacted with the study app in other ways an average of 4.6 times/day in the first 6 months and 0.7 times/day in the final year. The PC group self-weighed an average of 2.2 times/week in the first 6 months and 1.0 times/week in the final year of intervention. Excluding weighing, the PC group interacted with the study app an average of 1.8 times/day in the first 6 months and 0.4 times/day in the final year. In addition, over 90% completed all expected coaching contacts in the first 6 months and more than 87% of monthly calls from months 13 through 24.
Table 2.
Intervention adherence
| 0–6 Months | 7–12 months | 13–24 months | |
|---|---|---|---|
| CP N (% of randomized) | 121 (99) | 115 (94) | 105 (86) |
| Self-weighing, mean times/week (SD) | 4.0 (1.7) | 3.3 (1.9) | 2.1 (1.7) |
| Number of interactions‡ with CITY app, mean per person per day (SD) | 4.6 (3.0) | 1.5 (1.4) | 0.7 (0.7) |
|
| |||
| PC N (% of randomized) | 115 (96) | 113 (94) | 108 (90) |
| Self-weighing, mean times/week (SD) | 2.2 (1.6) | 1.3 (1.4) | 1.0 (1.2) |
| Number of interactions‡ with CITY app, mean per person per day (SD) | 1.8 (1.5) | 0.8 (1.1) | 0.4 (0.6) |
| Percent of contacts completed*(SD) | 93.0 (16.4) | 92.3 (20.8) | 87.8 (21.2) |
Abbreviations: CP, Cell Phone Intervention; PC, Personal Coaching Intervention; SD, standard deviation.
0–6 month data includes completion percentage for 6 weekly group sessions.
Interactions include any usage of the CITY app except self-weighing. Total number of app components tracked in the CP and PC intervention were 31 and 24, respectively.
Weight loss
The primary outcome is depicted in Figure 2. CP participants lost the least weight at all measurement points (−0.87, −1.48, and −0.99 kg at 6, 12 and 24 months, respectively), and these values were not significantly different from Control (−1.14, −2.25, and −1.44 kg, respectively). PC had the greatest mean weight loss (−3.07, −3.58, and −2.45 kg at 6, 12, and 24 months, respectively), which was significantly greater than Control at 6 months (net effect −1.92 kg [CI −3.17 to −0.67], p=0.003), and greater than CP at 6 months (net effect −2.19 kg (CI −3.42 to −0.97], p<0.001) and 12 months (net effect −2.10 kg [CI −3.94 to −0.27], p=0.025). There were no significant differences in mean weight loss at 24 months among the treatment groups. Sensitivity analyses described above yielded consistent results. In addition, excluding two extreme outliers (weight loss of 41.2kg and gain of 31.8kg), yielded similar results. All findings were numerically similar when expressed as percent weight lost (see Supplemental Figure 1).
Figure 2.
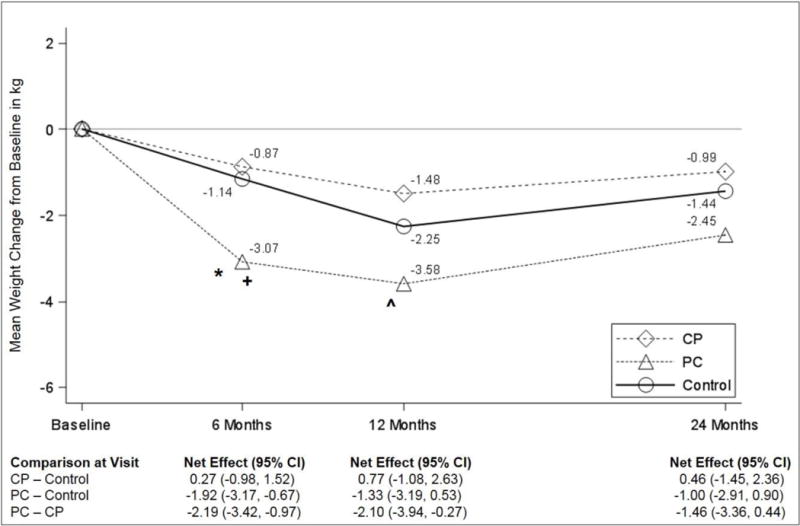
Effect of interventions on weight change (in kg), based on linear mixed model analyses. Abbreviations: CP, Cell Phone Intervention; PC, Personal Coaching Intervention.
* p-value = 0.003 for the comparison between PC and control at 6 montths.
+ p-value < 0.001 for the comparison between PC and CP at 6 months.
ˆ p-value = 0.025 for the comparison between PC and CP at 12 months.
Because commercial apps for weight loss were ubiquitous during the study, at the end of the final data collection visit, we administered a retrospective questionnaire about app usage. Use of at least one commercially available weight loss app during the study was reported in 30% of CP, 50% of PC and 54% of Control.
Current guidelines define 3–5% weight loss as clinically meaningful, associated with significant health benefits.6 Weight loss of at least 5% at 24 months occurred in 25.5, 27.5, and 22.0% of CP, PC, and Control, respectively; these differences were not statistically significant.
Subgroup effects (Figure 3)
Figure 3.
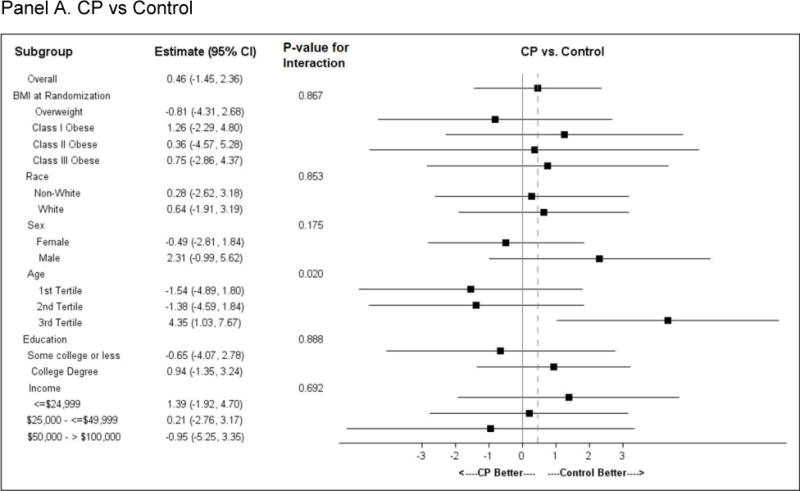
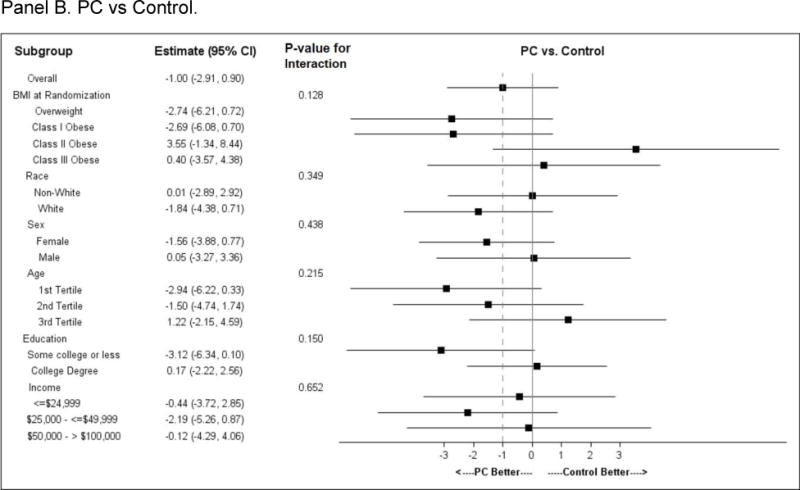
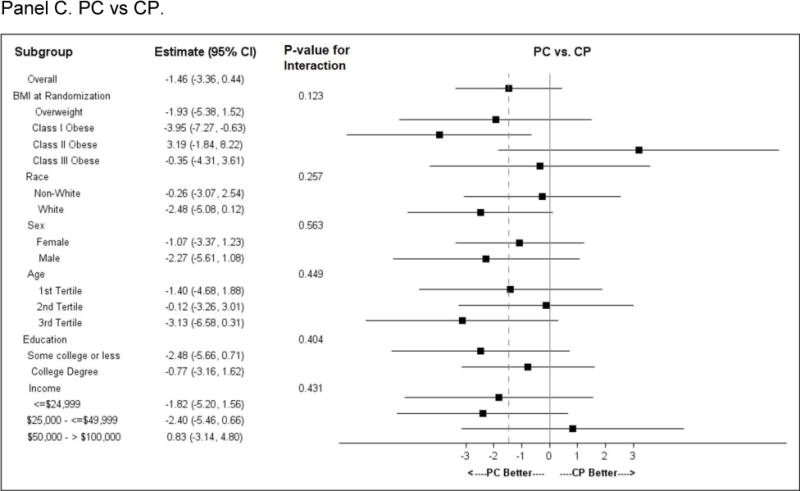
Subgroup analysis. Forest plots for pre-specified subgroups: age, sex, race; and post-hoc subgroup: BMI category, education category, and income category.
Panel A. CP vs Control; Panel B. PC vs Control; Panel C. CP vs PC
Comparisons of subgroups defined by baseline BMI category (overweight or obese class I, II or III), race, sex, income or education showed no difference in intervention effect by subgroup stratum. A differential intervention effect was observed between CP and Control participants across age tertiles, with the oldest participants losing the least weight as compared to younger participants. A similar but less pronounced age effect was observed between PC and Control.
Other effects
Adverse events did not differ among treatment groups, and no serious adverse events were considered to be study-related. HEI score at 24 months in CP was reduced relative to Control (−1.93 points [CI −3.75 to −0.11], p=0.039); there were no other significant effects of either CP or PC on HEI or PA (see Supplemental Figures 2 and 3).
Discussion
CITY is the largest and longest comparative effectiveness trial to investigate theory-based behavioral weight loss interventions that may be suitable for widespread dissemination and implementation. We found that, relative to Control, neither a mobile app alone nor personal coaching with mobile self-monitoring resulted in statistically significant weight loss after 24 months.
We designed and tested a smartphone intervention (CP) based on expectations that mHealth modalities can be particularly effective and scalable in young adults.31 But this behavioral intervention did not lead to significant weight loss relative to control at any trial time-point. Commercial apps intended to promote healthy lifestyle and weight loss are ubiquitous.10 However, behavior change principles are generally absent in these commercial products,10,11 and trials have shown no effect on weight13 or dietary pattern.12 Lack of effect in trials using commercial apps may reflect lack of sustained engagement: only 39% of commercial apps are used more than 10 times before they are abandoned.32 Although CITY engagement may not have been sufficient, CP participants did continue to use the app an average of twice weekly (0.3 times/day) for 2 years.
It is possible that CITY did not have a sufficiently compelling or individually-tailored app design.33 Our attempt to adhere to randomized trial conventions by testing exactly the same intervention in each participant made it impossible to adapt the app rapidly and iteratively in response to participant behavior and need. Indeed, future trials may need to consider “rapid, responsive, relevant (R3) design”34 in which rapid assessment of usage and outcome allows for responsive design changes that keep the app relevant to users.
CP also may have been ineffective because it involved no human intervention contact. In contrast, PC was based on previous trials that incorporated face-to-face or phone contact frequently over a sustained period of time6,29. Current obesity treatment guidelines recognize the need to “evaluate optimal frequency (and duration) of contact” [in order to focus] on improvements in efficiency and efficacy, [and to optimize] delivery and dissemination”.6 Consistent with this need, we attempted to increase the efficiency of the personal coaching approach by reducing the required face-to-face time from at least 14 weekly sessions6 to 6, followed by monthly phone contact. PC led to significant weight loss relative to Control at 6 months and relative to CP at 6 and 12 months, but the effect size was generally smaller than in studies with more in-person sessions (in older adults)6,35,36. Thus it is possible that the dose or intensity was insufficient for sustained effect or that this intervention approach is less effective in younger than older adults.9,37 PC also differed from other personal coaching interventions in its reliance on a mobile app for self-monitoring, a feature that may enhance the effect of coaching.31 On-going additional analysis of detailed phone data for both CP and CP will allow us to identify usage patterns or other factors associated with weight loss.
Further research is needed to determine whether increasing both coaching contacts and mobile elements (essentially combining PC and CP) and/or more personal tailoring will increase and/or prolong weight loss.
The lack of efficacy at 24 months of both CITY interventions to some extent may be related to the behavior of the Control group, which experienced somewhat better-than-expected outcome. Based on observational data3, we expected the Control group to gain 1.5 kg/year3, and in most similar trials, weight loss in the Control group is negligible6. Yet after 24 months, average weight was reduced in Control participants, and 22% of them lost at least 5%. Weight loss in control participants is not unusual: Participants may enroll with high motivation that was enhanced by randomization to the Control group, and they may have employed other weight loss strategies. In fact, 54% of Control participants used commercial weight loss apps. However, there was no evidence that the use of commercial apps was associated with greater weight loss: the observed mean weight change from baseline to 24 months within the Control group was −1.2 kg (standard deviation [SD] 7.1) for users and −1.8 kg (SD 8.0) kg for non-users.
Characteristics of our study population may have contributed to the lack of sustained effect. The mean BMI was 35 kg/m2, and 25% had Class III obesity, suggesting that CITY participants were not on the trajectory of weight gain but in fact had well-established obesity, and many had severe obesity. However, severe obesity is not necessarily an obstacle to behavioral weight loss38, and in post hoc analysis, baseline BMI category did not modify intervention effect (Figure 3). In addition, CITY enrolled 36% African Americans, of whom most were Black women, a group that often experiences less weight loss than other trial participants.39,40 However, subgroup analysis did not suggest differential treatment effects by race. Similarly, there were no differences in treatment effects in subgroups defined (post hoc) by education or income (Figure 3). Overall, we noted marked heterogeneity in response (range of observed weight change −41.2kg to + 31.8kg). These findings suggest the need to develop intervention that is tailored to the individual.
Conclusion
In summary, although conclusions can only be drawn about the specific app tested, the CITY trial sounds a cautionary note concerning intervention delivery by mobile applications alone.. Effective weight loss intervention for young adults that can be implemented efficiently and broadly may require the scalability of mobile technology, the social support and human interaction of personal coaching, adaptive intervention design, and more personally-tailored approaches.
Supplementary Material
Figure S1: Effect of interventions on percent change in weight from baseline to 24 months. Figure shows model-based estimates from linear mixed model analyses.
Abbreviations: CP, Cell Phone Intervention; PC, Personal Coaching Intervention; CI, Confidence Interval.
Figure S2: Effect of interventions on Health Eating Index (HEI) in kcal/wk from baseline to 24 months. Figure shows model-based estimates from linear mixed model analyses.
Abbreviations: CP, Cell Phone Intervention; PC, Personal Coaching Intervention; CI, Confidence Interval.
Figure S3: Effect of interventions on Leisure Time Physical Activity in kcal/wk from baseline to 24 months. Figure shows model-based estimates from linear mixed model analyses.
Abbreviations: CP, Cell Phone Intervention; PC, Personal Coaching Intervention; CI, Confidence Interval.
What is already known about this subject?
Commercial weight loss applications (apps) are ubiquitous, but their effectiveness is unknown.
Commercial apps include limited behavioral theory and methods, do not elicit sustained engagement, and to the extent to which they have been tested, have limited impact on weight.
What does this study add?
This study is the longest and largest comparative effectiveness trial in a diverse population of young adults using mobile technology to deliver behavioral intervention.
Wise use of resources requires demonstration of efficacy and/or effectiveness.
The behavioral intervention delivered by mobile technology alone that was tested in CITY does not promote weight loss.
Acknowledgments
The authors gratefully acknowledge the contributions of: Study participants
DSMB members:
Dr. Thomas Wadden (University of Pennsylvania School of Medicine)- Chair
Dr. Lora Burke (University of Pittsburgh School of Nursing)
Dr. Donna Ryan (Pennington Biomedical Research Center)
Dr. Barbara Tilley (University of Texas School of Public Health at Houston)
Study team members (in alphabetical order):
Diana Abbott, PhD
Kathleen Aicher
Neil Andrews
Jocelyn Antonio
Jacqueline Bagwell
Shenese Baldwin
Gene Baliff
Henry Beresford
Rachel Bordogna
Jasmine Burroughs
Carla Caccia
Moriah Cureton
Jautam Davis
Joni Duke
Tony Lazenka
Yuping Niou
Matthew Pangborn
Christina Pham
Kate Pilewski
Aziza Sutton
Christine Wang
Study data were collected and managed using Research Electronic Data Capture (REDCap) electronic data capture tools hosted at Duke University.* REDCap is a secure, web-based application designed to support data capture for research studies, providing: 1) an intuitive interface for validated data entry; 2) audit trails for tracking data manipulation and export procedures; 3) automated export procedures for seamless data downloads to common statistical packages; and 4) procedures for importing data from external sources.
*Paul A. Harris, Robert Taylor, Robert Thielke, Jonathon Payne, Nathaniel Gonzalez, Jose B. Conde. Research electronic data capture (REDCap) – A metadata-driven methodology and workflow process for providing translational research informatics support. J. Biomed Inform 2009 Apr;42(2):377–381.
Funding: The CITY study was sponsored by Grant Number U01HL096720 from the National Heart, Lung, and Blood Institute, a component of the National Institutes of Health (NIH).
Footnotes
- Dr. Svetkey is a consultant to Oregon Center for Applied Science (ORCAS; Eugene, OR), a health innovation company that creates self-management programs to improve physical and emotional well-being.
- Dr. Grambow is a consultant to Gilead Sciences as a member of multiple DSMBs. Although the relationship is not perceived to represent a conflict with the present work, it has been included in the spirit of full disclosure.
- Dr. Bennett is a member of the scientific advisory board at Nutrisystem and owns shares in Scale Down, a digital weight loss vendor.
References
- 1.Flegal KM, Carroll MD, Kit BK, Ogden CL. Prevalence of obesity and trends in the distribution of body mass index among US adults, 1999–2010. JAMA: the journal of the American Medical Association. 2012;307:491–7. doi: 10.1001/jama.2012.39. [DOI] [PubMed] [Google Scholar]
- 2.Burke GL, Bild DE, Hilner JE, Folsom AR, Wagenknecht LE, Sidney S. Differences in weight gain in relation to race, gender, age and education in young adults: the CARDIA Study. Coronary Artery Risk Development in Young Adults. Ethn Health. 1996;1:327–35. doi: 10.1080/13557858.1996.9961802. [DOI] [PubMed] [Google Scholar]
- 3.Lewis CE, Jacobs DR, Jr, McCreath H, et al. Weight gain continues in the 1990s: 10-year trends in weight and overweight from the CARDIA study. Coronary Artery Risk Development in Young Adults. Am J Epidemiol. 2000;151:1172–81. doi: 10.1093/oxfordjournals.aje.a010167. [DOI] [PubMed] [Google Scholar]
- 4.Lloyd-Jones DM, Liu K, Colangelo LA, et al. Consistently stable or decreased body mass index in young adulthood and longitudinal changes in metabolic syndrome components: the Coronary Artery Risk Development in Young Adults Study. Circulation. 2007;115:1004–11. doi: 10.1161/CIRCULATIONAHA.106.648642. [DOI] [PubMed] [Google Scholar]
- 5.Loria CM, Liu K, Lewis CE, et al. Early adult risk factor levels and subsequent coronary artery calcification: the CARDIA Study. J Am Coll Cardiol. 2007;49:2013–20. doi: 10.1016/j.jacc.2007.03.009. [DOI] [PubMed] [Google Scholar]
- 6.Jensen MD, Ryan DH, Apovian CM, et al. AHA/ACC/TOS Guideline for the Management of Overweight and Obesity in Adults: A Report of the American College of Cardiology/American Heart Association Task Force on Practice Guidelines and The Obesity Society. Circulation. 20132013 [Google Scholar]
- 7.Voils CI, King HA, Maciejewski ML, Allen KD, Yancy WS, Jr, Shaffer JA. Approaches for informing optimal dose of behavioral interventions. Ann Behav Med. 2014;48:392–401. doi: 10.1007/s12160-014-9618-7. [DOI] [PMC free article] [PubMed] [Google Scholar]
- 8.Svetkey LP, Clark JM, Funk K, et al. Greater weight loss with increasing age in the weight loss maintenance trial. Obesity (Silver Spring) 2013 doi: 10.1002/oby.20506. [DOI] [PMC free article] [PubMed] [Google Scholar]
- 9.Wadden TA, Neiberg RH, Wing RR, et al. Four-year weight losses in the Look AHEAD study: factors associated with long-term success. Obesity (Silver Spring) 2011;19:1987–98. doi: 10.1038/oby.2011.230. [DOI] [PMC free article] [PubMed] [Google Scholar]
- 10.Pagoto S, Schneider K, Jojic M, DeBiasse M, Mann D. Evidence-based strategies in weight-loss mobile apps. Am J Prev Med. 2013;45:576–82. doi: 10.1016/j.amepre.2013.04.025. [DOI] [PubMed] [Google Scholar]
- 11.Breton ER, Fuemmeler BF, Abroms LC. Weight loss-there is an app for that! But does it adhere to evidence-informed practices? Translational behavioral medicine. 2011;1:523–9. doi: 10.1007/s13142-011-0076-5. [DOI] [PMC free article] [PubMed] [Google Scholar]
- 12.Wharton CM, Johnston CS, Cunningham BK, Sterner D. Dietary self-monitoring, but not dietary quality, improves with use of smartphone app technology in an 8-week weight loss trial. J Nutr Educ Behav. 2014;46:440–4. doi: 10.1016/j.jneb.2014.04.291. [DOI] [PubMed] [Google Scholar]
- 13.Laing BY, Mangione CM, Tseng CH, et al. Effectiveness of a smartphone application for weight loss compared with usual care in overweight primary care patients: a randomized, controlled trial. Ann Intern Med. 2014;161:S5–S12. doi: 10.7326/M13-3005. [DOI] [PMC free article] [PubMed] [Google Scholar]
- 14.Lytle LA, Svetkey LP, Patrick K, et al. The EARLY trials: a consortium of studies targeting weight control in young adults. Translational behavioral medicine. 2014;4:304–13. doi: 10.1007/s13142-014-0252-5. [DOI] [PMC free article] [PubMed] [Google Scholar]
- 15.Batch BC, Tyson C, Bagwell J, et al. Weight loss intervention for young adults using mobile technology: Design and rationale of a randomized controlled trial – Cell phone Intervention for You (CITY) Contemp Clin Trials. 2014 doi: 10.1016/j.cct.2014.01.003. [DOI] [PMC free article] [PubMed] [Google Scholar]
- 16.Bandura A. Social foundations of thought and action: A social cognitive theory. Englewood Cliffs, NJ: Prentice Hal; 1986. [Google Scholar]
- 17.Prochaska JO, Velicer WF, Rossi JS, et al. Stages of change and decisional balance for 12 problem behaviors. Health Psychol. 1994;13:39–46. doi: 10.1037//0278-6133.13.1.39. [DOI] [PubMed] [Google Scholar]
- 18.Watson DT. Self-directed behavior: Self-modification for personal adjustment. 5th. Pacific Grove, CA: Brooks/Cole; 1989. [Google Scholar]
- 19.Miller WR, Rollnick S. Motivational interviewing: preparing people for change. 2nd. Guilford Press; 2002. [Google Scholar]
- 20.Appel LJ, Moore TJ, Obarzanek E, et al. A clinical trial of the effects of dietary patterns on blood pressure. DASH Collaborative Research Group. N Engl J Med. 1997;336:1117–24. doi: 10.1056/NEJM199704173361601. [DOI] [PubMed] [Google Scholar]
- 21.Corsino L, Lin PH, Batch BC, et al. Recruiting young adults into a weight loss trial: report of protocol development and recruitment results. Contemp Clin Trials. 2013;35:1–7. doi: 10.1016/j.cct.2013.04.002. [DOI] [PMC free article] [PubMed] [Google Scholar]
- 22.Automated Self-administered 24-hour Dietary Recall (ASA24) (Accessed February 9, 2010, at http://riskfactor.cancer.gov/tools/instruments/asa24/
- 23.de Koning L, Chiuve SE, Fung TT, Willett WC, Rimm EB, Hu FB. Diet-quality scores and the risk of type 2 diabetes in men. Diabetes Care. 2011;34:1150–6. doi: 10.2337/dc10-2352. [DOI] [PMC free article] [PubMed] [Google Scholar]
- 24.Fung TT, Chiuve SE, McCullough ML, Rexrode KM, Logroscino G, Hu FB. Adherence to a DASH-style diet and risk of coronary heart disease and stroke in women. Arch Intern Med. 2008;168:713–20. doi: 10.1001/archinte.168.7.713. [DOI] [PubMed] [Google Scholar]
- 25.Paffenbarger RS, Jr, Hyde RT, Wing AL, Hsieh CC. Physical activity, all-cause mortality, and longevity of college alumni. N Engl J Med. 1986;314:605–13. doi: 10.1056/NEJM198603063141003. [DOI] [PubMed] [Google Scholar]
- 26.Liu GF, Lu K, et al. Should baseline be a covariate or dependent variable in analyses of change from baseline in clinical trials? Stat Med. 2009;28:2509–30. doi: 10.1002/sim.3639. [DOI] [PubMed] [Google Scholar]
- 27.Proschan MA, Waclawiw MA. Practical guidelines for multiplicity adjustment in clinical trials. Control Clin Trials. 2000;21:527–39. doi: 10.1016/s0197-2456(00)00106-9. [DOI] [PubMed] [Google Scholar]
- 28.Little RJ, D’Agostino R, Cohen ML, et al. The prevention and treatment of missing data in clinical trials. N Engl J Med. 2012;367:1355–60. doi: 10.1056/NEJMsr1203730. [DOI] [PMC free article] [PubMed] [Google Scholar]
- 29.Svetkey LP, Stevens VJ, Brantley PJ, et al. Comparison of strategies for sustaining weight loss: the weight loss maintenance randomized controlled trial. JAMA. 2008;299:1139–48. doi: 10.1001/jama.299.10.1139. [DOI] [PubMed] [Google Scholar]
- 30.The effects of nonpharmacologic interventions on blood pressure of persons with high normal levels. Results of the Trials of Hypertension Prevention, Phase I. JAMA. 1992;267:1213–20. doi: 10.1001/jama.1992.03480090061028. [DOI] [PubMed] [Google Scholar]
- 31.Spring B, Duncan JM, Janke EA, et al. Integrating technology into standard weight loss treatment: a randomized controlled trial. JAMA Intern Med. 2013;173:105–11. doi: 10.1001/jamainternmed.2013.1221. [DOI] [PMC free article] [PubMed] [Google Scholar]
- 32.(Accessed 1/10/2015, at http://info.localytics.com/blog/app-retention-improves)
- 33.Christian B. The A/B test: Inside the technology that’s changing the rules of business. Wired Magazine. 2012 [Google Scholar]
- 34.Riley WT, Glasgow RE, Etheredge L, Abernethy AP. Rapid, responsive, relevant (R3) research: a call for a rapid learning health research enterprise. Clinical and translational medicine. 2013;2:10. doi: 10.1186/2001-1326-2-10. [DOI] [PMC free article] [PubMed] [Google Scholar]
- 35.Appel LJ, Clark JM, Yeh HC, et al. Comparative effectiveness of weight-loss interventions in clinical practice. N Engl J Med. 2011;365:1959–68. doi: 10.1056/NEJMoa1108660. [DOI] [PMC free article] [PubMed] [Google Scholar]
- 36.Wadden TA, Volger S, Sarwer DB, et al. A two-year randomized trial of obesity treatment in primary care practice. N Engl J Med. 2011;365:1969–79. doi: 10.1056/NEJMoa1109220. [DOI] [PMC free article] [PubMed] [Google Scholar]
- 37.Svetkey LP, Clark JM, Funk K, et al. Greater weight loss with increasing age in the weight loss maintenance trial. Obesity (Silver Spring) 2014;22:39–44. doi: 10.1002/oby.20506. [DOI] [PMC free article] [PubMed] [Google Scholar]
- 38.Goodpaster BH, Delany JP, Otto AD, et al. Effects of diet and physical activity interventions on weight loss and cardiometabolic risk factors in severely obese adults: a randomized trial. JAMA. 2010;304:1795–802. doi: 10.1001/jama.2010.1505. [DOI] [PMC free article] [PubMed] [Google Scholar]
- 39.Wingo BC, Carson TL, Ard J. Differences in weight loss and health outcomes among African Americans and whites in multicentre trials. Obes Rev. 2014;15(Suppl 4):46–61. doi: 10.1111/obr.12212. [DOI] [PubMed] [Google Scholar]
- 40.Wadden TA, West DS, Neiberg RH, et al. One-year weight losses in the Look AHEAD study: factors associated with success. Obesity (Silver Spring) 2009;17:713–22. doi: 10.1038/oby.2008.637. [DOI] [PMC free article] [PubMed] [Google Scholar]
Associated Data
This section collects any data citations, data availability statements, or supplementary materials included in this article.
Supplementary Materials
Figure S1: Effect of interventions on percent change in weight from baseline to 24 months. Figure shows model-based estimates from linear mixed model analyses.
Abbreviations: CP, Cell Phone Intervention; PC, Personal Coaching Intervention; CI, Confidence Interval.
Figure S2: Effect of interventions on Health Eating Index (HEI) in kcal/wk from baseline to 24 months. Figure shows model-based estimates from linear mixed model analyses.
Abbreviations: CP, Cell Phone Intervention; PC, Personal Coaching Intervention; CI, Confidence Interval.
Figure S3: Effect of interventions on Leisure Time Physical Activity in kcal/wk from baseline to 24 months. Figure shows model-based estimates from linear mixed model analyses.
Abbreviations: CP, Cell Phone Intervention; PC, Personal Coaching Intervention; CI, Confidence Interval.