

Abstract
Active zones (AZs) of inner hair cells (IHCs) indefatigably release hundreds of vesicles per second, requiring each release site to reload vesicles at tens per second. Here, we report that the endocytic adaptor protein 2μ (AP‐2μ) is required for release site replenishment and hearing. We show that hair cell‐specific disruption of AP‐2μ slows IHC exocytosis immediately after fusion of the readily releasable pool of vesicles, despite normal abundance of membrane‐proximal vesicles and intact endocytic membrane retrieval. Sound‐driven postsynaptic spiking was reduced in a use‐dependent manner, and the altered interspike interval statistics suggested a slowed reloading of release sites. Sustained strong stimulation led to accumulation of endosome‐like vacuoles, fewer clathrin‐coated endocytic intermediates, and vesicle depletion of the membrane‐distal synaptic ribbon in AP‐2μ‐deficient IHCs, indicating a further role of AP‐2μ in clathrin‐dependent vesicle reformation on a timescale of many seconds. Finally, we show that AP‐2 sorts its IHC‐cargo otoferlin. We propose that binding of AP‐2 to otoferlin facilitates replenishment of release sites, for example, via speeding AZ clearance of exocytosed material, in addition to a role of AP‐2 in synaptic vesicle reformation.
Keywords: active zone, endocytosis, release site clearance, synaptic ribbon, vesicle reformation
Subject Categories: Neuroscience
Introduction
Hearing relies on sound encoding at ribbon synapses between IHCs and spiral ganglion neurons (SGNs). Even during continued stimulation, each SGN can fire at hundreds of Hz in response to release from a single IHC AZ (Matthews & Fuchs, 2010; Pangršič et al, 2012; Safieddine et al, 2012). Such vivid firing requires the AZ to indefatigably release vesicles at even higher rates, because some release events fail to trigger a spike due to neural refractoriness. Indeed, sustained exocytosis of up to 70 Hz from each of the ~10–15 release sites of the AZ composing the readily releasable pool (RRP) was reported (Pangršič et al, 2010) requiring rapid reloading.
Rapid vesicle turnover requires sufficient amounts of the hair cell C2‐domain protein otoferlin (Roux et al, 2006; Pangršič et al, 2010) that when defective causes human hearing impairment (Yasunaga et al, 1999; Varga et al, 2006). However, a role of otoferlin in pre‐fusion priming could so far not be distinguished from a post‐fusion function in clearing previously exocytosed membrane from release sites (Pangršič et al, 2010; Pangršič et al, 2012; Duncker et al, 2013). Dissociation of vesicular proteins from the release site and/or diffusion of newly exocytosed material to the perisynaptic zone of endocytosis might be rate‐limiting the rapid release site cycle in IHCs. Facilitated AZ clearance involving interactions between exocytic and endocytic proteins such as neuronal SNAREs, synaptotagmins, intersectins, dynamins, and AP‐2 has been proposed at other synapses (Hosoi et al, 2009; Haucke et al, 2011; Sakaba et al, 2013; Xu et al, 2013), and an interaction of AP‐2 with otoferlin has recently been reported (Duncker et al, 2013). Testing the AZ clearance hypothesis has remained challenging.
The IHC synapse is an attractive model for addressing this hypothesis, given the massive vesicle turnover and the experimental access to the function of single AZs and release sites by in vivo recordings from single SGNs. The statistics of interspike intervals of SGNs for short intervals deviates from exponential (Li & Young, 1993; Heil et al, 2007) that would be expected for a stochastic, memory‐less Poisson process. This deviation has been taken to indicate that some excitatory events expected from a Poissonian process are left out possibly due to presynaptic refractoriness, which was mathematically described as a contribution of a gamma process (Heil et al, 2007). In fact, if only a single release site was to drive postsynaptic spikes, the interspike intervals would be expected to follow a gamma distribution, as replenishment of a new release‐ready vesicle will take a finite time. Exponentially distributed interspike intervals could only be observed if replenishment was infinitely fast. If several independent release sites contribute to the active zone output, rapid succession of release events becomes more likely and the interspike intervals are expected to follow a mixed exponential/gamma distribution.
One possible interpretation of the experimentally observed mixed exponential/gamma distribution is the parallel action of only four release sites per IHC AZ, each modeled with only two states (Peterson et al, 2014). However, IHC AZs likely feature 10 or more release sites (Frank et al, 2010; Pangršič et al, 2010), each comprising more than 2 functional states (Andor‐Ardo et al, 2010). Therefore, we reason that the gamma process may relate to clearance at each of the 10–15 release sites. Here, we tested the role of AP‐2 and the AZ clearance hypothesis at the IHC synapse by combining mouse genetics, cellular and systems physiology, and super‐resolution light and electron microscopy, as well as protein–protein interaction studies. We find that AP‐2μ expression in IHCs is required for efficient replenishment of release sites. Using mathematical modeling, we interpret an increased contribution of the gamma process to interspike interval statistics in the absence of AP‐2μ as indication for impaired vesicle replenishment, for example, due to defective AZ clearance. We characterize the binding of AP‐2 to its cargo otoferlin and propose that their interaction is required for vesicle replenishment. In addition, we show that AP‐2μ is dispensable for endocytic retrieval of exocytosed membrane but required for clathrin‐dependent vesicle reformation from bulk‐endocytosed membrane and vesicle recharging of the ribbon on a longer time scale.
Results
Expression of AP‐2μ in IHCs is required for hearing
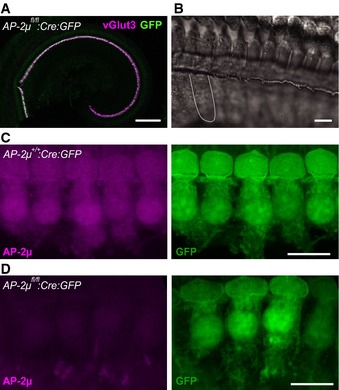
To study the role of AP‐2 in the presynaptic function of IHCs and hearing, we genetically deleted its non‐redundant AP‐2μ subunit in IHCs. We crossed mice carrying floxed alleles of the gene encoding the AP‐2μ subunit (AP‐2μ fl/fl, Kononenko et al, 2014) with a transgenic Cre driver mouse expressing Cre under the Vglut3 promoter (Jung et al, 2015), which is active in IHCs (Ruel et al, 2008; Seal et al, 2008). Cre recombination was observed in > 99% of IHCs and in some outer hair cells using a floxed‐(E)GFP reporter (Nakamura et al, 2006; AP‐2μfl/fl:Cre:GFP; Figs 1A and EV1A). GFP signal was not observed in SGNs (Figs 1A and EV1A) but seemed to be present in some capillaries. We never detected GFP‐positive IHCs in AP‐2μ fl/fl :GFP mice that served as one control mouse line (AP‐2μ control, see Materials and Methods). Cre recombination in the AP‐2μ fl/fl :Cre:GFP organ of Corti was further demonstrated by PCR (Fig EV1B). AP‐2μ deletion and transgenic expression of Cre and GFP did not cause any overt change in the morphology of the hair bundle or base of the IHCs (Figs 1B and EV1C). Immunolabeling demonstrated the expression of AP‐2μ in wild‐type IHCs (Fig 1C) and confirmed the absence of AP‐2μ in AP‐2μ fl/fl :Cre:GFP IHCs (Fig 1D). Immunohistochemical analysis of the expression of other AP‐2 subunits in IHCs did not work reproducibly with various antibodies at our disposal, but we assume that AP‐2μ disruption results in substantial depletion of the entire AP‐2 complex [by about 80% in hippocampal neurons (Kononenko et al, 2014)].
Figure 1. Hair cell‐specific disruption of AP‐2μ.
-
ACre recombination in IHCs and outer hair cells (OHCs) by transgenic Cre expression was demonstrated by a GFP reporter and used for inactivation of the AP‐2μ gene. Most if not all IHCs (identified by vGlut3 immunofluorescence, magenta) in an AP‐2μ fl/fl :Cre:GFP p14 organ of Corti are GFP positive (green). GFP fluorescence is weak in OHCs peripheral to IHCs and absent from SGNs (see also Fig EV1). Scale bar, 200 μm.
-
BDifferential interference contrast images indicate normal gross morphology of the p14 IHC hair bundle and basolateral pole. The dashed line indicates the approximate outline of an IHC. Scale bar, 20 μm.
-
C, DMaximum intensity projections of representative confocal sections of AP‐2μ +/+ :Cre:GFP (C) and AP‐2μ fl/fl :Cre:GFP (D) IHCs immunolabeled for AP‐2μ (magenta, left) and GFP (green, right). Scale bars, 10 μm.
Figure EV1. Generation of hair cell‐specific AP‐2μ knockout mice (AP‐2μ fl/fl :Cre).
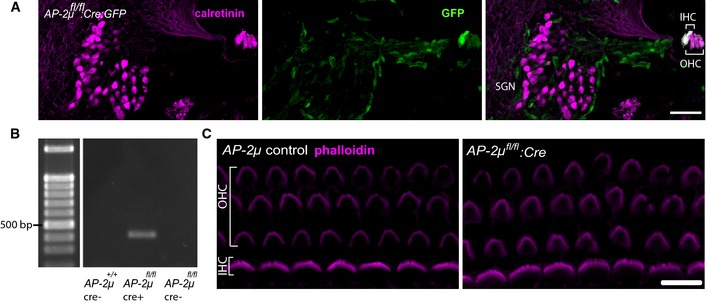
- Cryosectioned cochlea of a p7 AP‐2μ fl/fl :Cre mouse demonstrates VGLUT3‐driven Cre recombination in IHCs and OHCs (Jung et al, 2015) but not in SGNs, as reported by a floxed EGFP reporter (Nakamura et al, 2006). Immunohistochemical staining for calretinin (magenta), marking IHCs, OHCs, and SGNs and native EGFP fluorescence (green), indicating Cre recombination. In addition to EGFP signal in hair cells, some EGFP expression was found in capillaries and supporting cells. Scale bar, 50 μm.
- PCR of genomic DNA extracted from microdissected cochlea of p21 mice shows amplification of the Cre‐recombined region in Cre‐expressing AP‐2μfl/fl mice ((Kononenko et al, 2014), middle column), but not in AP‐2μ control: C57Bl/6 expressing Cre (left column) or AP‐2μ fl/fl mice lacking Cre (right column). Genomic DNA was isolated from whole cochleae of AP‐2μ fl/fl :Cre:GFP,AP‐2μ fl/fl, and AP‐2μ +/+:Cre mice with the nexttec™ kit (nexttec Biotechnologie GmbH, Germany). PCR was performed using DreamTaq DNA polymerase (Fermentas). The Cre‐recombinated excision of exon 2–3 in the Ap‐2μ gene was confirmed by using the forward primer TM330 GCTCTAAAGGTTATGCCTGGTGG and the reverse primer TM191 CCAAGGGACCTACAGGACTTC that detected a fragment of 404 bp (PCR at 58°C, 25 cycles) in cochlear DNA.
- Phalloidin immunofluorescence shows apparently intact stereociliar bundles (magenta) of IHCs (1 row) and OHCs (three rows) in acutely dissected apical coils of the cochlea from AP‐2μ fl/fl control and AP‐2μ fl/fl :Cre mice at p7. Scale bar, 10 μm.
Recordings of auditory brainstem responses (ABR) revealed a profound hearing impairment in AP‐2μ fl/fl :Cre:GFP mice (Fig 2A and B; 3‐ to 6‐week‐old mice, normal ABR in AP‐2μ fl/+ :Cre:GFP mice, n = 9, Appendix Fig S1A). The presence of normal otoacoustic emissions indicated normal mechanoelectrical transduction and cochlear amplification by outer hair cells (Fig EV2D–F), suggesting that hearing is impaired due to defective sound coding at the IHC synapse (auditory synaptopathy, recent review in Moser et al, 2013). In order to further test whether the hearing impairment in AP‐2μ fl/fl :Cre:GFP mice can be specifically attributed to the loss of AP‐2μ from IHCs, we analyzed if hearing was rescued by transgenic expression of AP‐2μ in IHCs. We employed injection of adeno‐associated virus (AAV) 2/1 (serotype 2 with chimeric capsid proteins of serotypes 1 and 2/1–2, Fig EV2A) carrying AP‐2μ‐IRES‐mRFP under the control of the CMV‐enhanced human β‐actin promoter via the round window into scala tympani at postnatal day 10 [Fig EV2B, similar to Akil et al (2012)]. We achieved near complete transduction of AP‐2μ fl/fl :Cre:GFP IHCs in the injected left ear as indicated by mRFP expression (Fig 2C) but did not find mRFP signal in the non‐injected right ear (Fig EV2C). Transgenic expression of AP‐2μ substantially increased ABR amplitudes (Fig 2D, n = 4) and largely restored the ABR thresholds (Fig 2E, n = 4). Thresholds for stimulation with 12 kHz tone burst and click were indistinguishable from AP‐2μ control (P > 0.05, Wilcoxon rank‐sum test, followed by Dunn's multiple comparisons for thresholds) and significantly improved over non‐rescued ears AP‐2μ fl/fl :Cre:GFP (P < 0.05, Wilcoxon rank‐sum test, followed by Dunn's multiple comparisons) confirming the specific requirement of AP‐2μ in IHCs for hearing. The hearing impairment of the non‐injected ear of the same animals was assessed after plugging the injected ear (Pauli‐Magnus et al, 2007) and was comparable to that of the non‐injected AP‐2μ fl/fl :Cre:GFP mice (Fig 2A and B; P > 0.05, Wilcoxon rank‐sum test). In contrast to the auditory synaptopathy caused by AP‐2μ disruption, no hearing impairment was found in mice lacking the σ1B subunit of clathrin adaptor protein AP‐1 (Appendix Fig S1B), whereas pleiotropic changes of the inner ear have been reported for AP‐3 mutant mice (Rolfsen & Erway, 1984; Glyvuk et al, 2010).
Figure 2. Disruption of AP‐2μ in IHCs causes synaptopathic hearing impairment.
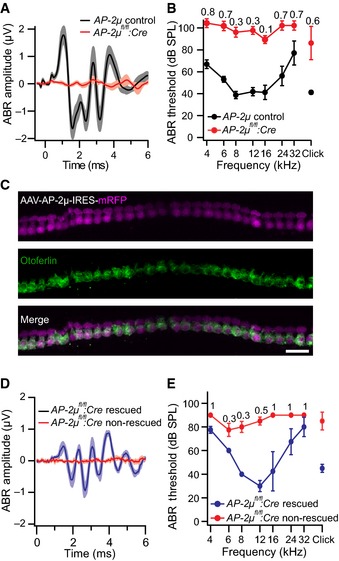
- Average ABR waveforms in response to 90‐dB clicks. ABR waves in AP‐2μ fl/fl :Cre:GFP mice (abbreviated AP‐2μ fl/fl :Cre on Figures throughout hereafter, 3‐ to 6‐week‐old, red: mean, pink: SEM, n = 9) were barely discernible even at such high stimulus intensities, mean ABR of AP‐2 control mice (black, grey: SEM, n = 8) are shown for comparison.
- ABR thresholds were highly elevated in AP‐2μfl/fl:Cre:GFP mice (red, mean ± SEM, n = 9) compared to AP‐2μ control mice (black, mean ± SEM, n = 8), often exceeding the maximal loudspeaker output of 100 dB (numbers on top indicate the fraction of mutant animals in which thresholds exceeded this value and were set to 110 for calculation of the average and SEM).
- Transduction of AP‐2μ fl/fl :Cre:GFP IHCs via postnatal injection of AAV‐AP‐2μ‐mRFP (see Fig EV2) into the cochlear perilymph on postnatal day 10 as indicated by mRFP fluorescence (magenta) in otoferlin(green)‐immunolabeled IHCs. Scale bar, 20 μm.
- Average ABR waveforms in response to 80‐dB clicks of the AAV‐AP‐2μ‐mRFP‐injected left ears of AP‐2μ fl/fl :Cre:GFP mice (n = 4, blue, mean ± SEM “rescued”). Hearing was largely rescued when compared to control recordings from the non‐injected ear of the same mice (red, mean ± SEM, n = 4 “non‐rescued”).
- ABR thresholds of injected (blue) and non‐injected (red) ears of the same AP‐2μ fl/fl :Cre:GFP mice (numbers on top indicate the fraction of ears in which tone burst thresholds exceeded 80 dB and were set to 90 for calculation of the average and SEM).
Figure EV2. Viral rescue of AP‐2μ expression in AP‐2μ fl/fl :Cre:GFP mice and intact cochlear amplification by OHCs in AP‐2μ fl/fl :Cre:GFP mice.
-
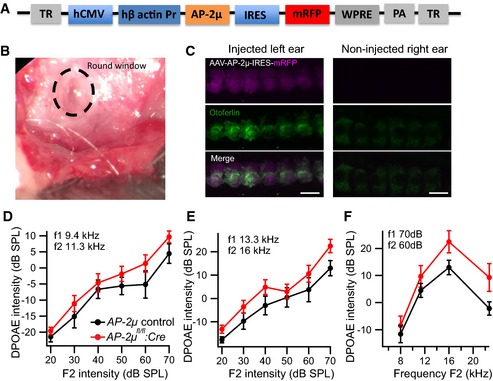
AIllustration of the vector for AAV2/1‐mediated rescue of hearing in AP‐2μ fl/fl :Cre:GFP mice. AP‐2μ is expressed under the CMV‐enhanced human β‐actin promoter, and mRFP was used as a reporter gene under the control of the internal ribosome entry site (IRES).
-
BSurgical situs for AAV injection into the scala tympani of the left ear. In brief, a retroauricular incision was made, skin, connective tissue, and musculature retracted by a custom stainless steel retractor, and the bulla opened carefully with fine forceps to just expose the round window niche. A 10‐ to 20‐μm tip glass pipette was filled with AAV suspension and fast green dye and used to inject 2–3 shots of virus suspension (0.2–0.5 μl of 4.32E12 genome copies/ml, packaged at Penn Vector Core) at 0.13–0.34 bar using a pico‐injector (PL1–100, Harvard Apparatus). The wound was closed with adipose tissue and mice recovered and finally returned to the dam. This procedure led to no or minimal ABR threshold increases when injecting wild‐type ears with AAV carrying either fluorescent protein or AP‐2μ along with the fluorescent protein (data not shown).
-
CTransduction of AP‐2μ fl/fl :Cre:GFP IHCs via postnatal injection of AAV‐AP‐2μ‐mRFP into the cochlear perilymph of the left ear on postnatal day 10 as indicated by native mRFP fluorescence (magenta) in otoferlin (green)‐immunolabeled IHCs. In contrast, there was no mRFP signal and much less otoferlin immunofluorescence in the non‐injected right ear of the same mouse. Scale bar, 10 μm.
-
D, EAverage DPOAE growth functions in response to pairs of primary tones of 9.4 kHz and 11.3 kHz (B) or 13.3 kHz and 16 kHz (C) at varying intensities ± SEM for AP‐2μ fl/fl :Cre:GFP (red, n = 11) and AP‐2μ control (black, n = 8).
-
FAverage DPOAE‐Grams in response to pairs of primary tones with varying frequencies (f2 = 1.2 × f1) ± SEM for AP‐2μ fl/fl :Cre:GFP (red, n = 11) and AP‐2μ control (black, n = 8).
AP‐2μ disruption in IHCs impairs vesicle replenishment upstream of endocytic membrane retrieval
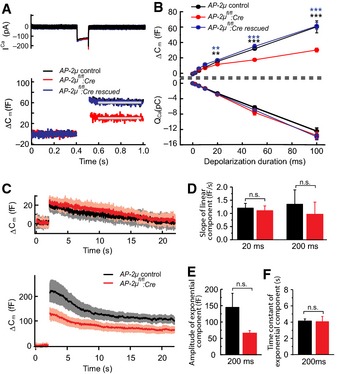
To directly test the effect of AP‐2μ disruption on IHC presynaptic function, we performed perforated patch‐clamp membrane capacitance (Cm) recordings of exo‐ and endocytosis in IHCs (Fig 3) from acutely explanted organs of Corti of mice after the onset of hearing (postnatal days 14–17). AP‐2μ fl/fl :Cre:GFP IHCs showed reduced exocytic Cm increments upon depolarization (ΔCm, Fig 3A–C) despite normal CaV1.3‐mediated Ca2+ influx (Fig 3A and B; Appendix Fig S2A) and an unaltered number of IHC synapses (Appendix Fig S2B). ΔCm were reduced for depolarizations of 20 ms and longer (one‐way ANOVA followed by Tukey's multiple comparisons test), but normal for shorter stimuli (Fig 3B). This indicates that fusion is largely intact, and the number of release sites [RRP size, often approximated by the response to 20‐ms‐long maximum Ca2+ current (Moser & Beutner, 2000)] is mildly reduced, but RRP replenishment (vesicle reloading of the release sites) is strongly impaired in the absence of AP‐2μ. Sustained exocytosis was completely restored by AAV‐AP‐2μ‐IRES‐mRFP rescue in IHCs of AP‐2μ fl/fl :Cre:GFP mice (Fig 3A and B; not statistically different from AP‐2μ control, significantly larger than non‐rescued IHCs (as indicated), one‐way ANOVA followed by Tukey's multiple comparisons test).
Figure 3. Disruption of AP‐2μ in IHCs impairs exocytosis but spares endocytic membrane retrieval.
-
ARepresentative Ca2+ current (top) and Cm response (bottom) of p14 AP‐2μ control (black), AP‐2μ fl/fl :Cre:GFP (red) and AAV‐AP‐2μ‐rescued IHCs (AP‐2μ fl/fl :Cre:GFP, blue) to 100‐ms depolarization to −7 mV revealed reduced exocytosis upon AP‐2μ disruption despite normal Ca2+ influx. Exocytosis was rescued by transgenic AP‐2μ expression. Gray bars indicate the time window for averaging of Cm.
-
BMean and SEM of the exocytic ΔCm (top) and the Ca2+ influx (bottom) of IHCs from AP‐2μ fl/fl :Cre:GFP IHCs (n = 13), AP‐2μ control IHCs (n = 12), and AAV‐AP‐2μ‐rescued AP‐2μ fl/fl :Cre:GFP IHCs (n = 9) mice elicited by depolarizations to peak Ca2+ current potential for different durations. The exocytic ΔCm was significantly reduced in AP‐2μ fl/fl :Cre:GFP (compared to AP‐2μ control mice) as early as after 20 ms of depolarization and completely restored upon transgenic AP‐2μ expression. No changes were found for the Ca2+ current integrals.
-
CAveraged ΔCm responses (± SEM) to stimulation with depolarizations to −7 mV for 20 ms (top, RRP exocytosis and slow, linear endocytosis) and 200 ms (bottom, several RRP equivalents; fast, exponential combined with slow, linear endocytosis): reduced amplitude but unaltered kinetics of fast endocytosis and statistically indistinguishable slow endocytosis (AP‐2μ fl/fl :Cre:GFP IHCs [20 ms: n = 8; 200 ms: n = 9] and AP‐2μ control IHCs [20 ms: n = 10; 200 ms: n = 14]).
-
DThe rate of the slow linear endocytic Cm decline (20 ms: P = 0.62, 200 ms: P = 0.71) was unaltered in IHCs of AP‐2μ fl/fl :Cre:GFP mice (red, 20 ms: n = 6, 200 ms: n = 6) compared to AP‐2μ control animals (black, 20 ms: n = 7, 200 ms: n = 10).
-
E, FAmplitude (E, P = 0.12) and time constant (F, P = 0.87) of the fast exponential component of endocytic Cm decline: trend toward reduced amplitude in IHCs of AP‐2μ fl/fl :Cre:GFP IHCs (red, n = 6) when compared to those of AP‐2μ control IHCs (black, n = 10), most probably resulting from impaired exocytosis in IHCs of AP‐2μ fl/fl :Cre:GFP mice, but normal kinetics of Cm decline.
Membrane retrieval reported as decline of Cm following the exocytic Cm increase seemed normal. The slow, linear component that dominates for weak stimuli and that is inhibited by Pitstop 2, a small molecule inhibitor of clathrin dynamics (Neef et al, 2014), was largely intact (Fig 3C and D). This finding is surprising given that AP‐2 is a key clathrin adaptor and might indicate a function of residual AP‐2 complex (e.g. comprising α,β2,σ) in clathrin‐mediated endocytosis (CME) of AP‐2μ‐deficient IHCs among other possibilities. The fast exponentially decaying component recruited upon membrane turnover surpassing 3–4 RRP equivalents (Neef et al, 2014) tended to be reduced in proportion with exocytosis (not reaching statistical significance) and showed unaltered kinetics (Fig 3C, E and F). Given the fact that compensatory membrane retrieval operates on a time scale of seconds and proceeds nearly unperturbed in the absence of AP‐2μ, the fast onset of the exocytosis deficit as early as after 20 ms of stimulation (Fig 3C) suggests a role for AP‐2μ in vesicle replenishment independent of endocytic vesicle recycling, for example, in facilitating clearance of release sites after vesicle fusion (Haucke et al, 2011). To further test this hypothesis, we next performed extracellular recordings from SGNs that enable in vivo analysis of presynaptic mechanisms at single IHC AZs (Frank et al, 2010).
AP‐2μ disruption in IHCs causes a use‐dependent sound‐encoding impairment and alters the interspike interval statistics
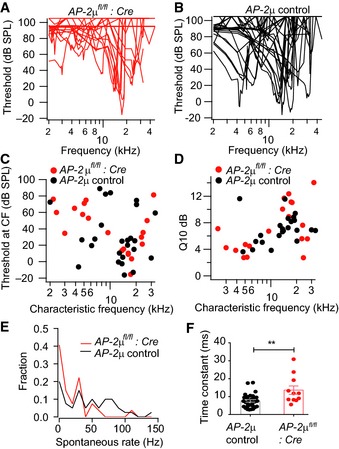
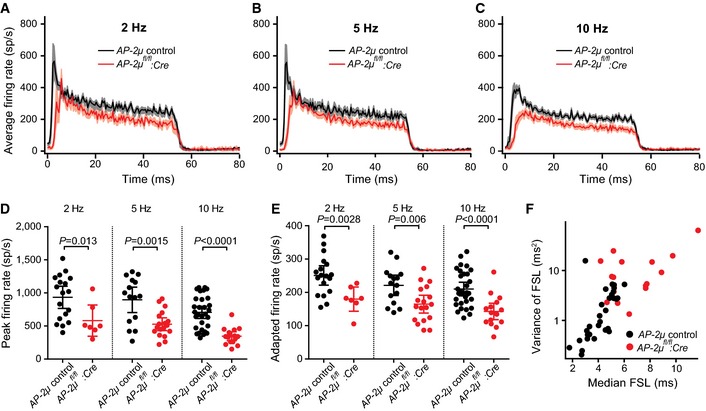
We analyzed SGN sound encoding and thereby RRP depletion and replenishment at single AZs in vivo. Frequency tuning and sound thresholds of SGN firing were normal (Fig EV3A–D), supporting the notion of intact mechanoelectrical transduction and cochlear amplification in AP‐2μ fl/fl :Cre:GFP mice (Fig EV2D–F). Spontaneous spike rates were reduced in SGNs of AP‐2μ fl/fl :Cre:GFP mice compared to SGNs of AP‐2μ control mice (P = 0.011, Kolmogorov–Smirnov test, Fig EV3E). Sound‐evoked firing was lower in SGNs of AP‐2μ fl/fl :Cre:GFP mice, and this reduction was even more pronounced when increasing the rate of stimulation (Fig 4A–E, 50 ms tone bursts at characteristic frequency, 30 dB above threshold; peak rate: mean ± SEM: 581.4 ± 96.3 Hz versus 933.9 ± 79.3 Hz, P = 0.013 for 2 Hz, 527.8 ± 46.1 Hz versus 895.3 ± 89.9 Hz, P = 0.0015 for 5 Hz, 345.6 ± 31.1 versus 705.0 ± 45.1 Hz, P < 0.0001 for 10 Hz; adapted rate: 179.8 ± 14.9 Hz versus 251.0 ± 13.9 Hz, P = 0.0028 for 2 Hz, 164.8 ± 12.7 Hz versus 221.2 ± 14.2 Hz, P = 0.006 for 5 Hz, 142.8 ± 11.5 Hz versus 210.3 ± 10.0 Hz, P < 0.0001 for 10 Hz; t‐test with Welch's correction, all differences were significant also after Bonferroni correction for six comparisons, except for onset rate at 2 Hz). First spike latencies were delayed (P < 0.05 at all stimulus rates, Fig 4F), and the jitter was significantly larger at 10 Hz (P < 0.001, Fig 4F).
Figure EV3. Frequency tuning, sound threshold, spontaneous firing, kinetics, and extent of short‐term adaptation in SGNs of AP‐2μ fl/fl :Cre:GFP mice.
-
A, BFrequency tuning curves of SGNs in AP‐2μ fl/fl :Cre:GFP mice (A) show comparable thresholds and sharpness of tuning as in SGN of AP‐2μ control mice (B), compatible with normal cochlear function upstream of the IHC synapse (Fig EV2D–F).
-
CSound thresholds at the characteristic frequency of putative SGNs in AP‐2μ fl/fl :Cre:GFP mice were comparable to those of SGNs of AP‐2μ control mice.
-
DFrequency tuning, quantified as the excitatory bandwidth at 10 dB above threshold divided by the frequency (Q10 dB), was comparable between AP‐2μ fl/fl :Cre:GFP mice and AP‐2μ control mice.
-
ESpontaneous rate distributions of AP‐2μ fl/fl :Cre:GFP (n = 27) and AP‐2μ control (n = 40) SGNs differ significantly (P = 0.011, Kolmogorov–Smirnov) with lower rates in AP‐2μ fl/fl :Cre:GFP mice.
-
FSlower kinetics of short‐term spike rate adaptation (P < 0.01, Wilcoxon rank‐sum test), indicating a reduced replenishment and/or fusion rate constant of the RRP.
Figure 4. Disruption of AP‐2μ in IHCs causes a use‐dependent reduction in sound‐evoked firing and impaired sound onset coding in SGN .
-
A–CPeristimulus time histograms (PSTHs, 0.5 ms per bin) of putative SGNs from AP‐2μ fl/fl :Cre (red: mean, pink: SEM) and AP‐2μ control (black) mice, recorded in response to tone bursts at characteristic frequency, 30 dB above threshold at stimulus rates of 2 Hz (A), 5 Hz (B), and 10 Hz (C): stimulus rate‐dependent decline of spike rate in 3‐ to 6‐week‐old mice.
-
D, EQuantification of peak (D, maximal instantaneous firing rate during the initial 10 ms after tone bursts onset) and adapted firing rate (E, average rate of final 20 ms).
-
FIncreased first spike latency and jitter in AP‐2μ fl/fl :Cre:GFP (10 Hz stimulation rate).
The time constant of short‐term adaptation, reflecting partial depletion of the RRP (Moser & Beutner, 2000; Goutman & Glowatzki, 2007), was slower in SGNs of AP‐2μ fl/fl :Cre:GFP mice (13.6 ± 2.4 ms versus 7.6 ± 0.7 ms, P = 0.0071 Wilcoxon rank‐sum test, Fig EV3F). The reduced onset response at higher stimulation rates indicates a use‐dependent reduction in release site occupancy in vivo (reduced “standing RRP”, Pangršič et al, 2012). Slowed adaptation likely reflects the combination of slowed fusion and replenishment of the RRP (see Fig 5 below). Reduced “standing RRP” and slowed fusion lower the initial release rate and thereby increase the first spike latency and its jitter (Wittig & Parsons, 2008; Buran et al, 2010). The increased temporal jitter of the first spike together with the reduced onset firing rate likely explain the strong impairment of ABRs, which require summation of many synchronously activated SGNs (Khimich et al, 2005; Buran et al, 2010).
Figure 5. AP‐2μ is required for replenishment of the RRP in IHCs possibly via promoting release site clearance.
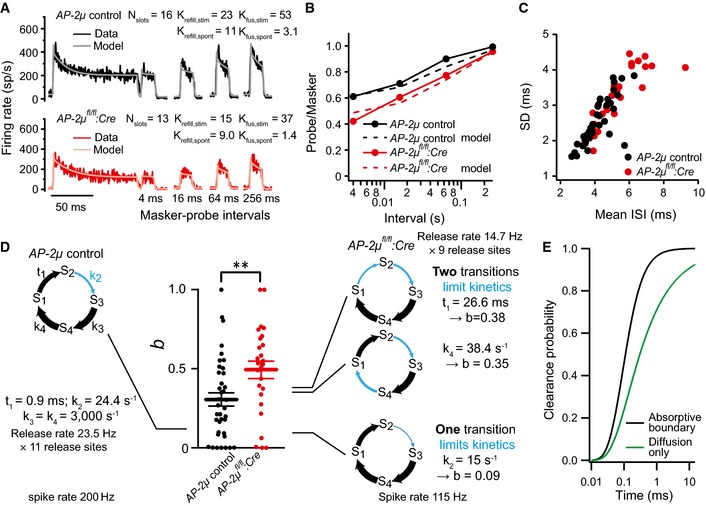
- Average forward masking data of SGNs from AP‐2μ fl/fl :Cre:GFP (n = 10, black) and AP‐2μ control (n = 15, red) mice and fits of biophysical model (gray and pink lines) to study RRP release and replenishment at AZs of IHCs. A stimulus complex consisting of a 100‐ms masker stimulus, a silent interval of 4/16/64/256 ms, and a 15‐ms probe (both at the characteristic frequency, 30 dB above threshold) was presented at 2 Hz.
- Recovery of onset response analyzed as ratio of probe and masker response (number of spikes during first 15 ms) and prediction (dashed lines) derived from the model fit shown in (A).
- Analysis of interspike intervals (ISIs) of spikes during the last 25 ms (adapted) responses to tone burst presented at characteristic frequency, 30 dB above threshold. SGNs in AP‐2μ fl/fl :Cre:GFP mice (red) on average showed larger mean (P < 0.001, Wilcoxon rank‐sum test) and standard deviation (SD, P < 0.01, Wilcoxon rank‐sum test) of ISIs.
- Relative contribution, b, of the gamma process to the spike time distribution and schematic representation of models of the functional cycle of a release site. The states S1 through S4 represent conditions such as “cleared”, “docked”, “primed”, and “fused”. The size of the connecting arrows symbolizes the speed of the transitions, with thick arrows indicating fast steps. For the simulations, it is assumed that eleven such release sites constitute one synapse; however, the exact number has no influence on the conclusions drawn. The output of the model is a sequence of release‐driven spike events. The statistics of interspike intervals was analyzed, and the parameter b, the fraction of gamma‐process contributions, was determined. A ˜40% reduction in the release rate from 200 Hz (left model) to 115 Hz can be caused by very different changes to the model's kinetics; three examples are shown. If a single step takes up most of the cycle time (bottom example), the parameter b is small. If the mutation slows a previously rapid transition, to distribute the delays in the cycle to two different transitions, an increase in b is the result, as observed in the experimental data.
- Comparison of predicted clearance of protein from the membrane at the active zone when modeled as free diffusion (green) or as a combination of diffusion and active removal (or conversion) of proteins at a boundary 50 nm from the fusion locus (black). Note that in both cases, clearing only occurs after an initial delay of ˜20 μs. Clearance without any removal or conversion (green line) is markedly slower, with only ˜90% of material cleared after 14 ms (see also Appendix Fig S5).
Next, we studied replenishment of the RRP. This employed measurements of the SGN response to a 100‐ms‐long tone burst (“masking stimulus”) followed by a 15‐ms tone burst (“test stimulus”) at variable intervals to track the recovery of the onset response from adaptation (“forward masking paradigm”, Harris & Dallos, 1979; both tones at 30 dB above threshold at the best frequency, spikes analyzed for the first 5 ms). We used a mathematical model of RRP dynamics (Frank et al, 2010) to fit the forward masking spiking data across all recovery intervals (Fig 5A, Appendix Fig S4). This analysis indicated a 1.5‐fold reduction in the vesicle replenishment rate constant per release site (Fig 5A), resulting in slowed recovery (Fig 5A and B, half‐time of recovery: 52.3 ± 8.9 ms for AP‐2μ fl/fl :Cre:GFP, n = 15 versus 25.3 ± 3.3 ms for AP‐2μ control, n = 10, P = 0.013, Wilcoxon rank‐sum test) and lower steady‐state occupancy of the release sites (“standing RRP”, Pangršič et al, 2012) (Fig 5A). Consistent with the unchanged number of membrane‐proximal vesicles (Fig 6, below), the number of functional release sites composing the RRP was not substantially altered. However, the model reported slower fusion, which is consistent with the longer adaptation time constant (see above) and could indicate that vesicles had not yet reached full fusion competence. We concluded that impaired release site reloading causes a smaller “standing RRP”, which, together with slower fusion, results in reduced spike rates and increased latency and jitter of the first spike. To further address the mechanisms of impaired vesicle reloading, we analyzed and modeled the interspike intervals for the sustained response of SGNs to tone bursts (Fig EV4, Appendix Figs S3 and S4). The concept behind this analysis is that the kinetics of the work cycle of a release site, that is, vesicle release, site clearance, and refilling, does influence the timing of vesicle releases at the entire IHC AZ and therefore the timing of postsynaptic spikes. We used a phenomenological description of the interspike interval distribution (Heil et al, 2007) (Fig 5C, Appendix Fig S3, Equation S7 in Appendix Fig S4). This analysis yielded estimates of the relative contribution of the gamma process to synaptic transmission (b, see Introduction, Fig 5D), neural refractoriness (tD, Appendix Fig S3C), and the scale factor λE of both the Poisson and gamma processes (Appendix Fig S3D). We found an increased contribution of the gamma process to synaptic transmission in the absence of AP‐2μ from IHCs (Fig 5D, mean ± SEM: 0.5 ± 0.05 for AP‐2μ fl/fl :Cre:GFP versus 0.30 ± 0.04 for AP‐2μ control, P = 0.006, Wilcoxon rank‐sum test).
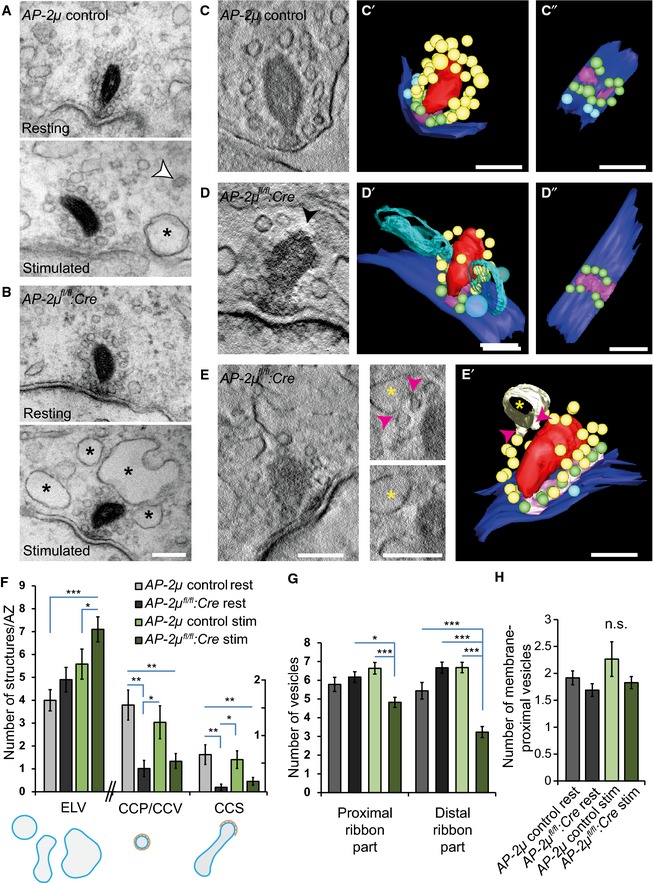
Figure 6. Accumulation of endosome‐like vacuoles (ELVs), reduction in clathrin‐coated membranes, and vesicle depletion of the membrane‐distal part of the ribbon indicate impaired synaptic vesicle regeneration in AP‐2μ‐deficient IHCs.
-
A, BElectron micrographs of random ultrathin sections of ribbon synapses of resting and K+‐stimulated (50 mM for 15 min) AP‐2μ control (A) and AP‐2μ fl/fl :Cre:GFP (B) p14‐17 IHCs. Coated structures (white arrowhead) are present in resting and stimulated AP‐2μ control IHCs but clearly reduced in AP‐2μ fl/fl :Cre:GFP IHCs near synaptic ribbons. A strong accumulation of ELVs was observed near AZs of stimulated IHCs of both genotypes (black asterisks). A depletion of vesicles at the membrane‐distal part of the ribbon was found in stimulated AP‐2μ fl/fl :Cre:GFP IHCs. Analysis was performed on random sections of ribbon‐occupied AZs derived from several IHCs per genotype: AP‐2μ control rest n random section = 27; AP‐2μ control stim n = 25; AP‐2μ fl/fl :Cre:GFP rest n = 25; and AP‐2μ fl/fl :Cre:GFP stim n = 56. 1–2 mice were used per condition. Scale bars, 100 nm.
-
C–EElectron tomography of stimulated AP‐2μ control (C) and AP‐2μ fl/fl :Cre:GFP (D, E) IHC synapses corroborated the depletion of ribbon‐associated synaptic vesicles (black arrowhead in D; also see representative virtual sections (C, D, E, black arrowhead in D points to the membrane‐distal ribbon that lacks ribbon‐associated vesicles.) and models reconstructed from tomograms, C', D', E' (C'' and D'', top view on the AZ without ribbons); red: ribbon; magenta: presynaptic density; blue: AZ membrane; yellow: ribbon‐associated SVs; green: membrane‐proximal SVs; and light blue > 70 nm: ELVs). Budding of non‐coated vesicles (magenta arrowheads, E, E') from an ELV (yellow asterisk) was observed in AP‐2μ fl/fl :Cre:GFP IHCs near the membrane‐distal end of the ribbon. Scale bars, 100 nm.
-
FQuantification of perisynaptic non‐SV membrane organelles in random sections: in addition to coated structures such as clathrin‐coated pits at the membrane and coated vesicles (largely absent in AP‐2μ fl/fl :Cre:GFP IHCs), we quantified ELVs in random sections, defined as non‐coated endocytic intermediates round or polymorphic in shape and > 70 nm in diameter. CCP/CCV and CCS are depicted in a different scale compared to ELVs.
-
G, H(G) Fewer ribbon‐associated SVs but (H) normal number of membrane‐proximal SVs in random sections from stimulated AP‐2μ fl/fl :Cre:GFP IHCs.
Figure EV4. Details of the pre‐synaptic release site kinetics are reflected in release and spike statistics.
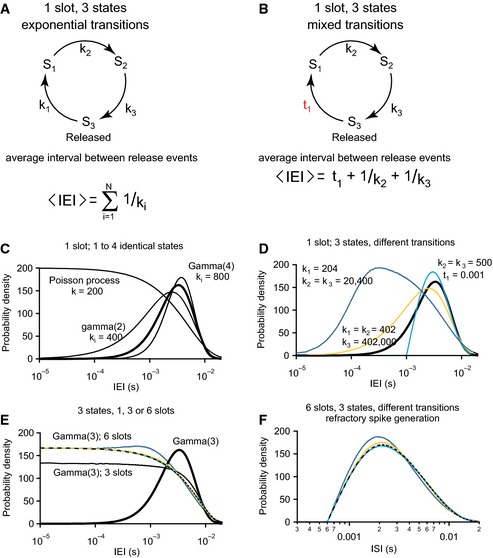
- Model of the vesicle release/refill cycle at a single release site (“slot”) based on a Markov model with N states, in this example N = 3. The transitions into state i occurs as Poisson process with rate k i. If all N rates are identical, the intervals between release events follow a gamma distribution with form factor N (see C).
- One of the Poisson transitions is replaced by a transition that takes a fixed time, as it would occur when active clearance was replaced by clearance through diffusion.
- The probability density function of IEIs for release site models with 1–4 states and identical transitions. The rate constants are given in s−1. For three states (thick line), k i = 600/s. The memoryless Poisson process (N = 1) contributes much more very short IEIs. The transition rates were adapted to obtain an average release rate of 200/s in all cases.
- The IEI distribution of a three‐state‐cycle with identical transitions follows a gamma distribution with form factor 3 (thick line). If the first one of the transitions becomes much faster, the IEI distribution shifts toward gamma with form factor 2 (orange), if also a second transition becomes faster, the single remaining slow transition is speed limiting and the IEI distribution shifts toward a Poisson distribution (dark blue). When one of the transitions is replaced by a fixed waiting time t1, the IEI distribution shifts in the other direction (cyan). As no intervals shorter than t1 are now possible, the probability density concentrates toward longer intervals.
- As release events from more than one release site are combined, very short IEIs can occur and the result resembles a mixture of a Poisson process and a gamma process (thin continuous black line: three states, dashed line six states) even if each individual release site produces gamma(3)‐distributed events. This blurs the clear differences observed for a single release site (compare to D, corresponding simulations in identical color code). Data are generated with the same relative rate differences as in (C), but all rates are scaled to obtain an average release rate of 200/s from the one, three or six release sites combined.
- The refractory spike generation further transforms the probability density functions. Intervals below the absolute refractory period no longer occur, and the distributions are deformed toward longer intervals.
Since AP‐2μ was selectively deleted in the presynaptic IHC, the observed change in the gamma process contribution confirms its previously suspected presynaptic origin (Heil et al, 2007; Peterson et al, 2014). Modeling of the release site's cycle as a Markov chain of functional states (Andor‐Ardo et al, 2010) indicated that the increased gamma process contribution likely reflects a slowing of a transition that was previously not rate‐limiting the release site cycle (Figs 5D and EV4, Appendix Table S1). One attractive candidate mechanism explaining an increased gamma process contribution is that a previously fast Poisson transition in the cycle is replaced by a slow one. This could occur when diffusional clearance of the release site from exocytosed proteolipid is slowed due to lack of an endocytic interaction partner that, when present, lowers the protein abundance lateral to AZs (Fig 5E, Appendix Fig S5).
AP‐2μ disruption impairs synaptic vesicle reformation following bulk endocytosis during strong stimulation
To probe whether AP‐2μ, in addition to its fast action in RRP replenishment, plays a role downstream of membrane retrieval, we probed endocytic membrane recycling in IHCs during sustained strong stimulation applying a 50 mM K+ solution for 15 min (Lenzi et al, 2002; Pangršič et al, 2010; Vogl et al, 2015) likely depolarizing IHCs to ~−10 mV (Lenzi et al, 2002). We note that such long stimulation exceeded the effective duration of the other stimulation protocols used in the present study, but was chosen in order to strongly drive the synapse and is relevant given that tonic transmission is a key feature of the IHC synapse.
Electron microscopy and tomography in resting and K+‐stimulated AP‐2μ fl/fl :Cre:GFP IHCs revealed a reduction in clathrin‐coated membrane profiles in vicinity to ribbon synapses (Fig 6A–F), consistent with the role of AP‐2 in CME (McMahon & Boucrot, 2011). AP‐2μ fl/fl :Cre:GFP IHCs, when K+‐stimulated, exhibited an accumulation of endosome‐like vacuoles (ELVs, Fig 6B and D–F), which likely originate from bulk endocytosis and normally serve as precursors en route to synaptic vesicle reformation (Neef et al, 2014). In addition, we observed a, presumably, corresponding depletion of ribbon‐associated vesicles most prominently at the membrane‐distal end of the ribbons (Fig 6B, D, E and G), which was not observed upon genetic deletion of otoferlin (Vogl et al, 2015). In some AP‐2μ fl/fl :Cre:GFP synapses, we observed budding of uncoated vesicles from ELVs toward the synaptic ribbon (Fig 6E and E'), likely reflecting a clathrin‐independent (Wu et al, 2014), yet overtly insufficient, mechanism of synaptic vesicle reformation. Notwithstanding the vesicle reformation deficit, the number of membrane‐proximal vesicles at the AZ was not significantly reduced per random section in AP‐2μ fl/fl :Cre:GFP IHCs even during the strong stimulation (Fig 6H). This finding supports our hypothesis that slowed exocytosis in AP‐2μ fl/fl :Cre:GFP IHCs is primarily due to impaired AZ clearance rather than insufficient vesicle supply to the AZ.
To substantiate the hypothesis that AP‐2μ is required for synaptic vesicle reformation from membrane internalized by bulk endocytosis, we used stimulated emission depletion (STED) microscopy of thin melamine sections of IHCs that had been incubated with the novel fixable reporter of membrane turnover mCLING and fixed during K+ stimulation (65 mM K+ for 1 min, “stimulated”, Fig 7A and B) or 5 min after washing (“recovery”, Fig 7C and D) (Revelo et al, 2014). Large mCLING‐positive structures in the vicinity of the synaptic ribbon (Fig 7A, B and D) likely represent ELVs derived from bulk endocytosis (Fig 6). We found a reduced uptake of mCLING‐positive membrane in AP‐2μ fl/fl :Cre IHCs (Fig 7B), in line with reduced exo‐ and endocytosis described above (Fig 3). mCLING‐labeled ELVs were typically replaced by small mCLING‐positive vesicles in AP‐2μ control IHCs within 5 min after stimulation (Fig 7C), reflecting efficient synaptic vesicle reformation. In contrast, ELVs remained present in AP‐2μ fl/fl :Cre IHCs, indicating that vesicle reformation requires AP‐2μ (Fig 7D). These findings unravel a critical role of AP‐2μ in the reformation of synaptic vesicles from ELVs formed by bulk endocytic membrane retrieval rather than from the plasma membrane proper. The fact that mCLING uptake was also reduced in the apex of the IHCs indicates a role of AP‐2μ in constitutive endocytosis in IHCs (Revelo et al, 2014).
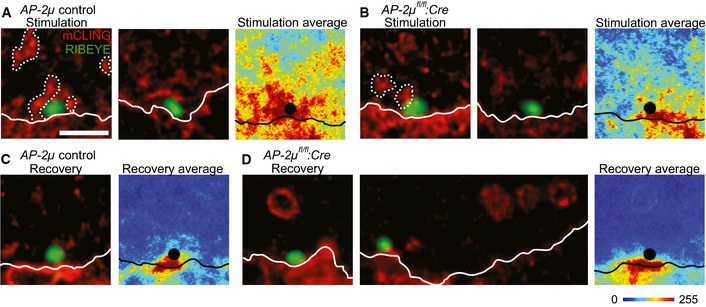
Figure 7. Persistence of mCLING‐labeled ELVs in AP‐2μ‐deficient IHCs indicates a role of AP‐2 in synaptic vesicle regeneration following bulk endocytosis.
-
A–DSTED imaging of uptaken mCLING fluorescence indicates large mCLING‐positive structures (indicated by dashed lines) near AZs during K+ depolarization in AP‐2μ control IHCs (A) and to a lesser degree in AP‐2μ fl/fl :Cre IHCs (B). IHCs were chemically fixed immediately following stimulation by 65 mM K+ for 1 min in the presence of 1.7 μM mCLING‐Atto647N (red) and thereafter immunolabeled for RIBEYE/CtBP2, marking the AZ (green), and otoferlin (not shown). The mCLING‐labeled structures most likely reflect ELVs, arising from bulk endocytic retrieval of membrane, which are broken down into smaller compartments during 5 min of recovery after stimulation (as above) in AP‐2μ control IHCs (C) but persist in AP‐2μ fl/fl :Cre IHCs (D). Mice lacking the GFP reporter were used for STED experiments, as the green channel was used for RIBEYE/CtBP2 immunolabeling. Representative STED images of 200‐nm melamine sections of IHCs are shown in the left panels of (A‐D). For a more quantitative view of endocytosis across different release sites, average images (false color‐coded panels, right panels in A–D) centered on the synaptic ribbons were generated from 10 to 15 individual ribbon synapses. White lines indicate the location of the plasma membrane, which was approximated in STED images of otoferlin fluorescence in the same sections (where the cell borders are quite evident, see Fig 9) and copied onto the mCLING images. Scale bar, 1 μm. Note that mCLING, as a non‐specific membrane marker, is taken up not only by the IHCs, but by other cells as well. In addition, mCLING decorates the extracellular leaflets of all plasma membranes, including those of supporting cells and of the afferent and efferent synapses that are positioned below the AZs of the IHCs, which likely explains the fluorescence outside the IHCs.
Multivalent binding of AP‐2 and otoferlin might facilitate AZ clearance and is required for otoferlin sorting
How might AP‐2 facilitate RRP replenishment? A possible mechanism might involve its association with the hair cell C2‐domain protein otoferlin (Duncker et al, 2013), which could enhance the lateral diffusion of otoferlin and associated vesicular proteolipid by lowering the abundance of free otoferlin in the perisynaptic zone (Fig 5E) to allow recruitment of new release‐ready vesicles. Indeed, otoferlin itself is required for both hearing and RRP replenishment. Some aspects of the hair cell synaptic phenotype found in the pachanga mouse line that carries a missense mutation in otoferlin are similar to findings made upon AP‐2μ loss‐of‐function in the present study. To test this hypothesis further, we analyzed the mechanism by which AP‐2 associates with otoferlin. Heterotetrameric AP‐2 (comprising α, σ, β, and μ subunits) is known to associate with cargo proteins via three modes: binding of AP‐2μ to cargo‐C2‐domains (Zhang et al, 1994; Haucke et al, 2000) and to tyrosine‐based motifs as well as via the interface of the α and σ subunits within the AP‐2 core to acidic cluster dileucine motifs (e.g. CD4; Lock et al, 1999). Otoferlin contains dileucine motifs as well as C2‐domains (Fig 8A and B), but lacks apparent tyrosine‐based motifs.
Figure 8. The AP‐2 complex undergoes multivalent interaction with otoferlin.
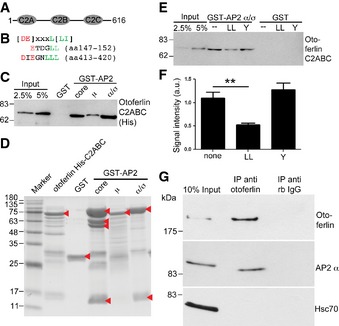
- Otoferlin fragment used for binding assays.
- Alignment of otoferlin dileucine‐containing motifs with consensus sequence.
- Otoferlin directly associates with AP‐2. Bead‐bound GST‐AP‐2 core complex, GST‐AP‐2 α/σ hemicomplex, GST‐AP‐2μ, and GST were incubated with 225 nM of the His‐tagged otoferlin C2 ABC‐fragment. Samples were blotted and probed with His‐tag‐specific antibodies.
- Coomassie gel of proteins used in (E, F). Arrow heads indicate purified proteins.
- Dileucine motifs contribute to the binding between otoferlin and AP‐2. Bead‐bound GST‐AP‐2 α/σ hemicomplex and GST were incubated with 225 nM His‐tagged otoferlin C2 ABC after pre‐incubation with a dileucine‐containing peptide (LL), a tyrosine‐based peptide (Y), or no peptide (none). Samples were blotted and probed for otoferlin.
- Quantification of data shown in (E). Data are given as mean ± SEM. Two‐tailed unpaired Student's t‐test to compare control (no peptide) with LL‐peptide treated condition, **P < 0.01. (n = 4).
- Otoferlin and AP‐2 form a complex in living cells. Lysates from HEK cells overexpressing full‐length otoferlin and AP‐2μ were immunoprecipitated using anti‐otoferlin antibodies or control immunoglobulins. Samples were blotted and probed for otoferlin, and AP‐2α and Hsc70.
To probe which of these determinants are involved in AP‐2 binding to otoferlin, we incubated a His‐tagged, N‐terminal otoferlin fragment (C2ABC) with the AP‐2α/σ/β/μ core complex or with either AP‐2α/σ hemicomplex or purified AP‐2μ. The core complex, AP‐2α/σ, as well as AP‐2μ specifically bound to otoferlin (Fig 8C and D), suggesting that both mechanisms of binding are involved in complex formation. Consistent with a contribution of di‐leucine motifs, otoferlin association with the AP‐2α/σ hemicomplex was partially inhibited by the addition of a bona fide AP‐2‐binding dileucine motif peptide, whereas a tyrosine motif peptide was without effect (Fig 8E and F). The AP‐2–otoferlin interaction was also confirmed by AP‐2μ co‐immuno‐precipitation with otoferlin from human embryonic kidney cells (HEK293, Fig 8G). Additional binding of AP‐2 to the C‐terminal “half” of otoferlin remains to be tested, which will require the use of antibodies directed to the C2D‐F that were not at our disposal. Thus, otoferlin and AP‐2 associate via at least two mechanisms: via AP‐2μ binding to C2‐domains and via the association of the AP‐2 core with acidic cluster dileucine motifs in the C2A‐C.
In order to probe a possible function of AP‐2 in endocytic sorting of otoferlin, we next studied the abundance and subcellular distribution of otoferlin in AP‐2μ fl/fl :Cre and AP‐2μ control IHCs using semiquantitative immunohistochemistry. Otoferlin levels were reduced with the remaining otoferlin being redistributed to the plasma membrane in AP‐2μ fl/fl :Cre IHCs (Fig 9A and B), suggesting that AP‐2 is required for maintenance and/or endocytic sorting of otoferlin. Otoferlin protein levels were largely restored in AAV‐AP‐2μ‐rescued IHCs (Fig EV5). In mCLING‐uptake experiments, we found large otoferlin‐ and mCLING‐positive vacuoles at the nuclear level in AP‐2μ fl/fl :Cre IHCs but not in AP‐2μ control IHCs (Fig 9C), potentially indicating non‐synaptic endocytosis of otoferlin‐containing membranes and a corresponding failure to recycle otoferlin to the presynaptic site of action. Instead, otoferlin may be targeted for lysosomal or proteasomal degradation explaining the overall reduction in otoferlin levels in the absence of AP‐2μ. Immuno‐electron microscopy further supported the notion of reduced abundance and increased plasma membrane stranding of otoferlin in AP‐2μ fl/fl :Cre IHCs (Fig 9D).
Figure 9. AP‐2μ is required for normal sorting and abundance of otoferlin in IHCs.
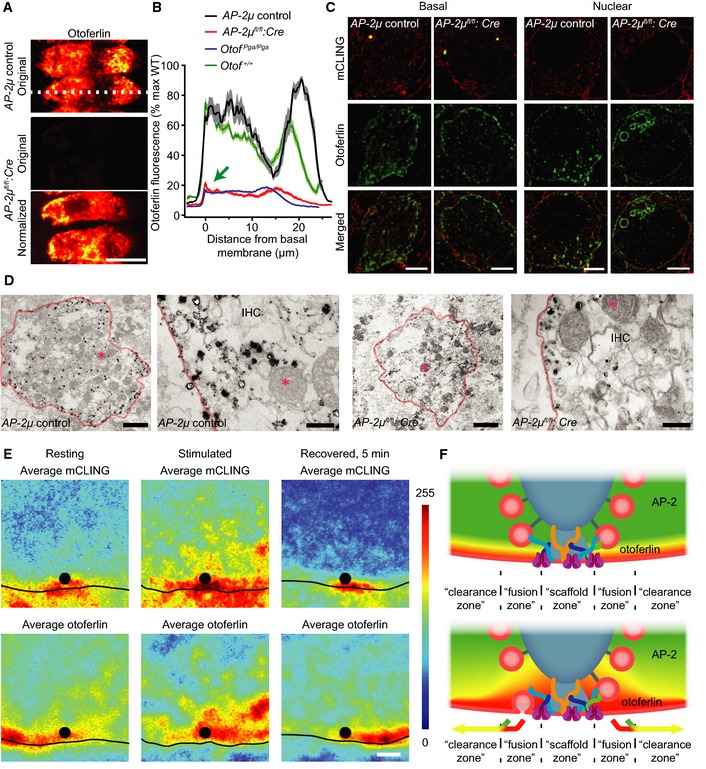
- Disruption of AP‐2μ causes a reduction and mislocalization of otoferlin. Maximal projections of confocal sections of otoferlin‐immunolabeled resting AP‐2μ control (upper) and AP‐2μ fl/fl :Cre:GFP (lower two panels) IHCs that were stained and imaged in parallel under identical conditions. “Original” (middle panel) indicates images acquired with identical settings; “normalized” indicates that the image has been normalized to maximum fluorescence in order to visualize the distribution of otoferlin. The basal pole of the IHCs points left in the images. Scale bar, 10 μm.
- Average line profiles along the long axis of the IHCs (white dotted line in A) reveal a reduction in otoferlin immunofluorescence and a redistribution showing more otoferlin at the plasma membrane than intracellularly (green arrow).
- Combination of 2‐color STED (fixable fluorescent membrane marker mCLING, red; otoferlin immunofluorescence, green) and confocal (RIBEYE/CtBP2‐immunofluorescence marking synaptic ribbons in yellow) microscopy of synaptic/basal pole (left block) and non‐synaptic nuclear level (right block) of AP‐2μ control (left columns) and AP‐2μ fl/fl :Cre (right columns) IHCs, fixed after 1 min of stimulation with 65 mM K+. Data reveal large mCLING‐positive structures that probably represent ELVs at the basal level. Prominent mCLING‐ and otoferlin‐positive vacuoles were seen at the nuclear level. Mice lacking the GFP reporter were used as the green channel was used for otoferlin immunolabeling. Scale bar, 2 μm.
- Electron micrographs of resting AP‐2μ control (left block) and AP‐2μ fl/fl :Cre:GFP (right block) IHCs following pre‐embedding immunogold labeling for otoferlin. Left panels of each block show an overview of the basal area of the IHC (scale bar, 2 μm), and right panels of each block show a close‐up of the plasma membrane (scale bar, 200 nm). In both cases, a reduced number of silver‐enhanced gold grains, which preferentially reside close to the plasma membrane (indicated in orange), is apparent in AP‐2μ fl/fl :Cre:GFP IHCs. For clarity, in each image, one mitochondrium is marked by a pink asterisk.
- STED imaging of ultrathin melamine sections of AP‐2μ control IHCs showing uptaken mCLING fluorescence (top) and immunohistochemically stained otoferlin (bottom). Individual images were averaged as described for Fig 7. The cells were chemically fixed either in resting state (left, n = 19 AZs), following 1‐min stimulation by 65 mM K+ (middle, n = 16 AZs), or in recovered state, 5 min after stimulation (right, n = 22 AZs). Scale bar, 500 nm.
- Schematic of the proposed role of AP‐2 in AZ clearance. Otoferlin arriving at the AZ is speculated to be actively lateralized by interaction with AP‐2.
Figure EV5. AAV2/1 gene replacement of AP‐2μ restores near‐normal otoferlin protein levels in IHCs of AP‐2μ fl/fl :Cre mouse.
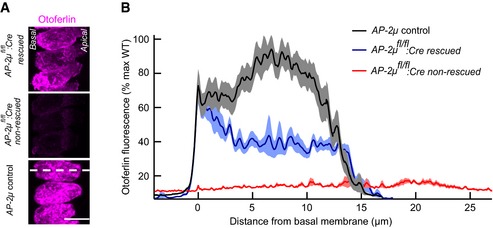
- Maximum projections of confocal sections of otoferlin‐immunolabeled organs of Corti of p14–17 AP‐2μ fl/fl :Cre rescued (AAV‐AP‐2μ‐injected; upper panel), AP‐2μ fl/fl :Cre non‐rescued (middle panel), and AP‐2μ control (bottom panel) ears that were stained and imaged in parallel under identical conditions. Scale bar, 10 μm.
- Average line profiles along the long axis of the IHCs (white dotted line in the bottom panel of A) reveal an increased otoferlin immunofluorescence in rescued IHCs, in particular at the plasma membrane in the basal pole where normal protein levels are found. Data were normalized to maximum fluorescence of IHCs from AP‐2μ control ears, originate from n = 19 IHCs for AP‐2μ control, n = 12 IHCs for AP‐2μ fl/fl :Cre rescued, and n = 7 IHCs for AP‐2μ fl/fl :Cre non‐rescued and are presented as mean ± SEM. The basal pole of the IHCs points to the left in the images. IHCs from AP‐2μ fl/fl :Cre rescued and AP‐2μ control ears happened to extend at a steeper angle within the organ of Corti in this sample than usual, giving rise to the shorter profiles in the maximum projection.
Collectively, these data show that AP‐2μ is required for proper endocytic sorting of otoferlin during synaptic vesicle cycling. Otoferlin is found on synaptic vesicles and the plasma membrane (Roux et al, 2006) and seems enriched in the membrane of the ribbon‐type AZs (Vogl et al, 2015). In order to probe for the distribution of otoferlin at the synapse before, during, and after activity, we used STED microscopy of mCLING‐labeled AP‐2μ control IHC synapses in 200‐nm melamine sections. IHCs were fixed at rest, after stimulation with 65 mM K+ for 5 min, and after recovery from stimulation, each time in the extracellular presence of mCLING (Fig 9E). Sections were immunolabeled for RIBEYE (to identify AZs) and otoferlin and their STED images averaged after rotation around the ribbon center for maximal overlap of the mCLING‐labeled plasma membrane as described for Fig 7. This analysis confirmed the abundance of otoferlin on the plasma membrane also beyond the AZ as well as substantial protein levels in the perisynaptic intracellular space, while the ribbon‐associated otoferlin mostly occupied the base of the ribbon. Upon stimulation, the ribbon‐associated otoferlin fluorescence became more prominent, and in addition, otoferlin was found to strongly overlap with intracellular mCLING likely reflecting endocytosed membrane as previously described (Revelo et al, 2014). Following 5‐min recovery, the ribbon‐associated otoferlin fluorescence was much reduced, and the intracellular signal seemed spread out.
We speculate that following vesicle exocytosis, AZ‐localized otoferlin binds to perisynaptic AP‐2 along an opposing gradient of these two proteins, which might speed lateral diffusion (Fig 5E, Appendix Fig S5) of otoferlin and associated exocytosed proteolipid away from the fusion zone into the perisynaptic area (“clearance zone”, illustrated in Fig 9F). In this hypothetical model, we assume that otoferlin localizes to both synaptic vesicles (Roux et al, 2006; Revelo et al, 2014) and plasma membrane (Roux et al, 2006; Pangršič et al, 2010; Vogl et al, 2015) of IHCs at rest and becomes enriched at the AZ during exocytosis, while AP‐2 resides in the cytosol and is bound to the plasma membrane via phosphatidylinositol 4,5‐bisphosphate (Gaidarov & Keen, 1999). We note that this hypothesis will require further testing, for example, by super‐resolution life microscopy.
Discussion
Our results demonstrate a critical role for AP‐2μ in cochlear sound encoding. Hair cell‐specific disruption of AP‐2μ impairs hearing, and hearing is restored by AAV‐mediated rescue of AP‐2μ. AP‐2μ disruption reduces vesicle reloading at IHC release sites, possibly reflecting a role of AP‐2 in site clearance. In addition, AP‐2 is required for otoferlin sorting and for synaptic vesicle reformation following bulk endocytosis.
A potential role of AP‐2 in AZ clearance at the IHC synapse
We propose that the sound‐encoding defect in mice with AP‐2μ‐deficient IHCs is primarily due to impaired acquisition of vesicular fusion competence at the AZ, possibly resulting from slowed clearance of recently exocytosed proteolipidic material from release sites. Given that AP‐2μ deletion causes missorting and partial loss of otoferlin, we also cannot rule out the possibility that impaired vesicle replenishment in the absence of AP‐2μ is an indirect consequence of otoferlin deficiency, which may in turn result in deficits in vesicle priming (Pangršič et al, 2010). Irrespective of the precise mechanisms by which AP‐2μ acts, we present three lines of evidence that support the hypothesis of a requirement of AP‐2μ for efficient vesicle replenishment independent of its established function in endocytosis and/or SV regeneration: (i) Exocytosis was impaired in AP‐2μ‐deficient IHCs as early as 20 ms after stimulus onset, long before significant endocytic retrieval commences at this synapse, (ii) we observed normal numbers of membrane‐proximal synaptic vesicles in stimulated AP‐2μ‐deficient IHCs, suggesting that vesicle availability per se does not underlie the exocytic defect, and (iii) the increased contribution of the gamma process to the interspike interval statistics upon AP‐2μ disruption in IHCs is compatible with impaired AZ clearance. In agreement with this, pharmacological inhibition of clathrin function by Pitstop 2 impaired endocytosis but not exocytosis, at least up to 1 s of stimulation (Neef et al, 2014). Thus, the rapid onset of the exocytic defect in AP‐2μ‐deficient IHCs is highly unlikely to result from impaired synaptic vesicle regeneration, which, however, may limit release during sustained stimulation on longer time scales (Trapani et al, 2009).
Mechanistically, we speculate that AP‐2 binding to its cargo otoferlin in exocytosed membranes facilitates the lateral sequestration of “used” fusion machinery into a perisynaptic endocytic zone (Fig 9F) as recently indicated for conventional synapses (Hua et al, 2013), thereby making the release site available for a newly arriving vesicle. Support for a perisynaptic endocytic zone at ribbon synapses comes from super‐resolution imaging observations of a halo of endocytic proteins around rod photoreceptors ribbons (Wahl et al, 2013) and from confocal imaging of exocytosed Vglut‐1‐pHluorin in IHCs, which resides near the synaptic ribbon (Neef et al, 2014). Alternatively, one might envision that the interaction with AP‐2 might dissociate otoferlin from prior binding partners of the release site and thereby facilitate lateral clearance of otoferlin. We consider it likely that otoferlin, one of the few identified synaptic proteins of hair cells, interacts with other vesicular proteins and, hence, may contribute to the general lateral clearance of exocytosed material from the fusion zone. The sound‐coding phenotype described in the present study shows similarities to that of pachanga mice carrying a missense mutation in the Otof gene (Pangršič et al, 2010). However, deficiency of clathrin‐coated membranes and the impaired vesicle reformation upon disruption of AP‐2μ was not found in pachanga (Pangršič et al, 2010) and otoferlin knockout (Vogl et al, 2015) mice. This suggests that the AP‐2μ phenotype cannot be explained entirely by otoferlin missorting. Moreover, the auditory phenotype was much more dramatic in pachanga mice which lack ABR and display only residual sound‐driven spiking of SGNs. It is tempting to speculate that at least part of otoferlin's requirement in vesicle replenishment (Pangršič et al, 2010) relates to AP‐2/otoferlin‐facilitated AZ clearance. However, it is also possible that AP‐2 interacts with other exocytic proteins, and, conversely, other endocytic proteins might interact with otoferlin.
AP‐2μ is required for synaptic vesicle reformation following bulk endocytosis
Our results indicate that in IHCs AP‐2μ also serves a critical role for vesicle reformation from ELVs rather than from the plasma membrane, consistent with recent data in hippocampal neurons in culture (Kononenko et al, 2014). Of note, the stimulation used in our ultrastructural analysis (minutes) was very long relative to the stimuli used to monitor exocytosis (milliseconds). Hence, impaired synaptic vesicle reformation cannot explain the rapid onset of the exocytosis defect (20 ms) in AP‐2μ‐deficient IHCs. Moreover, the normal abundance of membrane‐proximal vesicles suggests that, despite the evidently impaired vesicle regeneration, the vesicle supply to the AZ was not limiting exocytosis in AP‐2μ‐deficient IHCs. However, efficient AP‐2‐dependent vesicle reformation following bulk endocytosis could be critical in IHCs during long stimulation, which then needs to balance massive exocytic membrane addition by fast compensatory membrane retrieval. Preserving the compositional identity of synaptic vesicles regenerated via slow AP‐2/otoferlin‐mediated sorting appears necessary here in order to provide a sufficient supply of vesicles. Indeed, impaired sensory coding at hair cell synapses was found when disrupting dynamin 1 (Boumil et al, 2010) and synaptojanin 1 (Trapani et al, 2009).
Implications for the development of gene replacement therapy
To our knowledge, deafness resulting from mutations in AP2M, the gene coding for AP‐2μ in humans, has not been described, which might point to the general importance of AP‐2μ for cellular function (Mitsunari et al, 2005). Nonetheless, our study adds to recent work on establishing AAV‐mediated gene transfer for future gene therapy of deafness (Akil et al, 2012; Askew et al, 2015). The extent of rescue at the molecular, cellular, and systems levels obtained by AAV‐mediated transgenic expression of AP‐2μ indicates that early postnatal gene replacement, indeed, can restore function in the complex inner ear to enable near‐normal hearing.
Materials and Methods
Animals
Transgenic mice expressing Cre under the Vglut3 promoter (Jung et al, 2015) were crossed with conditional knockout mice carrying two floxed alleles of the AP‐2μ gene Ap2m1 (Kononenko et al, 2014) to obtain hair cell‐specific AP‐2μ knockout mice. In most cases, a floxed GFP reporter (Nakamura et al, 2006) was employed to validate Cre activity (AP‐2μ fl/fl :Cre:GFP), but experiments of Figs 7 and 9C and E were performed on GFP‐negative mice (AP‐2μ fl/fl :Cre) to avoid confusion with immunofluorescence. AP‐2μ fl/fl :GFP, AP‐2μ fl/fl , AP‐2μ +/+ :Cre:GFP, or AP‐2μ +/+ :Cre (C57Bl/6 carrying one or both transgenes) were used as wild‐type control (AP‐2μ control). Mice were used at p 14–17 for patch clamp, immunohistochemistry, and electron and light microscopy, and at 3–8 weeks for systems physiology and immunohistochemistry. Postnatal AAV injection into scala tympani of the left ear via the round window was performed at p10 essentially as described in the study by Akil et al (2012) (see also Fig EV2 of the present study) using AAV2/1 and the CMV‐enhanced human β‐actin promoter (Reisinger et al, 2011) to drive transgenic expression of AP‐2μ‐IRES‐mRFP in IHCs (AAV was purchased from the Penn Vector Core, Philadelphia). All experiments were done in compliance with the national animal care guidelines and were approved by the board for animal welfare of the University Medical Center Goettingen and the animal welfare office of the state of Lower Saxony.
Immunostaining and confocal microscopy
The organs of Corti were fixed with 4% paraformaldehyde in phosphate‐buffered saline (15 min or 1 h). After incubation of whole mount preparations for 1 h in goat serum dilution buffer (16% normal goat serum, 450 mM NaCl, 0.6% Triton X‐100, 20 mM phosphate buffer, pH 7.4), primary antibodies were applied overnight at 4°C. The following antibodies were used: mouse anti‐AP2‐m1 (BD Biosciences, 1:200), mouse IgG1 anti‐CtBP2 (BD Biosciences, 1:200), rabbit anti‐GluA2/3 (Chemicon, 1:200), rabbit anti‐vGlut3 (Synaptic Systems, 1:200), mouse anti‐otoferlin (Abcam, 1:200), mouse anti‐calretinin (SWANT, 1:200), and phalloidin 633 (Invitrogen, 1:200). Secondary AlexaFluor‐labeled antibodies (Molecular Probes, 1:200) were applied for 4 h at room temperature or overnight at 4°C. Confocal images were collected using an SP5 microscope (Leica) and analyzed in IgorPro and ImageJ.
Auditory brainstem responses and otoacoustic emissions
For recordings of ABR (Auditory Brainstem Responses) and DPOAE (Distorsion Product Otoacoustic Emissions), mice were anesthetized with a combination of ketamine (125 mg/kg) and xylazine (2.5 mg/kg) i.p. The core temperature was maintained constant at 37°C using a heat blanket (Hugo Sachs Elektronik–Harvard Apparatus). For stimulus generation, presentation, and data acquisition, we used the TDT III System (Tucker Davis Technologies) run by custom‐written Matlab software (Mathworks). Tone bursts (4/6/8/12/16/24/32 kHz, 10 ms plateau, 1 ms cos2 rise/fall) or clicks of 0.03 ms were presented at 40 Hz (tone bursts) or 20 Hz (clicks) in the free field ipsilaterally using a JBL 2402 speaker. The difference potential between vertex and mastoid subdermal needles was amplified 50,000 times, filtered (400–4,000 Hz), and sampled at a rate of 50 kHz for 20 ms, 1,300 times, to obtain two mean ABR traces for each sound intensity. Hearing threshold was determined with 10 dB precision as the lowest stimulus intensity that evoked a reproducible response waveform in both traces by visual inspection by two independent observers. Tone burst thresholds exceeding the maximal loudspeaker output (100 dB SPL) were assigned a value of 110 dB. For rescue experiments, the left (injected) ear of AP‐2μ fl/fl :Cre:GFP was recorded first. We then plugged the left ear with electrode gel (Pauli‐Magnus et al, 2007) and small cellulose tissue stripes, achieving a conductive hearing impairment of 30–40 dB (Pauli‐Magnus et al, 2007 and data not shown), and recorded the right (non‐injected) ear.
For DPOAE, continuous primary tones (frequency f2 = 1.2*f1, intensity l2 = l1‐10 dB SPL) were delivered through the MF1 speaker system (Tucker Davis Technologies) and a custom‐made probe containing an MKE‐2 microphone (Sennheiser). The microphone signal was amplified (DMX 6Fire, Terratec), and the DPOAE amplitude at 2*f2‐f1 was analyzed by fast Fourier transformation using custom‐written Matlab software (Mathworks). Sound pressure levels (SPL) are provided in decibels SPL root mean square (RMS) (tonal stimuli) or decibels SPL peak equivalent (clicks).
Patch‐clamp recordings
The standard pipette solution contained (in mM) the following: 130 Cs‐gluconate, 10 TEA‐Cl, 10 4‐AP, 10 CsOH‐HEPES, 1 MgCl2, and 300 μg/ml amphotericin B, pH 7.2. The standard bath solution contained (in mM) the following: 105 NaCl, 35 TEA‐Cl, 2.8 KCl, 1 MgCl2, 10 NaOH‐HEPES, 11.3 D‐glucose, and 2 CaCl2 for Ca2+ current and exocytosis or 5 CaCl2 for endocytosis recordings, pH 7.2. EPC‐9 amplifiers (HEKA‐electronics), controlled by Pulse software, were used to sample and low‐pass filter currents at 20–40 kHz and at 2–5 kHz, respectively. We measured and analyzed membrane capacitance (Cm) as previously described (Neef et al, 2014). Briefly, cells were stimulated by depolarizations of different durations to −14 mV at intervals of 30–90 s. All currents were leak‐corrected using a P/n‐protocol. Exocytotic Cm increments were analyzed as the difference between Cm during 400 ms before and after depolarization, skipping the first 80 ms after the end of the depolarizing pulse. Analysis of the linear component of endocytosis following brief depolarizations (20 ms) was performed by fitting a linear function to the post‐depolarization Cm data, skipping the first 200 ms, and noting the point at which the line‐fit returned to baseline Cm. Recordings, in which the extrapolated line fit did not return to baseline within 80 s, were excluded from this analysis. We analyzed the exponential component of Cm decline following extended depolarization by fitting a linear function to the final 5 s of Cm data and subtracting the extrapolated fit. The residual was then fitted with an exponential function using a genetic curve fitting algorithm (Sanchez & Pareschi, 2001). In few cases, the fitting window for the linear component was slightly adjusted to exclude Cm artifacts. Recordings which could not be reliably fitted or which contained strong artifacts were discarded. All cells showed a pronounced, depolarization‐independent decrease of Cm during the recording, which was corrected for by fitting and subtracting an exponential function to the baseline Cm as recorded during the entire experiment.
Single auditory nerve fiber recordings
Single‐unit recordings were performed as described before (Frank et al, 2010; Jing et al, 2013). In short, mice were anesthetized by intraperitoneal injection of urethane (1.32 mg/kg), xylazine (5 mg/kg), and buprenorphine (0.1 mg/kg), tracheostomized, and placed in a stereotactic apparatus. After partial removal of the occipital bone and cerebellum, the internal auditory meatus was approached with a microelectrode passing through the posterior portion of the cochlear nucleus. Auditory nerve fibers were distinguished from cochlear nucleus neurons based on their stereotactic position (> 1.2 mm from the surface of the cochlear nucleus, electrode aiming at the internal auditory canal) and response characteristics (peristimulus time histogram [PSTH], regularity of firing, first spike latency).
Transmission electron microscopy, pre‐embedding immunogold labeling and electron tomography
For conventional embedding, organs of Corti were explanted and either fixed immediately on ice with 4% PFA and 0.5% glutaraldehyde in 1× PBS, pH 7.2, or stimulated for 15 min at room temperature with a solution containing 10 mM HEPES, 95 mM NaCl, 50 mM KCl, 5 mM CaCl2, 1 mM MgCl2 and fixed subsequently for 1 h in 4% PFA and 0.5% glutaraldehyde. Next, all samples were fixed with secondary fixative comprising 2% glutaraldehyde in 0.1 M sodium cacodylate buffer, pH 7.2, overnight on ice. Subsequently, samples were washed in sodium cacodylate buffer and post‐fixed on ice for 1 h with 1% osmium tetroxide (v/v in 0.1 M sodium cacodylate buffer), followed by three 5‐min washing steps in sodium cacodylate buffer and three brief washing steps in distilled water on ice. The samples were stained en bloc with 1% (w/v) uranyl acetate in distilled water for 1 h on ice. After a brief wash with distilled water, samples were dehydrated on ice in increasing ethanol concentrations, infiltrated in Epon resin (100% EtOH/Epon 1:1 (v/v), 30 and 90 min; 100% Epon, overnight), and polymerized for 48 h at 70°C. Following conventional embedding, samples were trimmed and 65–75 nm sections prepared with a Diatome 35° diamond knife using an Ultracut E (Leica Microsystems GmbH, Wetzlar, Germany) ultramicrotome. Sections were placed on formvar‐coated 1 × 2 mm copper slot grids and post‐stained with uranyl acetate/lead citrate following standard protocols. Micrographs were taken with a JEOL (JEOL, Eching, Germany) electron microscope (JEM 1011) equipped with a Gatan Orius 1200A camera (Gatan GmbH, Munich, Germany) at 12,000‐fold magnification using the Digital Micrograph software package.
Quantitative image analysis was performed as follows: Membrane‐proximal vesicles were quantified within a 20‐nm distance from the AZ membrane (membrane to membrane) and a 20‐nm distance to the presynaptic density of the ribbon synapse in random sections using the ImageJ software. Ribbon‐associated synaptic vesicles were counted in the first row around the ribbon at the distal and proximal half of the ribbon. The number of CCV/CCP, CCS, and EVLs were determined in an area of 1 μm around the ribbon per AZ and random section.
For electron tomography, 250 nm conventionally embedded sections were applied to formvar‐coated 100 copper mesh grids and post‐stained with 4% uranyl acetate and Reynold's lead citrate; subsequently, 10 nm gold particles were applied to both sides of the grid. Single tilt series were acquired at a JEOL JEM 2100 electron microscope (JEOL, Eching, Germany) at 200 kV from −58 to +58° with 1° increment using Serial EM software. The tomogram was generated with the IMOD package etomo, and the model was rendered using 3dmod (bio3d.colorado.edu/SerialEM/).
For immunogold pre‐embedding labeling on p14 wild‐type mice, organs of Corti were isolated and fixed in 4% PFA in PBS for 35 min on ice. For permeabilization, the samples were incubated in a 0.05% saponin/PBS solution for 45 min and after removing the solution subsequently blocked for 1 h at RT in 2% BSA, 3% normal horse serum (NHS) in PBS. The primary antibody (mouse anti‐otoferlin, Abcam 1:500) in PBS containing 5% NHS was incubated for 1 h at RT on a shaker and then overnight at 4°C. After three 30‐min washing steps in PBS, the secondary antibody (1:30 goat‐anti‐mouse nanogold, Nanoprobes) was applied and incubated for 2 h at RT. The samples were washed twice for 30 min at RT and overnight at 4°C in PBS. On the next day, the samples were post‐fixed in 2% glutaraldehyde in PBS for 30 min, washed for three times for 10 min in distilled water, and silver enhanced for 3 min using the Nanoprobes HQ silver enhancement kit. Samples were washed twice with distilled water for 10 min at RT followed by a 30‐min fixation in 2% OsO4 diluted in 0.1 M cacodylate buffer (pH 7.2) at RT. After three washing steps in distilled water, dehydration and infiltration were performed as described above.
STED microscopy of mCLING‐labeled membranes and image processing
mCLING labeling was performed at physiological temperature as described previously (Revelo et al, 2014). Briefly, organs of Corti were pre‐incubated for 2 min in a 1.7‐μM mCLING solution at resting conditions (Hanks' balanced salt solution [HBSS] without Ca2+). Thereafter, organs were stimulated for 1 min in a HBSS solution containing 65 mM KCl, 2 mM Ca2+ and mCLING (same concentration), fixed (4% PFA and 0.2% glutaraldehyde), immunostained, and embedded in melamine resin. Alternatively, organs were let to recover from stimulation for 5 min in HBSS with 2 mM Ca2+ before fixation. Immunostaining for Fig 7A and B was performed against RIBEYE (CtBP2, BD Biosciences, 1:100). Immunostaining for Fig 9C and E was performed against otoferlin (Abcam, 1:300) and RIBEYE (Synaptic Systems, 1:1,500). Otoferlin primary antibody was recognized by Chromeo494‐labeled secondary antibodies and RIBEYE primary antibodies by Cy2‐labeled secondary antibodies. Melamine blocks containing the treated organs of Corti were cut into thin sections (200 nm) and imaged in a Leica TCS SP5 STED microscope equipped with a 100×, 1.4 NA objective (Leica Microsystems GmbH, Wetzlar, Germany). Atto647N (part of mCLING's structure) and Chromeo 494 were excited with two pulsed diode lasers (PDL 800‐D, PicoQuant, Berlin, Germany) emitting at 640 nm and 531 nm, respectively. The STED beam was generated with a Ti:Sapphire laser (MaiTai, Spectra‐Physics, Darmstadt, Germany) tuned at 750 nm. Images presented in Figs 7 and 9C were deconvolved using Huygens Essential 4.4, from Scientific Volume Imaging (Hilversum, The Netherlands), with parameters adjusted to the above‐mentioned STED setup. Average pictures were obtained from non‐deconvolved STED images using a self‐written MatLab routine (The Mathworks Inc., Natick, MA, USA). 10 to 15 ROIs of 5 × 5 μm2 with center at a synaptic ribbon were stacked and rotated until finding maximum overlap (measured in an mCLING and an otoferlin immunostaining image from every ROI). Average mCLING fluorescence values of the aligned active zones were calculated to generate the final images displayed in Figs 7 and 9E.
Protein purification and binding assays
GST‐fusion proteins were purified using GST‐bind™ resin (Novagen) according to the manufacturer's instructions and remained bound to the resin. The C2ABC fragment of otoferlin‐containing amino acids 1–616 was cloned into the pPSG‐IBA33 vector using the IBA StarGate cloning system (IBA, Göttingen, Germany). The His‐tagged C2ABC protein was expressed in E. coli SoluBL21 cells (Genlantis, San Diego, USA). About 0.5 l of 2YT‐medium was inoculated and grown at 30°C until an OD600 value of 1.2 was reached. Before induction with IPTG (0.5 mM), 0.5 l of 4°C cold 2YT‐medium was added and the incubator temperature set to 16°C. The cells were harvested by centrifugation (15 min, 5,750 g) 16–20 h after induction. To purify the His‐tagged C2ABC protein, the cells were resuspended in lysis buffer (70 mM HEPES pH 7.4, 300 mM NaCl, 10 mM imidazol), lysed using a fluidizer (Microfluidics, Westwood, USA), and cell debris removed by centrifugation (45 min, 39,086 g). The supernatant was loaded on a Ni‐NTA column (GE Healthcare, Buckinghamshire, UK). After a washing step with four column volumes of lysis buffer, the protein was eluted using a linear imidazole gradient with a buffer containing 70 mM HEPES, pH 7.4, 300 mM NaCl, and 500 mM imidazole. The C2ABC protein was subsequently applied to a size‐exclusion chromatography column (S200 16/60, GE Healthcare) pre‐equilibrated in 10 mM HEPES, pH 7.4, and 300 mM NaCl. Fractions containing C2ABC were pooled and concentrated to 3 mg/ml, shock‐frozen in liquid nitrogen, and stored at −80°C for further experiments. All steps of the purification procedure were performed at a temperature of 4°C.
For pull‐down experiments, we incubated 300 nM GST‐fusion proteins on GST‐bind™ resin with 225 nM His‐otoferlin C2ABC in 20 mM HEPES pH 7.4, 100 mM NaCl, 2 mM MgCl2, and 1% Triton X‐100 for 1 h at 4°C under gentle agitation. For peptide competition experiments, GST‐fusion proteins on GST‐bind™ resin were pre‐incubated with 500 μM peptide (LL: RM‐pS‐QIKRLLSE; Y: DYQRLN) before the addition of His‐otoferlin C2ABC. Beads were then washed extensively and eluted with sample buffer. Samples were analyzed by SDS–PAGE and immunoblotting. For statistical evaluation of the peptide competition, experiment data from each experiment were normalized to the mean of this experimental group before performing an unpaired t‐test of the no peptide condition versus the LL peptide condition (P < 0.01, n = 4 independent experiments).
For immunoprecipitation experiments, we transfected HEK293 cells with expression plasmids encoding untagged otoferlin and HA‐tagged AP‐2μ using jetprime according to the manufacturer's instructions. Twenty‐four hours post‐transfection cells were lysed in 20 mM HEPES, pH 7.4, 100 mM KCl, 2 mM MgCl2, 1% Triton X‐100, 1 mM PMSF, and 1:200 mammalian protease inhibitor cocktail (Sigma‐Aldrich). Cell extracts were cleared by ultracentrifugation. Mouse anti‐otoferlin antibodies (Abcam) and control antibodies were immobilized on protein A/G agarose beads (Santa Cruz) and incubated with cleared cell extracts (protein concentration: 0.3–0.4 mg/ml) for 4 h at 4°C under gentle agitation. Beads were washed extensively and eluted with sample buffer. Samples were analyzed by SDS–PAGE and immunoblotting.
Data analysis
Data were analyzed using Igor Pro software (Wavemetrics), Matlab (Mathworks), ImageJ, IMOD package etomo, 3dmod (bio3d.colorado.edu/imod/;), and Huygens Essential 4.4 (Scientific Volume Imaging). Means were expressed ± SEM and compared if not otherwise indicated using two‐tailed Student's t‐tests for normally distributed data of equal variance or else by Mann–Whitney rank‐sum test, with *, **, and *** indicating P < 0.05, 0.01, and 0.001, respectively.
Author contributions
SJ, CW, TMo, TMa, VH, and NS conceived the study. SJ performed mouse breeding, AAV injections, immunohistochemistry, confocal microscopy, and patch‐clamp recordings. TMa contributed mutant mice, purified AP‐2 subunits, reconstituted AP‐2 complexes with help of HB, and performed protein interaction studies. CW performed electron microscopy and tomography and supervised HA‐M who did immuno‐electron microscopy. ZJ performed and analyzed extracellular recordings supervised by NS, who also analyzed systems physiology data. AN and ZJ performed biophysical modeling. SM purified otoferlin fragments, co‐supervised by RF and ER. SMW generated mutant mice. IP performed RT–PCR. PS provided AP‐1σ mutant mice. NHR and SOR performed STED microscopy. JN analyzed data. All authors analyzed data and contributed to the preparation of the manuscript.
Conflict of interest
The authors declare that they have no conflict of interest.
Supporting information
Appendix
Expanded View Figures PDF
Review Process File
Acknowledgements
We thank D. Owen for AP‐2 expression plasmids and N. Herrmann, S. Gerke, C. Senger‐Freitag, and C. Schmidt for expert technical assistance. We would like to thank Rebecca Seal, David Chi, and Kristen Fantetti (University of Pennsylvania at Pittsburg) for instructing S.J. on the postnatal virus injection. This work was supported by grants of the German Research Foundation through the Collaborative Research Centers 889 (A4 to E.R. and R.F., A5 to T.Mo. and S.O.R., A6 to N.S., and A7 to C.W.), 958 (project A01 to T.Ma. and V.H.), the Cluster of Excellence NeuroCure (Exc‐257, to V.H.), and the Center for Nanoscale Microscopy and Molecular Physiology of the Brain (to T.Mo. and S.O.R.).
The EMBO Journal (2015) 34: 2686–2702
References
- Akil O, Seal RP, Burke K, Wang C, Alemi A, During M, Edwards RH, Lustig LR (2012) Restoration of hearing in the VGLUT3 knockout mouse using virally mediated gene therapy. Neuron 75: 283–293 [DOI] [PMC free article] [PubMed] [Google Scholar]
- Andor‐Ardo D, Hudspeth AJ, Magnasco MO, Piro O (2010) Modeling the resonant release of synaptic transmitter by hair cells as an example of biological oscillators with cooperative steps. Proc Natl Acad Sci USA 107: 2019–2024 [DOI] [PMC free article] [PubMed] [Google Scholar]
- Askew C, Rochat C, Pan B, Asai Y, Ahmed H, Child E, Schneider BL, Aebischer P, Holt JR (2015) Tmc gene therapy restores auditory function in deaf mice. Sci Transl Med 7: 295ra108 [DOI] [PMC free article] [PubMed] [Google Scholar]
- Boumil RM, Letts VA, Roberts MC, Lenz C, Mahaffey CL, Zhang Z, Moser T, Frankel WN (2010) A missense mutation in a highly conserved alternate exon of dynamin‐1 causes epilepsy in fitful mice. PLoS Genet 6: e1001046 [DOI] [PMC free article] [PubMed] [Google Scholar]
- Buran BN, Strenzke N, Neef A, Gundelfinger ED, Moser T, Liberman MC (2010) Onset coding is degraded in auditory nerve fibers from mutant mice lacking synaptic ribbons. J Neurosci Off J Soc Neurosci 30: 7587–7597 [DOI] [PMC free article] [PubMed] [Google Scholar]
- Duncker SV, Franz C, Kuhn S, Schulte U, Campanelli D, Brandt N, Hirt B, Fakler B, Blin N, Ruth P, Engel J, Marcotti W, Zimmer U, Knipper M (2013) Otoferlin couples to clathrin‐mediated endocytosis in mature cochlear inner hair cells. J Neurosci 33: 9508–9519 [DOI] [PMC free article] [PubMed] [Google Scholar]
- Frank T, Rutherford MA, Strenzke N, Neef A, Pangršič T, Khimich D, Fejtova A, Gundelfinger ED, Liberman MC, Harke B, Bryan KE, Lee A, Egner A, Riedel D, Moser T (2010) Bassoon and the synaptic ribbon organize Ca2+ channels and vesicles to add release sites and promote refilling. Neuron 68: 724–738 [DOI] [PMC free article] [PubMed] [Google Scholar]
- Gaidarov I, Keen JH (1999) Phosphoinositide–Ap‐2 interactions required for targeting to plasma membrane clathrin‐coated pits. J Cell Biol 146: 755–764 [DOI] [PMC free article] [PubMed] [Google Scholar]
- Glyvuk N, Tsytsyura Y, Geumann C, D?Hooge R, Hüve J, Kratzke M, Baltes J, Boening D, Klingauf J, Schu P (2010) AP‐1/sigma1B‐adaptin mediates endosomal synaptic vesicle recycling, learning and memory. EMBO J 29: 1318‐1330 [DOI] [PMC free article] [PubMed] [Google Scholar]
- Goutman JD, Glowatzki E (2007) Time course and calcium dependence of transmitter release at a single ribbon synapse. Proc Natl Acad Sci USA 104: 16341–16346 [DOI] [PMC free article] [PubMed] [Google Scholar]
- Harris DM, Dallos P (1979) Forward masking of auditory nerve fiber responses. J Neurophysiol 42: 1083–1107 [DOI] [PubMed] [Google Scholar]
- Haucke V, Wenk MR, Chapman ER, Farsad K, De Camilli P (2000) Dual interaction of synaptotagmin with mu2‐ and alpha‐adaptin facilitates clathrin‐coated pit nucleation. EMBO J 19: 6011–6019 [DOI] [PMC free article] [PubMed] [Google Scholar]
- Haucke V, Neher E, Sigrist SJ (2011) Protein scaffolds in the coupling of synaptic exocytosis and endocytosis. Nat Rev Neurosci 12: 127–138 [DOI] [PubMed] [Google Scholar]
- Heil P, Neubauer H, Irvine DR, Brown M (2007) Spontaneous activity of auditory‐nerve fibers: insights into stochastic processes at ribbon synapses. J Neurosci 27: 8457 [DOI] [PMC free article] [PubMed] [Google Scholar]
- Hosoi N, Holt M, Sakaba T (2009) Calcium dependence of exo‐ and endocytotic coupling at a glutamatergic synapse. Neuron 63: 216–229 [DOI] [PubMed] [Google Scholar]
- Hua Y, Woehler A, Kahms M, Haucke V, Neher E, Klingauf J (2013) Blocking endocytosis enhances short‐term synaptic depression under conditions of normal availability of vesicles. Neuron 80: 343–349 [DOI] [PubMed] [Google Scholar]
- Jing Z, Rutherford MA, Takago H, Frank T, Fejtova A, Khimich D, Moser T, Strenzke N (2013) Disruption of the presynaptic cytomatrix protein bassoon degrades ribbon anchorage, multiquantal release, and sound encoding at the hair cell afferent synapse. J Neurosci 33: 4456–4467 [DOI] [PMC free article] [PubMed] [Google Scholar]
- Jung S, Oshima‐Takago T, Chakrabarti R, Wong AB, Jing Z, Yamanbaeva G, Picher MM, Wojcik SM, Göttfert F, Predoehl F, Michel K, Hell SW, Schoch S, Strenzke N, Wichmann C, Moser T (2015) Rab3‐interacting molecules 2α and 2β promote the abundance of voltage‐gated Ca V 1.3 Ca2+ channels at hair cell active zones. Proc Natl Acad Sci USA 112: E3141–E3149 [DOI] [PMC free article] [PubMed] [Google Scholar]
- Khimich D, Nouvian R, Pujol R, tom Dieck S, Egner A, Gundelfinger ED, Moser T (2005) Hair cell synaptic ribbons are essential for synchronous auditory signalling. Nature 434: 889–894 [DOI] [PubMed] [Google Scholar]
- Kononenko NL, Puchkov D, Classen GA, Walter AM, Pechstein A, Sawade L, Kaempf N, Trimbuch T, Lorenz D, Rosenmund C, Maritzen T, Haucke V (2014) Clathrin/AP‐2 mediate synaptic vesicle reformation from endosome‐like vacuoles but are not essential for membrane retrieval at central synapses. Neuron 82: 981–988 [DOI] [PubMed] [Google Scholar]
- Lenzi D, Crum J, Ellisman MH, Roberts WM (2002) Depolarization redistributes synaptic membrane and creates a gradient of vesicles on the synaptic body at a ribbon synapse. Neuron 36: 649–659 [DOI] [PubMed] [Google Scholar]
- Li J, Young ED (1993) Discharge‐rate dependence of refractory behavior of cat auditory‐nerve fibers. Hear Res 69: 151–162 [DOI] [PubMed] [Google Scholar]
- Lock M, Greenberg ME, Iafrate AJ, Swigut T, Muench J, Kirchhoff F, Shohdy N, Skowronski J (1999) Two elements target SIV Nef to the AP‐2 clathrin adaptor complex, but only one is required for the induction of CD4 endocytosis. EMBO J 18: 2722–2733 [DOI] [PMC free article] [PubMed] [Google Scholar]
- Matthews G, Fuchs P (2010) The diverse roles of ribbon synapses in sensory neurotransmission. Nat Rev Neurosci 11: 812–822 [DOI] [PMC free article] [PubMed] [Google Scholar]
- McMahon HT, Boucrot E (2011) Molecular mechanism and physiological functions of clathrin‐mediated endocytosis. Nat Rev Mol Cell Biol 12: 517–533 [DOI] [PubMed] [Google Scholar]
- Mitsunari T, Nakatsu F, Shioda N, Love PE, Grinberg A, Bonifacino JS, Ohno H (2005) Clathrin adaptor AP‐2 is essential for early embryonal development. Mol Cell Biol 25: 9318–9323 [DOI] [PMC free article] [PubMed] [Google Scholar]
- Moser T, Beutner D (2000) Kinetics of exocytosis and endocytosis at the cochlear inner hair cell afferent synapse of the mouse. Proc Natl Acad Sci USA 97: 883–888 [DOI] [PMC free article] [PubMed] [Google Scholar]
- Moser T, Predoehl F, Starr A (2013) Review of hair cell synapse defects in sensorineural hearing impairment. Otol Neurotol Off Publ Am Otol Soc Am Neurotol Soc Eur Acad Otol Neurotol 34: 995–1004 [DOI] [PubMed] [Google Scholar]
- Nakamura T, Colbert MC, Robbins J (2006) Neural crest cells retain multipotential characteristics in the developing valves and label the cardiac conduction system. Circ Res 98: 1547–1554 [DOI] [PubMed] [Google Scholar]
- Neef J, Jung S, Wong AB, Reuter K, Pangrsic T, Chakrabarti R, Kugler S, Lenz C, Nouvian R, Boumil RM, Frankel WN, Wichmann C, Moser T (2014) Modes and regulation of endocytic membrane retrieval in mouse auditory hair cells. J Neurosci 34: 705–716 [DOI] [PMC free article] [PubMed] [Google Scholar]
- Pangršič T, Lasarow L, Reuter K, Takago H, Schwander M, Riedel D, Frank T, Tarantino LM, Bailey JS, Strenzke N, Brose N, Müller U, Reisinger E, Moser T (2010) Hearing requires otoferlin‐dependent efficient replenishment of synaptic vesicles in hair cells. Nat Neurosci 13: 869–876 [DOI] [PubMed] [Google Scholar]
- Pangršič T, Reisinger E, Moser T (2012) Otoferlin: a multi‐C2 domain protein essential for hearing. Trends Neurosci 35: 671–680 [DOI] [PubMed] [Google Scholar]
- Pauli‐Magnus D, Hoch G, Strenzke N, Anderson S, Jentsch TJ, Moser T (2007) Detection and differentiation of sensorineural hearing loss in mice using auditory steady‐state responses and transient auditory brainstem responses. Neuroscience 149: 673–684 [DOI] [PubMed] [Google Scholar]
- Peterson AJ, Irvine DRF, Heil P (2014) A model of synaptic vesicle‐pool depletion and replenishment can account for the interspike interval distributions and nonrenewal properties of spontaneous spike trains of auditory‐nerve fibers. J Neurosci Off J Soc Neurosci 34: 15097–15109 [DOI] [PMC free article] [PubMed] [Google Scholar]
- Reisinger E, Bresee C, Neef J, Nair R, Reuter K, Bulankina A, Nouvian R, Koch M, Bückers J, Kastrup L, Roux I, Petit C, Hell SW, Brose N, Rhee J‐S, Kügler S, Brigande JV, Moser T (2011) Probing the functional equivalence of otoferlin and synaptotagmin 1 in exocytosis. J Neurosci Off J Soc Neurosci 31: 4886–4895 [DOI] [PMC free article] [PubMed] [Google Scholar]
- Revelo NH, Kamin D, Truckenbrodt S, Wong AB, Reuter‐Jessen K, Reisinger E, Moser T, Rizzoli SO (2014) A new probe for super‐resolution imaging of membranes elucidates trafficking pathways. J Cell Biol 205: 591–606 [DOI] [PMC free article] [PubMed] [Google Scholar]
- Rolfsen RM, Erway LC (1984) Trace metals and otolith defects in mocha mice. J Hered 75: 159–162 [PubMed] [Google Scholar]
- Roux I, Safieddine S, Nouvian R, Grati M, Simmler M‐C, Bahloul A, Perfettini I, Le Gall M, Rostaing P, Hamard G, Triller A, Avan P, Moser T, Petit C (2006) Otoferlin, defective in a human deafness form, is essential for exocytosis at the auditory ribbon synapse. Cell 127: 277–289 [DOI] [PubMed] [Google Scholar]
- Ruel J, Emery S, Nouvian R, Bersot T, Amilhon B, Van Rybroek JM, Rebillard G, Lenoir M, Eybalin M, Delprat B, Sivakumaran TA, Giros B, El Mestikawy S, Moser T, Smith RJH, Lesperance MM, Puel J‐L (2008) Impairment of SLC17A8 encoding vesicular glutamate transporter‐3, VGLUT3, underlies nonsyndromic deafness DFNA25 and inner hair cell dysfunction in null mice. Am J Hum Genet 83: 278–292 [DOI] [PMC free article] [PubMed] [Google Scholar]
- Safieddine S, El‐Amraoui A, Petit C (2012) The auditory hair cell ribbon synapse: from assembly to function. Annu Rev Neurosci 35: 509–528 [DOI] [PubMed] [Google Scholar]
- Sakaba T, Kononenko NL, Bacetic J, Pechstein A, Schmoranzer J, Yao L, Barth H, Shupliakov O, Kobler O, Aktories K, Haucke V (2013) Fast neurotransmitter release regulated by the endocytic scaffold intersectin. Proc Natl Acad Sci USA 110: 8266–8271 [DOI] [PMC free article] [PubMed] [Google Scholar]
- Sanchez del Rio M, Pareschi G (2001) Global optimization and reflectivity data fitting for x‐ray multilayer mirrors by means of genetic algorithms. SPIE Proc 4145: 88–96 [Google Scholar]
- Seal RP, Akil O, Yi E, Weber CM, Grant L, Yoo J, Clause A, Kandler K, Noebels JL, Glowatzki E, Lustig LR, Edwards RH (2008) Sensorineural deafness and seizures in mice lacking vesicular glutamate transporter 3. Neuron 57: 263–275 [DOI] [PMC free article] [PubMed] [Google Scholar]
- Trapani JG, Obholzer N, Mo W, Brockerhoff SE, Nicolson T (2009) Synaptojanin1 is required for temporal fidelity of synaptic transmission in hair cells. PLoS Genet 5: e1000480 [DOI] [PMC free article] [PubMed] [Google Scholar]
- Varga R, Avenarius MR, Kelley PM, Keats BJ, Berlin CI, Hood LJ, Morlet TG, Brashears SM, Starr A, Cohn ES, Smith RJH, Kimberling WJ (2006) OTOF mutations revealed by genetic analysis of hearing loss families including a potential temperature sensitive auditory neuropathy allele. J Med Genet 43: 576–581 [DOI] [PMC free article] [PubMed] [Google Scholar]
- Vogl C, Cooper BH, Neef J, Wojcik SM, Reim K, Reisinger E, Brose N, Rhee J‐S, Moser T, Wichmann C (2015) Unconventional molecular regulation of synaptic vesicle replenishment in cochlear inner hair cells. J Cell Sci 128: 638–644 [DOI] [PubMed] [Google Scholar]
- Wahl S, Katiyar R, Schmitz F (2013) A local, periactive zone endocytic machinery at photoreceptor synapses in close vicinity to synaptic ribbons. J Neurosci 33: 10278–10300 [DOI] [PMC free article] [PubMed] [Google Scholar]
- Wittig JH Jr, Parsons TD (2008) Synaptic ribbon enables temporal precision of hair cell afferent synapse by increasing the number of readily releasable vesicles: a modeling study. J Neurophysiol 100: 1724–1739 [DOI] [PMC free article] [PubMed] [Google Scholar]
- Wu Y, O'Toole ET, Girard M, Ritter B, Messa M, Liu X, McPherson PS, Ferguson SM, De Camilli P (2014) A dynamin 1‐, dynamin 3‐ and clathrin‐independent pathway of synaptic vesicle recycling mediated by bulk endocytosis. eLife 3: e01621 [DOI] [PMC free article] [PubMed] [Google Scholar]
- Xu J, Luo F, Zhang Z, Xue L, Wu X‐S, Chiang H‐C, Shin W, Wu L‐G (2013) SNARE proteins synaptobrevin, SNAP‐25, and syntaxin are involved in rapid and slow endocytosis at synapses. Cell Rep 3: 1414–1421 [DOI] [PMC free article] [PubMed] [Google Scholar]
- Yasunaga S, Grati M, Cohen‐Salmon M, El‐Amraoui A, Mustapha M, Salem N, El‐Zir E, Loiselet J, Petit C (1999) A mutation in OTOF, encoding otoferlin, a FER‐1‐like protein, causes DFNB9, a nonsyndromic form of deafness. Nat Genet 21: 363–369 [DOI] [PubMed] [Google Scholar]
- Zhang JZ, Davletov BA, Südhof TC, Anderson RG (1994) Synaptotagmin I is a high affinity receptor for clathrin AP‐2: implications for membrane recycling. Cell 78: 751–760 [DOI] [PubMed] [Google Scholar]
Associated Data
This section collects any data citations, data availability statements, or supplementary materials included in this article.
Supplementary Materials
Appendix
Expanded View Figures PDF
Review Process File