

Abstract
It has been suggested that osteoporosis and coronary artery disease (CAD) have overlapping pathophysiological mechanisms and related risk factors. The aim of this study was to investigate the association between several traditional cardiovascular risk factors and measures of bone mineral density (BMD) in postmenopausal women with and without clinically significant CAD defined angiographically. A case–control study was undertaken of 180 postmenopausal women (aged between 48 and 88 years) who were recruited from King Abdulaziz University Hospital, Saudi Arabia. Study subjects underwent dual-energy x-ray absorptiometry and coronary angiography. The presence of hypertension, diabetes, dyslipidemia, obesity, smoking and physical activity was identified from clinical examination and history. Demographic, anthropometric and biochemical characteristics were measured. Univariate and multivariate analyses were employed to explore the relationships between cardiovascular risk factors, including BMD, and the presence of CAD. CAD patients were more likely to have a lower BMD and T-score at the femoral neck than those without CAD (P<0.05). Significant differences were found between the groups for fasting lipid profile, fasting blood glucose and anthropometric measures (P<0.05). Conditional logistic regression showed that 3 risk factors were significantly related with the presence of CAD: high-density lipoprotein-cholesterol (odds ratio, OR: 0.226, 95% confidence interval, CI: 0.062–0.826), fasting plasma glucose (OR: 1.154, 95% CI: 1.042–1.278) and femoral neck T-score (OR: 0.545, 95% CI: 0.374–0.794). This study suggests an association of low BMD and elevated CAD risk. Nevertheless, additional longitudinal studies are needed to determine the temporal sequence of this association.
Introduction
Coronary artery disease (CAD) is one of the leading causes of death globally and is projected to remain so in the future.1 Osteoporosis and CAD appear to have overlapping pathophysiological mechanisms and risk factors, including advancing age and inflammation.2 Estrogen deficiency in the postmenopausal period is a risk factor for both CAD and osteoporosis.3 In women, additional risk factors exist, such as the use of contraceptives.4 Estrogen promotes fat accumulation in the gluteal-femoral region,5 whereas estrogen deficiency appears to have a role in increasing centrally deposited fat in postmenopausal women.6 Several prospective studies have suggested that, as women enter the menopause, there is a marked increase in the risk of CAD, including a greater likelihood of myocardial infarction and all-cause mortality.7,8 Unsurprisingly, in the light of these research results, there have been recommendations regarding lifestyle change as a means of primary prevention of CAD in postmenopausal women.9
The aim of this study was to investigate the association between traditional cardiovascular risk factors and measures of bone mineral density (BMD) in postmenopausal women with and without clinically significant CAD, defined angiographically.
Results
Demographic characteristics of the study population
On the basis of angiographic data, postmenopausal women were categorized into 2 groups: those who had clinically significant CAD (⩾50% luminal stenosis in a major coronary artery) and those who had no discernible clinically significant focal narrowing. They were matched for age.
There were no significant differences between the groups in terms of demographic characteristics (Table 1), except for educational attainment (P<0.05).
Table 1. Demographic characteristics of the study population.
| Postmenopausal women without CAD (n=90) | Postmenopausal women with CAD (n=90) | P-value | |
|---|---|---|---|
| Age (years) | 62.4±7.7 | 63.8±8.59 | NS |
| Age at menopausal (years) | 51.3±5.3 | 50.3±3.4 | NS |
| Marital status | |||
| Single | 1 (1) | 0 (0) | <0.05 |
| Married | 52 (58) | 40 (44) | |
| Widowed | 33 (37) | 47 (52) | |
| Divorced | 4 (4) | 3 (3) | |
| Parity | |||
| 0 | 5 (6) | 2 (2) | NS |
| 1 | 1 (1) | 0 (0) | |
| 2 | 2 (2) | 2 (2) | |
| 3 | 4 (4) | 4 (4) | |
| ⩾4 | 78 (87) | 82 (91) | |
| Education level | |||
| Illiterate | 48 (53) | 61 (68) | <0.05 |
| Intermediate | 24 (27) | 21 (23) | |
| High school | 11 (12) | 5 (6) | |
| University | 7 (8) | 3 (3) | |
| Occupation | |||
| House wife | 87 (97) | 87 (97) | NS |
| Administrative | 1 (1) | 3 (3) | |
| Director/physician | 2 (2) | 0 (0) | |
| Type of residency | |||
| Traditional housing | 27 (30) | 20 (22) | NS |
| Apartment | 54 (60) | 64 (71) | |
| Villa | 9 (10) | 6 (7) | |
| Physical activity | |||
| <1 time | 53 (59) | 54 (60) | NS |
| 1–2 times | 11 (12) | 11 (12) | |
| >3 times | 26 (29) | 25 (28) | |
| Smoking status | |||
| Non-smoker | 83 (92) | 84 (93) | NS |
| Former smoker | 4 (5) | 3 (3) | |
| Current smoker | 3 (3) | 3 (3) | |
Abbreviations: CAD, coronary artery disease; NS: not significant.
Data are given as the mean±s.d. or as the number of subjects with percentages given in parentheses, as appropriate. Categorical data are compared by the χ2-test; continuous variables are compared by the unpaired t-test.
Classic cardiovascular risk factors in the study population
CAD patients were more likely to have a fasting plasma glucose (FPG) ⩾7 mmol l−1 than their control counterparts (51% vs 30%, P<0.05), and conversely more postmenopausal women without CAD had high-density lipoprotein-cholesterol (HDL-C) >1.04 mmol l−1 than women with CAD (14% vs 30%, P<0.05). On univariate analysis, significant differences were found between the two groups for total cholesterol (TC), HDL-C, low-density lipoprotein-cholesterol (LDL-C) and FBG (P<0.05). In addition, anthropometric measurements among those who had CAD with respect to height, weight, hip circumference (HC) and waist–hip ratio (WHR) were significantly higher than those of subjects without CAD (P<0.05). Obesity was highly prevalent among the study population by all anthropometric measures (Table 2).
Table 2. Classic cardiovascular risk factors in the study population.
| Postmenopausal women without CAD (n=90) | Postmenopausal women with CAD (n=90) | P-value | |
|---|---|---|---|
| TC (mmol l−1) | 4.79±0.92 | 4.50±0.99 | <0.01 |
| TC⩾5.2 mmol l−1 | 30 (33) | 24 (27) | NS |
| TG (mmol l−1) | 1.57 (1.1–2.1) | 1.67 (1.3–2.7) | NS |
| TG⩾1.7 mmol l−1 | 36 (40) | 43 (48) | NS |
| HDL-C (mmol l−1) | 1.36±0.33 | 1.25±0.29 | <0.05 |
| HDL-C<1.04 mmol l−1 | 13 (14) | 27 (30) | <0.05 |
| LDL-C (mmol l−1) | 2.59±0.79 | 2.35±0.80 | <0.01 |
| LDL-C⩾3.36 mmol l−1 | 14 (16) | 12 (13) | NS |
| AI= (TC/HDL-C) | 3.73±1.16 | 3.74±0.99 | NS |
| FPG (mmol l−1) | 6.83±3.31 | 8.64±4.25 | <0.01 |
| FPG⩾7 mmol l−1 | 27 (30) | 46 (51) | <0.05 |
| Serum insulin (μU ml−1) | 13.49±0.94 | 16.32±1.35 | NS |
| Serum creatinine (μmol l−1) | 67.6±1.99 | 77.2±4.0 | NS |
| eGFR (ml min−1 1.73 m−2) | 86.9±2.2 | 85.1±4.5 | NS |
| Body weight (kg) | 78.58±15.59 | 72.75±14.36 | <0.01 |
| Body height (cm) | 153.71±5.94 | 151.04±6.86 | <0.01 |
| BMI (kg m−2) | 33.19±5.91 | 31.82±5.47 | NS |
| BMI classes | |||
| Normal (18.5–24.99 kg m−2) | 3 (3) | 4 (4) | |
| Overweight (25–29.99 kg m−2) | 26 (29) | 37 (41) | |
| Obese (⩾30 kg m−2) | 61 (68) | 49 (54) | NS |
| WC (cm) | 99.61±11.21 | 100.6±14.84 | NS |
| Obese >88 cm | 77 (86) | 78 (87) | NS |
| HC (cm) | 108.97±11.01 | 105.88±14.49 | <0.05 |
| WHR | 0.92±0.08 | 0.96±0.14 | <0.01 |
| Obese⩾0.80 | 83 (92) | 87 (97) | NS |
| SBP (mm Hg) | 139.21±21.79 | 143.56±23.14 | NS |
| SBP⩾140 mm Hg | 48 (53) | 54 (60) | NS |
| DBP (mm Hg) | 78.06±11.81 | 76.14±12.46 | NS |
| DBP⩾90 mm Hg | 13 (14) | 16 (18) | NS |
Abbreviations: AI, atherogenic index; BMI, body mass index; DBP, diastolic blood pressure; FPG, fasting plasma glucose; HC, hip circumference; HDL-C, high density lipoprotein-cholesterol; LDL-C, low density lipoprotein-cholesterol; NS, not significant; SBP, systolic blood pressure; TC, total cholesterol; TG, triglycerides; WC, waist circumference; WHR, waist-to-hip ratio.
Data are given as the mean±s.d. Continuous variables are compared by the unpaired t-test.
BMD in the study population
Patients who had clinically significant CAD (⩾50% stenosis) were also more likely to have a low BMD (Table 3). Dual-energy X-ray absorptiometry (DXA) data showed significant differences in BMD and T-scores for the femoral neck (P<0.01) between those who had CAD and those who did not. The prevalence of osteopenia in the lumbar spine region was 29 and 39% (P <0.05) in the subjects without CAD and those with CAD, respectively. In postmenopausal women without and with CAD, the prevalence of osteopenia at the femur neck region was 34 and 42%, respectively (P <0.05).
Table 3. Bone mineral density in the study population.
| Postmenopausal women without CAD (n=90) | Postmenopausal women with CAD (n=90) | P-value | |
|---|---|---|---|
| BMD lumbar spine L1–L4 (g cm−2) | 1.02±0.17 | 0.983±0.16 | NS |
| Lumbar spine L1–L4 T-score | −0.659±1.43 | −1.01 ±1.37 | NS |
| Normal | 58 (64) | 44 (49) | <0.05 |
| Osteopenia | 26 (29) | 35 (39) | |
| Osteoporosis | 6 (7) | 11 (12) | |
| BMD femur neck (g cm−2) | 0.841±0.13 | 0.788±0.13 | <0.01 |
| Femur neck T-score | −0.739±1.08 | −1.182±1.04 | <0.01 |
| Normal | 55 (61) | 40 (44) | <0.05 |
| Osteopenia | 31 (34) | 38 (42) | |
| Osteoporosis | 4 (4) | 10 (11) | |
| BMD total hip (g cm−2) | 0.875±0.14 | 0.837±0.14 | NS |
| Total hip T-score | −0.536±1.19 | −0.859±1.2 | NS |
| Normal | 57 (63) | 46 (51) | NS |
| Osteopenia | 29 (32) | 35 (39) | |
| Osteoporosis | 4 (4) | 7 (8) |
Abbreviations: BMD, bone mineral density; CAD, coronary artery disease; NS, not significant; WHO, World Health Organization.
Data are given as the mean±s.d. or as the number of subjects with percentages given in parentheses, as appropriate. Categorical data are compared by the χ2-test; continuous variables are compared by the unpaired t-test. WHO criteria, a T-score between −1 and −2.5 is indicative of osteopenia, while a T-score of −2.5 and below reflects osteoporosis; a T-score of −1 and above is considered normal.
When the study population was subcategorized according to the number of occluded coronary blood vessels (Figure 1), prevalence rates of osteopenia and osteoporosis (as documented by DXA scan) in the three skeletal sites were comparable with respect to distribution, except for a greater prevalence of osteoporosis in the single vessel disease/double vessel disease group at lumbar spine region (14%) versus femoral neck and total hip regions (2 and 5%, respectively).
Figure 1.
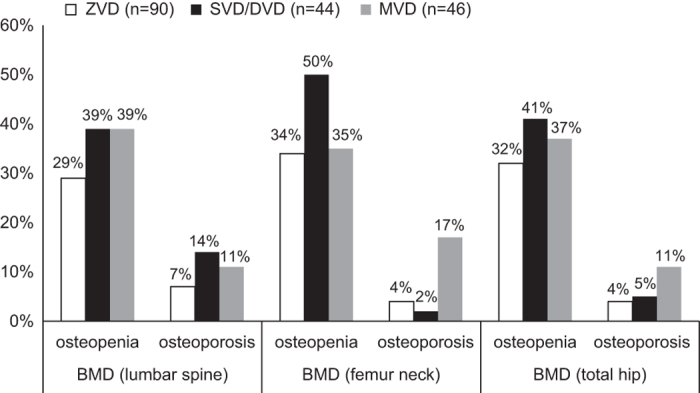
Prevalence of osteopenia and osteoporosis in relation to BMD values at the three skeletal sites among the study population categorized by degree of coronary heart disease using the number of occluded coronary blood vessels. MVD, multivessel disease; SVD/DVD, single vessel disease/double vessel disease, ZVD, zero vessel disease.
Relationship between BMD and classical cardiovascular risk factors in the study population
(Table 4) shows a summary of correlations of BMD with cardiovascular risk factors in the 180 women. Only age was significantly correlated (inversely) with lumbar spine BMD, femoral neck BMD and total hip BMD, whereas positive correlations were reported with weight, height, body mass index (BMI), WC and HC for BMD measures in three skeletal sites. Furthermore, the atherogenic index (AI) (TC/HDL-C) was positively correlated with both femoral neck BMD and total hip BMD, whereas WHR was negatively correlated with femoral neck BMD only. FPG and triglyceride (TG) were positively associated with total hip BMD, and serum insulin was positively associated with both lumbar spine and total hip BMD. Diastolic blood pressure was associated with femoral neck BMD.
Table 4. Correlation between bone mineral density and classical cardiovascular risk factors in the study population.
|
Lumbar spine |
Femur neck |
Total hip |
||||
|---|---|---|---|---|---|---|
| r | P-value | r | P-value | r | P-value | |
| Age | −0.295 | <0.0001 | −0.417 | <0.0001 | −0.453 | <0.0001 |
| Menopausal age | 0.056 | 0.577 | 0.054 | 0.475 | 0.123 | 0.101 |
| Smoking status | 0.033 | 0.660 | 0.083 | 0.270 | −0.094 | 0.212 |
| Physical activity level | 0.094 | 0.211 | 0.112 | 0.138 | −0.087 | 0.249 |
| Parity | −0.221 | 0.003 | −0.109 | 0.147 | −0.107 | 0.155 |
| Education level | 0.282 | <0.00001 | 0.202 | 0.007 | 0.242 | 0.001 |
| Occupation | 0.162 | 0.030 | 0.067 | 0.376 | 0.103 | 0.172 |
| Residency type | 0.241 | 0.001 | 0.208 | 0.005 | 0.223 | 0.003 |
| Marital status | −0.156 | 0.037 | −0.165 | 0.028 | −0.203 | 0.007 |
| TG | 0.111 | 0.137 | 0.107 | 0.155 | 0.158 | 0.035 |
| AI | 0.164 | 0.051 | 0.147 | 0.050 | 0.159 | 0.034 |
| FPG | 0.132 | 0.076 | 0.062 | 0.411 | 0.214 | 0.004 |
| Insulin | 0.159 | 0.033 | 0.090 | 0.233 | 0.153 | 0.041 |
| Weight | 0.383 | <0.0001 | 0.432 | <0.0001 | 0.462 | <0.0001 |
| Height | 0.207 | 0.005 | 0.212 | 0.004 | 0.186 | 0.013 |
| BMI | 0.337 | <0.0001 | 0.382 | <0.0001 | 0.431 | <0.0001 |
| WC | 0.271 | <0.0001 | 0.192 | 0.010 | 0.431 | <0.0001 |
| HC | 0.331 | <0.0001 | 0.353 | <0.0001 | 0.364 | <0.0001 |
| WHR | −0.043 | 0.568 | −0.167 | 0.026 | −0.095 | 0.205 |
| DBP | 0.064 | 0.397 | 0.149 | 0.046 | 0.097 | 0.198 |
Abbreviations: AI, atherogenic index; BMI, body mass index; DBP, diastolic blood pressure; FPG, fasting plasma glucose; HC, hip circumference; TG, triglycerides; WC, waist circumference; WHR, waist hip ratio.
Significant correlations are shown in bold font.
Conditional logistic regression analysis was performed to adjust for confounding variables, and the odds ratio (ORs) of CAD and associated 95% confidence intervals (CIs) were calculated (Table 5). Several of the potentially confounding and effect-modifying factors were included in the model. Three risk factors were significantly related with the presence of angiographically defined luminal narrowing (⩾50%): HDL-C, FPG and femur neck T score. They were included as continuous variables in the model. A high FPG level was associated with 1.2-fold excess risk of CAD (OR: 1.154, 95% CI: 1.042–1.278) and thereby conferred the highest risk for significant CAD. HDL-C level (OR: 0.226, 95% CI: 0.062–0.826) and femur neck T-score (OR: 0.545, 95% CI: 0.374–0.794) were found to be protective factors.
Table 5. Multivariate logistic-regression analysis of cardiovascular risk factors including BMD independently associated with CAD in the study population.
| Variables | Odds ratio |
95% CI |
P-value | Wald | |
|---|---|---|---|---|---|
| Lower bound | Upper bound | ||||
| HDL-C | 0.206 | 0.054 | 0.783 | 0.02 | 5.38 |
| FPG | 1.157 | 0.144 | 1.282 | 0.006 | 7.68 |
| Femur neck T-score | 0.555 | 0.379 | 0.813 | 0.002 | 9.14 |
Abbreviations: BMD, bone mineral density; CAD, coronary artery disease; CI, confidence interval; FPG, fasting plasma glucose; HDL-C, high density lipoprotein-cholesterol; LDL-C, low density lipoprotein-cholesterol; TC, total cholesterol; WHR, waist-to-hip ratio.
Variables that differed between CAD patients and their age-matched controls on univariate analysis, with P-values <0.1 include the following: menopausal age, parity, FPG, HDL-C, LDL-C, TC, BMD lumbar spine, BMD total hip, lumbar spine T-score, total hip T-score, body weight, body height, BMI, hip circumference, and WHR.
Discussion
Low BMD and CVD share many risk factors including age, smoking, low physical activity and hypertension and thus could have similar pathological pathways. This interaction was tested in a model that controlled for major cardiovascular risk factors.
Classic cardiovascular risk factors in the study population
Our study subjects had been referred for cardiovascular risk factor modification, and this may in part explain the high prevalence of type 2 diabetes mellitus (≈41% of total population). Furthermore, patients with CAD tend to be physically inactive, thus contributing to a lower BMD. Nevertheless, one-third of our patients reported normal activities on their health questionnaires, and the prevalence of osteoporosis was relatively low (≈23% of the whole population).
Cardiovascular risk was found to be reduced by 79% and 45% for every one-unit increase in the levels of HDL-C and femoral neck T-score, respectively. Accordingly, our findings lend a plausible explanation for the reported increased cardiovascular events in osteoporotic patients.10
The athero-protective effect of elevated serum HDL-C level has always been attributed to its promotion of reverse cholesterol transport. Intravenous administration of reconstituted HDL-C particles in clinical trials has been associated with regression of coronary atherosclerosis, improvement in endothelial function and anti-inflammatory markers.11,12 This is certainly plausible considering the potential anti-atherogenic and anti-inflammatory effects of HDL-C molecules.13
The menopause may affect BMD because estrogen deficiency is known to adversely affect bone turnover and lipid profile in postmenopausal women.14 Serum total cholesterol was suggested to be a risk factor for osteoporotic fractures, perhaps pointing to a common or overlapping origin of CAD and osteoporosis.15 An indirect association between serum total cholesterol and BMD, which has been considered a strong determinant of osteoporotic fractures, has been demonstrated.16 Furthermore, it has been found that hard cardiovascular end points are strong predictive risk factors for hip fractures among elderly men.17 Postmenopausal women without CAD had significantly higher levels of TC, LDL-C as well as HDL-C (P<0.05) than those with CAD. This difference may, in part, be explained by the differences in their lifestyle (Table 1). Evidence for the association between lipid levels and BMD has been inconclusive.16 Control for confounding factors may have affected these study results.
Overweight and obesity are associated with increased risk of many adverse health outcomes including CAD but considered protective against osteoporosis.18 Although it is generally accepted that obesity has a protective effect on bone tissue, the relationship between obesity and osteoporosis varies depending on how obesity is defined. Our study extends the findings of previous studies reporting obesity as a protective factor for vertebral fractures.19 Of all major cardiovascular risk factors, bone mass as estimated by BMD was found to be associated with various measures of obesity (Table 4), which may be attributed, at least in part, to physical inactivity as reported by almost 60% of the study subjects. WC, which provides an indication of central obesity, was related to radius BMD in postmenopausal obese women.20
Relationship between BMD and classical cardiovascular risk factors in the study population
The association of angiographically defined CAD and BMD as measured by femoral neck T-score remained significant after adjustments for age and traditional coronary risk factors, suggesting an independent risk for CAD in women who have low BMD. Our findings support those of previous studies, which have reported an association between low BMD and cardiovascular events.8 A correlation between low bone mass and incidence of CAD was also observed in women from the Framingham study.14 Causal mechanisms for the reported association of BMD and cardiovascular mortality have not been clearly articulated.21 Similar relationships with CAD could not be established for lumbar spine and total hip scores. Bakhivera et al.,22 found no independent association between spine or hip BMD and calcification of coronary arteries among asymptomatic cardiovascular patients who were not taking hormone replacement treatment. Similarly, a significant correlation was also reported between severity of coronary atherosclerosis and BMD of the proximal femur in postmenopausal women but not with lumbar spine scores.23 This might be due to the coexistence of degenerative joint disease at those areas, which has been shown to spuriously increase BMD among elderly people.24
As expected, advancing age was associated with a low BMD, whereas obesity, diabetes and hyperlipidemia were positively associated with BMD among postmenopausal women with CAD in the present study. Nearly half of the postmenopausal women with CAD had diabetes, a condition that conferred a 44% reduction in the likelihood of having low BMD. Both diabetes and hyperlipidemia were found to provide a comparable degree of protection from having low BMD.25 The risk of cardiovascular events in type 2 diabetes increases by four times, compared with that of those without diabetes26, but elevated BMD was documented in type 2 diabetes.27
Our retrospective study design had several limitations, including an inability to account for some potential confounding variables. Because questionnaires were used to assess selected health history data, patients may have had a recall bias with respect to risk factors. Accordingly, wherever possible, laboratory values were substituted for survey information. Selection bias of study subjects may have arisen because of their referral for cardiac catheterization; therefore, they may not be representative of the whole population. The definition of significant CAD as a ⩾50% luminal stenosis while useful clinically is unreliable as a measure of the presence of atherosclerosis, because patients with <50% luminal stenosis are classified as not having CAD, although they may have substantial intramural coronary atherosclerosis. The sample size was relatively small, and a further study with larger population size is required. Furthermore, some variables were not measured that may have been useful, for example, degree of physical activity and hemoglobin A1c level.
In conclusion, this study suggests an association of low BMD and elevated CAD risk, as indicated by high FPG and low HDL-C. Nevertheless, additional longitudinal studies are needed to determine the temporal sequence of this association.
Materials and methods
One hundred and eighty postmenopausal female patients aged 48–88 years were recruited sequentially from the Catheterization laboratory of the Department of Internal Medicine at King Abdulaziz University Hospital (KAUH), Jeddah, Saudi Arabia. Postmenopausal status was defined as no natural menses for⩾1 year and serum follicle-stimulating hormone level >40 IU l−1.28 Angiography was performed for the evaluation of CAD. CAD was classified as being clinically significant if luminal narrowing was ⩾50% in a major coronary artery. The severity of angiographically defined disease was scored by a cardiologist as previously described.29 None of the patients had suffered a heart attack within 6 months of recruitment into the study. A diagnosis of a myocardial infarction was made in accordance with Joint European Society of Cardiology/American College of Cardiology Committee criteria.30 Subjects were excluded if they had liver or renal disease, inflammatory disease, vascular disease (that is, peripheral vascular disease, cerebro-vascular disease), previous fractures, established osteoporosis, or had clinically evident endocrine disorders or were on treatment with any form of drug that could have a possible effect on bone or lipid metabolism, aspirin, antioxidants, hormone replacement therapy, vitamin D or calcium supplementations. Ethics approval was obtained from the KAUH Ethics Committee. Informed consent was obtained from all participants after explaining the nature and purpose of the study.
Each patient was matched with a control whose age did not differ by more than 2 years. Controls were drawn from the same patient pool as that of CAD cohort. This approach was thought to enhance the comparability of coronary risk between both groups. The presence of classical cardiovascular risk factors was obtained from the medical records of all patients and confirmed by direct questioning using a questionnaire. The following parameters were used to define cardiovascular risk: hypertension, dyslipidemia, diabetes and obesity. Dyslipidaemia was defined using the third Adult Treatment Panel criteria.31 Hypertension was defined as a systolic blood pressure ⩾140 mm Hg and/or a diastolic blood pressure ⩾90 mm Hg.32 Diabetes was defined using the American Diabetes Association criteria.33 The clinical guidelines on the identification, evaluation and treatment of overweight and obesity in adults34 were used to define overweight (BMI, 25–29.9 kg m−2) and obesity (BMI⩾30 kg m−2).
Demographic and anthropometric characteristics included the following: weight, measured while the subjects were minimally clothed and without shoes and recorded to the nearest 0.1 kg using a standard balance beam; and height, measured with the subjects in a standing position without shoes and with shoulders in a normal position to the nearest 0.1 cm using a Harpenden stadiometer (Holtain, Ltd., Crymych, Wales, UK). BMI was calculated in kg m−2. WC was measured using a tape measure at the mid-point between the lower costal margin and the level of the anterior superior iliac crest to the nearest 0.1 cm. Measurement of the WC was considered as a surrogate for visceral adipose tissue and was considered high when waist >88 cm.35 HC was measured at the level of the greater trochanters. WHR, calculated as WC divided by HC, was used as an indicator of abdominal visceral fat, whereas body fat distribution was assessed considering WHR<0.80 as a gynecoid pattern and WHR⩾0.80 as an android pattern.36
Arterial blood pressure was measured using the right arm using a standard mercury sphygmomanometer (Baumanometer, W. A. Baum Co., Inc., Copiague, NY, USA). Three blood pressure measurements with the patient seated and rested for 5 min were averaged. To avoid subjective error, all measurements were taken by the same trained staff.
A self-reported questionnaire assessment was made for the ascertainment of age, marital status, parity, age of menopause onset, smoking habits, physical activity level, family history of osteoporosis and CAD, fracture history in the subject, socioeconomic status, education level and employment status.
Smoking habit was categorized as non-smoker, former smoker and current smoker. Physical activity was self-graded by the participant according to the number of episodes of exercise undertaken per week and was categorized as active (⩾3 times per week) or inactive (<3 times per week) according to the recommendations of the American Heart Association consensus statement on primary prevention of coronary diseases and from the USA Surgeon General's report.37
Fasting blood samples were taken after an overnight fast. Venous blood samples were taken from an antecubital vein and placed into plain or heparinized tubes. Tubes were centrifuged at 3000 × g for 10 min.
Glucose, creatinine, TC), HDL-C and TGs were determined in duplicate in serum samples using the enzymatic colorimetric assays. LDL-C was calculated using the Friedewald formula in samples where the TGs were <4 mmol l−1. However, none of the measured samples had levels above TG >4 mmol l−1. All biochemical parameters were measured using kits and reagents supplied by Ortho-Clinical Diagnostics, USA, using Vitros 250 Chemistry System Autoanalyzer (Ortho-Clinical Diagnostics, Johnson & Johnson Co, Raritan, NJ, USA). Estimated glomerular filtration rate was also calculated as an index of the kidney function. Determination of plasma insulin was carried out using a sandwich chemi-luminescence immunoassay method using commercial kits (DiaSorin, Saluggia, Italy).
All patients were referred for a DXA scan. Anterior-posterior lumbar spine (L1–L4), mean of right and left femoral neck and total hip BMD were measured by DXA with a Lunar Prodigy densitometer (Lunar, Madison, WI, USA). Daily quality control was carried out by measurement of a Lunar phantom. BMD (g cm−2) was compared as T-scores expressed in s.d., using the peak bone mass from the manufacturer's reference population. Osteoporosis was defined in accordance with the World Health Organization,38 as BMD at any site greater than 2.5 s.d. below the young adult mean, and osteopenia as BMD 1–2.5 s.d. below the young adult mean.
Continuous variables are presented as mean±standard deviation for normally distributed variables and as median (interquartile ranges) for non-normally distributed variables. Categorical variables are presented as numbers (proportions). Normality of the data was tested with a one-sample Kolmogorov–Smirnov test to indicate the appropriateness of parametric testing. Statistical analyses were performed using unpaired Student's t-test for normally distributed parameters or the Mann–Whitney test for non-normally distributed parameters. The Chi-square test was implemented when necessary for categorical variables comparison. The strength of association between different parameters was determined by Pearson's and Spearman's correlation coefficients, as indicated. ORs and 95% CIs were calculated using conditional logistic regression model to explore the relationships between cardiovascular risk factors, including BMD, and the presence of CAD. The dependent variable was a binary variable with a ‘zero' value representing those with no CAD and a ‘one' representing CAD patients. Variables that differed between CAD patients and their age-matched controls on univariate analysis, with P-values <0.1, were included in the model.
All analyses were performed in SPSS (version 11.5, SPSS, Inc, Chicago, IL, USA). All reported P-values were from two-sided tests and compared with a significant level of 5%.
Acknowledgments
This study was financially supported by a grant number (0334-11) from the KACST. We thank the CEOR, KAU and all the individuals who took part in the study.
Footnotes
The authors declare no conflict of interest.
References
- American Heart Association Nutrition Committee. Lichtenstein AH, Appel LJ, Brands M, Carnethon M, Daniels S et al. Diet and lifestyle recommendations revision, 2006: a scientific statement from the American Heart Association Nutrition Committee. Circulation 2006; 114: 82. [DOI] [PubMed] [Google Scholar]
- Baldini V, Mastropasqua M, Francucci CM, D'Erasmo E. Cardiovascular disease and osteoporosis. J Endocrinol Invest 2005; 28(Suppl 10): 69–72. [PubMed] [Google Scholar]
- Rosano GM, Vitale C, Marazzi G, Volterrani M. Menopause and cardiovascular disease: the evidence. Climacteric 2007; 10: 19–24. [DOI] [PubMed] [Google Scholar]
- Bush TL, Fried LP, Barrett-Connor E. Cholesterol, lipoproteins, and coronary heart disease in women. Clin Chem 1988; 34: B60–B70. [PubMed] [Google Scholar]
- Krotkiewski M, Björntorp P, Sjöström L, Smith U. Impact of obesity on metabolism in men and women: importance of regional adipose tissue distribution. J Clin Invest 1983; 72: 1150–1162. [DOI] [PMC free article] [PubMed] [Google Scholar]
- Carr M. The emergence of the metabolic syndrome with menopause. J Clin Endocrinol Metab 2003; 88: 2404–2411. [DOI] [PubMed] [Google Scholar]
- Haddock BL, Marshak HP, Mason JJ, Blix G. The effect of hormone replacement therapy and exercise on cardiovascular disease risk factors in postmenopausal women. Sports Med 2000; 29: 39–49. [DOI] [PubMed] [Google Scholar]
- Tanko LB, Christiansen C, Cox DA, Geiger MJ, McNabb MA, Cummings SR. Relationship between osteoporosis and cardiovascular disease in postmenopausal women. J Bone Miner Res 2005; 20: 1912–1920. [DOI] [PubMed] [Google Scholar]
- Mosca L, Banka CL, Benjamin EJ, Berra K, Bushnell C, Dolor RJ et al. Evidence-based guidelines for cardiovascular disease prevention in women: 2007 update. Circulation 2007; 115: 1481–1501. [DOI] [PubMed] [Google Scholar]
- Barengolts EI, Berman M, Kukreja SC, Kouznetsova T, Lin C, Chomka EV. Osteoporosis and coronary atherosclerosis in asymptomatic postmenopausal women. Calcif Tissue Int 1998; 62: 209–213. [DOI] [PubMed] [Google Scholar]
- Nieuwdorp M, Vergeer M, Bisoendial RJ, op 't Roodt J, Levels H, Birjmohun RS et al. Reconstituted HDL infusion restores endothelial function in patients with type 2 diabetes mellitus. Diabetologia 2008; 51: 1081–1084. [DOI] [PMC free article] [PubMed] [Google Scholar]
- Patel S, Drew BG, Nakhla S, Duffy SJ, Murphy AJ, Barter PJ et al. Reconstituted high-density lipoprotein increases plasma high-density lipoprotein anti-inflammatory properties and cholesterol efflux capacity in patients with type 2 diabetes. J Am Coll Cardiol 2009; 53: 962–971. [DOI] [PubMed] [Google Scholar]
- Cuchel M, Rader DJ. Macrophage reverse cholesterol transport: key to the regression of atherosclerosis? Circulation 2006; 113: 2548–2555. [DOI] [PubMed] [Google Scholar]
- Samelson EJ, Kiel DP, Broe KE, Zhang Y, Cupples LA, Hannan MT et al. Metacarpal cortical area and risk of coronary heart disease: The Framingham Study. Am J Epidemiol 2004; 159: 589–595. [DOI] [PubMed] [Google Scholar]
- Ahmed LA, Schirmer H, Berntsen GK, Fonnebo V, Joakimsen RM. Features of the metabolic syndrome and the risk of non-vertebral fractures: The Tromso study. Osteoporos Int 2006; 17: 426–432. [DOI] [PubMed] [Google Scholar]
- Bagger YZ, Rasmussen HB, Alexandersen P, Werge T, Christiansen C, Tankó LB et al. Links between cardiovascular disease and osteoporosis in postmenopausal women: serum lipids and atherosclerosis per se? Osteoporos Int 2007; 18: 505. [DOI] [PMC free article] [PubMed] [Google Scholar]
- Trimpou P, Landin-Wilhelmsen K, Oden A, Rosengren A, Wilhelmsen L. Male risk factors for hip fracture—a 30-year follow-up study in 7,495 men. Osteoporos Int 2010; 21: 409–416. [DOI] [PubMed] [Google Scholar]
- Douchi T, Yamamoto S, Oki T, Maruta K, Kuwahata R, Yamasaki H et al. Difference in the effect of adiposity on bone density between pre- and postmenopausal women. Maturitas 2000; 34: 261–266. [DOI] [PubMed] [Google Scholar]
- Zhao LJ, Liu YJ, Liu PY, Hamilton J, Recker RR, Deng HW. Relationship of obesity with osteoporosis. J Clin Endocrinol Metab 2007; 92: 1640–16406. [DOI] [PMC free article] [PubMed] [Google Scholar]
- Kim K, Shin D, Lee S, Lee JW, Shin KS. Relation between obesity and bone mineral density and vertebral fractures in korean postmenopausal women. Yonsei Med J 2010; 51: 857–863. [DOI] [PMC free article] [PubMed] [Google Scholar]
- Browner WS, Seeley DG, Vogt TM, Cummings SR. Non-trauma mortality in elderly women with low bone mineral density. Lancet 1991; 338: 355–358. [DOI] [PubMed] [Google Scholar]
- Bakhireva LN, Barrett-Connor EL, Laughlin GA, Kritz-Silverstein D. Differences in association of bone mineral density with coronary artery calcification in men and women: The Rancho Bernardo Study. Menopause 2005; 12: 691–698. [DOI] [PubMed] [Google Scholar]
- Uyama O, Yoshimoto Y, Yamamoto Y, Kawai A. Bone changes and carotid atherosclerosis in postmenopausal women. Stroke 1997; 28: 1730–1732. [DOI] [PubMed] [Google Scholar]
- Cummings SR, Bates D, Black DM. Clinical use of bone densitometry. JAMA 2002; 288: 1889–1897. [DOI] [PubMed] [Google Scholar]
- Broussard D, Magnus J. Coronary heart disease risk and bone mineral density among U.S. women and men. J Womens Health 2008; 17: 479–491. [DOI] [PubMed] [Google Scholar]
- Schernthaner G. Cardiovascular mortality and morbidity in type-2 diabetes mellitus. Diabetes Res Clin Pract 1996; 31: S3–S13. [DOI] [PubMed] [Google Scholar]
- Isaia GC, Ardissone P, Di Stefano M, Ferrari D, Martina V, Porta M et al. Bone metabolism in type 2 diabetes mellitus. Acta Diabetol 1999; 36: 35–38. [DOI] [PubMed] [Google Scholar]
- Soules MR, Sherman S, Parrott E, Rebar R, Santoro N, Utian W et al. Executive summary: stages of reproductive aging workshop (STRAW) Park City, Utah, July 2001. Menopause 2001; 8: 402–407. [DOI] [PubMed] [Google Scholar]
- Judkins M. Selective coronary angiography. Radiology 1967; 89: 815–819. [DOI] [PubMed] [Google Scholar]
- Alpert JS, Thygesen K, Antman E, Bassand JP. Myocardial infarction redefined – a consensus document of the Joint European Society of Cardiology/American College of Cardiology Committee for the redefinition of myocardial infarction. J Am Coll Cardiol 2000; 36: 959–969. [DOI] [PubMed] [Google Scholar]
- Expert Panel on Detection, Evaluation, and Treatment of High Blood Cholesterol in Adults. Executive summary of the third report of the National Cholesterol Education Program (NCEP) expert panel on detection, evaluation, and treatment of high blood cholesterol in adults (Adult Treatment Panel III). JAMA 2001; 285: 2486–2497. [DOI] [PubMed] [Google Scholar]
- Chobanian AV, Bakris GL, Black HR, Cushman WC, Green LA, Izzo JL Jr et al. The seventh report of the Joint National Committee on Prevention, Detection, Evaluation, and Treatment of High Blood Pressure: The JNC 7 report. JAMA 2003; 289: 2560. [DOI] [PubMed] [Google Scholar]
- American Diabetic Association. Diagnosis and Classification of Diabetes Mellitus. Diabetes Care 2005; 28: S37–S52. [DOI] [PubMed] [Google Scholar]
- World Health Organization. Obesity: Preventing and Managing the Global Epidemic. WHO Technical Report. Series No. 894 WHO: Geneva, Switzerland, 2000;. [PubMed] [Google Scholar]
- Valsamakis G, Chetty R, Anwar A, Banerjee A, Barnett A, Kumar S. Association of simple anthropometric measures of obesity with visceral fat and the metabolic syndrome in male Caucasian and Indo-Asian subjects. Diabet Med 2004; 21: 1339–1345. [DOI] [PubMed] [Google Scholar]
- World Health Organization. Waist Circumference and Waist-Hip Ratio A report of a WHO expert consultation: Geneva, Switzerland, 2008;. [Google Scholar]
- US Department of Health and Human Services. Physical activity and health: a report of the Surgeon General Centers for Disease Control and Prevention (CDC), National Centers for Chronic Disease Prevention and Health Promotion: Atlanta, GA, USA, 1996;. [Google Scholar]
- World Health Organization. Assessment of Fracture Risk and its Application to Screening for Postmenopausal Osteoporosis. WHO Technical Report. Series No. 843 WHO: Geneva, Switzerland, 1994;. [PubMed] [Google Scholar]