

Summary
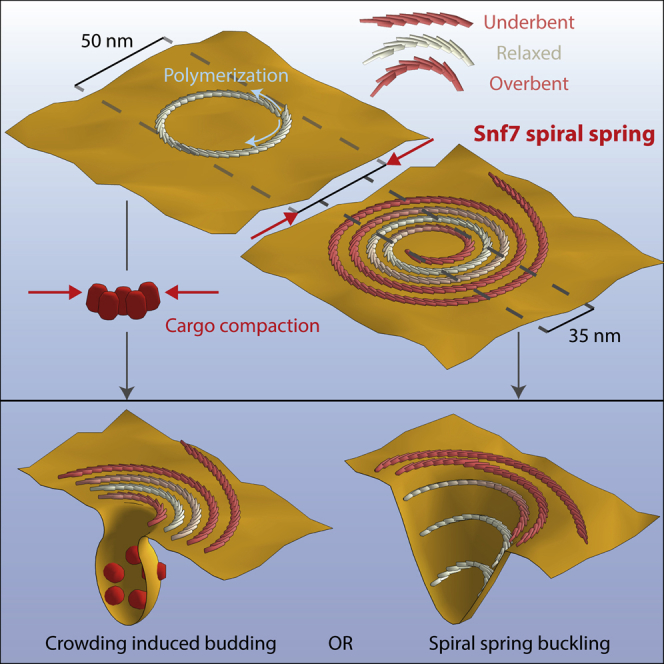
ESCRT-III is required for lipid membrane remodeling in many cellular processes, from abscission to viral budding and multi-vesicular body biogenesis. However, how ESCRT-III polymerization generates membrane curvature remains debated. Here, we show that Snf7, the main component of ESCRT-III, polymerizes into spirals at the surface of lipid bilayers. When covering the entire membrane surface, these spirals stopped growing when densely packed: they had a polygonal shape, suggesting that lateral compression could deform them. We reasoned that Snf7 spirals could function as spiral springs. By measuring the polymerization energy and the rigidity of Snf7 filaments, we showed that they were deformed while growing in a confined area. Furthermore, we observed that the elastic expansion of compressed Snf7 spirals generated an area difference between the two sides of the membrane and thus curvature. This spring-like activity underlies the driving force by which ESCRT-III could mediate membrane deformation and fission.
Graphical Abstract
Highlights
-
•
Snf7 forms highly flexible filaments that spontaneously curl
-
•
Snf7 filaments forms spirals at the surface of lipid membranes
-
•
Snf7 spirals are springs as they can deform under lateral compression
-
•
Relaxation of compressed Snf7 spirals leads to membrane deformation
A component of the ESCRT-III membrane fission machinery self-organizes into spiral springs that trigger membrane deformation when released.
Introduction
ESCRT-III (endosomal sorting complex required for transport) has been implicated in the formation of intralumenal vesicles (ILVs) during biogenesis of multi-vesicular bodies (MVBs) by genetic (Babst et al., 2002, Coonrod and Stevens, 2010) and biochemical assays (Adell et al., 2014, Henne et al., 2012, Saksena et al., 2009, Wollert and Hurley, 2010, Wollert et al., 2009). ESCRT-III budding occurs in an opposite direction than in endocytosis: the limiting membrane is pushed outward from the cytoplasm instead of curving inward. ESCRT-III has been proposed to play a role in membrane deformation (Hanson et al., 2008) and fission of ILVs (Adell et al., 2014). Consistent with this, ESCRT-III is also required for geometrically similar fission reactions such as viral budding (von Schwedler et al., 2003) and abscission during cytokinesis (Carlton et al., 2008, Elia et al., 2011, Guizetti et al., 2011). ESCRT-III nucleation is promoted by ESCRT-II and its disassembly by the ATPase Vps4 (Lata et al., 2008).
It is unclear how ESCRT-III deforms lipid membranes. Because of their polymerization abilities, ESCRT-III proteins (Vps20, Snf7, Vps2, Vps24) have been proposed to generate membrane curvature by scaffolding (Cashikar et al., 2014, Fabrikant et al., 2009, Hanson et al., 2008, Lata et al., 2008). In this mode, polymers coating the membrane usually adopt a single specific shape, or, at least, a set of geometrically similar shapes. ESCRT-III filaments adopt instead a wide variety of shapes in vivo and in vitro: concentric circles, rings, spirals, helices, or linear filaments have been observed (Hanson et al., 2008, Henne et al., 2012, Pires et al., 2009). Furthermore, no unique shape for the assembly of ESCRT-III proteins arises from the molecular structure of ESCRT-III proteins (McCullough et al., 2013). Instead, curvature could be generated by other mechanisms: for example, it has been proposed that the amphipathic insertion of the N-terminal part of Snf7 could participate in the generation of membrane curvature (Buchkovich et al., 2013). We were thus interested in studying how ESCRT-III polymerization could drive membrane curvature.
Results
Growth of Snf7 Patches on Supported Bilayers
To study the polymerization of ESCRT-III, we reconstituted ESCRT-III polymerization by adding purified yeast Snf7 onto supported lipid membranes. Supported membranes were obtained by bursting giant unilamellar vesicles (GUVs) composed of 40% di-oleoyl-phosphatidylserine (DOPS) and 60% of di-oleoyl-phosphatidylcholine (DOPC) on cleaned glass coverslips (Figure S1A, Movie S1). These coverslips were built into a flow chamber, allowing sequential addition and exchange of solutions.
Figure S1.

Dynamics of Snf7 Patches on Supported Membranes, Related to Figure 1
(A) GUV bursting on glass coverslip. Left: GUV before bursting. A strongly adhered GUV, labeled with Rhodamine-PE, is visualized by spinning-disk confocal microscopy. The focus is made on the bottom of the vesicle, showing the circular patch of adhesion. Below is the 3D sketch showing the strongly adhered vesicle. Right: Same vesicle shortly after bursting occurred and corresponding sketch. See also Movie S1. (B) Spontaneous Snf7 patch depolymerization after Snf7 washout in solution. The curves represent different locations where depolymerization is measured. See also Movie S3. (C) Patch nucleation rate as a function of [Snf7] for a DOPC 60% / DOPS 40% membrane (blue curve) and for a DOPC 80% / DOPS 20% membrane (orange curve). (D) Patch radial growth speed as a function of [Snf7] for a DOPC 60% / DOPS 40% membrane (blue curve) and for a DOPC 80% / DOPS 20% membrane (orange curve). Lines are linear fit with the slope equals to 760 nm.min−1.μM−1 (blue) and 150 nm.min−1.μM−1 (orange). (E) Fluorescence intensity curve (average of 5 patches) with time at a given point on the membrane upon coverage by a Snf7 patch, for [Snf7] = 100 nM (thin gray line), 200 nM (orange line), 400 nM (thick gray line). (F) Same curves as (E) plotted as a function of time multiplied by Snf7 concentration in μM. All graphs merge on one single master curve, revealing that the coverage dynamics is proportional to Snf7 bulk concentration.
First, Snf7 labeled with Alexa488 (Snf7-Alexa488) was flushed into the chamber, and its association to the membrane was imaged by time-lapse spinning-disk confocal microscopy (SDC). At 400 nM, Snf7 formed patches evenly distributed on the membrane surface (Figure 1A). These circular patches (Figure 1B) grew over the course of an hour until becoming confluent, eventually covering the membrane completely.
Figure 1.

Nucleation and Growth of Snf7 Patches on Supported Membranes
Lipid composition is DOPC 60% / DOPS 40%+ Rhodamine PE 0.1%.
(A) Time-lapse images of Snf7-Alexa488 patches growth (green) at [Snf7] = 400 nM on supported membrane (gray).
(B) Time-lapse images (every 10 min) of a single Snf7-Alexa488 patch (green) growing at [Snf7] = 200 nM.
(C) Patch nucleation rate as a function of [Snf7].
(D) Successive (from bright to dark green, every 10 min) Snf7 patch fluorescence profiles (circularly averaged) at [Snf7] = 200 nM.
(E) Snf7 patch edge fluorescence profile (average of 3 patches) as a function of [Snf7] (data for [Snf7] < 200 nM were obtained by first nucleating the patches at 350 nM for 5 min, and then [Snf7] was reduced to the desired value).
(F) Exchange of bulk Snf7-Alexa488 (green) with Snf7-Atto647N (red) at 200 nM. Inset: kymograph of the region selected (yellow box). The green line is the switch between green and red Snf7.
(G) Equatorial kymograph of the patch shown in B.
(H) Patch radial growth speed as a function of [Snf7]. The slope of the linear fit (gray line) is 760 nm.min−1.μM−1.
See also Figure S1.
The nucleation rate of the patches depended on Snf7 bulk concentration (Figure 1C). Patch formation was not observed below 200 nM. Above 1 μM, patch formation and growth was so fast that individual patches could hardly be discriminated. Between these limiting concentrations, we were able to follow micron-sized patches individually over several tens of minutes (Movie S2). Once formed, patches disassembled with a half time of approximately 15 hr upon Snf7 washout (Figure S1B; Movie S3).
We termed “patch nucleation” this nucleation of patches in the absence of a previous Snf7 structure. The patch nucleation rate was very low, less than 1 seed.μm−2.hour−1, and depended on the amount of negatively charged lipids in the membrane (Figure S1C), revealing the critical role of these lipids in promoting Snf7 polymerization. We did not observe Snf7 assemblies in the absence of membranes.
The periphery of the patches showed dimmer Snf7 fluorescence than the center: fluorescence decayed radially at the rim over the outer 4 μm. This gradient of fluorescence was the same as the patch grew in radius (Figure 1D) and independent on bulk concentration of Snf7 (Figure 1E). The central part of the patches had the same intensity, constant over time. We postulated that the patch could be made of two parts: a central part where Snf7 entirely covers the membrane and cannot further assemble, and a rim, representing a growing front. To study whether Snf7 was assembled only in the front region, we generated patches with a solution of Snf7-Alexa488, which we then replaced with Snf7-Atto647N (Figure 1F and Movie S4). As postulated, Snf7-Atto647N fluorescence appeared only at the border of the growing patches. These observations confirmed that Snf7 patches were growing by a traveling circular front.
The front propagated at constant speed (Figure 1G). The speed was linear with Snf7 concentration (Figure 1H). As a result, and because the fluorescence gradient was independent from Snf7 concentration, fluorescence intensity curves with time at a given point (Figure S1E) could be merged into a single one by rescaling time with Snf7 concentration (Figure S1F). The amount of negatively charged lipids also affected the front speed (Figure S1D). In summary, the growth of the Snf7 patches reflected a nucleation/growth process, with a nucleation rate of less than 1 seed.μm−2.hour−1 and a radial growth speed of 760 nm.min−1.μM−1.
Since Snf7 filaments can curl into circles or spirals (Hanson et al., 2008, Henne et al., 2012, Shen et al., 2014), we reasoned that one patch could be made of a single spiral filament growing from its tips at constant rate. In this case, however, the radial growth speed of the patch should slow down as the square root of time, and a dimmer fluorescence at the periphery of the patches would not be expected. To resolve this apparent contradiction, we studied the molecular structure of the Snf7 patches with atomic force microscopy (AFM) and electron microscopy (EM).
Snf7 Patches Are Made of Spiraling Filaments with Lateral Interactions
We first acquired images of Snf7 patches by AFM. GUVs composed of 60% DOPC and 40% DOPS were burst on a mica support (Figure S2A). After a four hours incubation of Snf7 at 1 μM, AFM images revealed that the micron-sized Snf7 patches consisted of packed arrays of Snf7 circular assemblies (Figure 2A; Figure S2B). Each assembly was formed by concentric circle-like structures. However, in these packed conditions, rather than being perfectly circular, each assembly was deformed into polygons with six neighbors on average (Figure 2B). The average external radius was 123 ± 35 nm (in the following, values are mean ± SD unless otherwise noted; n = 295) (Figure 2C), and the innermost circle had an average radius of 18 ± 3 nm (n = 120) (Figure 2D). The average distance between successive circles was nm (n = 80) (Figure 2E).
Figure S2.

Filamentous Structure of Snf7 Patches, Related to Figure 2
(A) Bare membrane bursted on mica visualized by AFM. The membrane is partially covering the mica support (edge underlined in gray). (B) Membrane partially covering the mica surface (frontier shown as a gray line) fully covered by packed Snf7 spirals. (C) Estimation of Snf7 filament thickness by EM. Two representative example of single-stranded rings and double-stranded rings are straighten and averaged along their path to reveal single filament or double filament thickness. Their thickness is measured as the well to well distance (arrows). (D) TEM image of a single Snf7 disk negatively stained, another example of Figure 2H. Left: raw data. Middle: the Snf7 filament is underlined in green (resp. red) when double stranded (resp. single stranded). Right: interpretation of EM picture as a single Snf7 spiraling filament, color coded along its path from red to purple.
Figure 2.

Patches Are Made of Packed Snf7 Spirals
(A) AFM topographic image of the center of a Snf7 patch.
(B) Histogram of the number of neighbors per assembly.
(C) Histogram of the average outer radii of Snf7 assemblies. The average radius is 123 nm ± 33 nm.
(D) Histogram of the innermost circle radii. The average radius is 18 nm ± 3 nm.
(E) Histogram of the inter-circle distance. The average distance is b = 17 nm ± 3 nm.
(F) TEM image of a negatively stained, Snf7-coated LUV.
(G) TEM images of Snf7 rings, single (upper row) and double (lower row) stranded.
(H) Top: TEM image of a single Snf7 spiral. The Snf7 filament is underlined in green (resp. red) when double stranded (resp. single stranded). Bottom: color code of the filament path from the most inner turn (red) to the most outer turn (purple). See also Figure S2D.
(I) AFM images of connections between filaments: 1 to 3, split filaments connecting two spirals – 4 and 5, filament split within a spiral – 6, a spiral filament.
(J) High resolution AFM topographic image of Snf7 filament splitting and branching within a single Snf7 spiral.
See also Figure S2.
To study the structure of these Snf7 assemblies, we performed negative stain electron microscopy (EM) of large unilamellar vesicles (LUVs) coated with Snf7 upon incubation for 15 min in a 1 μM Snf7 solution. LUVs coated with circular structures were observed, consistent with AFM images (Figure 2F). The fine structure of the filaments remained difficult to see because the two hemispheres of the LUV are projected onto the same EM image. However, in many cases, LUVs that had adhered on the grid were flushed during staining, leaving Snf7 assemblies attached to the grid surface. Two kinds of structures were then observed: small rings (27 ± 4 nm average radius; n = 61; Figure 2G) and large circular assemblies (R = 110 ± 40 nm; n = 46; Figure 2H).
Small rings are composed of filaments with two different thicknesses (Figure 2G and Figure S2C). The thinner ones appeared single stranded with an approximate thickness of 4.5 ± 0.3 nm (n = 10) in agreement with previous data (Pires et al., 2009, Shen et al., 2014). The thicker ones were double-stranded, with approximately twice the thickness (10.7 ± 0.7 nm; n = 7). The larger circular assemblies had an average radius of 110 ± 40 nm (n = 46). Following the path of the innermost filament in these assemblies revealed that they were made of a single filament, self-organized into a spiral (Figure 2H; Figure S2D). Within the spiral, we observed that the filament could associate laterally with itself, forming double-stranded filaments. These images showed that the spiraling nature of Snf7 filaments previously observed in solution (Shen et al., 2014) is conserved at the membrane. It also suggests that previously reported circular assemblies could also be spirals: in vitro, a Snf7 mutant protein that polymerizes spontaneously onto membranes (Henne et al., 2012) or, in fibroblasts, the circular structures found upon overexpression of CHMP4A and CHMP4B (Hanson et al., 2008). The formation of rings suggests that Snf7 filaments grow with a preferred curvature and the formation of spiral suggests that Snf7 filaments can depart from this preferred curvature with some flexibility.
The AFM images also revealed that filaments could split within the disk assemblies (Figure 2I): thick filaments that appeared as concentric circles are actually interconnected by thinner filaments (Figure 2J, arrows). This is consistent with the spiral structure seen by EM: double-stranded parts are combined with single-stranded connections (Figure 2H). The thinner filaments had an average thickness of 4.9 nm ± 1.5 nm (n = 25), probably corresponding to single strands, whereas thicker ones had a thickness of 10.6 ± 1.2 nm (n = 25), consistent with double-strands. The AFM and EM analysis suggested a structure of the Snf7 assemblies, where a single spiral filament interacted laterally with itself to form double-stranded filaments. Occasionally, spirals were directly observed by AFM (Figure 2I, subpanel 6).
These observations prompted the question of how Snf7 patches were formed. Patch nucleation could, for instance, start from a single closed ring, like those seen by EM. It is conceivable that such rings could be prone to break open, thus freeing filament tips that could further grow into a spiral. How would then this initial spiral transform into a patch? A possible scenario consists of a two-step growth mechanism (Figure 3A). First, new spirals are nucleated in the vicinity of existing spirals (termed below spiral nucleation). Rupture of filaments would separate the newly formed spirals from the initial spiral. Second, these spirals would grow independently through the addition of monomers at their filament tips. This scenario accounts for the observed growth dynamics of Snf7 patches: the constant speed of the radial growth of the patches implies that the density of growing filament tips at their rim stays constant. The formation of new spirals generates new tips, maintaining a constant density of growing tips.
Figure 3.

Modeling of Snf7 Patch Growth
(A) A putative scenario for the nucleation and growth of Snf7 spirals into a patch: new spirals are formed from filaments protruding from pre-existing spirals. The new spirals separate from the mother spiral by filament break.
(B) Schematic of the theoretical model for Snf7 patch growth. Snf7 spirals are represented by disks. Disks are created with an initial radius . Their area grows with a constant rate , which leads to a radius growing as the square root of time (upper graph and black curves). New spirals are nucleated over time proportionally to the spiral nucleation rate λ and to the total perimeter of existing disks.
(C) Pictorial representations of a small membrane area being covered with Snf7 disks at the beginning (left) and at the end (right) of the growth process.
(D) Cumulative distribution of spiral sizes (dots, calculated from Figure 2C) fitted with our theoretical model (line), imposing = 25 nm. The single fit parameter is equal to μm3.
To explore quantitatively the implications of such scenario, we developed a mathematical description of the dynamics of surface coverage by growing Snf7 spirals (Figure 3B and Figure S3). In the model, Snf7 spirals are represented by hard disks deposited on a surface representing a small (micron-sized) piece of membrane. As initial conditions, a few disks with radius are present, corresponding to events of initial patch nucleation. Patch nucleation is then neglected (set to zero) during the rest of the dynamics. New disks are thus generated only by spiral nucleation.
Figure S3.

Mathematical Modeling of Snf7 Growth and Mechanics, Related to Figure 3
(A) Mean-field disk addition scheme. We consider the addition of a new disk of radius ri that does not overlap with any of the blue disks numbered from 1 to i-1 (i.e., we assume that its center falls outside of the gray circles). We evaluate the probability that this disk does not interfere with the intended nucleation site, which we represent as a dashed circle. This is equivalent to computing the probability that its center falls outside of the solid black circle. (B) Plot of the solution of Equation 16 of the Supplemental Information, Supplemental Mathematical Modeling. (C) Fit between the numerical and experimental cumulative disk radius distribution. Blue line: experimental data used in Figure 3D of the main text; black line: best fit, ã0 = 0.043; gray lines: significantly worse fits obtained by altering this value by 10%, providing a measure of the uncertainty of the fit. (D) Polymer profiles observed by AFM (coordinates in nanometers). (E) Correlation function C(q) as a function of wavevector q: experimental measurement (black) and theoretical expression (Equation 24) with parameters lp and α determined through Equation 25 (blue). (F) Deformed (a) and relaxed (b) coat shapes considered in section 3 of Supplemental Information, Supplemental Mathematical Modeling and resulting membrane curvature.
Disks growth corresponds to an area gain per unit time (in nm2.s−1), as expected if the Snf7 filaments are elongating from their tips at a constant speed (in nm.s−1, where b = 17 nm is the distance between Snf7 filaments in a single spiral). As the Snf7 spiral grows, its perimeter increases, offering an increasing number of potential spiral nucleation sites. We model this by stochastic nucleation of new disks with radius at a rate , where denotes the total perimeter of the existing disks, and a constant spiral nucleation rate (expressed in number of nucleation events per second per micrometer). In the model, nucleation is prevented if the new disk location is already occupied by an existing disk. In addition, both nucleation and polymerization stop when the surface is completely covered with disks (Figure 3C). Solving the model in a mean-field approximation using the value obtained experimentally for r0 gives a final distribution of disk sizes with one unknown parameter (Supplemental Information, Supplemental Mathematical Modeling part 1). Fitting μm3, we find the distribution in excellent agreement with the experimental size distribution (Figure 3D).
We then tested experimentally whether three key features of our theoretical model are indeed fulfilled during the generation of Snf7 assemblies. First, both the existence of initial single rings and the growth into spirals imply that Snf7 filaments have a preferred high curvature. Since the average radius of rings is in the range 25–30 nm, this might correspond to the preferred curvature. Second, the proposal of secondary nucleation of spirals implies that new spirals can form from existing ones. Third, polymerization arrest should be correlated with contacts between neighboring disks. Finally, we also sought to determine independently the parameters and , whose ratio had been estimated from the fit of the size distribution of spirals (Figure 3D). To address all this, we studied the molecular dynamics of spiral growth by total internal reflection fluorescence microscopy (TIRFM) and by dynamic high-speed AFM (HS-AFM) imaging (Casuso et al., 2012).
Snf7 Filament Dynamics Uncovers the Intrinsic Filament Curvature and the Mode of Nucleation
To characterize the initial events leading to patch formation, we first studied the early steps of Snf7 patch nucleation by TIRFM, which allowed us to quantify the approximate number of Snf7 molecules in diffraction limited spots from their fluorescence intensity (see Experimental Procedures for quantification). Patch nucleation started with the appearance of a fluorescent diffraction limited spot (nucleus, Figure 4A) containing 50 ± 20 monomers (n = 9). At a Snf7 concentration of 300 nM, the intensity of the nuclei remained constant for several minutes until these nuclei started to grow (Figure 4A). Under these conditions, the number of nuclei is very low (Figure 1C). To increase the number of nuclei and to obtain more robust statistics, we nucleated Snf7 assemblies by adding 1 μM ESCRT-II and 1 μM Vps20 to a 75 nM Snf7 solution. Under these conditions, many Snf7 nuclei appeared on the membrane surface (Figure 4B and Figure S4A) and remained stable for several tens of minutes, consistent with our observations with Snf7 alone (see Figure 4A).
Figure 4.

Nucleation and Growth of Snf7 Spirals on Supported Membranes
(A) Left: TIRF microscopy kymographs of the nucleation of single Snf7 patches (green) at [Snf7] = 300 nM. Arrows indicate single ring to multiple spirals transition as postulated from the interpretation of these observations (right).
(B) TIRF microscopy image of Snf7-Alexa488 dots (green) nucleated by ESCRT-II, [Snf7] = 75 nM, [Vps20] = 1 μM, [ESCRT-II] = 1 μM. Inset: zoom on 4 diffraction-limited spots (scale bar, 2 μm).
(C) Histogram of the estimated number of Snf7 molecules within the dots nucleated by ESCRT-II (n = 1856).
(D) HS-AFM nanodissection experiment (see text) of Snf7 spirals. 2 cycles of high AFM force were applied, between 0 s and 10 s, and between 10 s and 20 s.
(E) HS-AFM time-lapse sequence showing the apparition of a new Snf7 spiral from pre-existing ones. Arrowheads show: filament protruding from a spiral (t = 8.5 s), filament curling from its tip (t = 17.0 s), and forming a small spiral (t = 37.4 s), growth of a second turn in the spiral (t = 152.2 s) and filament rearrangements (t = 164.9 s).
(F) HS-AFM time-lapse sequence of an isolated Snf7 spiral. Arrowheads show: growth of the spiral at the two-turn stage (t = 67.2 s), and filament split (t = 75.7 s) leading to the three turns stage.
(G) The equatorial kymograph (yellow rectangle) of this growing spiral: the innermost turn radius decreases from 22 nm to 14 nm upon formation of the third turn.
(H) Dynamics of filament splitting and fusing in two Snf7 spirals (rows) observed by HS-AFM. Arrowheads show displacement of the splitting points.
(I) Time plot of the outer radius of five growing Snf7 spirals followed by HS-AFM. The origin of all curves is the apparition of the first turn. The thick curve is the average of all curves. [Snf7] = 1 μM. See also Figure S4.
Figure S4.

Nucleation and Disruption of Snf7, Related to Figure 4
All images are acquired with TIRF Microcopy. (A) Control of Snf7 polymerization induced by ESCRT-II and Vps20 proteins. Kymograph of a membrane slice over time. Fluorescents dots appear as lines when Snf7 nuclei are polymerized. Lines appear only when both Vps20 and ESCRT-II are present (both kymograph, lower panel). Snf7 and Vps20 without ESCRT-II (left kymograph middle panel) as well as Snf7 and ESCRT-II without Vps20 (right kymograph middle panel) do not nucleate Snf7 filaments. (B) Photobleaching induces breaks in Snf7 dotted structures. Snf7 dots are formed by incubation of Snf7 at 300 nM for 1 hr on DOPC 60% /DOPS 40% membrane. Snf7 is then washed out. Snf7 dots are subsequently imaged at a high frequency (1 fps) and under long exposure time and high laser power. When an antibleaching solution (AB) is present in the chamber, the dots remain intact (first and second image). However 5 min and 15 min after the antibleaching solution is washed out (third and fourth image), dots are disrupted into wider structures showing multiple maxima (see 2 × 2 μm insets for details). Structures located outside the imaged field of view are not affected by the removal of the antibleaching solution. (C) Photobleaching triggers patch formation from Snf7 dots. Compared to (B), Snf7 is maintained in the chamber at 300 nM throughout the experiment. In this case, the removal of the antibleaching solution (Snf7 - AB point of the kymograph) synchronously triggers the transition from Snf7 dots to patches. (D) Histogram of the Snf7 filament radius distribution after nanodissection (total of three experiments, see Figure 4D).
The Snf7 nuclei have an average number of molecules of 60 ± 46 (mean ± SD; n = 1856, Figure 4C). If arranged in a closed ring, it would generate a circle of about 30 nm radius, considering a distance of 3.2 nm between Snf7 monomers in the filaments (Shen et al., 2014) (radius = perimeter / (2π) = (60 × 3.2)/(2 × 3.14) ∼32 nm). This radius corresponds to those observed in rings seen by EM (see Figure 2G), implying that the arrested nuclei observed by TIRF could be closed rings. This supports that Snf7 patch nucleation starts by the appearance of a single, highly curved Snf7 ring that would break to form a spiral. To further confirm this hypothesis, we further showed through photobleaching experiments that breakage of the nuclei induces patch formation (Figures S4B and S4C).
The formation of highly curved nucleation rings suggests that Snf7 filaments have a preferred radius of curvature in the 25–30 nm range. Indeed, we measured radii of a 27 nm radius by EM and estimated a 32 nm radius by TIRF, in line with other studies (21 nm (Shen et al., 2014) and 32 nm (Henne et al., 2012)). In spirals, this preference should not be satisfied, as outer turns are under-curved (123 nm radius, Figure 2C) and inner turns are over-curved (18 nm radius, Figure 2D). These forced suboptimal radii of curvature may induce significant mechanical stresses in the Snf7 filaments, which might in turn underlie Snf7 biological function in membrane deformation.
To explore the existence of such internal stresses, we used the HS-AFM tip as a nanodissector (Scheuring et al., 2003), briefly applying strong forces to partially break a densely packed array of Snf7 spirals. After breakage, 8 large disks were transformed into 29 small circles (Figure 4D), with a radius of 17 ± 5 nm (see size distribution Figure S4D). This is consistent with a scenario where Snf7 filaments were excised by rupture from the outer circles and curled back to a radius closer to their preferred radius. The nanodissector experiment indicated that even if polymerized at low radius of curvature, Snf7 filaments kept their ability to curl into smaller rings.
The radius of these broken filaments (17 nm) is smaller than the one of the initial ring (∼27 nm), but very close to the size of the inner turns in large spirals (18 nm; see Figure 2D). This could be consistent with a preferred radius of curvature of 17 nm. Alternatively, the nanodissector-induced rings experienced the lateral pressure of the neighbors, forcing them to a smaller radius. To discriminate these two hypotheses, we studied the nucleation of new spirals from pre-existing Snf7 assemblies at molecular resolution by HS-AFM. We focused on areas where Snf7 spirals were already packed, but free membrane was still available (Figures 4E and F; Movies S5 and S6). Our image sequences showed that newly formed spirals were mainly initiated from filaments protruding from pre-existing spirals (Figure 4E), revealing the mechanism by which spiral nucleation occurs. The outer radius of these spirals grew with time while forming new turns (Figures 4F and 4G). While growing, bundled filaments can transiently separate and interact laterally with the neighboring bundles (Figure 4H).
Strikingly, when increasing from 2 to 3 concentric circles, the radius of the innermost circle was reduced from 22 nm to 14 nm (Figure 4G). These observations strongly support our hypothesis that the preferred radius of curvature of Snf7 oligomers is about 25 nm, but that lateral pressure can induce higher curvatures.
The radial growth of free spirals was initially rapid, but then slowed down (Figure 4I), roughly following a dependence on the square root of time as expected from our model. From these data, we measured an area growth rate of 80 ± 36 nm2.s−1 (n = 5; see Experimental Procedures for quantification) at 1 μM. We estimated from a growth rate of approximately 3 subunits.s−1.μM−1 (Supplemental Information, Supplemental Mathematical Modeling). The estimated filament growth rate is in the range of other filament rates: actin and tubulin are in the range of 5–10 subunits.s−1.μM−1. Using our previous estimate μm3 and this experimental value for , we obtained the spiral nucleation rate as λ = 8.2 spiral.μm−1.s−1 at [Snf7] = 1 μM. This secondary spiral nucleation rate is 500 times larger than the initial patch nucleation rate (Supplemental Information, Supplemental Mathematical Modeling). It validated our assumption that the patch nucleation was negligible in our theoretical model.
In summary, these observations indicated (1) a preferred high curvature of the Snf7 filaments and (2) the mechanism of spiral nucleation from existing spirals. We then set up to study the third feature of our model, whether lateral contacts between spirals can inhibit their growth.
Polymerization of Snf7 Filaments Induces Compression of the Spirals
AFM images of packed arrays of spirals showed that filaments at the contact zone between spirals were flattened, resulting in spirals acquiring a polygonal shape that was more pronounced for longer incubation times (Figure 5A). Moreover, the central area of some of these polygons was pushed toward the substrate, as seen in the height profile of AFM images (Figure 5B). Also, the centers of these spirals were often found to be stiffer as seen in AFM mechanical maps (Figure 5B). We reasoned that this deformation reflected lateral compression of the spirals as the membrane became covered with Snf7. To study the correlation between polymerization rate and lateral compression of the Snf7 assemblies, we ought to measure them simultaneously.
Figure 5.

Build-up of Lateral Compression in Snf7 Spirals by Polymerization
(A) HS-AFM images of Snf7 spirals acquiring polygonal shapes with time.
(B) AFM Topography and nanomechanical mapping of polygonal Snf7 spirals. A significant proportion of spirals (dashed outlines) have a lower center with increased mechanical stiffness.
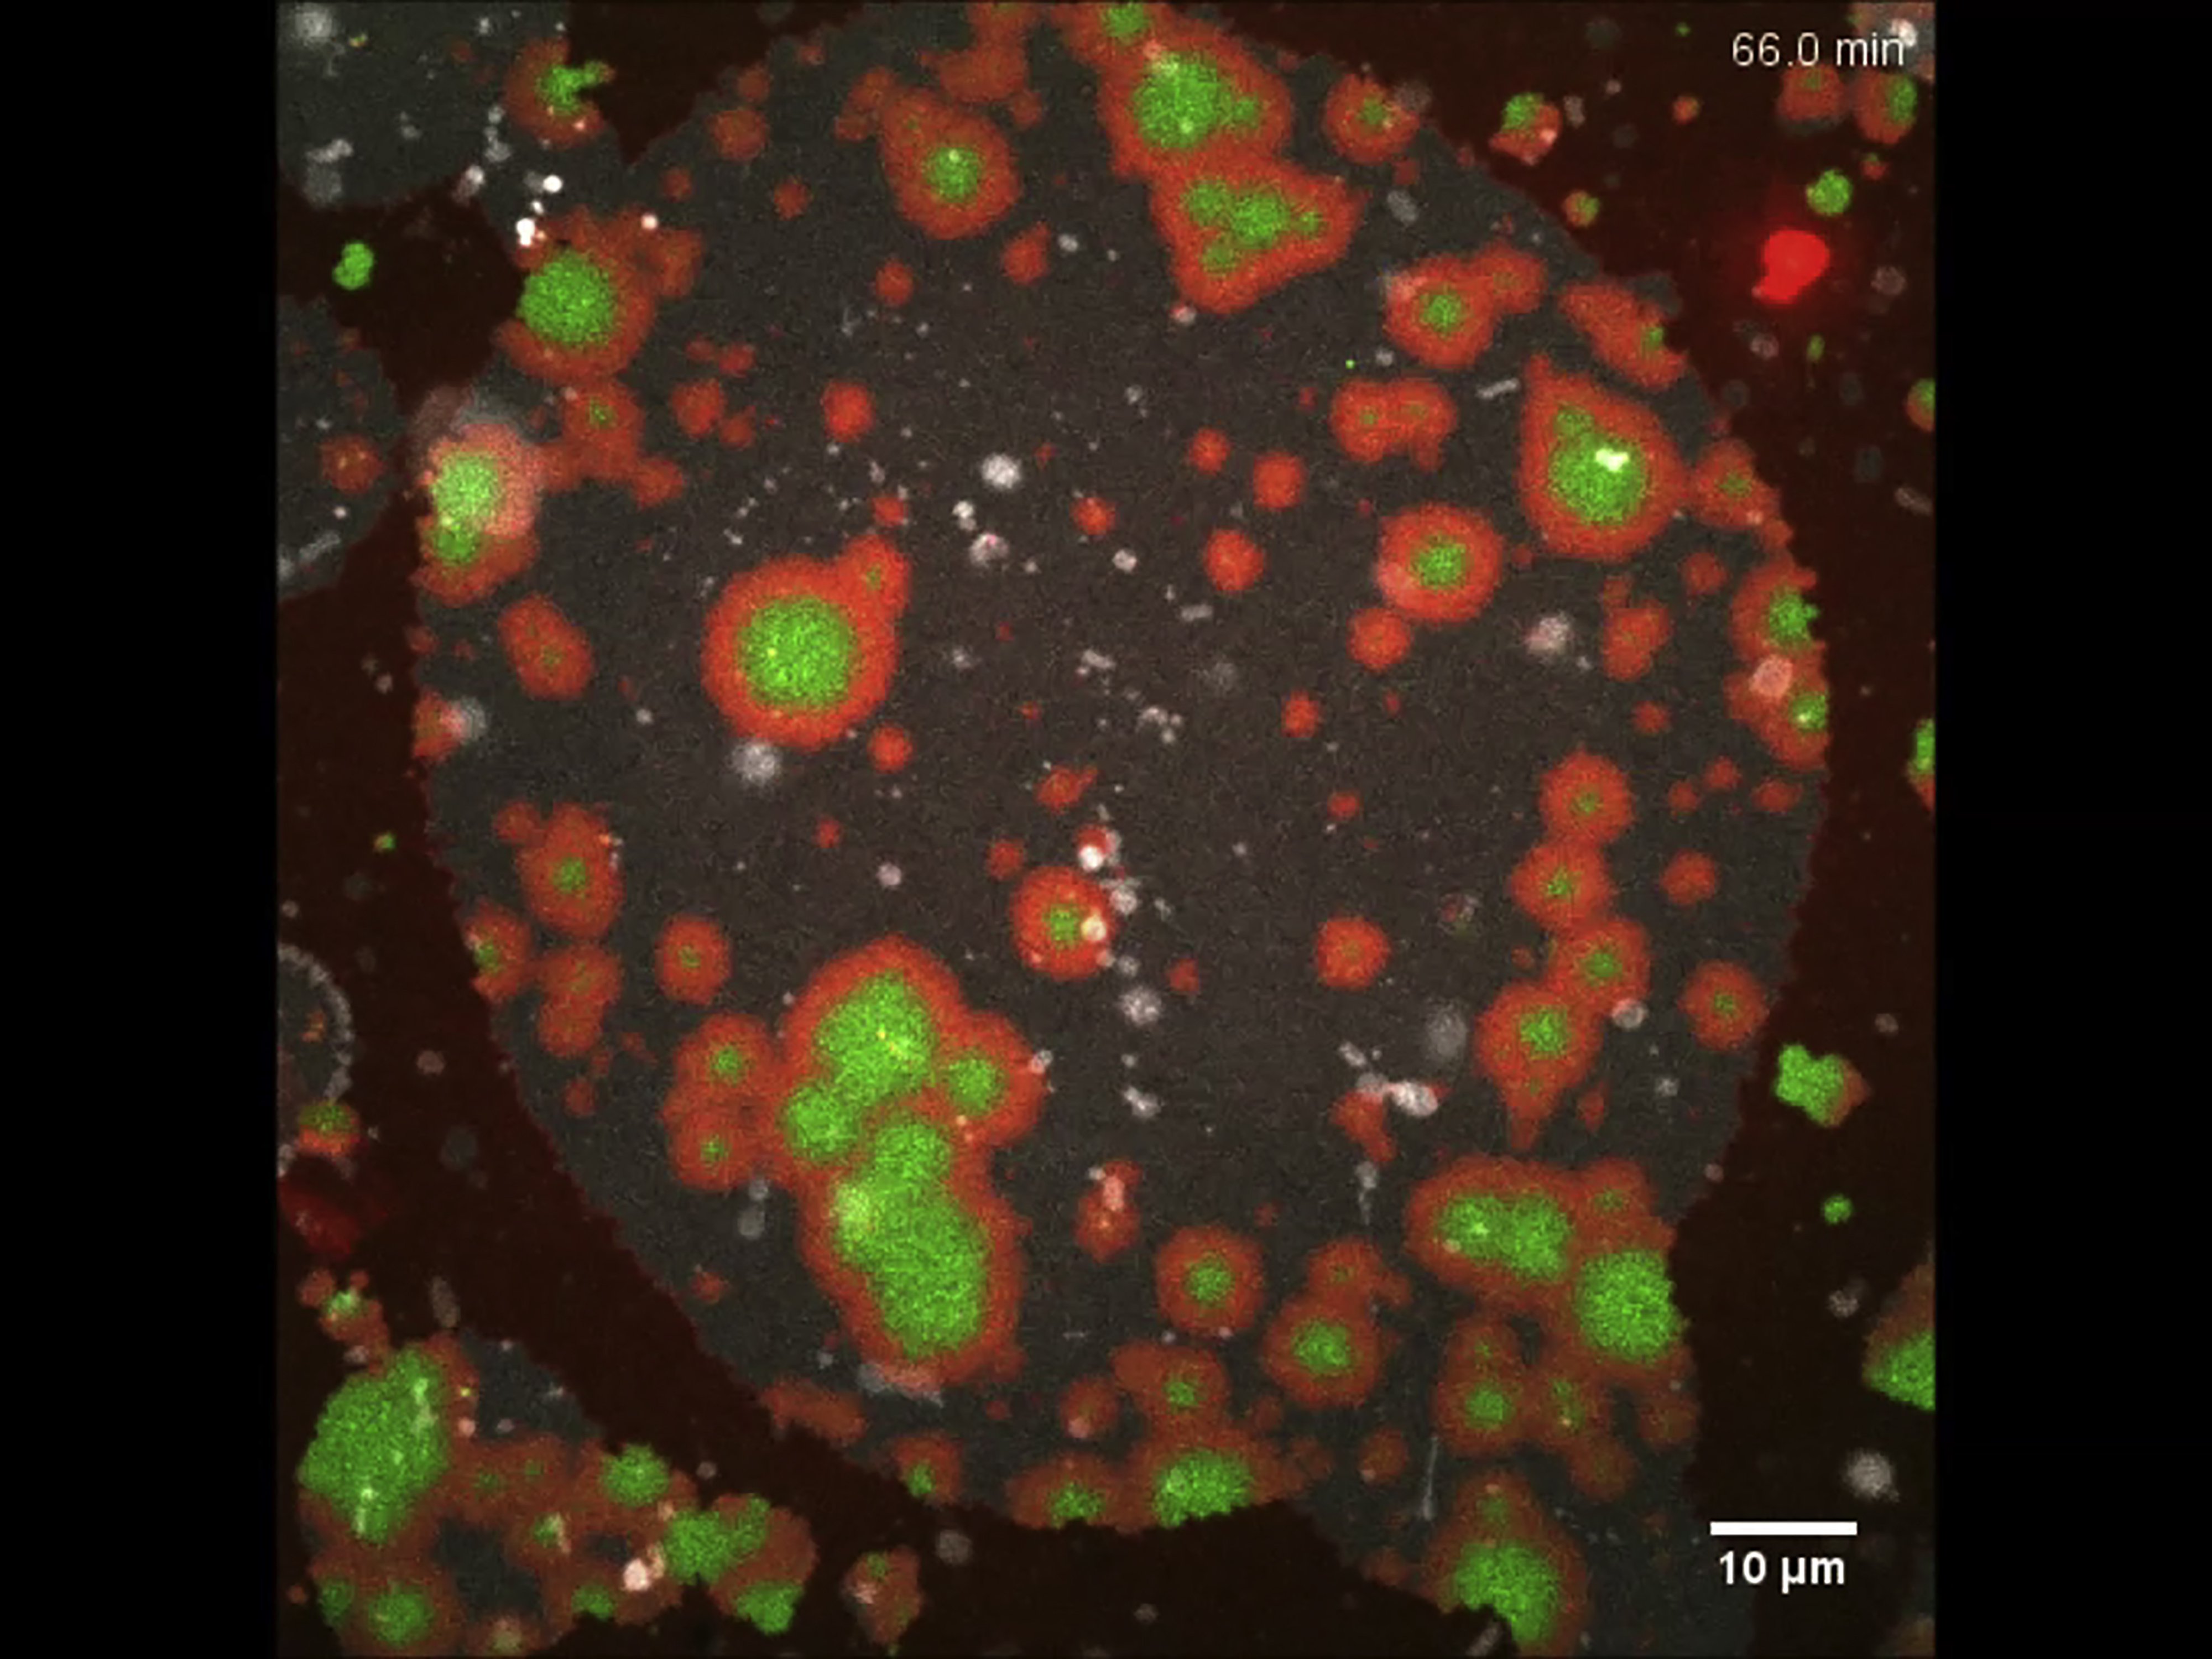
(C) Snf7 polymerization on GUVs made of DOPC 60% / DOPS 40% + Rhodamine-PE 0.1% (red), 0.003% DOPE-Peg2000-Biotin. GUVs are incubated with 500 nM Snf7-Alexa488 (green). Top: SDC images of a GUV equatorial plane during Snf7 polymerization. Bottom: fluorescence intensity (equatorial plane) of 4 GUVs with time.
(D) GUVs before (top) and after (bottom) several hours of incubation with Snf7-Alexa488.
(E) Snf7 coated GUVs keep the aspirated shape after release from the micropipette.
(F) Sketch of membrane stretching by Snf7 spiral compression.
(G) Schematic of the membrane tension measurement setup combining holding pipette, injection pipette, bead within an optical trap, giant vesicle (red) and Snf7 (green).
(H) Top image: SDC image of a membrane tension measurement experiment (red = membrane, green = Snf7-Alexa488). Note that Snf7-Alexa488 did not polymerize on the membrane nanotube. Bottom: brightfield image of the same vesicle. The yellow cross indicates the resting position of the bead held by the optical trap.
(I) Top: Normalized Snf7 fluorescence intensity versus time (measured from equatorial plane); bottom: force exerted by the membrane nanotube on the bead versus time. See also Figure S5.
We started by reconstituting Snf7 polymerization on GUVs adhered to a glass surface, to avoid any displacement during time-lapse imaging (Figure S5A) and followed the increase of Snf7 fluorescence on the vesicle with time. In supported bilayers, which have smaller lipid mobility than free bilayers, diffusion of Snf7 assemblies is very limited. In contrast, Snf7 assemblies had a higher diffusion on GUVs explaining that fluorescence showed a homogeneous distribution (Figure 5C).
Figure S5.

Using GUVs to Study Snf7 Mechanics, Related to Figure 5
(A) Partially adhered GUVs within a flow chamber. Top left: experimental setup to follow partially adhered vesicles within a flow chamber. A coverslip (blue-gray) is coated with avidin (orange) by adsorption. GUVs (red) containing peg-biotin lipids (black arrows) are flowed within the chamber and attach to the glass surface. Passivation of the surface is then made by flowing biotinylated bsa, allowing to keep for long time partially adhered vesicles. Bottom left: GUVs images taken at the coverslip surface showing the adhesion patch of vesicles. Bottom middle: equatorial section of GUVs. Side images: Y-Z and X-Z sections (dashed line) reconstructed from Z optical sections. (B) Comparison between patch coverage dynamics and GUV coverage dynamics. Gray: dynamics equals to the average of 4 GUVs shown Figure 5C. Orange: equivalent to graphs shown Figure S1E for [Snf7] = 500 nM. The initial dynamics is steeper for Snf7 patches but the saturation dynamics is similar. (C) Comparison of the dynamics of surface coverage between GUVs experiments and the mathematical modeling. Orange: dynamics equals to the average of 4 GUVs shown Figure 5C. Gray: result of the mathematical modeling for [Snf7] = 500 nM ( = 40 nm2.s−1 and λ = 8.2 × 10⁻³ spiral.μm−1.s−1). (D) Plastic behavior of strongly coated vesicle, another example of Figure 5E. A round shaped vesicle is being held gently by a pipette (left), then a suction pressure is exerted (middle) to deform the vesicle. Upon pressure release (right), the vesicle keeps the shape of the pipette. (E) Membrane bending rigidity (κ) measurement of a DOPC 60% / DOPS 40% vesicle. Plot of the tether force squared as a function of experimentally imposed membrane tension for the vesicle shown in Figure 5H and 5I. The variation is linear with an expected slope of 8π2κ. The linear fit yields the bending rigidity J.
The dynamics of saturation of Snf7 polymerization over the entire GUV (Figure 5C, bottom) was similar to the dynamics of coverage at a single point in the supported bilayer experiments (Figure S5B): after an approximately exponential increase of the fluorescence, the dynamics of coverage saturated through a progressive slow down phase. If polymerization rate is independent of lateral compression, as it is in our theoretical model, an abrupt arrest of growth is expected (Figure S5C). Conversely, a polymerization rate dependent on lateral compression would cause a progressive slow down until reaching saturation.
As an indication of lateral compression, we noticed that coated GUVs underwent dramatic morphological changes upon several hours of Snf7 polymerization: GUVs were not spherical anymore and instead showed extreme irregular shapes, similar to rigid punched table tennis balls (Figure 5D). Upon aspiration into a micropipette, they deformed plastically (Figure 5E and Figure S5D), showing that the Snf7 solidifies the membrane. These observations are consistent with a scenario where a rigid Snf7 coat generates pressure on the GUVs, stretching their membrane.
We reasoned that the accumulation of lateral compression in the Snf7 coat would stretch the underlying membrane, increasing its tension (Figure 5F). In order to follow the dynamics of accumulation of lateral compression within the Snf7 layer, we directly measured membrane tension generation during Snf7 polymerization. Using optical tweezers, we pulled a thin tether from a GUV held in an aspiration pipette, that allows to monitor membrane tension through the measurement of the force F exerted on the optical tweezers’ bead (Cuvelier et al., 2005) (Figure 5G). We then flowed a 500 nM solution of Snf7 using an injection pipette, which triggered protein assembly onto the membrane (Figure 5H). Monitoring Snf7 fluorescence, we found that its membrane binding dynamics was identical to that measured previously, reaching the saturation value after 10–20 min (Figure 5I, top). Concomitant with this saturation, we observed an increase in the force exerted by the tube, indicating an increase of membrane tension (Figure 5I, bottom). These data show that Snf7 polymerization occurs at a slower rate as compression increases within the Snf7 layer, suggesting a coupling between polymerization and compression. The dependence of the polymerization energy (polymerization energy per unit surface) on the changes in tube force is captured by the expression (Supplemental Information, Supplemental Mathematical Modeling part 4.3):
| (1) |
where and are the tube forces before and after Snf7 polymerization and J, is the membrane bending rigidity (Figure S5E). These values yield J.m−2, which is a fairly high polymerization energy, twice that of clathrin (Saleem et al., 2015), which by itself is able to cause membrane deformation during endocytosis. This indicates that the polymerization force of Snf7 can plausibly cause membrane deformation.
These data are therefore compatible with a scenario where Snf7 spirals act as 2D springs that load themselves through polymerization. Constrained by their neighbors, Snf7 spirals would deform significantly during polymerization, from a disk-like to a polygonal shape, until deformation and polymerization force are balanced. To test quantitatively whether the polymerization force is sufficient to deform Snf7 spirals, we established a theoretical elastic model of spiral compression.
In the model, the Snf7 layer is approximated to a hexagonal lattice of individual spirals. Each spiral is composed of a collection of concentric filaments spaced by a distance nm up to a typical radius nm similar to the experimental data shown in Figure 2C. The filaments are circular in the absence of lateral compression, but may deform into hexagons with rounded vertices, to accommodate tighter packing, as illustrated in Figures 5A and 5F. The amount of energy required to deform circular filaments into more polygonal shapes depend on the stiffness of the Snf7 filaments, which is characterized by its persistence length . We estimated this persistence length from the amplitude of the thermal fluctuations of isolated Snf7 filaments on a supported bilayer observed by HS-AFM. We obtained nm (Supplemental Information, Supplemental Mathematical Modeling part 2). This is in order-of-magnitude agreement with an estimate from a numerical model of Snf7 flexion (Shen et al., 2014). This value is higher than for DNA ( nm), but smaller than for cytoskeletal filaments ( μm for actin and mm for microtubules) (Howard, 2001), implying that they are intrinsically soft enough to be deformed by moderate forces.
In our theoretical 2D spring model, spirals become significantly deformed when exceeds a threshold surface energy (where kB is the Boltzmann constant and T the temperature, see Supplemental Information, Supplemental Mathematical Modeling part 3). Our experimental estimates for (∼130 nm), (17 nm) and (260 nm) implied , 8 times smaller than the measured experimental . It indicates that the Snf7 polymerization energy, even if underestimated, is sufficient to induce strong deformations. Our data show that the Snf7 spirals can deform as spiral springs, and can self-load through a mechanism where deformation is mostly generated by growth of a filament.
Snf7 Spirals Expansion Leads to Membrane Deformation
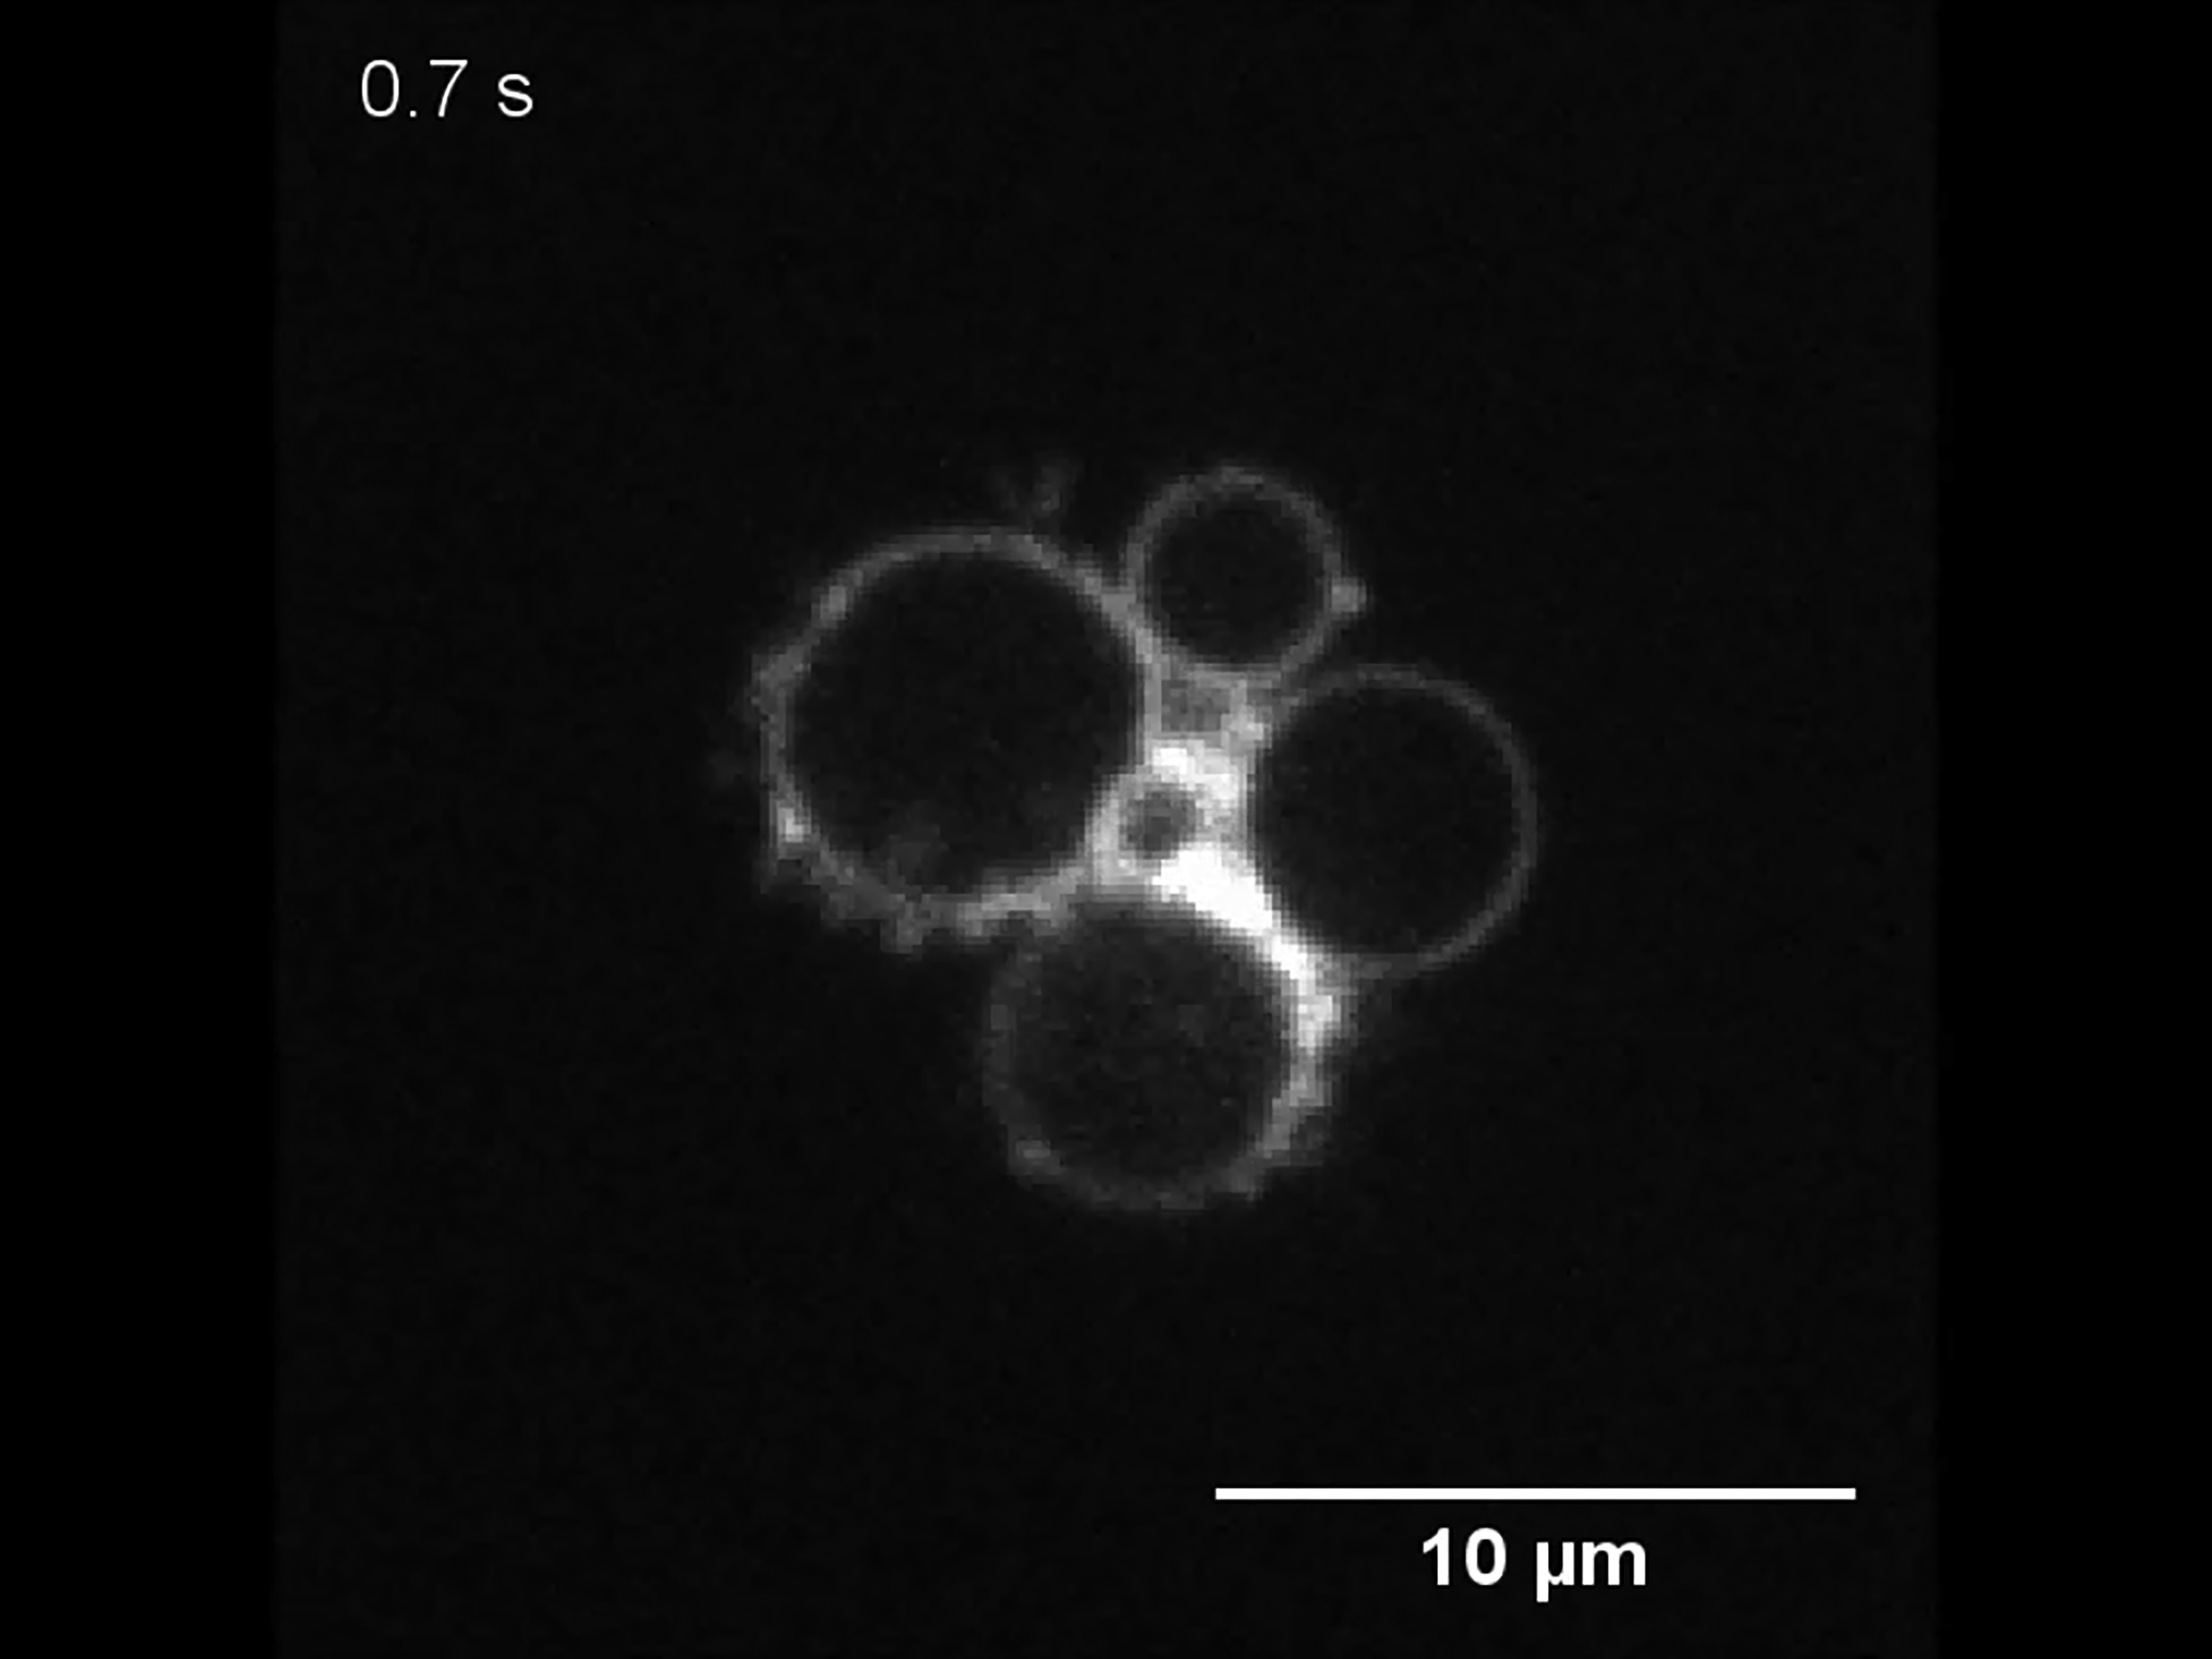
Having established that the Snf7 spirals can deform to store significant elastic energy, we wondered if they could release this energy to deform the membrane. After several hours of Snf7 incubation, holes (called “pores” in the following) spontaneously appeared in a few GUVs, releasing membrane tension. Surprisingly, instead of bursting, the GUV membrane shrunk from the rim of the pore toward the opposite side of the GUV (Movie S7). Occasionally, this process stopped before the vesicle had fully collapsed, and stable vesicles with open pores were observed (Figure 6A; Movie S8). In this case, a stronger fluorescence signal is seen at the rim.
Figure 6.

Snf7 Lateral Pressure and Expansion Induced Membrane Deformations
(A) Confocal sections of Snf7 coated vesicles displaying stable holes. Fluorescence is more intense at the rim of the pore.
(B) EM thin section image of a Snf7 coated vesicle with a stable pore. Note the curling of the membrane rim. Several other examples of membrane curling are shown in lower panels.
(C) Sketch of the expected curvature generated by expansion of compressed Snf7 spirals.
(D) Sketch of the pore opening and curling of Snf7 coated vesicle. Bottom images show the expected section of a stable pore in the GUV and a zoom on the membrane curled region.
To understand the stronger signal of the membrane marker at the rim, we imaged these opened GUVs by thin-section EM: the membrane at the rim of the pore was rolled toward the interior of the vesicle (Figure 6B). This process is known as curling, and has previously been observed in a number of situations, including polymersomes (Mabrouk et al., 2009) and during the bursting of red blood cells (Callan-Jones et al., 2012). It occurs when an area difference appears between the two sides of a bi-layered surface. We hypothesized that curling could be driven by the expansion of the previously compressed Snf7 layer following pore formation. To quantitatively study the plausibility of such scenario, we used our theoretical model to compute the ratio of the surface occupied by a compressed spiral to that of the a relaxed state (see Supplemental Information, Supplemental Mathematical Modeling part 3) as
| (2) |
The value of this ratio implies that, during stress release, the Snf7 layer would expand by 6% relative to the underlying, almost inextensible lipid bilayer (Figure 6C). As a result, the membrane of the GUV would curl inward (Figure 6D), consistently with our observations in fluorescence and electron microscopy. The preferred curvature of the curl can be estimated as , where is the total thickness of the lipid-Snf7 sandwich. Using AFM to measure the thickness of the Snf7 coated membranes, we estimated 2d = 9 nm (5 nm for the membrane plus 4 nm for the Snf7 coat). With this value, we can estimate . Considering previous studies (Callan-Jones et al., 2012), corresponds to the curvature of the innermost roll observed (Figure 6D). Experimentally, we find a mean radius of nm (n = 9). Therefore curling in the opened vesicles can be explained by the expansion of the Snf7 spiral springs. During this expansion, the spirals release their compression energy accumulated during polymerization.
We wondered how much energy was stored in a single spiral, as compared to the energy required for budding of a vesicle. Our elastic model implies that the lateral compression of a single Snf7 spiral corresponds to the accumulation of an elastic energy , which is bigger than the bending energy required to form a spherical membrane bud (see Supplemental Information, Supplemental Mathematical Modeling). Thus, a single spiral can accumulate enough elastic energy to form a spherical bud when released.
In summary, we show here that Snf7 filaments display the ability to act as spiral springs that load through polymerization. The release of the compression stress accumulated during the deformation of the Snf7 spiral is sufficient to drive membrane deformation.
Discussion
In this study, we first showed that lipid membranes trigger the formation of wild-type Snf7 assemblies at their surface through a process of nucleation-growth. The patch nucleation rate is low (less than 1 seed.μm−2.hour−1) which explains the necessity of a polymerization-activated mutant to observe the same assemblies by EM in previous studies (Henne et al., 2012). We found that the circular arrays formed by Snf7 on these membranes are spirals made of a single filament looping and interacting onto itself. This confirms that the interaction with membrane in vitro retains the spiral structure recently observed in solution (Shen et al., 2014) or in vivo (Cashikar et al., 2014, Hanson et al., 2008). We also find that Snf7 filaments can bundle into double-stranded filaments, probably through parallel lateral interactions.
In our assay, spirals become tightly packed into polygonal lattice at the surface of the supported bilayers. The packing of these spirals is correlated with the increase of lateral compression within the Snf7 coat. These data implies that ESCRT-III spirals, because of the relatively high flexibility of the Snf7 filament can be deformed by lateral compression. Moreover, we show that the expansion of compressed spirals can lead to membrane deformation if confinement is released (Figure 6). These observations imply that Snf7 can work as a two-dimensional spring, being able to compress and expand. In the following, we discuss how this spring-like activity highlighted by our study is relevant for the in vivo situation.
In vivo, it is unlikely that a densely packed array of ESCRT-III spirals is present at the surface of membranes, which may question the physiological relevance of the spiral compression observed in large patches of ESCRT-III. But the confinement required for such lateral compression might come from other membrane proteins, which may provide walls into which single spirals could be confined. In the membrane of MVBs, Lamp1 and 2 are particularly enriched (Bissig and Gruenberg, 2014) and may provide a scaffold onto which ESCRT-III spirals could be compressed. Of course, compression being isotropic in this in vivo case, compressed spirals would stay circular, instead of polygonal.
But another source of lateral compression is intrinsic to the spiral structure, and is present in single Snf7 spiral even in the absence of any external confining structures. We show that the filaments curl spontaneously at 20–30 nm, implying that if they grow at a different radius, they are under mechanical stress. Indeed, when spirals are broken, all the pieces of filaments further curl to a smaller radius. Thus, in the spiral structure, filaments with a radius larger than 25 nm are stretched, compressing the inner filaments. Accordingly, we find that even for non-laterally constrained spirals, the inner turn of the spirals tightens when the number of turns in the spirals goes above three.
Whatever the source of compression is, our observations show the ability of Snf7 spirals to deform elastically and accumulate potential energy that can be used for membrane deformation. But how would such energy drive membrane budding? It was previously proposed that the polymerization of ESCRT-III could enclose a patch of membrane and then, by reduction of the length of the Snf7 rim, the membrane would be folded into a bud in the middle of the Snf7 polymer. The ESCRT-III rim reduction has been proposed to be mediated by depolymerization of the Snf7 spiral (lasso model, (Saksena et al., 2009)) or by further inward polymerization of the Snf7 spiral (Cashikar et al., 2014). Our data suggests that Snf7 spiral spring could mediate the rim reduction by its elastic compression down to a 14 nm radius. However in this scenario, because the membrane is fluid, it is difficult to picture how the force of the spiral spring would be transmitted to the membrane. We propose that cargoes play an essential role for the force transmission (Figure 7,left): the rim reduction would lead to compaction of enclosed membrane cargoes. Theoretical (Derganc et al., 2013) and experimental studies (Stachowiak et al., 2012) indicate that highly dense cargoes could mediate budding by asymmetric crowding. This is consistent with a recent in vivo study (Mageswaran et al., 2015) where ILVs budding was critically dependent on accumulation of cargoes within ESCRT-III assemblies.
Figure 7.

Models of ESCRT-III Mediated Budding and Fission of Intra-lumenal Vesicles
Left: cargo sequestration and ESCRT-III lateral compression induces membrane budding. Further ESCRT-III narrowing might lead to fission. Right: ESCRT-III lateral compression leads to buckling.
Another possibility is that the out-of-plane buckling of the spring itself might drive the invagination of the membrane (Figure 7, right) (Lenz et al., 2009), which could explain the formation of membrane tubules by overexpression of the human homolog of Snf7 (Hanson et al., 2008). This model implies that the flat membrane could be a metastable state of this elastic system: the stored elastic energy could be suddenly released upon external activation. Our observation that the spirals adopt a curved inverted dome shape (Figure 5B) is consistent with this model, and an estimate of the energy stored in one spiral further confirm that this energy is sufficient to bud the membrane into a sphere.
The spring-like properties of Snf7 filaments also nourish our understanding of ESCRT-III role in membrane fission. Because of their high flexibility, Snf7 filaments can grow at radii different from their preferred radius of curvature if steric or mechanical constraints force them to do so. This feature explains how Snf7 filaments could adapt to the wide range of radii observed in the various ESCRT-III mediated fission reactions: from microns in abscission and hundreds of nanometer in virus budding, down to tens of nanometers in ILV formation and membrane repair (Jimenez et al., 2014). However, the smallest size of the inner turn is on average 18 nm radius, which is far from the 1.4 nm observed with dynamin to finalize fission (Sundborger et al., 2014). This raises questions regarding the mechanism necessary to provide fission and pore closure and supports the role of other ESCRT-III proteins and lipids in these reactions.
Experimental Procedures
Protein Purification and Labeling
Snf7 (Addgene plasmid no. 21492), Escrt-II (Addgene plasmid no. 17633) and Vps20 (Addgene plasmid no. 21490) were purified as previously described (Hierro et al., 2004, Wollert et al., 2009). Snf7 stock solution was 2.5 μM in 20 mM HEPES, 100 mM NaCl (pH 8). Snf7 was labeled either with TFP-Alexa-488 (Life technologie product no. A37563) or with NHS-Atto 647N (Atto-tec product no. AD 647N-3). Escrt-II (20 μM stock solution in 50 mM Tris, 150 mM NaCl, 5 mM β-mercaptoethanol [pH 7.5]) and Vps20 (10 μM stock solution in 20 mM HEPES 100 mM NaCl [pH 7.5]) were kept unlabeled.
Giant Unilamellar Vesicles and Large Unilamellar Vesicles Preparation
GUVs were prepared by electroformation using DOPC and DOPS mixtures, purchased from Avanti Polar Lipids (Alabaster, USA). When necessary, 0.1% fluorescent lipids (1,2-dioleoyl-sn-glycero-3-phosphoethanolamine-N-(lissamine rhodamine B sulfonyl)) (Rhodamine-PE) were added.
LUVs were prepared by evaporating in a round-bottom glass tube, a volume of lipid mix (DOPC: DOPS, 6:4, mol:mol) containing 1 mg of total lipids. After addition of 200 μl of buffer, the tube was vortexed and freeze-thaw 3 times. This solution is kept at −20°C until use.
Unless otherwise noted, the buffer used for all experiments is composed of 20 mM Tris HCl (pH 6.8), 200 mM NaCl, 1 mM MgCl2.
Optical Microscopy of Membrane Assays
For confocal and TIRF imaging, a coverslip is cleaned with water and ethanol, and then plasma-cleaned for 2 min (PDC-32G, Harrick Plasma, NY, USA). The coverslip is assembled to a flow chamber (sticky-Slide VI 0.4, Ibidi, Munich, Germany), with one entry connected to a syringe pump (Aladdin, World Precision Instruments, Sarasota, FL, USA), and the other left open for sequential introduction of other solutions. The flow chamber is initially filled by 200 μl of buffer. 5 μl of GUVs are flushed in the flow chamber (see Extended Experimental Procedures for methods to get supported membranes or partially adhered vesicles).
Imaging is performed using an inverted microscope assembled by 3i (Intelligent Imaging Innovation, Denver, USA) and Nikon (Eclipse C1, Nikon, Tokyo, Japan). For SDC imaging, a 2-μm-thick volume stack (1 μm above and below the supported membrane) is acquired then rendered to 2D by maximum intensity projection. TIRF Imaging is performed using a motorized Nikon TIRF system. The number of molecules within Snf7 oligomers is estimated by calibrating the microscope with commercially available fluorescent DNA origamis (GATTA-Brightness 9R and 18R, GATTAquant, Braunschweig, Germany) (Figure S6).
Figure S6.

Microscope Calibration with Labeled DNA Origamis, Related to Experimental Procedures
DNA origamis are labeled with Atto-647N (GATTAquant Brightness 9R: 9 Atto-647N molecules and GATTAquant Brightness 18R: 18 Atto-647N molecules). (A) Fluorescence histograms of diffraction limited fluorescent spots (see B) of GATTA-Brightness 9R (blue, n = 985) and GATTA-Brightness 18R (orange, n = 892). (B) Typical field of view of adhered DNA origamis appearing as diffraction limited spots. (C) and (D) Average fluorescence of DNA origamis spots (9R, blue and 18R, orange), varying linearly with laser power (expressed in percentage of maximal output) in (C) and with exposure time in (D). Error bars are SD of each fluorescence distribution measured.
Optical Tweezers Tube Pulling Experiment
A modified version of a published setup (Morlot et al., 2012) allows simultaneous brightfield imaging, SDC microscopy, and optical tweezing on an inverted Nikon eclipse Ti microscope. A GUV is aspirated within a micropipette connected to a motorized micromanipulator (MP-285, Sutter Instrument, Novato, CA, USA) and a pressure control system (MFCS-VAC −69 mbar, Fluigent, Villejuif, France) that sets the aspiration pressure ΔP. A membrane nanotube is then pulled out from the GUV through a streptavidin-coated bead (3.05 μm diameter, Spherotec, Lake Forest, IL, USA) held in a fixed optical trap. The optical trap was custom-made with a continuous 5 W 1064 nm fiber laser (ML5-CW-P-TKS-OTS, Manlight, Lannion, France) focused through a 100X 1.3 NA oil immersion objective. The force F exerted on the bead was calculated from the Hooke’s law: F = k.Δx, where k is the stiffness of the trap (k = 60 pN.μm−1) and Δx the displacement of the bead from its equilibrium position. Snf7 was injected close to the nanotube with a second micropipette connected to another channel of the Fluigent pressure control system.
Electron Microscopy
For negative stain EM observations, LUVs were incubated with Snf7 in suspension, spun down (4 min at 4,000 g), washed and then adsorbed onto glow-discharged Formvar coated EM grids. The samples were negatively stained for 30 s with 2% uranyl acetate before visualization.
Ultrathin sectioning of Snf7 bound LUVs fixed in epon was performed using a microtome (Leica Ultracut) at a cutting angle of 6°. Sections were put on glow-discharged carbon-coated formvar grids and imaged with a Tecnai G2 Sphera (FEI) electron microscope.
AFM and HS-AFM
For both PF-QNM AFM and HS-AFM, GUVs, prepared as described above, were adsorbed to the mica support followed by protein addition. For PF-QNM AFM experiments 5 μl of the GUVs and for HS-AFM experiments 0.5 μl of GUVs were deposited onto freshly cleaved mica supports pre-incubated with adsorption buffer (220 mM NaCl, 10 mM HEPES, 2 mM MgCl2, [pH 7.4]). Supported lipid bilayers were first imaged to assess the quality of the lipid bilayer preparation before injecting Snf7 into the fluid cell to a concentration of ∼500 nM. Formation of Snf7 assemblies were observable ∼30 min after Snf7 injection.
Author Contributions
N.C. and A.R. designed the initial project. N.C performed photonic microscopy and EM experiments. HS-AFM and AFM experiments were designed by L.R.-M, A.C., and S.S., and performed by L.R.-M. and A.C. Theoretical modeling was designed and performed by M.L. F.H. provided technical support for protein purification. All authors performed data analysis and wrote the paper.
Acknowledgments
The authors thank James Hurley and Scott Emr for their kind gifts of plasmids, and Bruno Antonny, Emmanuel Derivery, and Marcos Gonzalez-Gaitan for their useful comments on the manuscript. We thank Emmanuel Derivery for insights throughout the project. We thank Gorana Perrelet and Pilar Ruga Fahy for help for the EM samples. We thank Guillaume Molinard and Sarah Machado for careful reading of this manuscript and help with figure artwork. We thank GATTAquant GmbH for the kind gift of GATTA-Brightness 9R and 18R. A.R. acknowledges funding support from: Human Frontier Science Program (HFSP), Young Investigator Grant #RGY0076-2008: the European Research Council (ERC), starting (consolidator) grant #311536-MEMFIS: the Swiss National Fund for Research, grants #131003A_130520 and #131003A_149975. N.C. acknowledges the European Commission for the Marie-Curie post-doctoral fellowship CYTOCUT #300532-2011. S.S. acknowledges funding support from: Agence Nationale de la Recherche, France (ANR), ANR-Nano (ANR-12-BS10-009-01) and ANR-BBMS (ANR-12-BSV8-0006-01) grants, and a European Research Council (ERC) starting (consolidator) grant #310080-MEM-STRUCT-AFM. ML’s group belongs to the CNRS consortium CellTiss and is supported by grants from Université Paris-Sud and CNRS, Marie Curie Integration Grant PCIG12-GA-2012-334053 and “Investissements d’Avenir” LabEx PALM (ANR-10-LABX-0039-PALM).
Published: October 29, 2015
Footnotes
This is an open access article under the CC BY-NC-ND license (http://creativecommons.org/licenses/by-nc-nd/4.0/).
Supplemental Information includes Supplemental Experimental Procedures, six figures, and eight movies and can be found with this article online at http://dx.doi.org/10.1016/j.cell.2015.10.017.
Contributor Information
Simon Scheuring, Email: simon.scheuring@inserm.fr.
Aurélien Roux, Email: aurelien.roux@unige.ch.
Supplemental Information
DOPC 80% / DOPS 20% Rhodamine labeled membrane (0.1%) bursting on glass coverslips.
DOPC 60% / DOPS 40% Rhodamine labeled membrane (0.1%) with Snf7-Alexa 488 labeled, 200 nM. To create Snf7 seed, Snf7 was incubated at 350 nM for 5 min on the membrane before the concentration of Snf7 was reduced to 200 nM.
DOPC 60% / DOPS 40% Rhodamine labeled membrane 0.1% (gray channel) are first incubated with Snf7-Alexa488 labeled (green channel) at 200 nM then with Snf7-Atto647N at 200 nM (red channel) then back with Snf7-Alexa488 at 200 nM.
References
- Adell M.A.Y., Vogel G.F., Pakdel M., Müller M., Lindner H., Hess M.W., Teis D. Coordinated binding of Vps4 to ESCRT-III drives membrane neck constriction during MVB vesicle formation. J. Cell Biol. 2014;205:33–49. doi: 10.1083/jcb.201310114. [DOI] [PMC free article] [PubMed] [Google Scholar]
- Babst M., Katzmann D.J., Estepa-Sabal E.J., Meerloo T., Emr S.D. Escrt-III: an endosome-associated heterooligomeric protein complex required for mvb sorting. Dev. Cell. 2002;3:271–282. doi: 10.1016/s1534-5807(02)00220-4. [DOI] [PubMed] [Google Scholar]
- Bissig C., Gruenberg J. ALIX and the multivesicular endosome: ALIX in Wonderland. Trends Cell Biol. 2014;24:19–25. doi: 10.1016/j.tcb.2013.10.009. [DOI] [PubMed] [Google Scholar]
- Buchkovich N.J., Henne W.M., Tang S., Emr S.D. Essential N-terminal insertion motif anchors the ESCRT-III filament during MVB vesicle formation. Dev. Cell. 2013;27:201–214. doi: 10.1016/j.devcel.2013.09.009. [DOI] [PubMed] [Google Scholar]
- Callan-Jones A., Albarran Arriagada O.E., Massiera G., Lorman V., Abkarian M. Red blood cell membrane dynamics during malaria parasite egress. Biophys. J. 2012;103:2475–2483. doi: 10.1016/j.bpj.2012.11.008. [DOI] [PMC free article] [PubMed] [Google Scholar]
- Carlton J.G., Agromayor M., Martin-Serrano J. Differential requirements for Alix and ESCRT-III in cytokinesis and HIV-1 release. Proc. Natl. Acad. Sci. USA. 2008;105:10541–10546. doi: 10.1073/pnas.0802008105. [DOI] [PMC free article] [PubMed] [Google Scholar]
- Cashikar A.G., Shim S., Roth R., Maldazys M.R., Heuser J.E., Hanson P.I. Structure of cellular ESCRT-III spirals and their relationship to HIV budding. eLife. 2014;3:e02184. doi: 10.7554/eLife.02184. [DOI] [PMC free article] [PubMed] [Google Scholar]
- Casuso I., Khao J., Chami M., Paul-Gilloteaux P., Husain M., Duneau J.-P., Stahlberg H., Sturgis J.N., Scheuring S. Characterization of the motion of membrane proteins using high-speed atomic force microscopy. Nat. Nanotechnol. 2012;7:525–529. doi: 10.1038/nnano.2012.109. [DOI] [PubMed] [Google Scholar]
- Coonrod E.M., Stevens T.H. The yeast vps class E mutants: the beginning of the molecular genetic analysis of multivesicular body biogenesis. Mol. Biol. Cell. 2010;21:4057–4060. doi: 10.1091/mbc.E09-07-0603. [DOI] [PMC free article] [PubMed] [Google Scholar]
- Cuvelier D., Derényi I., Bassereau P., Nassoy P. Coalescence of membrane tethers: experiments, theory, and applications. Biophys. J. 2005;88:2714–2726. doi: 10.1529/biophysj.104.056473. [DOI] [PMC free article] [PubMed] [Google Scholar]
- Derganc J., Antonny B., Copič A. Membrane bending: the power of protein imbalance. Trends Biochem. Sci. 2013;38:576–584. doi: 10.1016/j.tibs.2013.08.006. [DOI] [PubMed] [Google Scholar]
- Elia N., Sougrat R., Spurlin T.A., Hurley J.H., Lippincott-Schwartz J. Dynamics of endosomal sorting complex required for transport (ESCRT) machinery during cytokinesis and its role in abscission. Proc. Natl. Acad. Sci. USA. 2011;108:4846–4851. doi: 10.1073/pnas.1102714108. [DOI] [PMC free article] [PubMed] [Google Scholar]
- Fabrikant G., Lata S., Riches J.D., Briggs J.A., Weissenhorn W., Kozlov M.M. Computational model of membrane fission catalyzed by ESCRT-III. PLoS Comput. Biol. 2009;5:e1000575. doi: 10.1371/journal.pcbi.1000575. [DOI] [PMC free article] [PubMed] [Google Scholar]
- Guizetti J., Schermelleh L., Mäntler J., Maar S., Poser I., Leonhardt H., Müller-Reichert T., Gerlich D.W. Cortical constriction during abscission involves helices of ESCRT-III-dependent filaments. Science. 2011;331:1616–1620. doi: 10.1126/science.1201847. [DOI] [PubMed] [Google Scholar]
- Hanson P.I., Roth R., Lin Y., Heuser J.E. Plasma membrane deformation by circular arrays of ESCRT-III protein filaments. J. Cell Biol. 2008;180:389–402. doi: 10.1083/jcb.200707031. [DOI] [PMC free article] [PubMed] [Google Scholar]
- Henne W.M., Buchkovich N.J., Zhao Y., Emr S.D. The endosomal sorting complex ESCRT-II mediates the assembly and architecture of ESCRT-III helices. Cell. 2012;151:356–371. doi: 10.1016/j.cell.2012.08.039. [DOI] [PubMed] [Google Scholar]
- Hierro A., Sun J., Rusnak A.S., Kim J., Prag G., Emr S.D., Hurley J.H. Structure of the ESCRT-II endosomal trafficking complex. Nature. 2004;431:221–225. doi: 10.1038/nature02914. [DOI] [PubMed] [Google Scholar]
- Howard J. Sinauer Associates; Sunderland, Massachusetts: 2001. Mechanics of Motor Proteins and the Cytoskeleton. [Google Scholar]
- Jimenez A.J., Maiuri P., Lafaurie-Janvore J., Divoux S., Piel M., Perez F. ESCRT machinery is required for plasma membrane repair. Science. 2014;343:1247136. doi: 10.1126/science.1247136. [DOI] [PubMed] [Google Scholar]
- Lata S., Schoehn G., Jain A., Pires R., Piehler J., Gottlinger H.G., Weissenhorn W. Helical structures of ESCRT-III are disassembled by VPS4. Science. 2008;321:1354–1357. doi: 10.1126/science.1161070. [DOI] [PMC free article] [PubMed] [Google Scholar]
- Lenz M., Crow D.J., Joanny J.-F. Membrane buckling induced by curved filaments. Phys. Rev. Lett. 2009;103:038101. doi: 10.1103/PhysRevLett.103.038101. [DOI] [PubMed] [Google Scholar]
- Mabrouk E., Cuvelier D., Brochard-Wyart F., Nassoy P., Li M.-H. Bursting of sensitive polymersomes induced by curling. Proc. Natl. Acad. Sci. USA. 2009;106:7294–7298. doi: 10.1073/pnas.0813157106. [DOI] [PMC free article] [PubMed] [Google Scholar]
- Mageswaran S.K., Johnson N.K., Odorizzi G., Babst M. Constitutively active ESCRT-II suppresses the MVB-sorting phenotype of ESCRT-0 and ESCRT-I mutants. Mol. Biol. Cell. 2015;26:554–568. doi: 10.1091/mbc.E14-10-1469. [DOI] [PMC free article] [PubMed] [Google Scholar]
- McCullough J., Colf L.A., Sundquist W.I. Membrane fission reactions of the mammalian ESCRT pathway. Annu. Rev. Biochem. 2013;82:663–692. doi: 10.1146/annurev-biochem-072909-101058. [DOI] [PMC free article] [PubMed] [Google Scholar]
- Morlot S., Galli V., Klein M., Chiaruttini N., Manzi J., Humbert F., Dinis L., Lenz M., Cappello G., Roux A. Membrane shape at the edge of the dynamin helix sets location and duration of the fission reaction. Cell. 2012;151:619–629. doi: 10.1016/j.cell.2012.09.017. [DOI] [PMC free article] [PubMed] [Google Scholar]
- Pires R., Hartlieb B., Signor L., Schoehn G., Lata S., Roessle M., Moriscot C., Popov S., Hinz A., Jamin M. A crescent-shaped ALIX dimer targets ESCRT-III CHMP4 filaments. Structure. 2009;17:843–856. doi: 10.1016/j.str.2009.04.007. [DOI] [PMC free article] [PubMed] [Google Scholar]
- Saksena S., Wahlman J., Teis D., Johnson A.E., Emr S.D. Functional reconstitution of ESCRT-III assembly and disassembly. Cell. 2009;136:97–109. doi: 10.1016/j.cell.2008.11.013. [DOI] [PMC free article] [PubMed] [Google Scholar]
- Saleem M., Morlot S., Hohendahl A., Manzi J., Lenz M., Roux A. A balance between membrane elasticity and polymerization energy sets the shape of spherical clathrin coats. Nat. Commun. 2015;6:6249. doi: 10.1038/ncomms7249. [DOI] [PMC free article] [PubMed] [Google Scholar]
- Scheuring S., Seguin J., Marco S., Lévy D., Robert B., Rigaud J.-L. Nanodissection and high-resolution imaging of the Rhodopseudomonas viridis photosynthetic core complex in native membranes by AFM. Atomic force microscopy. Proc. Natl. Acad. Sci. USA. 2003;100:1690–1693. doi: 10.1073/pnas.0437992100. [DOI] [PMC free article] [PubMed] [Google Scholar]
- Shen Q.-T., Schuh A.L., Zheng Y., Quinney K., Wang L., Hanna M., Mitchell J.C., Otegui M.S., Ahlquist P., Cui Q., Audhya A. Structural analysis and modeling reveals new mechanisms governing ESCRT-III spiral filament assembly. J. Cell Biol. 2014;206:763–777. doi: 10.1083/jcb.201403108. [DOI] [PMC free article] [PubMed] [Google Scholar]
- Stachowiak J.C., Schmid E.M., Ryan C.J., Ann H.S., Sasaki D.Y., Sherman M.B., Geissler P.L., Fletcher D.A., Hayden C.C. Membrane bending by protein-protein crowding. Nat. Cell Biol. 2012;14:944–949. doi: 10.1038/ncb2561. [DOI] [PubMed] [Google Scholar]
- Sundborger A.C., Fang S., Heymann J.A., Ray P., Chappie J.S., Hinshaw J.E. A dynamin mutant defines a superconstricted prefission state. Cell Rep. 2014;8:734–742. doi: 10.1016/j.celrep.2014.06.054. [DOI] [PMC free article] [PubMed] [Google Scholar]
- von Schwedler U.K., Stuchell M., Müller B., Ward D.M., Chung H.-Y., Morita E., Wang H.E., Davis T., He G.-P., Cimbora D.M. The protein network of HIV budding. Cell. 2003;114:701–713. doi: 10.1016/s0092-8674(03)00714-1. [DOI] [PubMed] [Google Scholar]
- Wollert T., Hurley J.H. Molecular mechanism of multivesicular body biogenesis by ESCRT complexes. Nature. 2010;464:864–869. doi: 10.1038/nature08849. [DOI] [PMC free article] [PubMed] [Google Scholar]
- Wollert T., Wunder C., Lippincott-Schwartz J., Hurley J.H. Membrane scission by the ESCRT-III complex. Nature. 2009;458:172–177. doi: 10.1038/nature07836. [DOI] [PMC free article] [PubMed] [Google Scholar]
Associated Data
This section collects any data citations, data availability statements, or supplementary materials included in this article.
Supplementary Materials
DOPC 80% / DOPS 20% Rhodamine labeled membrane (0.1%) bursting on glass coverslips.
DOPC 60% / DOPS 40% Rhodamine labeled membrane (0.1%) with Snf7-Alexa 488 labeled, 200 nM. To create Snf7 seed, Snf7 was incubated at 350 nM for 5 min on the membrane before the concentration of Snf7 was reduced to 200 nM.
DOPC 60% / DOPS 40% Rhodamine labeled membrane 0.1% (gray channel) are first incubated with Snf7-Alexa488 labeled (green channel) at 200 nM then with Snf7-Atto647N at 200 nM (red channel) then back with Snf7-Alexa488 at 200 nM.