

Background: PatZ is the main Escherichia coli acetyltransferase and controls acetyl-CoA synthetase (Acs) activity.
Results: The kinetic and structural PatZ oligomer characteristics were determined.
Conclusion: PatZ is a stable tetramer and forms an active octamer by autoacetylation to increase its stability.
Significance: PTMs by acetylation have structural and functional roles in the cell.
Keywords: acetyl coenzyme A (acetyl-CoA), acetyl-CoA synthetase, acetyltransferase, Escherichia coli (E. coli), post-translational modification (PTM), protein acetyltransferase (PatZ or YfiQ), autoacetylation, lysine acetylation, oligomerization
Abstract
Lysine acetylation is an important post-translational modification in the metabolic regulation of both prokaryotes and eukaryotes. In Escherichia coli, PatZ (formerly YfiQ) is the only known acetyltransferase protein and is responsible for acetyl-CoA synthetase acetylation. In this study, we demonstrated PatZ-positive cooperativity in response to acetyl-CoA and the regulation of acetyl-CoA synthetase activity by the acetylation level. Furthermore, functional analysis of an E809A mutant showed that the conserved glutamate residue is not relevant for the PatZ catalytic mechanism. Biophysical studies demonstrated that PatZ is a stable tetramer in solution and is transformed to its octameric form by autoacetylation. Moreover, this modification is reversed by the sirtuin CobB. Finally, an in silico PatZ tetramerization model based on hydrophobic and electrostatic interactions is proposed and validated by three-dimensional hydrodynamic analysis. These data reveal, for the first time, the structural regulation of an acetyltransferase by autoacetylation in a prokaryotic organism.
Introduction
Post-translational modification (PTM)3 of proteins by lysine acetylation has been traditionally associated with eukaryotic organisms. However, in recent years, interest in PTM in prokaryotic organisms has increased greatly (1). Many metabolic enzymes are known to be acetylated in Escherichia coli (2), although the physiological importance of acetylation has not been studied in detail. Acetylation has traditionally been described as a reversible PTM catalyzed by an acetyltransferase (KAT) with acetyl-CoA as the acetyl donor. Recently, however, the importance of nonenzymatic acetylation has been discovered, using acetyl-CoA or acetyl phosphate as acetyl donors in prokaryotic and eukaryotic organisms (2–4).
In E. coli, the Nϵ-acetyltransferase PatZ is the only enzyme known to be involved in the post-translational acetylation of proteins. PatZ is an acetyltransferase belonging to the GCN5-related N-acetyltransferase (GNAT) superfamily, which catalyzes the transfer of an acetyl group from acetyl-CoA to a primary amine (5). PatZ is a large multidomain protein with 886 residues (∼98 kDa) that has a C-terminal acetyl-CoA binding fold whose predicted structure belongs to the large GNAT superfamily of acetyltransferases (residues 725–884). The N-terminal domain is a predicted domain with high similarity to the acyl-CoA synthetase (NDP-forming) superfamily of enzymes (residues 3–625) (6). Many members of this family are oligomeric proteins (7). In fact, SePat, Salmonella enterica PatZ ortholog, oligomerizes to a tetramer due to its binding to acetyl-CoA (8).
It has recently been described that in E. coli PatZ is acetylated in vivo (2, 9), although the consequences of PatZ acetylation are not known. Regarding the acetyltransferase catalytic mechanism, it has not been studied in bacteria, although studies carried out in other GNAT suggest the existence of two possible mechanisms, a bi-bi sequential and a ping-pong catalytic mechanism (10–14).
One of the best known PatZ substrates is acetyl-CoA synthetase (Acs), an enzyme regulated by acetylation in bacteria such as S. enterica, E. coli, Bacillus subtilis, Rhodopseudomonas palustris, and Mycobacterium tuberculosis (15–19). In E. coli, the reversible lysine acetylation of Acs is mainly regulated by two enzymes, the GCN5-like acetyltransferase Pat/YfiQ (15–19) and the NAD+-dependent sirtuin-like deacetylase CobB (16–20). Acs is a key enzyme in prokaryotic and eukaryotic metabolism because it synthesizes acetyl-CoA from acetate, ATP, and CoA via an acetyl-adenosine monophosphate (acetyl-AMP) intermediate and is involved in metabolism homeostasis due to its direct link with acetyl-CoA. Moreover, acetyl-CoA is involved in the energy metabolism, acting as substrate and playing a critical role in overall metabolism modulation, which makes it a key operator in the regulation of metabolic fluxes. It is important to note that in exponentially growing aerobic cultures of E. coli, cytosolic acetyl-CoA concentrations vary from 0.5 to 0.6 mm with glucose and from 0.2 to 1.7 mm with acetate as the sole carbon sources (21). In this sense, the Acs enzyme is essential in limited carbon source conditions accompanied by a low extracellular concentration of acetate (22, 23).
Hence, the main objective of this study was to ascertain the kinetic and biochemical characteristics of PatZ and its effect on the regulation of Acs by lysine acetylation. This characterization will provide a deeper understanding of protein acetylation in E. coli.
Experimental Procedures
Construction of PatZ Overexpression Plasmids
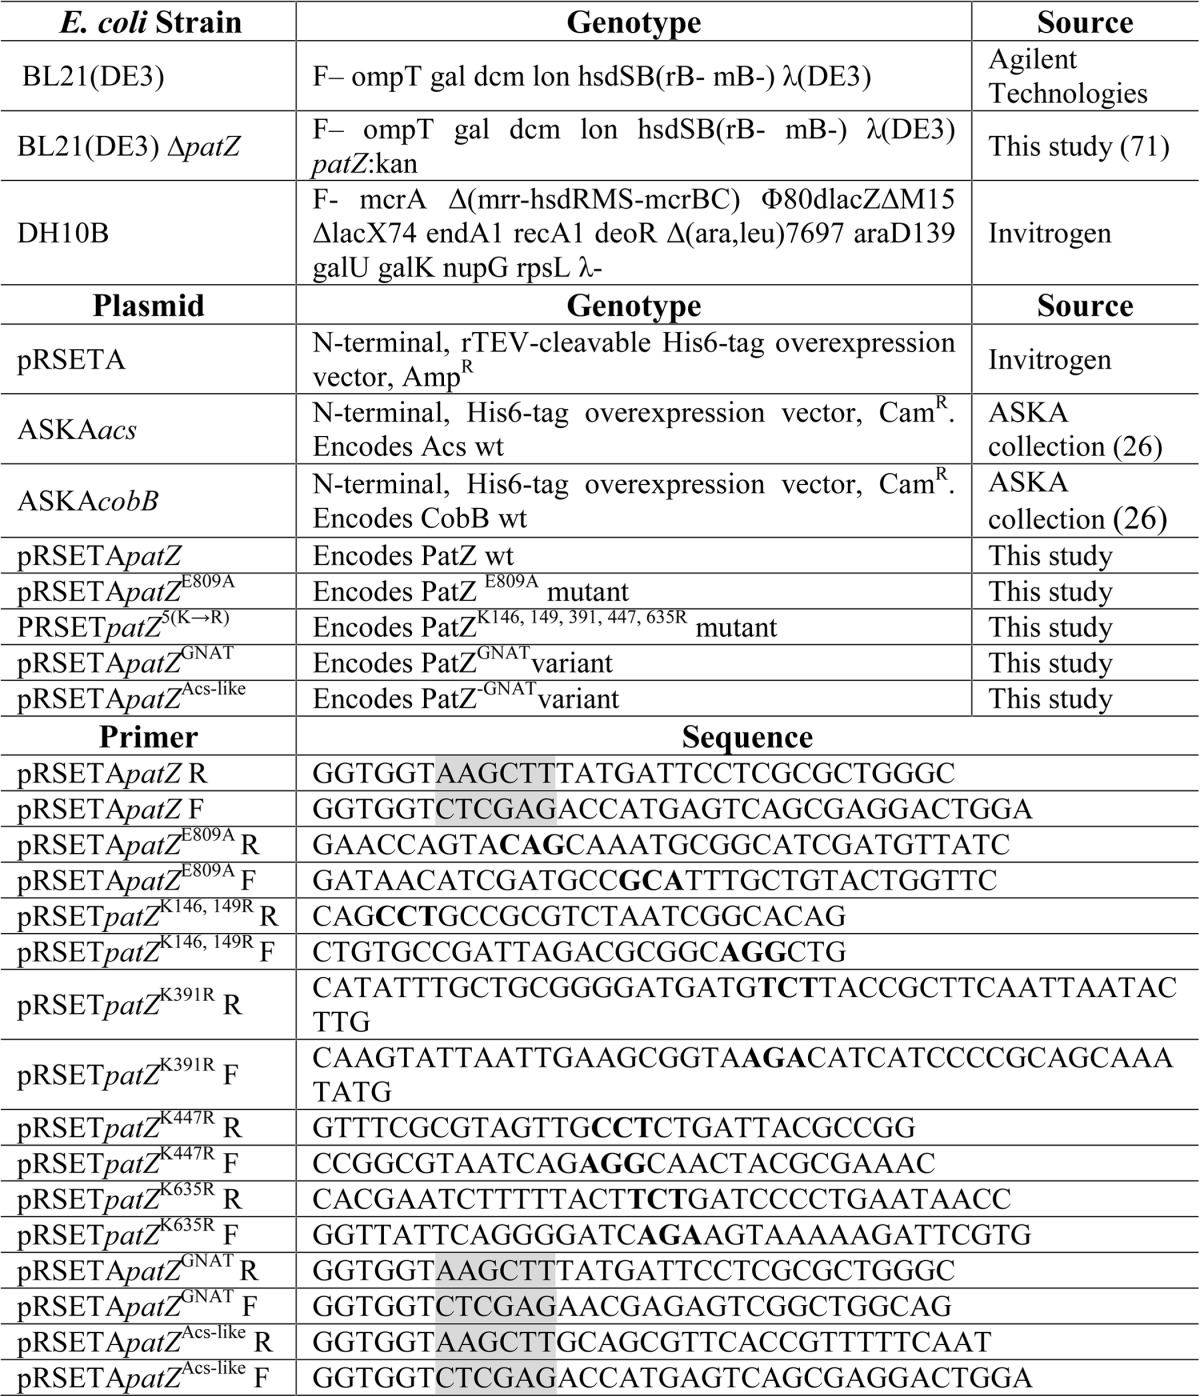
The 2658-bp patZ gene of E. coli BW25113 was PCR-amplified and cloned into the pRSETA plasmid. The resulting plasmid was named pRSETpatZ. Single amino acid mutant E809A was obtained by site-directed mutagenesis from pRSETpatZ using PCR. The resulting plasmid was named pRSETpatZE809A. The quintuple-mutant (substitution of lysines at positions 146, 149, 391, 447, and 635 for arginines) was obtained by sequential site-directed mutagenesis from pRSETpatZ. The resulting plasmid was named pRSERpatZ5(K→R). The 2100-bp fragment corresponding to a truncated acetyltransferase-defective patZ gene (1–2100 bp) was PCR-amplified and cloned into the pRSETA plasmid. The resulting plasmid was named pRSETpatZAcs-like. The 558-bp fragment encoding the GNAT domain of PatZ (2100–2658 bp) was cloned the same way, resulting in plasmid pRSETpatZGNAT. The Acs and CobB proteins were overexpressed using the ASKA collection plasmids (24). All molecular biology enzymes used were from Thermo Fisher Scientific. The strains, plasmids, and primers used are listed in Table 1.
TABLE 1.
Strains, plasmids, and primers used in this study
Restriction nuclease sites are in grey. Bold typeface indicates the modified codon during site-directed-mutagenesis.
Overproduction and Purification of Proteins
Chemically competent E. coli BL21(DE3) wild type or ΔpatZ strains were transformed by heat shock at 42 °C. Cultures were grown overnight at 30 °C with orbital shaking (200 rpm). The culture medium used was Terrific broth (12 g/liter tryptone, 24 g/liter yeast extract, 4% v/v glycerol, 0.17 m KH2PO4, and 0.72 m K2HPO4) containing ampicillin (100 μg/ml) (for pRSETA) or chloramphenicol (30 μg/ml) (for ASKA plasmids). The expression was induced with isopropyl β-d-thiogalactopyranoside, 1 mm (for pRSETA), or 0.1 mm (for ASKA plasmids). Cells were harvested by centrifugation, thoroughly washed with 0.9% NaCl, and resuspended in 10 ml of binding buffer (50 mm potassium phosphate, pH 7.5, containing 500 mm NaCl, and 20 mm imidazole), supplemented with EDTA-free protease inhibitor (SigmaFast Protease Inhibitor Mixture Tablet, from Sigma). Cells were lysed by sonication for 2 min (20 s each pulse) on ice using a Vibra Cell sonicator (Sonicator Sonics & Materials). The lysates were clarified by centrifugation at 10,000 × g for 15 min at 4 °C.
Recombinant proteins were purified by immobilized metal affinity chromatography. The cell-free extract was loaded onto a 5-ml HisGraviTrap column (GE Healthcare) and washed with washing buffer (50 mm potassium phosphate buffer, pH 7.5, containing 500 mm NaCl and 50 mm imidazole). The His6-tagged proteins were eluted with an elution buffer (50 mm potassium phosphate buffer, pH 7.5, containing 500 mm NaCl and 500 mm imidazole). The salts and imidazole from protein-containing fractions were removed with a PD-10 Sephadex G-25 column (GE Healthcare). Purified proteins were kept in storage buffer (50 mm potassium phosphate buffer, pH 7.5, containing 100 mm NaCl and 10% v/v glycerol) at −80 °C until used. Finally, Amicon Ultracentrifugal-15 filters (Millipore) were used to concentrate the proteins.
SDS-PAGE and Native Electrophoresis
Proteins were analyzed by SDS-PAGE on 10% acrylamide gels using a Mini-Protean cell (Bio-Rad). For native electrophoresis, native PAGE 4–16% BisTris gels and native unstained Protein Standard (Life Technologies, Inc.) were used. The proteins were detected by Coomassie Blue staining (Thermo Fisher Scientific).
Detection of Lysine-acetylated Proteins by Western Blot Analysis
Lysine-acetylated proteins were separated by SDS-PAGE or native-PAGE. The proteins were transferred to PVDF membranes using a semidry transfer unit (Trans-Blot® SD Semi-Dry Transfer Cell, Bio-Rad). The membranes were incubated with a primary rabbit monoclonal anti-acetyl-lysine antibody (ImmuneChem) and a goat anti-rabbit IgG secondary antibody (Santa Cruz Biotechnology). Finally, the membrane was incubated for 10 min with Amersham Biosciences ECL Western blotting detection reagent (Thermo Scientific).
Acetylation and Deacetylation Assays
All acetyltransferase/deacetylase enzymatic experiments were performed at 37 °C in 50 mm potassium phosphate buffer at pH 7.5 with a reaction volume of 200 μl. A blank assay without enzyme under the same conditions was carried out to subtract the chemical hydrolysis of acetyl-CoA. The concentration of the TNB2− anion was determined using a molar extinction coefficient of 15.53 mm−1 cm−1, which was experimentally determined from the slopes of three independent experiments using 62.5 to 500 μm cysteine and 0.3 mm 5,5′-dithiobis-2-nitrobenzoic acid as standard. The amount of purified PatZ enzyme was optimized. Experiments were carried out at a PatZ concentration of 60 nm. The initial rates of color development, obtained as milliunits of absorbance per min at 412 nm (Synergy HT spectrophotometer, Bio-Tek), were converted to units of absorbance per min by means of the PathCheck Sensor feature. Pseudo first-order kinetic parameters were determined using Prism version 6 (GraphPad) analytical software. A nonenzyme control was used to correct the background.
Data for Acs and PatZ autoacetylation were fitted to the following equation: V0 = (Vmax × [S])/(Km + [S]), where V0 is the initial velocity; Vmax is the maximum velocity; [S] is the substrate concentration, and Km is the substrate concentration for half-maximal velocity.
Data for acetyl-CoA were fitted to the following equation: V0 = Vmax × [S]h)/(K0.5h + [S]h), where h represents the Hill coefficient and K0.5h denotes the substrate concentration for half-maximal velocity. The parameters were determined from curves with an r2 value of 0.98. Deacetylation assays were carried out with a 3:1 CobB/PatZ molar ratio and a 1 mm NAD+ concentration.
Acetyl-CoA Synthetase Activity
The acetyl-CoA synthetase assay used was based on the coupled assay reported by Williamson and Corkey (25). AMP production was detected via an enzyme-coupled assay in which myokinase, pyruvate kinase, and lactate dehydrogenase couple AMP production to NADH oxidation. Acs was purified from E. coli BL21(DE3) ΔpatZ and preincubated with different PatZ concentrations at 0.1 mm acetyl-CoA for 1 h prior to measuring its synthetic activity. Then standard acetyl-CoA synthetase assays (0.2 ml) were performed at 37 °C in 50 mm potassium phosphate buffer at pH 7.5 containing 3 mm phosphoenolpyruvate, 5 units of myokinase, 1 unit of pyruvate kinase, 1.5 units of lactate dehydrogenase, 5 mm MgCl2, 2.5 mm ATP, 1.5 mm CoA, 0.1 mm NADH, 5 mm acetate, and 1 mm dithiothreitol. This reaction was started with the addition of 40 μl of 0.1 μm Acs. All reactions were performed in triplicate. Specific activity was calculated from the extinction coefficient of 6.22 mm−1 cm−1 for the oxidation of two molecules of NADH for each AMP released. One unit of Acs activity is defined as 1 μmol of acetyl-CoA formed per min at pH 7.5 and 37 °C. The specific activity of Acs is expressed as a percentage.
Differential Scanning Calorimetry (DSC)
A differential scanning calorimeter DSC 2920 (TA Instruments) was used for the calorimetric analysis of PatZ in different media. Samples were analyzed using a programmed heating scan rate of 1 °C min−1 from 30 to 120 °C. All experiments were carried out at 0.1 mg/ml in 50 mm phosphate buffer, pH 7.5, and 0 to 1.5 mm acetyl-CoA. Phosphate buffer without protein was used as reference. No peaks were visible on the rescan in any case, which means that all transitions were irreversible. For data analysis and conversion, Universal Analysis Software (TA Instrument version 0.4) was used, and the collected DSC data were normalized for protein concentration. Heat capacity (Cp) was expressed in kcal mol−1 K−1 (1 cal = 4.184 J).
Gel Permeation Chromatography
Gel permeation analysis was performed with an HPLC (Agilent Technologies) using a Supelco Discovery Bio GFC 300 column (4.6 × 50 mm and 5 μm particle, Sigma). The eluent was 50 mm phosphate buffer, pH 7.5, containing 100 mm NaCl, with a flow rate of 0.05 ml/min. The injection volume was 50 μl. The elution of proteins was monitored by absorbance at 280 nm. A set of protein standards (Sigma) was used to generate standard curves from elution times of molecules with known molecular masses as follows: thyroglobulin (670 kDa), catalase (250 kDa), γ-globulin (150 kDa), bovine serum albumin (67 kDa), ovalbumin (44.3 kDa), and ribonuclease type AI (13.7 kDa). Blue dextran and p-aminobenzoic acid were used to determine column exclusion limits. The void volume (V0) and the total volume (VT) of the column were 0.35 and 0.8 ml, respectively. A standard curve using linear regression analysis was obtained as follows: Kav = −0.02 (Mr) + 1.44 with an r2 = 0.97. Data represent mean values with standard deviations for three separate experiments.
Liquid Chromatography-Tandem Mass Spectrometry Assay (LC-MS)
Samples were alkylated with 100 mm iodoacetamide for 30 min at room temperature in the dark. Proteins were digested with 0.5–1 μg of Trypsin Gold Proteomics Grade (Promega) for 3 h at 37 °C. The reaction was stopped with 0.1% formic acid, and samples were dried using a vacuum evaporator. Tryptic peptides generated from the samples were separated and analyzed by LC/MS. An Agilent 1100 (Agilent Technologies) was equipped with a Zorbax SB-C18 HPLC column (Agilent Technologies) and connected to an Agilent Ion Trap XCT Plus mass spectrometer (Agilent Technologies) using an electrospray (ESI) interface. Two mobile phases were used, phase A, composed of water/acetonitrile/formic acid (94.9:5:0.1, v/v) and phase B, consisting of water/acetonitrile/formic acid (10:89.9:0.1, v/v).
The digested peptides were resuspended in 20 μl of phase A and eluted using a linear gradient from 0 to 80% phase B for 180 min and at a flow rate of 10 μl/min. The mass spectrometer was operated in the positive mode with a capillary spray voltage of 3500 V, and a scan speed of 8100 (m/z)/s from 50 to 2200 m/z, with a target mass of 1000 m/z, and three spectra averaging. The nebulizer gas pressure was set at 15 p.s.i., and the drying gas a flow rate at 5 liters/min at a temperature of 350 °C. MS/MS data were collected in an automated data-dependent mode (AutoMS mode). Data processing was performed with Data Analysis program for LC/MSD Trap Version 3.3 (Bruker Daltonik) and Spectrum Mill MS Proteomics Workbench (Agilent Technologies) (26, 27). After automatic validation of the results, the identified proteins with the sequence of the digested peptides were compiled. Peptides were considered valid with a score threshold of 8, and a percentage-scored peak intensity higher than 70%.
Dynamic Light Scattering (DLS)
DLS measurements were carried out in a NanoSizer ZS (Malvern Instruments), operating a laser of 632.8 nm at an angle of 173°. The autocorrelation function was processed by using the ZetaSizer version 7.03 software associated with the instrument in the CONTIN mode. This procedure determines a diffusion coefficient that is presented as a distribution of the hydrodynamic radius, Rh. The hydrodynamic measurements were carried out at 20 °C (T = 293 K) in 100 mm NaCl, 50 mm potassium phosphate buffer at pH 7.5 with a PatZ protein concentration of 10 μm. The experiment consisted of 12 measurements of 11 runs each, with 30 s per run, which amounted to 11 min of data acquisition time. The CONTIN analysis allows for two modalities in the distribution, expressing the amount of solute of a given Rh in terms of either contribution to scattering intensity or as mass fraction. The former is particularly sensitive to the presence of large particles even if their population is very small, whereas the latter detects the sample's major species. A limitation of DLS-derived distributions is that Rh is handled in a logarithmic scale, and peaks have, even for monodisperse samples, a merely instrumental width, so that components of a paucidisperse sample cannot be differentiated if their Rh values do not differ widely. Nonetheless, the Protein Workshop mode, specific for protein samples, of the ZetaSizer software was useful for our purposes.
Analytical Ultracentrifugation (AUC)
Analytical ultracentrifugation experiments were performed in a Beckman Coulter Optima XL-I analytical ultracentrifuge (Beckman-Coulter) using an An50Ti eight-hole rotor, 12-mm path length charcoal-filled Epon double-sector centerpieces, employing the UV-visible detection system. The experiments were carried out in the same buffer and temperature mentioned above with a PatZ protein concentration of 10 μm. A wavelength of 280 nm was used in the absorbance optics. Sedimentation velocity (SV) runs were carried out for 8 h at a rotor speed of 40,000 rpm using 400-μl samples in the above mentioned solvent. A series of 400 scans, without time intervals between them, was acquired for each sample. Least squares boundary modeling of the sedimentation velocity data were used to calculate sedimentation coefficient distributions with the size distribution c(s) method (28) implemented in the SEDFIT version 13.0b software (29). As the measurements are made at 20 °C, the sedimentation coefficients determined are practically identical to the standard coefficient, s20, s. Unlike DLS, AUC-SV has excellent resolution, enabling the differentiation of components (peaks in the c(s) distribution) with close s20, s values. In addition to rather reliable sedimentation coefficients, AUC-SV also provides approximate estimations of the molecular weights.
Results
PatZ Shows Positive Cooperativity in Response to Acetyl-CoA Substrate
Acs Nϵ-lysine acetylation by PatZ was kinetically characterized. PatZ kinetic analysis showed a typical hyperbolic response versus Acs substrate (0–40 μm) at a fixed saturating concentration of acetyl-CoA (1 mm) (Fig. 1, A and B).
FIGURE 1.

PatZ activity on Acs. A, substrate saturation curve of the PatZ-dependent acetylation reaction rate at different concentrations of Acs. B, double-reciprocal plot of the kinetic data. PatZ was used at 60 nm and acetyl-CoA at 1.0 mm. C, substrate saturation curve of the PatZ-dependent acetylation reaction velocity at different concentrations of acetyl-CoA. D, double-reciprocal plot of the kinetic data indicating a concave curve. PatZ enzyme was present at 60 nm, and Acs was present at a saturating concentrations of 40 μm. E, Western blot of the Acs protein. Acs untreated (1st lane) and lysine acetylated by PatZ at 0.1 mm (2nd lane), 0.2 mm (3rd lane), 0.5 mm (4th lane), and 1.0 mm (3rd lane) of acetyl-CoA are shown. F, Acs activity versus acetylation degree. Percentage of Acs activity incubated at different concentrations of PatZ for 30 min and 0.1 mm acetyl-CoA at 37 °C. The inset shows the loss of Acs activity versus acetylation time as a result of the incubation with 68 nm PatZ and 0.1 mm acetyl-CoA.
In contrast, when Acs was held at a fixed saturating concentration (40 μm) and the acetyl-CoA concentration was varied (50–800 μm) (Fig. 1C), PatZ activity showed a sigmoidal dependence. The kinetic cooperativity observed in PatZ was revealed by the double-reciprocal plot of the rate data, which was upwardly concave (Fig. 1D) and could be described by the Hill equation (30). The calculated Hill coefficient (h) was 7.91 ± 0.22 (r2 = 0.99), which describes the PatZ-positive cooperativity on acetyl-CoA. The kinetic parameters determined are displayed in Table 2. These data showed that the enzymatic rate was slightly higher for the substrate Acs than for acetyl-CoA, whereas the K0.5 was much higher for acetyl-CoA.
TABLE 2.
Kinetic parameters of PatZ with acetyl-CoA and Acs as substrates
| Substrate | Vmax | Km | K0.5 | kcat | kcat/Km |
|---|---|---|---|---|---|
| units/mg | μm | μm | s−1 | s−1 m−1 | |
| Acetyl-CoA | 0.63 ± 0.006 | 185.2 ± 2.5 | 1.02 ± 0.05 | 5.49 × 10³ | |
| Acs | 0.73 ± 0.024 | 14.78 ± 0.8 | 1.19 ± 0.04 | 8.1 × 10² |
Acs Activity Is Regulated by the Acetylation Level
Western blot was performed to confirm PatZ Nϵ-acetyltransferase activity on Acs using anti-acetyl-Lys antibody. Acs was incubated with PatZ and 0–1 mm acetyl-CoA concentration for 30 min (Fig. 1E). As can be seen, there was an increase in Acs acetylation in response to increasing acetyl-CoA concentrations.
To identify the acetylated lysines of Acs by PatZ, a mass spectrometry assay was conducted after Acs incubation at different acetyl-CoA concentrations with PatZ. The Acs purified from a ΔpatZ strain was acetylated at Lys-199 and Lys-226. These acetylations were independent of PatZ, probably due to nonenzymatic acetylation. Moreover, these acetylated lysines explain the low signal shown by Acs in the first line of the Western blot (Fig. 1E). Acs showed 16 acetylated lysines at 1 mm acetyl-CoA in the presence of PatZ. The identified lysine acetylation sites were 50, 54, 68, 111, 130, 131, 199, 200, 207, 221, 226, 400, 401, 604, 609, and 617. To determine whether the Acs acetylation was mediated chemically or enzymatically, an acetylation assay of Acs incubated at 1 mm acetyl-CoA concentration in the absence of PatZ was carried out. The lysine acetylation sites identified by chemical acetylation were 130, 131, 199, 200, 207, 226, and 221. Therefore, nine site-specific lysine acetylations in Acs were due to enzymatic acetylation by PatZ. The results are given in Table 3. An example of the assignment of acetylation to Lys-54 and -68 of Acs by LC-MS/MS analysis is shown in Fig. 2A.
TABLE 3.
Mass spectrometry assay of Acs and PatZ proteins
Site-specific enzymatic lysine acetylation of Acs by PatZ are shown in boldface.
| Protein | Acetyl-CoA | Acetylated lysine residues |
|---|---|---|
| mm | ||
| Acs | 0 | 199, 226 |
| 0.1 | 50, 68, 130, 131, 199, 226, 609 | |
| 0.5 | 50, 54, 68, 111, 130, 131, 199, 207, 221, 226, 400, 401, 609 | |
| 1 | 50, 54, 68, 111, 130, 131, 199, 200, 207, 221, 226, 400, 401, 604, 609, 617 | |
| PatZ | 1 | 146, 149, 391, 447, 635, 819 |
FIGURE 2.

Identification of lysine acetylation by LC-MS/MS analysis. A, assignment of acetylation to Lys-54 and -68 of Acs. MS/MS spectrum of precursor ion m/z 944.673+ of modified peptide (ILDWIKPYQkVKNTSFAPGNVSIk) from Acs. B, assignment of acetylation to Lys-146 and -149 of PatZ. MS/MS spectrum of precursor ion m/z 1806.733+ of modified peptide (LLGPNSLGLLAPWQGLNASFSPVPIkRGkLAFISQSAAVSNTILDWAQQR) from PatZ. The labeled peaks correspond to masses of b and y ions series shown in red and blue, respectively. Manual inspection of b and y ions series of these spectra indicates mass increments of 42 Da for ion+ and 21Da for ion2+ in some cases compared with the corresponding ion series of the unmodified peptides, suggesting that lysine is acetylated. Acetylation at the location is indicated by k.
Purified Acs from E. coli BL21(DE3) ΔpatZ was incubated with different PatZ concentrations and 0.1 mm acetyl-CoA at 37 °C for 30 min before measuring Acs activity. The acetyl-CoA synthetase activity decreased in response to the acetylation level by PatZ (Fig. 1F). The Acs synthetic activity was also measured at 0 and 0.1 mm acetyl-CoA in the absence of PatZ and was found to be the same in both cases, 620.86 ± 12.6 units/mg.
Potential Role for the Glu-809 Residue of PatZ in the Catalytic Mechanism
Although the GNAT family acyltransferase mechanism is not completely understood, most evidence suggests a sequential mechanism operates to transfer the acetyl group from acetyl-CoA to the targeted protein via a ternary complex. The reaction mechanism is initiated by the nucleophilic attack of the deprotonated amine on the carbonyl functional group of acetyl-CoA (10–12, 31). This proposed mechanism of catalysis involves a conserved glutamic acid (Glu-809 in PatZ) acting as a general base, deprotonating the amine. To determine the role of Glu-809, a PatZ mutant protein harboring a Glu-809 to alanine mutation was generated. The pH dependence of the acetyltransferase activity with Acs and acetyl-CoA as substrates was determined and compared with the wild type enzyme (Fig. 3A). As can be seen, PatZE809A showed lower activity than PatZ at low pH (5–7). However, this activity increased with the pH, reaching similar activity levels to those of the wild type enzyme. At high pH values (9–10), lysine residues were spontaneously deprotonated (pKa = 9.6).
FIGURE 3.

PatZ activity versus pH. A, pH-dependent activity of PatZ (●) and PatZE809A mutant (■) on Acs. The PatZWT and mutant concentration was 60 nm. The Acs concentration was 40 μm at 1 mm acetyl-CoA. B, PatZ catalytic domain model generated by Phyre2 server. Coenzyme A binding pocket and conserved glutamic acid are shown in wire frame mode colored green and purple, respectively. Acetyl-CoA substrate is shown in red. The figure was made with Swiss Model PDB viewer (70). C, electrostatic surface PatZ catalytic domain (red represents negative electrostatic potential; blue represents positive electrostatic potential, and white is neutral).
Phyre2 (32) and three-dimensional ligand site (33) web servers were used to predict acetyl-CoA ligand-binding sites of the PatZ catalytic domain (sequence from 725 to 884) in multi-template/ab initio mode (Fig. 3B). Five templates were selected to model the PatZ GNAT domain (sequence from 725–884), which were from Kribbella flavida (PDB code 4MY3), Salmonella typhimurium (PDB code 3DR), Mycobacterium smegmatis (PDB code 4ORF), M. tuberculosis (PDB code 4AVC), S. enterica (PDB code 4U5Y), and S. cerevisiae, based on heuristics to maximize confidence (99% in all cases), percentage identity (21, 26, 29, 19, and 19%, respectively), and alignment coverage by each template (Fig. 4). The coenzyme A binding pocket included Val-812, Leu-813, Val-814, Gly-824, and Arg-825 residues, as detected by the fpocket2 program (Fig. 3B) (34, 35). WebLab Viewer Lite software was used to display the electrostatic surface of the PatZ catalytic domain (Fig. 3C).
FIGURE 4.

Multiple alignment of GNAT domain from E. coli (PatZ), K. flavida (PDB code 4MY3), S. typhimurium (PDB code 3DR8), M. smegmatis (PDB code 4ORF), M. tuberculosis (PDB code 4AVC), S. enterica (PDB code 4U5Y). and S. cerevisiae (PDB code 1YGH). *, fully conserved residue; :, residues with high similarity; ., residues with low similarity. Sequence alignment generated in T-Coffee web server (version 11).
Autoacetylation/Deacetylation of PatZ
It has recently been reported that PatZ is acetylated in vivo in E. coli (2, 9). However this acetylation has not been studied in detail, and the consequences of this regulation are unknown. The kinetics of PatZ autoacetylation was determined at a fixed PatZ concentration (60 nm) and at different acetyl-CoA concentrations (0–1 mm) using the 5,5′-dithiobis-2-nitrobenzoic acid or Ellman's reagent assay. The activity plot was fitted to nonlinear Michaelis-Menten enzyme kinetics (r2 = 0.98) with a Km of 0.11 ± 0.01 mm (Fig. 5A). To test the kinetic mechanism of self-catalyzed PatZ, its concentration dependence was examined, and a linear concentration dependence of log PatZ autoacetylation velocity on the log PatZ concentration was observed as follows: y = 1.16 x − 2.39, with r2 = 0.97 (Fig. 5C). Western blotting confirmed that PatZ showed deacetylation by CobB (Fig. 5D) with a 1:3 (PatZ/CobB) molar concentration ratio and a reaction time of 5 h. Therefore, PatZ acetylation is reversible.
FIGURE 5.

PatZ acetylation/deacetylation. A, substrate saturation curve of the PatZ-dependent acetylation reaction rate at different concentrations of acetyl-CoA. The PatZ concentration was 60 nm. B, nonlinear concentration dependence of PatZ autoacetylation rate at 1 mm acetyl-CoA. C, log-log of data in B was fitted to a linear regression, y = 1.16 x − 2.38, r2 = 0,98. D, PatZ deacetylation by CobB Western blot. The concentration ratio was 1:3 (PatZ/CobB).
To characterize the self-catalyzed reaction of PatZ, the acetyltransferase activity of PatZGNAT (GNAT C-terminal catalytic domain of PatZ) on Acs and PatZAcs-like (truncated N-terminal PatZ fragment lacking the GNAT domain) was analyzed by Western blot (Fig. 6, A and B), using wild type PatZ (PatZWT) and PatZGNAT at 60 nm. PatZGNAT was seen to be catalytically inactive on both substrates, Acs and PatZAcs-like, which suggests that the N-terminal domain of PatZ is essential for acetyltransferase activity. Moreover, Acs was acetylated by PatZWT, whereas PatZWT could not acetylate PatZAcs-like.
FIGURE 6.

Western blot of Acs and PatZAcs-like incubated with PatZGNAT and PatZWT. A, multidomain PatZ protein that belongs to the GNAT superfamily, indicating the PatZGNAT (truncated GNAT C-terminal catalytic domain) and PatZAcs-like (truncated N-terminal domain of PatZ within GNAT domain). B, Acs and PatZAcs-like Western blot incubated in presence of 1 mm acetyl-CoA with 60 nm PatZWT or PatZGNAT.
A mass spectrometry assay of PatZ incubated with a saturating acetyl-CoA concentration (1 mm) was conducted. The results are shown in Table 3. Six acetylated lysine residues were identified, five on the surface of the protein core (146, 149, 391, 446 and 635) and one in the catalytic (GNAT) domain (819). An example of the assignment of acetylation to 146 and 149 of PatZ by LC-MS/MS analysis is shown in Fig. 2B.
Tetrameric PatZ Oligomerizes to an Octameric Form by Acetylation
To understand the changes induced in PatZ by acetylation, biophysical studies were conducted, determining the molecular weight of the native protein by gel filtration chromatography (Fig. 7A). In the absence of acetyl-CoA, purified PatZ eluted mainly at 8.2 min, with a left shoulder peak appearing at 7.3 min and with an apparent molecular mass of 410 ± 21 and 798 ± 40 kDa, respectively, which correspond to tetrameric and octameric forms. In contrast, at a saturating acetyl-CoA concentration (1.5 mm) the main peak eluted at 7.3 min, with a right shoulder at 8.2 min, corresponding to a protein population in which the octamer species is predominant.
FIGURE 7.

PatZ biophysical studies. A, oligomeric state of PatZ in the absence of acetyl-CoA (—) and 1 mm acetyl-CoA (- - -) by gel filtration chromatography, at a flow rate of 0.05 ml/min. The inset shows a typical linear regression of a standard curve with a set of protein standards of known molecular mass. B, size distributions from DLS are as follows: scattering intensity (panel a) and mass (panel b). C, AUC results (panel a) scans in absorbance optics (panel b). Residuals of fitted scans (panel c) and fitted distribution coefficients with s and M values as provided by SEDFIT are shown.
Purified PatZ was also analyzed by DLS and AUC. Structural information can be extracted from both the diffusion coefficient, D, and the sedimentation coefficient, s. These are related to the friction coefficient, f, by the expressions D = RT/(NA f) and s = M(1 − vρ)/(NA f), which are combined in the well known Svedberg equation s/D = M(1 − vρ)/RT. R is the ideal gas constant, T the absolute temperature, NA the Avogadro number, v the specific volume of the protein solute, and ρ the density of the buffer solvent, whereas f is proportional to the solvent viscosity, η0, and it depends on the conformation (size and shape) of the solute molecules. The friction coefficient is customarily expressed as an equivalent hydrodynamic radius, Rh, defined as Rh = f/(6πη0), which can be obtained as either Rh =RT/(NA6πη0D) or Rh = M(1 − vρ)/(NA6πη0s). The hydrodynamic measurements were carried out at 20 °C (T = 293 K), in the same buffer as used for gel permeation. The SEDNTERP software (29) could be used to estimate the values η0 = 1.00 cP and ρ = 1.01 g/cm3 from the solvent composition. The same program was used to estimate the required protein solute properties from the amino acid sequence. Using the sequence of the monomer, the following properties were obtained for PatZ: M = 98.0 kDa, and v = 0.742 cm3/g.
Fig. 7B (panels a and b) shows the results of the DLS measurements. Disregarding the appearance of a small amount of aggregated material, the single peak in the mass distribution corresponded to the protein in its oligomeric forms. The analysis of this peak by the ZetaSizer software showed that it corresponds to a polydisperse material (the Protein Workshop mode of the instrument software indicating the coexistence of different oligomers) with M = 420 ± 150 kDa and Rh = 7.7 ± 2.4 nm.
Fig. 7C (panels a–c) shows the AUC results. The main feature was the peak in c(s) with s20, w = 12.4 S and M ∼ 446 kDa. he results also showed two other minor but significant peaks, one with s20, w = 18.0 S and M ∼800 kDa and another with s20, w= 4.6 S and M ∼97 kDa (Fig. 7C, panel c). As indicated under “Experimental Procedures,” M values in AUC-SV are approximate.
The mass and intensity distribution of the hydrodynamic radius obtained by DLS revealed the existence of some aggregated protein but, as reported by the ZetaSizer software, the weight fraction of aggregates is smaller than 2% (Fig. 6B). Indeed, that material does not show up in the mass distribution. Results of the AUC measurements (Fig. 7C) showed that they are quite small and nonbiased, indicating the good quality of the fit.
With the same purpose of understanding the PatZ oligomeric states, interconversion between the two oligomeric forms of PatZ was monitored by native PAGE at different acetyl-CoA concentrations (Fig. 8A). In the absence of acetyl-CoA the tetramer was the main form observed but, when the acetyl-CoA concentration was increased, an octameric structure was formed and the tetramer band was less abundant. Western blot with an anti-acetyl-Lys antibody revealed that only the octameric form was acetylated (Fig. 8B). To confirm that PatZ autoacetylation induces a change in its oligomerization status, lysine-acetylated residues of PatZ were mutated to arginine (nonacetylatable mutation). These lysine residues were 146, 149, 391, 447, and 635 (PatZ5(K→R)). The oligomerization of PatZ5(K→R) and PatZE809A was studied by native PAGE. In both cases, the tetrameric form was observed in the absence of acetyl-CoA (Fig. 8C). However, an octameric structure was formed at 1 mm acetyl-CoA for the PatZE809A mutant, but it was not observed for PatZ5(K→R).
FIGURE 8.

Deacetylated PatZ native Western blot. A, deacetylated PatZ native PAGE at different acetyl-CoA concentrations: 1st lane (0 mm); 2nd lane (0.01 mm); 3rd lane (0.02 mm); 4th lane (0.05 mm); 5th lane (0.1 mm); 6th lane (0.2 mm); 7th lane (0.5 mm); and 8th lane (1 mm). B, Western blot analysis using anti-acetyl-Lys antibody. C, native PAGE analysis of PAtZE809A and PatZ5(K→R) in the absence and in the presence of 1 mm acetyl-CoA. D, PatZ native PAGE incubated with KCl. Homotetrameric PatZ dissociation was in the presence of KCl. The incubations were carried out at 25 °C for 2 days in solutions containing final concentrations of KCl from 0 to 2.0 m.
To study intersubunit electrostatic interactions in the PatZ tetramer, purified and mainly tetrameric PatZ was incubated at 25 °C for 2 days in solution containing different KCl concentrations (0 to 2.0 m) and analyzed by native PAGE (Fig. 8D) (36). The native PAGE analysis showed that the homotetramer molecule dissociated to homodimers at a KCl concentration of 0.5 m or higher. The maximal dissociation occurred at 2.0 m KCl, but homotetramers were observed at all KCl concentrations, whereas monomers were not observed in any of the conditions assayed. The addition of KCl probably disrupted interdimer electrostatic interactions in the PatZ tetramer, whereas intermonomer interactions were not affected.
To further clarify PatZ oligomerization by acetylation and its physiological function, DSC was used. DSC measures the heat capacity of states and the excess heat associated with transitions induced by temperature changes. Purified PatZ DSC assays were performed at 0, 0.5, and 1.5 mm acetyl-CoA (Fig. 9A). Table 4 shows the PatZ thermodynamic parameters estimated from the DSC data. Tetrameric PatZ showed a single peak upon thermal denaturation in the absence of acetyl-CoA, reflecting a first-order protein denaturation pattern, N → D (N is the native state and D the denatured state) characterized by a Tm0 of 80.19 ± 2 °C. In contrast, the protein showed a double-peaked denaturation curve in the presence of 0.5 mm acetyl-CoA (nonsaturating concentration considering the concentration of PatZ in the assay), characterized by a Tm0 of 81.15 ± 2 °C and a Tm1 of 104.81 ± 4 °C (Table 4). Finally, the protein showed a single peak at a saturating acetyl-CoA concentration (1.5 mm), with a Tm1 of 102.23 ± 3 °C, similar to the Tm1 value for 0.5 mm acetyl-CoA. Subsequently, denaturation of PatZ was studied at different concentrations of acetyl-CoA, from 0.25 to 1.5 mm (thermograms not shown), and in all nonsaturating acetyl-CoA concentrations, two peaks were observed in the thermograms. The data were analyzed according to the van't Hoff equation (37) and the model (Fig. 9B), based on a relationship between the total protein concentration and the concentration of ligand or substrate, and the melting temperature, as expressed by Equation 1 (38),
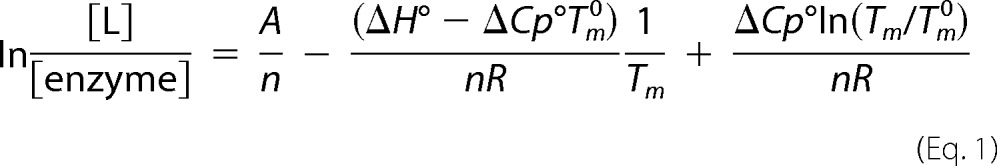 |
where R is the gas constant (8.31 × 10⁻³ kJ/mol K); n is the number of binding sites for substrate, and A is a constant (−1284.1 ± 0.2). Using the above equation for PatZ thermodynamic analysis with several acetyl-CoA concentrations, a value of 7.2 ± 0.02 was obtained for n. This indicates that between seven and eight binding sites for this ligand exist on the active oligomer, which agrees with the formation of an active PatZ octamer.
FIGURE 9.

PatZ differential scanning calorimetry. A, DSC thermograms of PatZ. Experiments were run at different acetyl-CoA concentrations: 0 (—), 0.5 (- - -), and 1.5 mm (···). B, van't Hoff plot according to Equation 1 for PatZ DSC experiments in the presence of different concentrations of acetyl-CoA. The logarithm of the ligand concentration is plotted as a function of Tm1, the reciprocal of the temperature of maximal excess specific heat. The standard deviation of the points from the least squares curve corresponds to ± 0.20 °C in Tm (r2 = 0.99).
TABLE 4.
Thermodynamic parameters of PatZ obtained from DSC thermograms
| PatZ | Acetyl-CoA | Tm0 | ΔH0 | ΔCp0 | Tm1 | ΔH1 | ΔCp1 |
|---|---|---|---|---|---|---|---|
| mm | °C | J/mol | W/g | °C | J/mol | W/g | |
| Tetramer | 0 | 80.19 ± 2 | 1560 ± 8 | −0,1 | |||
| 0.5 | 81.15 ± 2 | 1614 ± 10 | −0,15 | 104.81 ± 4 | 1453 ± 7 | −0.002 | |
| Octamer | 1.5 | 102.23 ± 3 | 1668 ± 11 | −0.005 |
In Silico Protein-Protein Docking
To propose a PatZ model for the tetrameric state based on the above results, in silico protein-protein docking was performed by ClusPro 2.0 server (39–42). Phyre2 server (32) was used to predict the PatZ monomer structure (supplemental PDB S1). This model was generated with 95% of the residues modeled at the >90% confidence level and only 44 residues were modeled by ab initio. The PDB file generated by Phyre2 was uploaded on ClusPro2 for monomer-monomer interaction analysis. The output in the form of the structure of a predicted complex was obtained. Five structures based on the best scores were retrieved. Taking into account the scores obtained and favoring hydrophobic interaction between monomers, the best model was chosen (supplemental PDB S2). In the proposed dimer, the link between the C-terminal PatZ monomers occurs via a large hydrophobic surface that matches the CoA binding domain (Fig. 10A). Finally, ClusPro2 was also used to generate a dimeric structure of this dimer based on electrostatic interactions corresponding to the tetramer form. The output of the predicted complex was obtained. Five structures based on best scores were downloaded. The best candidate structure was selected taking into account the scores and the electrostatic surface interaction (supplemental PDB S3). In this model, the electrostatic interaction, demonstrated experimentally by the dissociation of the homotetrameric PatZ in the presence of KCl (Fig. 8D), occurs at most of the interface between dimers (Fig. 10B).
FIGURE 10.

In silico PatZ oligomerization by monomer and dimer docking simulations performed by the ClusPro 2.0 server. A, PatZ monomers dimerization by favored hydrophobic interactions. The triangulated macromolecular surface (49) is shown in hydrophobic color scale (32 colors) from yellow-brown (most hydrophobic) to blue (most hydrophilic). B, PatZ dimers tetramerization by favored electrostatic interactions. Dimers of the tetramer are colored in red and blue. All figures were created using Protein Workshop (48).
To deepen our knowledge on PatZ tetramer acetylation, Phyre2 server (32) was also used to model the PatZ sequence with the acetylated lysine residues in the core protein (146, 149, 391, 447, 635) changed to glutamine residues to simulate the effect of acetylation on the PatZ structure. Glutamine was selected because of its similar side chain conformational entropy to acetyl-lysine (43, 44). This model was generated with 94% of the residues modeled at >90% confidence level and only 45 residues were modeled by ab initio. Then this model was compared with the native PatZ model (Fig. 11). The mutant PatZ model presented a more compact structure (model dimensions (Å): X = 77.21; Y = 82.39; Z = 94.65) than the native model (model dimensions (Å): X = 74.85; Y = 116.23; Z = 93.76). This structural change resulting from the acetylation of PatZ could promote the formation of the octamer. It seems likely that the predominant effect of the acetylation is to alter the shape and charge characteristics of a surface patch allowing contact between monomers that was not permitted in the tetramer wild type protein.
FIGURE 11.

Deacetylated and acetylated PatZ models generated by Phyre2 server. PatZ models of native (A) and mutant (B). Catalytic domain is indicated in red, and lysine residues changed to glutamine are indicated in purple. Coordinates indicate the model dimension in Å. The figure was made using Protein Workshop (48).
Validation of in Silico PatZ Tetramerization Model Using Three-dimensional Hydrodynamic Analysis
The essential value of hydrodynamic studies is the information that they provide on the structure of proteins. For many years, hydrodynamic coefficients have been used to probe the overall conformation (e.g. globular, fibrous, denaturated, etc.) of proteins in solution. In recent years, methodologies and computational tools have been developed to calculate the solution properties from detailed residue and even atomic level structures (45–47). Apart from data for the solute and solvent properties, the input necessary for the calculation of solution properties is simply a PDB formatted file of atomic coordinates. For this reason, such tools are now widely used to validate structures obtained from crystallography, NMR, or in silico methods by comparing the results experimentally determined with those obtained computationally. For the simple hydrodynamic coefficient, as in the present case, the most widely used tool is HYDROPRO (45, 47). Calculation of the sedimentation coefficients requires the values for ρ, T, η0. v, and M to be known. These are available in our case, but note that the result for Rh is independent of these quantities and is directly calculated from the set of atomic coordinates.
Based on our PatZ modeled structures for the tetramer and the monomer by ClusPro2 and Phyre2 servers, respectively, using HYDROPRO version 10 (47), the results listed in Table 5 were obtained. The agreement between the experimental and calculated sedimentation coefficients and hydrodynamic radius was excellent with differences of less than 5%. Considering the diversity of aspects involved in (i) the in silico structure prediction of PatZ oligomeric forms, (ii) the DLS and especially the AUC experiments, and (iii) data processing, it can be affirmed that the hydrodynamic experiments and calculations fully validate the in silico molecular modeling and docking studies of the PatZ monomeric subunit for the tetrameric assembly.
TABLE 5.
Experimental and calculated properties from hydrodynamic studies
| Property | Technique | Tetramer | Monomer | Octamer |
|---|---|---|---|---|
| Mass (kDa) | DLS | <420a | ||
| AUC | ∼446b | ∼97b | ∼800b | |
| Sequence | 392 | 98 | 784 | |
| s (S) | AUC | 12.4 | 4.6 | 18.0 |
| HYDROPRO | 12.9 | 5.2 | ||
| Rh (nm) | DLS | <7.7a | ||
| AUC | 7.3 | 4.1 | 9.9 | |
| HYDROPRO | 6.9 | 4.3 |
a Average over oligomers is shown. The actual value should be slightly smaller.
b Approximate values from AUC-SV are shown.
With an even simpler approximate methodology, the hydrodynamic radius of the tetramer model was calculated using the Protein workshop viewer (48) and taking into account the macromolecular surface (49). The calculated average radius was 7.03 ± 0.5 nm, which is in accordance with the DLS and AUC results and the more precise HYDROPRO calculation.
Discussion
PatZ Activity Is Controlled by Positive Cooperativity and Acs Activity Is Regulated by the Degree of Acetylation
PatZ kinetic data for acetyl-CoA (Fig. 1C; Table 2) pointed to atypical sigmoidal activity, reflecting positive cooperativity (Hill coefficient = 7.91 ± 0.22). Positive cooperativity is unusual in enzymes belonging to the GNAT family, although this behavior has been described in the PatZ homologous enzyme, SePat, with a Hill coefficient of 2.2 ± 0.2 (8)n suggesting that the structural basis for this behavior is protein tetramerization in the presence of acetyl-CoA.
The kinetic parameters of PatZ were within the range of those reported for other KAT proteins (50). The acetylation of Acs by PatZ was confirmed by Western blot and mass spectrometry analysis (Fig. 1E and Table 3). Moreover, the acetyl-CoA synthetase activity assay (Fig. 1F) confirmed that E. coli Acs activity was dependent on the acetylation degree caused by PatZ. Besides, the Acs synthetic activity measured at 0 and 0.1 mm acetyl-CoA in the absence of PatZ was the same in both cases.
It is well known that in S. enterica, Pat-catalyzed acetylation of Acs results in the modification of its Lys-609 residue, which inhibits AMP-acetyl forming activity (15). In contrast, we observed that the number of site-specific lysine residues of Acs acetylated by PatZ increased with acetyl-CoA concentration (Table 3), and a correlation between Acs activity and its acetylation degree was established. In fact, our group has recently reported quantitative changes in the acetylation ratios of some of these residues after deacetylation with CobB in vitro (9).
PatZ kinetics for Acs acetylation (Table 2) indicated that the limiting factor was the acetyl-CoA concentration, because the K0.5 for this substrate was 12.5 times higher than for the Acs protein. These results suggest a mechanism for linking the physiological state of the cell with the acetylation state of Acs, so the concentration of acetyl-CoA in the cell will determine the acetylation of Acs by PatZ. One could speculate that the post-translational regulation of Acs prevents the accumulation of acetyl-CoA, while avoiding the depletion of free coenzyme A and metabolic energy, as proposed previously (23, 51). In addition, it has recently been demonstrated that depletion of the patZ gene leads to high E. coli proteome acetylation in acetate cultures. This increase in chemical acetylation could be the consequence of nonregulated Acs activity by PatZ (9).
Conserved Glutamic Acid 809 from PatZ Is Not Important for Catalysis
To date, studies on the acetyltransferase kinetic mechanism suggest, for most MYST and GNAT families, a direct-attack mechanism within a ternary complex. In this mechanism, a conserved glutamic acid residue functions as a general base by assisting in the deprotonation of the ϵ-amino group of the acetylatable lysine residue (10, 31, 52, 53). This was demonstrated in the MYST family member Esa1, where the conserved active-site Glu-338 deprotonates the N-ϵ-lysine of histone, facilitating the nucleophilic attack on the bound acetyl-CoA (14). In the GNAT family member GCN5, the Glu-173 deprotonates the ϵ-amino group of the targeted lysine of the protein (12). Based on this premise, local sequence alignment of histone acetyltransferase GCN5 (PDB code 1YGH) and GNAT domain of PatZ showed that this residue is conserved in position 809 (Fig. 4) (54).
To determine the role of the Glu-809 in PatZ catalytic activity, we generated a PatZ mutant protein harboring an Glu-809 to Ala and checked that it acted as a potential catalytic base in the reaction (Fig. 3A). The activity of the mutant enzyme was 20% lower at pH 7 than for the native enzyme, although the activity gradually recovered at pH values above 9 as a result of the spontaneous deprotonation of the ϵ-amino group of the targeted lysine residue on Acs. This result suggested that the Glu-809 residue was not relevant for PatZ activity.
It is important to note that there are examples where an invariant glutamic acid is not necessary for catalysis (55). For example, the yeast Hpa2 GNAT has no obvious catalytic residue that might function as a general base, and it has been proposed that a net positive electrostatic potential of the active site would favor an uncharged state of the lysine residue (56). This positive potential was not found in the GNAT catalytic PatZ domain (Fig. 3C). Other acetyltransferases, such as Hat1, AAT, and AAC6, also have a net negative charge of the active site (57–59). Thus, an alternative mechanism must be necessary for proton transfer. This has been proposed for the GNAT family member serotonin N-acetyltransferase, in which two histidine residues are involved in the deprotonation (60).
In addition, the mutant structure without acetyl-CoA determined by native PAGE presented an apparent molecular mass of ∼410 kDa (Fig. 8C), suggesting that the Glu-809 does not alter the ability of protein to correctly fold and oligomerize. In the same way, CD spectra of the yGCN5-E173Q protein were identical to those of the native protein, suggesting that the protein did not undergo significant structural changes that could be attributed to the native glutamate-to-glutamine substitution (10).
The GNAT catalytic domain model of PatZ was generated with 99% of the residues modeled, and no residue was modeled by ab initio (Fig. 3B). The coenzyme A binding pocket included Val-812, Leu-813, Val-814, Gly-824, and Arg-825 residues, which are also conserved in the GNAT family (Fig. 4) (55). These residues create a hydrophobic core for acetyl-CoA attachment, and it is also possible that acidic side chains in the vicinity of the PatZ active site could play a role in deprotonation of lysine residues (Fig. 3, B and C).
PatZ Is a Homotetramer That Forms a Thermostable Octamer by Autoacetylation
In contrast to the eukaryotic enzymes, prokaryotic acetyltransferases adopt various quaternary structures. A number of structurally characterized GNAT superfamily members have been found to be multimeric (55). A similar oligomeric behavior has been described for S. enterica. SePat oligomerizes from a monomer to a tetramer form in the presence of acetyl-CoA (8). However, the fact that PatZ was mainly in stable tetrameric form in the absence of acetyl-CoA demonstrated that the tetramerization process was independent of acetyl-CoA ligand binding. In contrast, the presence of acetyl-CoA was required for the formation of the octamer state (Fig. 7). Hydrodynamic experiments using the two techniques, DLS and AUC, confirm the oligomeric nature and composition of the protein, which is predominantly tetrameric, with some octamers, and an even smaller but still detectable amount of monomers observed by AUC. As seen in Table 5, the approximate molecular weights observed from the AUC are in a 1:4:8 proportion. The DLS value, which must correspond to an average, is slightly above that of the tetramer because there is more octamer than monomer, compared with the other two species. Regarding the hydrodynamic radius, the values for each species were determined from the sedimentation coefficient, using the exact values of M and those of v, ρ, T, and η0 (Table 5). Again, the DLS hydrodynamic radius was slightly higher than that of the tetramer. Therefore, the results of the two hydrodynamic techniques are consistent. In addition, it is important to highlight that hydrodynamic results agree with those of gel filtration chromatography analysis. This technique showed that, in the absence of acetyl-CoA, purified PatZ eluted mainly as a tetramer with a certain presence of octamers and an apparent molecular mass of 410 ± 21 and 798 ± 40 kDa, respectively.
Native PAGE showed that the formation of the octamer occurred above a 0.05 mm acetyl-CoA concentration (Fig. 8A), which agrees with the Michaelis-Menten kinetic constant for PatZ autoacetylation of 0.11 ± 0.01 mm (Fig. 5A). Moreover, Western blot of native PAGE showed that only the PatZ octamer form has acetylated lysine residues. These results suggest that the formation of the octamer occurred via tetramer acetylation and not from the monomer, because the tetramer band disappeared gradually with a concomitant increase of the octamer band (Fig. 8B). In addition, native PAGE of PatZ5(K→R) showed that an octamer form was not formed at 1 mm acetyl-CoA (Fig. 8C). This result confirms that the autoacetylation of these lysine residues (146, 149, 391, 447, and 635) is responsible for inducing PatZ octamerization.
The acetylation kinetics of Acs by PatZ (Fig. 1A) showed that the octamer form was a functionally active form because the acetyltransferase activity was measured at a fixed saturating acetyl-CoA concentration. A linear concentration dependence of log PatZ autoacetylation rate versus log Pat concentration at a saturating concentration of acetyl-CoA (1 mm) was detected (Fig. 5, B and C). This suggests that the reaction mechanism is first order, indicating an intramolecular process (61). The autoacetylation of histone acetyltransferases, such as p300, Tip-60, or the MYST acetyltransferases Esa1 and hMOF (62–64), has been described. Furthermore, the acetylation of these acetyltransferases is reversed by deacetylases as described for PatZ in this study (Fig. 5D).
To obtain a deeper understanding of the oligomeric nature of PatZ, the Predict protein server (65) was used to predict PatZ monomer solvent accessibility. The result showed that 31.38% of the residues are exposed;, 9.37% are intermediate, and 59.26% are buried within the protein. This largely hydrophobic interface could be involved in monomer contact to form the stable dimer in solution. This would explain the limited presence of PatZ monomers in equilibrium sedimentation studies, DSC analysis, and their absence in native PAGE and the elution profile of PatZ from a gel filtration column. Moreover, the results of the dissociation studies of homotetrameric PatZ in the presence of KCl (Fig. 8D) suggest that the PatZ homotetramer is stabilized, mainly by favorable electrostatic contacts between the two homodimers (36). In contrast, most of the interactions between monomers are hydrophobic. A similar behavior has been demonstrated for histone acetyltransferase Hpa2, which forms dimers via an extensive, interdigitated, and largely hydrophobic interface and which forms a tetramer in the presence of acetyl-CoA (56).
With respect to PatZ domains, PatZAcs-like showed a tetrameric form, suggesting that dimers and tetramers are formed from the amino-terminal domain (Fig. 8C). However, the amino-terminal domain was also necessary for catalytic PatZ activity (Fig. 6B). In fact, it has been demonstrated that full-length SePat is necessary for efficient binding to acetyl-CoA (8) and that the specificity of the GNAT-protein interaction is dictated by an extensive interaction surface (66). Moreover, the tetramer PatZAcs-like could not be acetylated by PatZWT (Fig. 6B). From this result, we hypothesize that a PatZWT tetramer cannot recognize another tetramer, suggesting that the autoacetylation mechanism consists of an intramolecular self-catalysis based on an acetylation between monomers, although more studies are needed to confirm this.
DSC experiments were carried out to understand the physiological consequences of this octamerization induced by tetramer autoacetylation. The results showed that PatZ has eight acetyl-CoA-binding sites in the octameric form at a saturating concentration of acetyl-CoA, and it is characterized by a Tm of 104.81 ± 4 °C, whereas the PatZ tetramer has a Tm of 80.19 ± 2 °C in the absence of acetyl-CoA. These data (Fig. 9) and PatZ acetyltransferase activity analyses (Fig. 1A) revealed that the octamer is functionally active and more thermostable than the tetramer. In fact, in other protein acetyltransferases, it has been described that multiple acetylated lysines play a critical role in protein stability (67). In the same way, Lys-709 of component HIF-1 transcriptional complex is acetylated by p300, which increases protein stability (68). This specific environmental function of protein acetylation might explain the association of tetramers to form an active PatZ octamer by acetylation and to increase its stability in response to cell stress situations (69).
The kinetic, structural, and functional characteristics of the PatZ activity have physiologically relevant consequences. Kinetic data revealed that acetyl-CoA concentration limits the acetylation of Acs. This is possible due to the positive cooperativity of PatZ toward its substrate acetyl-CoA, which, in turn, is related to changes in protein structure and its oligomeric state. When cellular concentrations of acetyl-CoA increase (e.g. as a consequence of high Acs activity during growth on acetate), PatZ tetramers self-acetylate, which promotes the formation of PatZ octamers, which are more stable and active. This fact would prevent the accumulation of acetyl-CoA while avoiding the depletion of free coenzyme A (23, 38). This work supports a major role for PatZ as a molecular sensor of acetyl-CoA concentration.
In conclusion, this study demonstrates for the first time the structural regulation of an acetyltransferase by autoacetylation in a prokaryotic organism, a common post-translational event in eukaryotic organisms. Surprisingly PatZ autoacetylation is correlated with its oligomerization and structural stability, as well as with its activity. This study represents a breakthrough in prokaryotic protein modification studies.
Author Contributions
T. D. P. and J. G. J. conceived and coordinated the study and wrote the paper. T. D. P. and J. G. J. designed, performed and analyzed all experiments in paper. J. G. T. provided technical assistance and contributed to the preparation of Fig. 7. S. C.-C., V. B. S., V. F. E., A. M. R., and M. C. D. reviewed the results and approved the final version of the manuscript.
Supplementary Material
Acknowledgments
Dr. A. Torrecillas (Support Center for Research and Development, University of Murcia) and Dr. J. G. Hernández Cifre (Department of Química Física, University of Murcia) are acknowledged for their interest and technical assistance.
This work was supported by Ministry of Economy and Competitiveness Grant BIO2014-54411-C2-1-R and in part by Seneca Foundation Autonomous Community of the Region of Murcia Grant 19236/PI/14. The authors declare that they have no conflicts of interest with the contents of this article.

This article contains supplemental PDB S1–S3.
- PTM
- post-translational modifications
- GNAT
- GCN5-related N-acetyltransferases
- Pat
- protein acetyltransferase
- PatZ
- Escherichia coli Pat
- SePat
- Salmonella enterica Pat
- Acs
- acetyl-CoA synthetase
- PatZGNAT
- GNAT C-terminal catalytic domain
- PatZAcs-like
- truncated N-terminal domain of PatZ without GNAT domain
- PatZwt
- wild type E. coli Pat
- DSC
- differential scanning calorimeter
- DLS
- dynamic light scattering
- AUC
- analytical ultracentrifugation
- BisTris
- 2-[bis(2-hydroxyethyl)amino]-2-(hydroxymethyl)propane-1,3-diol
- Acs
- acetyl-CoA synthetase
- PDB
- Protein Data Bank
- SV
- sedimentation velocity.
References
- 1. Pisithkul T., Patel N. M., Amador-Noguez D. (2015) Post-translational modifications as key regulators of bacterial metabolic fluxes. Curr. Opin. Microbiol. 24, 29–37 [DOI] [PubMed] [Google Scholar]
- 2. Weinert B. T., Iesmantavicius V., Wagner S. A., Schölz C., Gummesson B., Beli P., Nyström T., Choudhary C. (2013) Acetyl-phosphate is a critical determinant of lysine acetylation in E. coli. Mol. Cell 51, 265–272 [DOI] [PubMed] [Google Scholar]
- 3. Wagner G. R., Payne R. M. (2013) Widespread and enzyme-independent Nϵ-acetylation and Nϵ-succinylation of proteins in the chemical conditions of the mitochondrial matrix. J. Biol. Chem. 288, 29036–29045 [DOI] [PMC free article] [PubMed] [Google Scholar]
- 4. Kuhn M. L., Zemaitaitis B., Hu L. I., Sahu A., Sorensen D., Minasov G., Lima B. P., Scholle M., Mrksich M., Anderson W. F., Gibson B. W., Schilling B., Wolfe A. J. (2014) Structural, kinetic and proteomic characterization of acetyl phosphate-dependent bacterial protein acetylation. PLoS ONE 9, e94816. [DOI] [PMC free article] [PubMed] [Google Scholar]
- 5. Dyda F., Klein D. C., Hickman A. B. (2000) GCN5-related N-acetyltransferases: a structural overview. Annu. Rev. Biophys. Biomol. Struct. 29, 81–103 [DOI] [PMC free article] [PubMed] [Google Scholar]
- 6. Marchler-Bauer A., Derbyshire M. K., Gonzales N. R., Lu S., Chitsaz F., Geer L. Y., Geer R. C., He J., Gwadz M., Hurwitz D. I., Lanczycki C. J., Lu F., Marchler G. H., Song J. S., Thanki N., et al. (2015) CDD: NCBI's conserved domain database. Nucleic Acids Res. 43, D222–D226 [DOI] [PMC free article] [PubMed] [Google Scholar]
- 7. Burk D. L., Ghuman N., Wybenga-Groot L. E., Berghuis A. M. (2003) X-ray structure of the AAC(6′)-Ii antibiotic resistance enzyme at 1.8 A resolution; examination of oligomeric arrangements in GNAT superfamily members. Protein Sci. 12, 426–437 [DOI] [PMC free article] [PubMed] [Google Scholar]
- 8. Thao S., Escalante-Semerena J. C. (2011) Biochemical and thermodynamic analyses of Salmonella enterica Pat, a multidomain, multimeric N-lysine acetyltransferase involved in carbon and energy metabolism. MBio 2, e00216–11 [DOI] [PMC free article] [PubMed] [Google Scholar]
- 9. Castaño-Cerezo S., Bernal V., Post H., Fuhrer T., Cappadona S., Sánchez-Díaz N. C., Sauer U., Heck A. J., Altelaar A. F., Cánovas M. (2014) Protein acetylation affects acetate metabolism, motility and acid stress response in Escherichia coli. Mol. Syst. Biol. 10, 762. [DOI] [PMC free article] [PubMed] [Google Scholar]
- 10. Trievel R. C., Rojas J. R., Sterner D. E., Venkataramani R. N., Wang L., Zhou J., Allis C. D., Berger S. L., Marmorstein R. (1999) Crystal structure and mechanism of histone acetylation of the yeast GCN5 transcriptional coactivator. Proc. Natl. Acad. Sci. U.S.A. 96, 8931–8936 [DOI] [PMC free article] [PubMed] [Google Scholar]
- 11. Rojas J. R., Trievel R. C., Zhou J., Mo Y., Li X., Berger S. L., Allis C. D., Marmorstein R. (1999) Structure of Tetrahymena GCN5 bound to coenzyme A and a histone H3 peptide. Nature 401, 93–98 [DOI] [PubMed] [Google Scholar]
- 12. Tanner K. G., Langer M. R., Kim Y., Denu J. M. (2000) Kinetic mechanism of the histone acetyltransferase GCN5 from yeast. J. Biol. Chem. 275, 22048–22055 [DOI] [PubMed] [Google Scholar]
- 13. Yan Y., Harper S., Speicher D. W., Marmorstein R. (2002) The catalytic mechanism of the ESA1 histone acetyltransferase involves a self-acetylated intermediate. Nat. Struct. Biol. 9, 862–869 [DOI] [PubMed] [Google Scholar]
- 14. Berndsen C. E., Albaugh B. N., Tan S., Denu J. M. (2007) Catalytic mechanism of a MYST family histone acetyltransferase. Biochemistry 46, 623–629 [DOI] [PMC free article] [PubMed] [Google Scholar]
- 15. Starai V. J., Escalante-Semerena J. C. (2004) Identification of the protein acetyltransferase (Pat) enzyme that acetylates Acetyl-CoA synthetase in Salmonella enterica. J. Mol. Biol. 340, 1005–1012 [DOI] [PubMed] [Google Scholar]
- 16. Gardner J. G., Grundy F. J., Henkin T. M., Escalante-Semerena J. C. (2006) Control of acetyl-coenzyme A synthetase (AcsA) activity by acetylation/deacetylation without NAD+ involvement in Bacillus subtilis. J. Bacteriol. 188, 5460–5468 [DOI] [PMC free article] [PubMed] [Google Scholar]
- 17. Crosby H. A., Heiniger E. K., Harwood C. S., Escalante-Semerena J. C. (2010) Reversible N-lysine acetylation regulates the activity of Acyl-CoA synthetases involved in anaerobic benzoate catabolism in Rhodopseudomonas palustrisss. Mol. Microbiol. 76, 874–888 [DOI] [PMC free article] [PubMed] [Google Scholar]
- 18. Xu H., Hegde S. S., Blanchard J. S. (2011) The reversible acetylation and inactivation of Mycobacterium tuberculosis acetyl-CoA synthetase is dependent on cAMP. Biochemistry 50, 5883–5892 [DOI] [PMC free article] [PubMed] [Google Scholar]
- 19. Castaño-Cerezo S., Bernal V., Blanco-Catalá J., Iborra J. L., Cánovas M. (2011) cAMP-CRP coordinates the expression of the protein acetylation pathway with central metabolism in Escherichia coli. Mol. Microbiol. 82, 1110–1128 [DOI] [PubMed] [Google Scholar]
- 20. Starai V. J., Celic I., Cole R. N., Boeke J. D., Escalante-Semerena J. C. (2002) Sir2-dependent activation of acetyl-CoA synthetase by deacetylation of active lysine. Science 298, 2390–2392 [DOI] [PubMed] [Google Scholar]
- 21. Bennett B. D., Kimball E. H., Gao M., Osterhout R., Van Dien S. J., Rabinowitz J. D. (2009) Absolute metabolite concentrations and implied enzyme active site occupancy in Escherichia coli. Nat. Chem. Biol. 5, 593–599 [DOI] [PMC free article] [PubMed] [Google Scholar]
- 22. Renilla S., Bernal V., Fuhrer T., Castaño-Cerezo S., Pastor J. M., Iborra J. L., Sauer U., Cánovas M. (2009) An insight into the role of phosphotransacetylase (pta) and the acetate/acetyl-CoA node in Escherichia coli. Microb. Cell Fact. 8, 54, 1–19 [DOI] [PMC free article] [PubMed] [Google Scholar]
- 23. Chan C. H., Garrity J., Crosby H. A., Escalante-Semerena J. C. (2011) In Salmonella enterica, the sirtuin-dependent protein acylation/deacylation system (SDPADS) maintains energy homeostasis during growth on low concentrations of acetate. Mol. Microbiol. 80, 168–183 [DOI] [PMC free article] [PubMed] [Google Scholar]
- 24. Kitagawa M., Ara T., Arifuzzaman M., Ioka-Nakamichi T., Inamoto E., Toyonaga H., Mori H. (2005) Complete set of ORF clones of Escherichia coli ASKA library (a complete set of E. coli K-12 ORF archive): unique resources for biological research. DNA Res. 12, 291–299 [DOI] [PubMed] [Google Scholar]
- 25. Williamson J., Corkey B. (1969) Assays of Intermediates of the Citric Acid, (Lowenstein J., ed), Vol. XIII, pp. 494–497, Academic Press, New York [Google Scholar]
- 26. Moulder R., Filén J.-J., Salmi J., Katajamaa M., Nevalainen O. S., Oresic M., Aittokallio T., Lahesmaa R., Nyman T. A. (2005) A comparative evaluation of software for the analysis of liquid chromatography-tandem mass spectrometry data from isotope coded affinity tag experiments. Proteomics 5, 2748–2760 [DOI] [PubMed] [Google Scholar]
- 27. Kapp E. A., Schütz F., Connolly L. M., Chakel J. A., Meza J. E., Miller C. A., Fenyo D., Eng J. K., Adkins J. N., Omenn G. S., Simpson R. J. (2005) An evaluation, comparison, and accurate benchmarking of several publicly available MS/MS search algorithms: sensitivity and specificity analysis. Proteomics 5, 3475–3490 [DOI] [PubMed] [Google Scholar]
- 28. Laue T. M., Shah B., Ridgeway T. M., Pelletier S. L. (1992) in Analytical Ultracentrifugation in Biochemistry and Polymer Science (Harding S. E., Rowe A. J., Horton J. C., eds) pp. 90–125, Royal Society of Chemistry, Cambridge, UK [Google Scholar]
- 29. Schuck P. (2000) Size-distribution analysis of macromolecules by sedimentation velocity ultracentrifugation and Lamm equation modeling. Biophys. J. 78, 1606–1619 [DOI] [PMC free article] [PubMed] [Google Scholar]
- 30. Hill A. (1910) The possible effects of the aggregation of the molecules of hemoglobin on its dissociation curves. J. Physiol. 40, 4–7 [Google Scholar]
- 31. Tanner K. G., Trievel R. C., Kuo M. H., Howard R. M., Berger S. L., Allis C. D., Marmorstein R., Denu J. M. (1999) Catalytic mechanism and function of invariant glutamic acid 173 from the histone acetyltransferase GCN5 transcriptional coactivator. J. Biol. Chem. 274, 18157–18160 [DOI] [PubMed] [Google Scholar]
- 32. Kelley L. A., Sternberg M. J. (2009) Protein structure prediction on the web: a case study using the Phyre server. Nat. Protoc. 4, 363–371 [DOI] [PubMed] [Google Scholar]
- 33. Wass M. N., Kelley L. A., Sternberg M. J. (2010) 3DLigandSite: predicting ligand-binding sites using similar structures. Nucleic Acids Res. 38, W469–W473 [DOI] [PMC free article] [PubMed] [Google Scholar]
- 34. Le Guilloux V., Schmidtke P., Tuffery P. (2009) Fpocket: An open source platform for ligand pocket detection. BMC Bioinformatics 10, 168. [DOI] [PMC free article] [PubMed] [Google Scholar]
- 35. Schmidtke P., Le Guilloux V., Maupetit J., Tufféry P. (2010) fpocket: online tools for protein ensemble pocket detection and tracking. Nucleic Acids Res. 38, W582–W589 [DOI] [PMC free article] [PubMed] [Google Scholar]
- 36. Rochet J. C., Brownie E. R., Oikawa K., Hicks L. D., Fraser M. E., James M. N., Kay C. M., Bridger W. A., Wolodko W. T. (2000) Pig heart CoA transferase exists as two oligomeric forms separated by a large kinetic barrier. Biochemistry 39, 11291–11302 [DOI] [PubMed] [Google Scholar]
- 37. Privalov P. L. (1979) Stability of proteins: small globular proteins. Adv. Protein Chem. 33, 167–241 [DOI] [PubMed] [Google Scholar]
- 38. Fukada H., Sturtevant J. M., Quiocho F. A. (1983) Thermodynamics of the binding of l-arabinose and of d-galactose to the l-arabinose-binding protein of Escherichia coli. J. Biol. Chem. 258, 13193–13198 [PubMed] [Google Scholar]
- 39. Kozakov D., Beglov D., Bohnuud T., Mottarella S. E., Xia B., Hall D. R., Vajda S. (2013) How good is automated protein docking? Proteins 81, 2159–2166 [DOI] [PMC free article] [PubMed] [Google Scholar]
- 40. Kozakov D., Brenke R., Comeau S. R., Vajda S. (2006) PIPER: an FFT-based protein docking program with pairwise potentials. Proteins 65, 392–406 [DOI] [PubMed] [Google Scholar]
- 41. Comeau S. R., Gatchell D. W., Vajda S., Camacho C. J. (2004) ClusPro: a fully automated algorithm for protein-protein docking. Nucleic Acids Res. 32, W96–W99 [DOI] [PMC free article] [PubMed] [Google Scholar]
- 42. Comeau S. R., Gatchell D. W., Vajda S., Camacho C. J. (2004) ClusPro: an automated docking and discrimination method for the prediction of protein complexes. Bioinformatics 20, 45–50 [DOI] [PubMed] [Google Scholar]
- 43. Avbelj F., Fele L. (1998) Role of main-chain electrostatics, hydrophobic effect and side-chain conformational entropy in determining the secondary structure of proteins. J. Mol. Biol. 279, 665–684 [DOI] [PubMed] [Google Scholar]
- 44. Creamer T. P. (2000) Side-chain conformational entropy in protein unfolded states. Proteins 40, 443–450 [DOI] [PubMed] [Google Scholar]
- 45. García De La Torre J., Huertas M. L., Carrasco B. (2000) Calculation of hydrodynamic properties of globular proteins from their atomic-level structure. Biophys. J. 78, 719–730 [DOI] [PMC free article] [PubMed] [Google Scholar]
- 46. García de la Torre J., Huertas M. L., Carrasco B. (2000) HYDRONMR: prediction of NMR relaxation of globular proteins from atomic-level structures and hydrodynamic calculations. J. Magn. Reson. 147, 138–146 [DOI] [PubMed] [Google Scholar]
- 47. Ortega A., Amorós D., García de la Torre J. (2011) Prediction of hydrodynamic and other solution properties of rigid proteins from atomic- and residue-level models. Biophys. J. 101, 892–898 [DOI] [PMC free article] [PubMed] [Google Scholar]
- 48. Moreland J. L., Gramada A., Buzko O. V., Zhang Q., Bourne P. E. (2005) The Molecular Biology Toolkit (MBT): a modular platform for developing molecular visualization applications. BMC Bioinformatics 6, 21. [DOI] [PMC free article] [PubMed] [Google Scholar]
- 49. Xu D., Zhang Y. (2009) Generating triangulated macromolecular surfaces by Euclidean distance transform. PLoS ONE 4, e8140. [DOI] [PMC free article] [PubMed] [Google Scholar]
- 50. Albaugh B. N., Arnold K. M., Denu J. M. (2011) KAT(ching) metabolism by the tail: Insight into the links between lysine acetyltransferases and metabolism. Chembiochem 12, 290–298 [DOI] [PMC free article] [PubMed] [Google Scholar]
- 51. Starai V. J., Escalante-Semerena J. C. (2004) Acetyl-coenzyme A synthetase (AMP forming). Cell. Mol. Life Sci. 61, 2020–2030 [DOI] [PMC free article] [PubMed] [Google Scholar]
- 52. Berndsen C. E., Denu J. M. (2008) Catalysis and substrate selection by histone/protein lysine acetyltransferases. Curr. Opin. Struct. Biol. 18, 682–689 [DOI] [PMC free article] [PubMed] [Google Scholar]
- 53. Langer M. R., Tanner K. G., Denu J. M. (2001) Mutational analysis of conserved residues in the GCN5 family of histone acetyltransferases. J. Biol. Chem. 276, 31321–31331 [DOI] [PubMed] [Google Scholar]
- 54. Altschul S. F., Madden T. L., Schäffer A. A., Zhang J., Zhang Z., Miller W., Lipman D. J. (1997) Gapped BLAST and PSI-BLAST: a new generation of protein database search programs. Nucleic Acids Res. 25, 3389–3402 [DOI] [PMC free article] [PubMed] [Google Scholar]
- 55. Vetting M. W., S de Carvalho L. P., Yu M., Hegde S. S., Magnet S., Roderick S. L., Blanchard J. S. (2005) Structure and functions of the GNAT superfamily of acetyltransferases. Arch. Biochem. Biophys. 433, 212–226 [DOI] [PubMed] [Google Scholar]
- 56. Angus-Hill M. L., Dutnall R. N., Tafrov S. T., Sternglanz R., Ramakrishnan V. (1999) Crystal structure of the histone acetyltransferase Hpa2: a tetrameric member of the Gcn5-related N-acetyltransferase superfamily. J. Mol. Biol. 294, 1311–1325 [DOI] [PubMed] [Google Scholar]
- 57. Dutnall R. N., Tafrov S. T., Sternglanz R., Ramakrishnan V. (1998) Structure of the histone acetyltransferase Hat1: a paradigm for the GCN5-related N-acetyltransferase superfamily. Cell 94, 427–438 [DOI] [PubMed] [Google Scholar]
- 58. Wolf E., Vassilev A., Makino Y., Sali A., Nakatani Y., Burley S. K. (1998) Crystal structure of a GCN5-related N-acetyltransferase. Cell 94, 439–449 [DOI] [PubMed] [Google Scholar]
- 59. Wybenga-Groot L. E., Draker K., Wright G. D., Berghuis A. M. (1999) Crystal structure of an aminoglycoside 6′-N-acetyltransferase: defining the GCN5-related N-acetyltransferase superfamily fold. Structure 7, 497–507 [DOI] [PubMed] [Google Scholar]
- 60. Hickman A. B., Namboodiri M. A., Klein D. C., Dyda F. (1999) The structural basis of ordered substrate binding by serotonin N-acetyltransferase: enzyme complex at 1.8 A resolution with a bisubstrate analog. Cell 97, 361–369 [DOI] [PubMed] [Google Scholar]
- 61. Karanam B., Jiang L., Wang L., Kelleher N. L., Cole P. A. (2006) Kinetic and mass spectrometric analysis of p300 histone acetyltransferase domain autoacetylation. J. Biol. Chem. 281, 40292–40301 [DOI] [PubMed] [Google Scholar]
- 62. Yuan H., Rossetto D., Mellert H., Dang W., Srinivasan M., Johnson J., Hodawadekar S., Ding E. C., Speicher K., Abshiru N., Perry R., Wu J., Yang C., Zheng Y. G., Speicher D. W., et al. (2012) MYST protein acetyltransferase activity requires active site lysine autoacetylation. EMBO J. 31, 58–70 [DOI] [PMC free article] [PubMed] [Google Scholar]
- 63. Creaven M., Hans F., Mutskov V., Col E., Caron C., Dimitrov S., Khochbin S. (1999) Control of the histone-acetyltransferase activity of Tip60 by the HIV-1 transactivator protein, Tat. Biochemistry 38, 8826–8830 [DOI] [PubMed] [Google Scholar]
- 64. Thompson P. R., Wang D., Wang L., Fulco M., Pediconi N., Zhang D., An W., Ge Q., Roeder R. G., Wong J., Levrero M., Sartorelli V., Cotter R. J., Cole P. A. (2004) Regulation of the p300 HAT domain via a novel activation loop. Nat. Struct. Mol. Biol. 11, 308–315 [DOI] [PubMed] [Google Scholar]
- 65. Yachdav G., Kloppmann E., Kajan L., Hecht M., Goldberg T., Hamp T., Hönigschmid P., Schafferhans A., Roos M., Bernhofer M., Richter L., Ashkenazy H., Punta M., Schlessinger A., Bromberg Y., et al. (2014) PredictProtein–an open resource for online prediction of protein structural and functional features. Nucleic Acids Res. 42, W337–W343 [DOI] [PMC free article] [PubMed] [Google Scholar]
- 66. Tucker A. C., Taylor K. C., Rank K. C., Rayment I., Escalante-Semerena J. C. (2014) Insights into the specificity of lysine acetyltransferases. J. Biol. Chem. 289, 36249–36262 [DOI] [PMC free article] [PubMed] [Google Scholar]
- 67. Itahana Y., Ke H., Zhang Y. (2009) p53 Oligomerization is essential for its C-terminal lysine acetylation. J. Biol. Chem. 284, 5158–5164 [DOI] [PMC free article] [PubMed] [Google Scholar]
- 68. Geng H., Liu Q., Xue C., David L. L., Beer T. M., Thomas G. V., Dai M.-S., Qian D. Z. (2012) HIF1α protein stability is increased by acetylation at lysine 709. J. Biol. Chem. 287, 35496–35505 [DOI] [PMC free article] [PubMed] [Google Scholar]
- 69. Ma Q., Wood T. K. (2011) Protein acetylation in procaryotes increases stress resistance. Biochem. Biophys. Res. Commun. 410, 846–851 [DOI] [PMC free article] [PubMed] [Google Scholar]
- 70. Guex N., Peitsch M. C. (1997) SWISS-MODEL and the Swiss-PdbViewer: an environment for comparative protein modeling. Electrophoresis 18, 2714–2723 [DOI] [PubMed] [Google Scholar]
- 71. Datsenko K. A., Wanner B. L. (2000) One-step inactivation of chromosomal genes in Escherichia coli K-12 using PCR products. Proc. Natl. Acad. Sci. U.S.A. 97, 6640–6645 [DOI] [PMC free article] [PubMed] [Google Scholar]
Associated Data
This section collects any data citations, data availability statements, or supplementary materials included in this article.