Background: Cystatin D is a cysteine protease inhibitor with tumor suppressor action.
Results: A proportion of cystatin D protein localizes within the cell nucleus at specific active chromatin sites and regulates gene transcription.
Conclusion: Cystatin D is a multifunctional protein with protease inhibitory and gene regulatory activities.
Significance: Regulation of cystatin D in colon cancer cells has phenotypic consequences beyond the inhibition of lysosomal and secreted cysteine proteases.
Keywords: colon cancer, cysteine protease, cytokine, gene expression, protease inhibitor
Abstract
Cystatin D is an inhibitor of lysosomal and secreted cysteine proteases. Strikingly, cystatin D has been found to inhibit proliferation, migration, and invasion of colon carcinoma cells indicating tumor suppressor activity that is unrelated to protease inhibition. Here, we demonstrate that a proportion of cystatin D locates within the cell nucleus at specific transcriptionally active chromatin sites. Consistently, transcriptomic analysis show that cystatin D alters gene expression, including that of genes encoding transcription factors such as RUNX1, RUNX2, and MEF2C in HCT116 cells. In concordance with transcriptomic data, quantitative proteomic analysis identified 292 proteins differentially expressed in cystatin D-expressing cells involved in cell adhesion, cytoskeleton, and RNA synthesis and processing. Furthermore, using cytokine arrays we found that cystatin D reduces the secretion of several protumor cytokines such as fibroblast growth factor-4, CX3CL1/fractalkine, neurotrophin 4 oncostatin-M, pulmonary and activation-regulated chemokine/CCL18, and transforming growth factor B3. These results support an unanticipated role of cystatin D in the cell nucleus, controlling the transcription of specific genes involved in crucial cellular functions, which may mediate its protective action in colon cancer.
Introduction
Cystatin D is a member of the cystatin superfamily of inhibitors of cathepsins, cysteine proteases that degrade multiple targets including adhesion proteins, matrix components, and other proteases (1, 2). Human cystatin D inhibits cathepsins H, S, and L but not B; it was originally purified from saliva and is encoded by the CST5 gene (3, 4). We have previously reported that cystatin D promotes cell adhesion and decreases proliferation, migration, and invasion of colon carcinoma cells. It is down-regulated during human colon carcinogenesis, and considered as a candidate tumor suppressor that is transcriptionally induced by 1,25-(OH)2D3, the most active metabolite of vitamin D, mediating its protective effects against this neoplasia (5). The finding that mutant forms of cystatin D with no protease inhibitory activity lack the antimigratory but not the antiproliferative effect indicates that cystatin D has cathepsin-independent mechanism(s) of action.
A number of cathepsins are thought to be involved in cancer and other diseases as regulators of a variety of biochemical processes (1, 2). Likewise, cystatins play multiple roles in physiology and pathology, including tumorigenesis and neurodegenerative disorders (6). Preferential attention has been paid to the deregulation and imbalance between cathepsins and cystatins in invasion and metastasis of several neoplasias (6–10). Cathepsins have traditionally been considered endosomal/lysosomal or secreted proteases; however, new evidence supports their localization in other cellular compartments. Recent studies have reported the activity of cathepsin L, a cystatin D target, within the cell nucleus (11–13). Analogously, a few cystatins and other protease inhibitors have been found to act in the nuclear compartment (14–16).
Taken together, these findings prompted us to investigate in depth the mechanism of action of cystatin D protein in colon carcinoma cells. In this study, we demonstrate that a proportion of endogenous and exogenous cystatin D is nuclear and co-localizes with histone markers of active chromatin such as H3K36me3 and RNA polymerase II at specific sites of active transcription. Transcriptomic and proteomic analyses identified a number of cancer-related genes whose expression at the RNA and/or protein level is altered by cystatin D. These results reveal a novel biological activity of cystatin D as a modulator of gene expression that is related to an unpredicted nuclear localization, and explains its tumor suppressor activity mediating vitamin D action in colon cancer.
Experimental Procedures
Cell Culture
Human SW480-ADH and HCT116 colon adenocarcinoma cell lines were maintained in Dulbecco's modified Eagle's medium containing 10% fetal bovine serum and 2 mm l-glutamine (all from Invitrogen, Paisley, UK). SW480-ADH and HCT116 cells stably expressing cystatin D (SW480-ADH-CST5, HCT116-CST5 clone 9 and clone 20) or mock-transfected (SW480-ADH-Mock, HCT116-Mock) were generated as described (5).
Gene Silencing
To knockdown CST5 expression HCT116 cells were infected with lentiviral particles containing a U6 promoter driving a short hairpin RNA (shRNA) targeting CST5 RNA (Mission TRC shRNA; Sigma). Lentiviral particles against human CST5 or scramble negative control were used. After infection the cells were treated with 1 μg/μl of puromycin (Sigma). In parallel, lentiviral particles codifying the TurboGFP gene (clone SHC003; Sigma) were used to estimate transfection efficiency. Control cells were infected with lentivirus bearing a non-targeting shRNA that activates the RISC complex and the RNA interference (RNAi) pathway but contains at least five mismatched nucleotides compared with any human gene (clone SHC002; Sigma).
Immunofluorescence and Confocal Microscopy
Cultured cells were grown on 10 × 10-mm glass coverslips. The cells were washed twice in phosphate-buffered saline (PBS) and fixed with 3.7% formaldehyde (freshly prepared from paraformaldehyde) in PBS for 15 min at room temperature. For the immunodetection of the largest subunit of the RNA polymerase II (H5 antibody) and histone H3K36me3, cells were fixed with 3.7% paraformaldehyde containing 0.5% Triton X-100 for 10 min. Following fixation, all cell samples were sequentially incubated with 0.5% Triton X-100 in PBS for 30 min, 2% BSA in PBS for 30 min, and 0.05% Tween 20 in PBS for 5 min. Cells were then incubated for 2 h at room temperature with the primary antibody diluted in PBS, washed in PBS containing 0.05% Tween 20, incubated for 45 min with the appropriate secondary antibodies conjugated with FITC or Texas Red (Jackson ImmunoResearch Laboratories, West Grove, PA), and mounted with VectaShield (Vector Laboratories, Peterborough, UK).
Confocal microscopy was performed with an LSM510 laser scanning microscope (Carl Zeiss, Oberkochen, Germany) using excitation wavelengths of 488 (for FITC) and 543 nm (for Texas Red). All confocal scans were acquired with the LSM510 software using a Plan Apochromat ×63 NA 1.4 objective (Carl Zeiss). Images were collected with 8-fold averaging at 1024 × 1024 pixel resolution using pinhole settings between 0.9 and 1 airy units. For double labeling experiments, images of the same confocal plane were sequentially recorded and pseudocolor images were generated and superimposed. TIFF images were further processed using Photoshop (CS3, Adobe Systems, San Jose, CA) for presentation.
The following primary antibodies were used: goat polyclonal anti-cystatin D antibody (N-19; blocking peptide (N-19)P, Santa Cruz Biotechnology, Santa Cruz, CA), rabbit polyclonal anti-histone H3K36me3 (1:200, Upstate, New York, NY), mouse monoclonal anti-pan-Histone (H11–4, 1:200, Roche Applied Science, Mannheim, Germany), mouse monoclonal anti-2,2,7-trimethylguanosine cap (TMG-cap), which recognizes the 5′ cap structure of spliceosomal snRNPs (K121, 1:100, Oncogene Research, La Jolla, CA), mouse monoclonal anti-fibrillarin (38F3, 1:100, Abcam, Cambridge, UK), and mouse monoclonal anti-RNA polymerase II, which recognizes the largest subunit (Rpb1) phosphorylated on Ser2 of the heptapeptide repeat (H5 IgM antibody, 1:100, Covance, Princeton, NJ).
RNA Extraction, Real-Time PCR, and RT-PCR
Total RNA from cultured cell lines was extracted using the NucleoSpin® miRNA extraction kit (Macherey-Nagel, Duren, Germany). Quantitative real-time (qRT)7-PCR (qRT-PCR) analyses of CST5 (Hs00983867_m1), MAL2 (Hs00294541_m1), MEF2C (Hs00231149_m1), AP1M2 (Hs00194014_m1), RUNX2 (Hs00231692_m1), ID3 (Hs00171409_m1), NAV3 (Hs00372108_m1), NT5E (Hs01573922_m1), VCAN (Hs00171642_m1), WNT16 (Hs00365138_m1), ANX3 (Hs00192982_m1), RUNX1 (Hs01021970_m1), and EMP3 (Hs01011451_m1) were performed using the TaqMan Gene Expression Master Mix (Thermo Fisher Scientific, Waltham, MA). Thermal cycling was initiated with a denaturation step of 95 °C for 10 min and consisted of 40 cycles (denaturation at 95 °C 10 s, annealing and elongation at 60 °C for 60 s). RNA expression values were normalized versus the housekeeping 18S and RPLPO rRNA. The reaction was performed in a CFX384 Real-time PCR Detection System (Bio-Rad).
Cell Fractioning
To obtain nuclear extracts, cell monolayers were washed in PBS and lysed for 15 min in hypotonic buffer (10 mm HEPES, pH 7.5, 10 mm KCl, 0.1 mm EDTA, 0.1 mm EGTA) supplemented with 1 mm DDT, 1 mm orthovanadate, 1 mm PMSF, 10 μg/ml of leupeptin, and 10 μg/ml of aprotinin. Just before centrifugation (15,700 × g at 4 °C for 1 min), 10% Nonidet P-40 was added to the tubes. Supernatants (cytosolic extracts) were conserved at −80 °C until analysis. Pellets containing nuclei were lysed by incubation for 30 min in hypertonic buffer (20 mm HEPES, pH 7.5, 0.4 m NaCl, 1 mm EDTA, 1 mm EGTA) supplemented as above, and then centrifuged at 15,700 × g for 10 min at 4 °C. Supernatants (nuclear extracts) were conserved at −80 °C until analysis.
Western Blotting
Western blot analysis was done as previously described (5). We used rabbit polyclonal antibodies generated against RUNX1 (Abcam) and NR3C1 and CBP/CREBBP (Santa Cruz Biotechnology); mouse monoclonal antibodies against IQGAP2 (Merck Millipore, Billerica, MA), RUNX2 (Medical and Biological Laboratories, MBL, Woburn, MA), and β-tubulin and HDAC1 (Santa Cruz Biotechnology); and goat polyclonal antibodies against cystatin D, ZEB1, and lamin B (Santa Cruz Biotechnology). Secondary antibodies used were HPR-conjugated anti-rabbit IgG (H+L) (MP Biomedicals, Santa Ana, CA), anti-mouse IgG (H+L) (Promega, Madison, WI), and anti-rat IgG and anti-goat IgG (Santa Cruz Biotechnology).
Immunoelectron Microscopy
For double immunogold electron microscopy detection of cystatin D and RNA pol II, cultured SW480-ADH cells were fixed with 4% paraformaldehyde and 0.1% glutaraldehyde in 0.1 m cacodilate buffer for 30 min at room temperature. After fixation, cells were scraped off, transferred to an Eppendorf tube, and centrifuged for 10 min at 13,400 × g in a minicentrifuge. Cell pellets were washed in 0.1 m cacodylate buffer, dehydrated in increasing concentrations of methanol at −20 °C, embedded in Lowicryl K4M at −20 °C, and polymerized by ultraviolet irradiation. Ultrathin sections of 60 nm were obtained by using an ultramicrotome (Ultracut UCT, Leica), mounted on nickel grids and sequentially incubated with 0.1 m glycine in PBS for 15 min, 5% BSA in PBS for 30 min and a goat polyclonal anti-cystatin D antibody (diluted 1:25 in 50 mm Tris-HCl, pH 7.6, containing 1% BSA) overnight at 4 °C. Ultrathin sections were then incubated with a mouse monoclonal anti-RNA pol II antibody (H5, IgM, diluted 1:50 in 50 mm Tris-HCl, pH 7.6, containing 1% BSA) for 2 h at room temperature and then with the appropriate secondary antibodies coupled to 10 or 15 nm gold particles (BioCell; diluted 1:50 in PBS containing 1% BSA). Following immunogold labeling, the grids were stained with uranyl acetate and examined under a JEOL EM201 electron microscope. As controls, ultrathin sections were treated as described above but omitting primary antibodies.
Global Gene Expression Using High-density Microarrays
Genome-wide expression was analyzed in the isolated samples using the GeneChip Human Gene 1.0 ST Array (from Affymetrix, Santa Clara, CA). This microarray includes 804,372 distinct oligonucleotide probes and maps into 19,213 unique human gene loci (17). RNA isolation, labeling, and microarray hybridization followed the manufacturer's protocols for the GeneChip platform by Affymetrix. Methods included synthesis of first- and second-strand cDNAs, the purification of double-stranded cDNA, synthesis of cRNA by in vitro transcription, recovery and quantitation of biotin-labeled cRNA, fragmentation of this cRNA and subsequent hybridization to the microarray slide, post-hybridization washings, and detection of the hybridized cRNAs using a streptavidin-coupled fluorescent dye. Hybridized Affymetrix arrays were scanned with an Affymetrix Gene-Chip 3000 scanner. Image generation and feature extraction were performed using Affymetrix GCOS Software.
Bioinformatic Analysis
The Robust Microarray Analysis algorithm was used for background correction, intra- and inter-microarray normalization, and expression signal calculation (18). The absolute expression signal for each gene was calculated for each microarray. The expression signal was calculated using the CDF package called GeneMapper from GATExplorer (genemapperhumangene1.0cdf; see website) (17), which maps into an updated version of human genes, instead of using the original probe set definition provided by Affymetrix. This mapping provides an improvement thanks to the re-annotation to updated gene loci and removal of cross-hybridation noise (17). It also allows us to operate from the beginning using gene identification (Ensembl IDs) instead of probe sets (Affymetrix IDs). Mapping to genome version Ensembl v57 (assembly GRCh37) was used for these analyses.
Significance analysis of microarray (19) was applied to calculate significant differential expression and find the genes that characterized the samples of each compared state. In this method, permutations provide robust statistical inference of the most significant genes and using a false discovery rate (20) to adjust the raw p values to multiple testing. Because the differences in the two sets of microarrays compared (i.e. two treated samples versus two control samples) were small, we use several cumulative criteria to allow the selection of the most significant genes: (i) first, we set up an open cut-off of false discovery rate <0.25 to select the list of the genes with best adjusted p values (this step provided a preliminar set of 377 genes); (ii) second, we considered the individual raw p value of each gene setting up another cut-off of <0.01; (iii) third, we ranked the genes by their signal fold-change (log2 scale) calculated with significance analysis of microarray algorithm and selected only the top ones with cut-offs of fold-change >1.5 for overexpression and fold-change <0.65 for repression. This protocol allows identifying a final set of 69 genes that suffered a relevant expression change induced by cystatin D. Following the identification of differentially expressed genes, the corresponding matrix of signal-normalized expression values for all the samples hybridized was analyzed using the HCLUST clustering algorithm. This algorithm performs hierarchical cluster analysis with complete linkage to find similarity between genes based on their expression (Pearson correlation) along the samples analyzed. The algorithm classifies the genes in correlated groups presenting similar expression profiles. All the bioinformatic analyses were performed with the statistical programming R, using some Bioconductor and GATExplorer packages (17).
Proteomic Analysis
Sample preparation and in-gel digestion. For metabolic labeling, HCT116-CST5 clone 9 and HCT116-Mock cells were maintained in DMEM supplemented with 10% dialyzed FBS (Invitrogen), 100 units/ml of penicillin/streptomycin (Invitrogen) at 37 °C and 5% CO2, and lysine or arginine in either light (12C6) or heavy forms (13C6) (Dundee Cell products, Dundee, ANS, United Kingdom). After 8 doublings, SILAC (stable isotope labeling with amino acids in cell culture) incorporation rate was determined as previously described (21). Forward and reverse experiments were performed to discard labeling biases.
Cells were lysed in RIPA buffer and proteins were measured using the two-dimensional Quant kit (GE Healthcare, Little Chalfont, UK). Samples (15 μg of protein) from each condition were mixed in a 1:1 ratio and separated by SDS-PAGE. Gels were then stained with Novex® Colloidal Coomassie Blue Staining Kit (Thermo Fisher Scientific) and lanes were sliced into 15 fractions and in-gel digested with trypsin (Sequencing grade, Promega) (22). After digestion, samples were desalted using ZipTip C18 with 0.6 μl of resin (Millipore), dried, and resuspended in 6 μl of 0.1% trifluoroacetic acid, 2% acetonitrile.
Mass Spectrometry and Data Analyses
We used a nanoEasy HPLC (Proxeon, Thermo Fisher Scientific) directly coupled to a nanoelectrospay ion source (Proxeon, ThermoFisher Scientific). Peptides were trapped in a C18-A1 ASY-Column 2-cm precolumn (ThermoFisher Scientific), eluted to a Biosphere C18 column (C18, inner diameter 75 μm, 10 cm long, 3 μm particle size) (NanoSeparations) and separated using a 180-min gradient from 0–35% buffer B (buffer A: 0.1% formic acid, 2% ACN; buffer B: 0.1% formic acid in ACN) at a flow rate of 250 nl/min. Mass spectra were acquired in a linear ion trap Orbitrap Velos (ThermoFisher Scientific) in the positive-ion mode. MS survey scans (m/z 400–1200) were acquired in the Orbitrap at a resolution of 60,000 (FWHM) and a target value of 1.0e+06 ions. The 15 most intense ions of the survey scan were selected for collision-induced dissociation fragmentation in the linear ion trap, where collision energy was set to 35%. Dynamic exclusion was enabled with one repeat count and exclusion duration of 30 s. Precursor ion charge state screening and mono-isotopic precursor selection were enabled and singly charged ions and unassigned charge states were rejected. Mass spectra were searched using MASCOT (version 2.3, Matrix Science) through Proteome Discoverer (version 1.3.0.339, ThermoFisher Scientific) against the human SwissProt database (SwissProt_57.15.fasta). Precursor and fragment mass tolerance were set to 10 ppm and 0.8 Da, respectively, with a maximum of two missed cleavages for trypsin. Carbamidomethylation of cysteines was set as fixed modification, and variable modifications included oxidation of methionine, N-terminal acetylation, and [13C]Arg, [13C]Lys. Identifications were validated using Percolator with a q-value threshold of 0.01 and proteins were quantified using Proteome Discoverer. Data were finally normalized using the 5% trimmed means.
Human Protein Cytokine Array
HCT116-CST5 clone 9 and HCT116-Mock cells were cultured at 37 °C in an atmosphere of 5% CO2 for 24 h in serum-free DMEM. Conditioned media from cultured cells were harvested and centrifuged at 1,000 × g to remove cell debris and filtered through 0.22 μm. Human Cytokine Array V membranes (RayBiotech, Norcross, GA) were blocked in blocking buffer for 1 h and then incubated with 2 ml of conditioned medium from each cell culture overnight at 4 °C. Membranes were then treated and analyzed according to the manufacturer's instructions (23).
Enzyme-linked ImmunoSorbent Assay (ELISA)
The levels of CX3CL1/fractalkine in HCT116-CST5, HCT116-Mock, HCT116-shCST5, and HCT116-shMock cell supernatants were measured by using an ELISA kit (EHCX3CL1, ThermoFisher Scientific) following the manufacturer's instructions. Briefly, cells were cultured and supernatants were collected after 24 and 48 h (HCT116-CST5 and HCT116-Mock cells) or 48 h (HCT116-shCST5 and HCT116-shMock cells). Conditioned media were then harvested and concentrated by means of centrifugal filter devices (Amicon® Ultra-4 3K, Merck Millipore). Standards or culture sample supernatants (100 μl) were added in duplicate and incubated at room temperature overnight. After four washes in 1× wash buffer, 100 μl of biotinylated antibody were added to each well for 1 h. Following incubation and washes, 100 μl of prepared strepavidin-HRP solution was added to each well for 45 min. TMB substrate (100 μl) was then added to each well for 30 min at room temperature. To stop the reaction 50 μl of stop solution was added to each well. Absorbance was measured on an ELISA plate reader set at 450 and 550 nm.
Statistical Analysis
Results are expressed as mean ± S.E. unless otherwise specified. Statistical significance was assessed by two-tailed t-tests assuming equal variances. Differences were considered significant when p < 0.05. The single asterisk indicates p < 0.05, the double asterisk p < 0.01, and the triple asterisk p < 0.001. All statistical analyses were performed using the Prism software V6 (GraphPad software).
Results
Cystatin D Partially Localizes in the Cell Nucleus
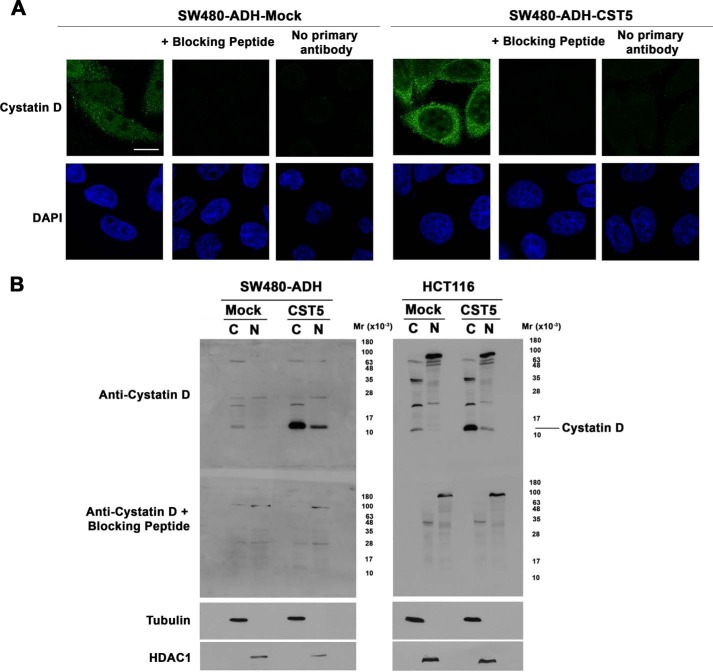
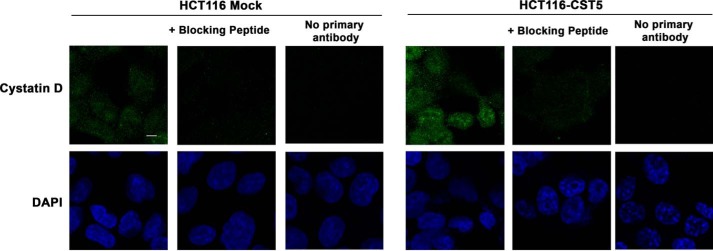
To examine the intracellular localization of cystatin D in human colon carcinoma cells we first used immunofluorescence and confocal microscopy analysis. Signal of endogenous cystatin D in SW480-ADH cells was predominantly detected in the cytoplasm and was also consistent within the nucleus excluding the nucleoli (Fig. 1A). The same pattern and stronger signal was found in cells expressing an exogenous CST5 gene (SW480-ADH-CST5). Signal specificity was checked by preincubation of the anti-cystatin D antibody with a blocking peptide and by incubation with secondary antibody alone (Fig. 1A). Similar results were found in the case of HCT116 cells that express very low levels of nuclear cystatin D when stably transfected with an exogenous CST5 gene (Fig. 2).
FIGURE 1.
Cystatin D partially localizes within the cell nucleus. A, confocal immunofluorescence analysis showing that cystatin D is distributed in both nucleus and cytoplasm of SW480-ADH cells (upper panels, scale bar, 5 μm). Nuclear staining using DAPI is shown. Preincubation of the anti-cystatin D antibody with a specific blocking peptide and incubation with the secondary antibody alone were performed as controls. B, Western blot analysis showing the presence of cystatin D in both cytoplasm (C) and nuclear (N) fractions of mock- and CST5-transfected SW480-ADH and HCT116 cells. For control of the purity of cellular fractions the filters were reprobed with antibodies against β-tubulin and HDAC1.
FIGURE 2.
Exogenous cystatin D partially localizes within the nucleus of HCT116 cells. Confocal immunofluorescence analysis showing that cystatin D is distributed in both the nucleus and cytoplasm of HCT116-CST5 cells that express exogenous cystatin D (scale bars, 5 μm).
To further confirm this cellular distribution of cystatin D protein, we performed Western blot analyses of nuclear and cytoplasmic fractions of SW480-ADH and HCT116 cells. Purity of fractions was checked using antibodies against HDAC1 and β-tubulin, respectively. In agreement with data obtained in the immunofluorescence studies, cystatin D was detected in both cellular fractions (Fig. 1B). Taking into consideration cell fractioning, dilutions, and loading, nuclear cystatin D accounted for ∼10% of the total in the SW480-ADH cells and 15% in HCT116 cells.
Cystatin D Is Present at Transcriptionally Active Chromatin
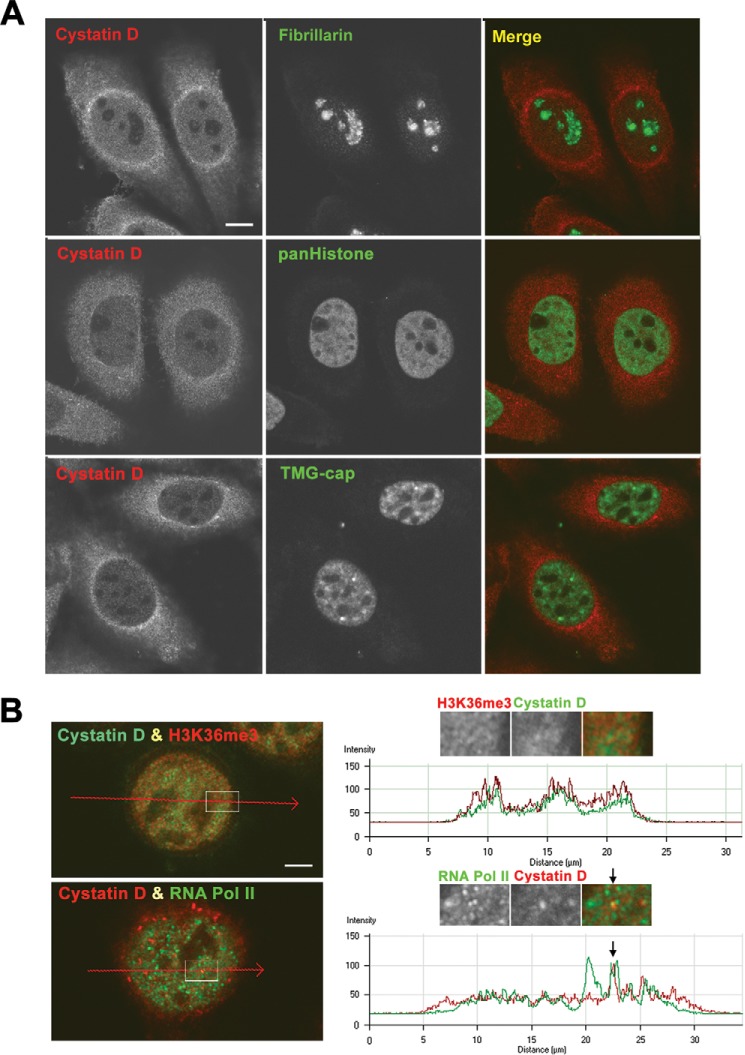
To determine the localization of cystatin D in the cell nucleus, we performed double immunofluorescence analyses of cystatin D and markers of nucleolus (fibrillarin), chromatin (pan-histone), and nuclear speckles and Cajal bodies, reservoirs of splicing factors (TMG-cap). The lack of colocalization with fibrillarin confirmed that cystatin D was absent from nucleoli (Fig. 3A, upper panels). Cystatin D was distributed in nuclear domains immunoreactive for pan-histone (Fig. 3A, middle panels), whereas it was not detected, or very weak, in nuclear speckles and Cajal bodies (brilliant fluorescent spots) immunolabeled with the anti-TMG-cap antibody (Fig. 3A, lower panels). The wide distribution of cystatin D was suggestive of chromatin localization; however, the very strong signal obtained using the anti-pan-Histone antibody precluded a definitive conclusion. So we then performed double immunofluorescence using antibodies against histone H3 trimethylated at position Lys36 (H3K36me3), an epigenetic marker of active chromatin. These assays and their corresponding line profile analyses of fluorescence intensities from histone H3K36me3 (red) and cystatin D (green) across a cell revealed a nearly total colocalization in the graph peaks corresponding to chromatin domains (Fig. 3B, upper panels). This result supported the presence of cystatin D at sites of active transcription. This was confirmed by using an antibody against the largest subunit (Rpb1) phosphorylated on Ser2 of the heptapeptide repeat of RNA polymerase (pol) II. Double immunofluorescence showed that cystatin D accumulated and colocalized with active RNA polymerase II at specific sites, whereas it was absent from other areas of active transcription (Fig. 3B, lower panels). Thus, fluorescence intensity profiles of cystatin D (red) and RNA pol II (green) measured across a line illustrated the co-localization of active RNA pol II and cystatin D in a nuclear microfocus (arrow), whereas the latter protein was absent in another microfoci immunoreactive for RNA pol II (green peak) (Fig. 3B, lower right panel).
FIGURE 3.
Intranuclear location of cystatin D in SW480-ADH cells. A, double immunolabeling for cystatin D in combination with fibrillarin (nucleolus marker, upper panel), pan-histone (chromatin marker, middle panels), and TMG-cap (nuclear speckles and Cajal bodies marker, lower panels). Scale bar, 5 μm. B, upper panels, double immunolabeling for cystatin D and histone H3K36me3, epigenetic marker of transcriptionally active chromatin. The enlarged insets show a representative example of a nuclear domain with co-localization foci of both immunostaining signals. The graph shows a line profile analysis of signal intensities (arbitrary units) from histone H3K36me3 (red) and cystatin D (green) across a line. Lower panels, double immunostaining analysis of cystatin D and active RNA pol II expression. The enlarged inset shows a magnification of a representative nuclear domain illustrating the concentration of both fluorescent signals in microfoci. The graph shows an intensity profile of cystatin D (red) and RNA pol II (green) across a line revealing the co-localization of active RNA pol II and cystatin D in a nuclear microfocus (arrow), whereas the latter was absent from other RNA pol II-positive microfoci. Scale bars, 2.5 μm.
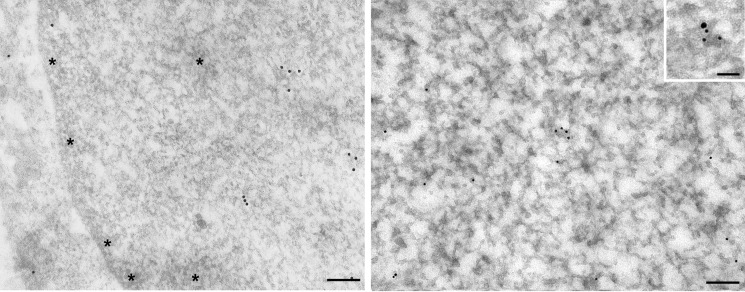
Immunogold electron microscopy further confirmed the presence of cystatin D in transcriptionally active chromatin. Thus, immunogold particles were exclusively localized in euchromatic domains showing some microfoci of accumulation, but they were totally absent from heterochromatin (Fig. 4). Double immunogold labeling also confirmed that RNA pol II colocalized with some cystatin D-positive nuclear microfoci (Fig. 4, inset). However, a direct interaction between cystatin D and RNA pol II could not be revealed by co-immunoprecipitation experiments (not shown). To search for other nuclear proteins interacting with cystatin D we then performed yeast two-hybrid assays (ULTImate Y2HTM Analysis, Hybrigenics, Paris, France). This study rendered two preferential candidates, N-Myc interacting protein (NMI)-1 (NMI) and Cullin-1 (CUL1). However, neither were validated in co-immunoprecipitation or double immunofluorescence assays in HCT116 cells (not shown), suggesting that their interaction with cystatin D is either weak and/or transient, or does not take place in human cells.
FIGURE 4.
Immunogold electron microscopy location of cystatin D in the nuclei of SW480-ADH cells. Gold particles appear distributed in euchromatin domains, whereas condensed chromatin areas (asterisks) are devoid of labeling. Inset, double immunogold labeling revealed the colocalization of RNA pol II (15-nm particle) and cystatin D (10-nm particles) in a nuclear microfocus within euchromatin. Scale bars, 100 nm; inset, 50 nm.
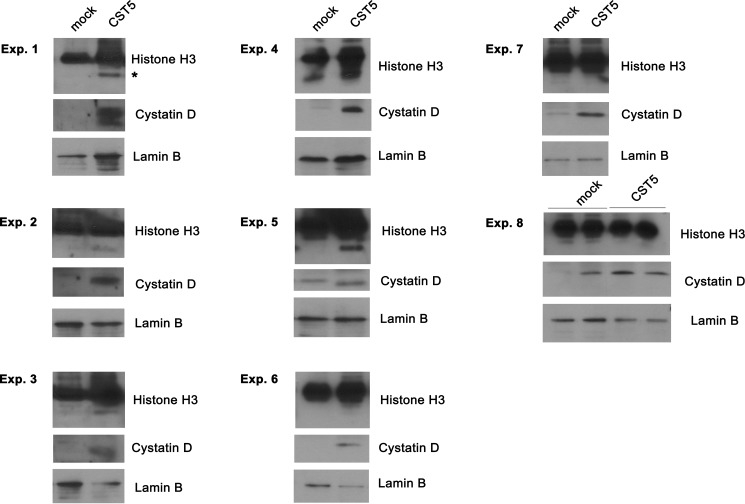
In the search for functions of cystatin D in the nucleus, we examined its effect on the reported partial proteolysis of histone H3 by cathepsin L, one of its extranuclear targets. To this end, we analyzed in Western blots the integrity of histone H3 in HCT116-CST5 and HCT116-Mock cells. No consistent differences were found in a series of eight independent experiments, which showed increased, reduced, or absent histone H3 proteolysis in cells containing nuclear cystatin D (Fig. 5). Taken together, these results indicate that nuclear cystatin D locates in euchromatin at sites of active transcription and that its action may be independent of protease inhibition.
FIGURE 5.
Analysis of histone H3 expression in HCT116-CST5 and HCT116-Mock cells. Partially proteolyzed histone H3 is indicated with an asterisk.
Cystatin D Changes the Transcriptome of Human Colon Carcinoma Cells
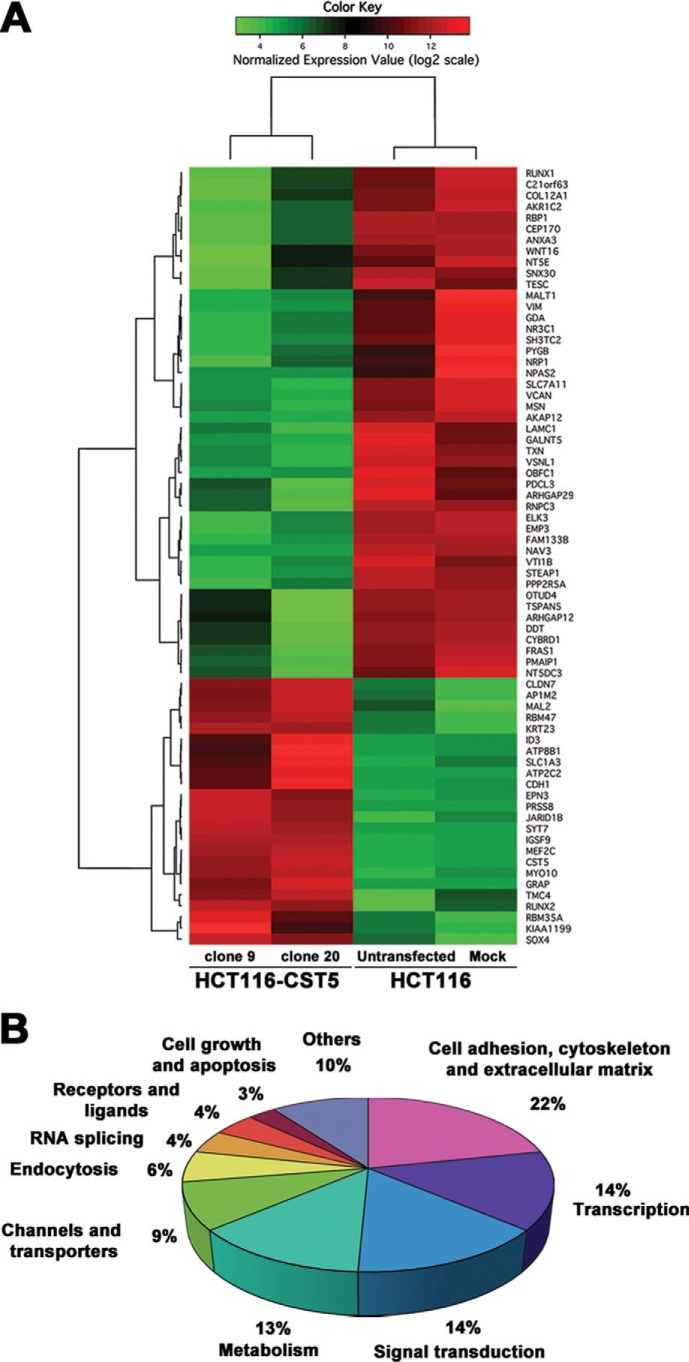
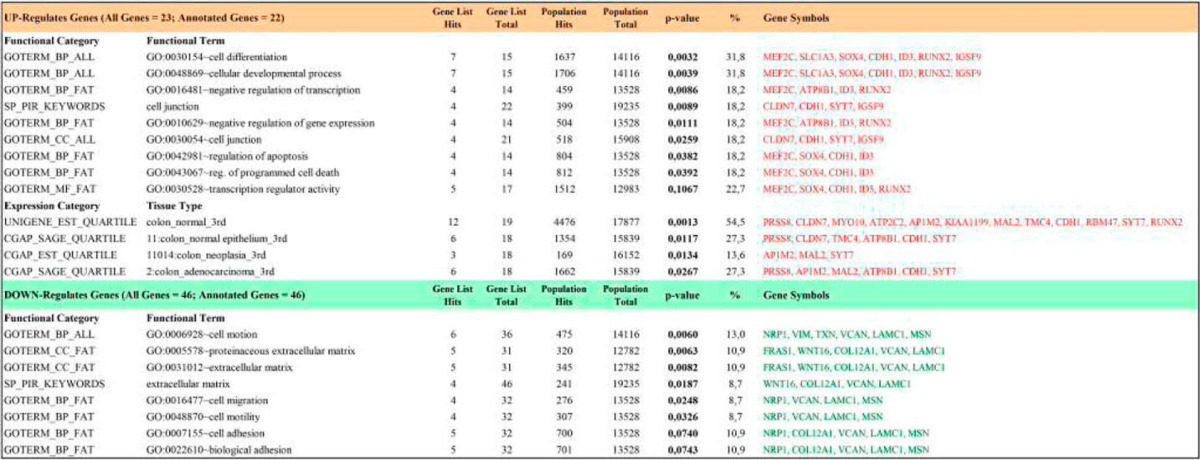
To examine how this precise nuclear localization of cystatin D at transcriptionally active sites might affect gene expression, we compared the transcriptome of HCT116 cells lacking (HCT116-Untransfected and HCT116-Mock) and expressing (HCT116-CST5 clones 9 and 20) cystatin D using genome-wide expression microarrays. Cystatin D altered the pattern of gene expression in HCT116 cells affecting up to 69 genes, of which 23 genes (33%) were induced and 46 genes (66%) were repressed (Fig. 6) (GEO accession: GSE45904). The majority (75%) of target genes can be classified into five functional categories: cell adhesion, cytoskeleton and extracellular matrix, transcription, signal transduction, metabolism, and channels and transporters (Fig. 6B). The main functions assigned to the genes affected by cystatin D were corroborated by an enrichment analysis done using the DAVID functional annotation tool (Table 1) (24). This analysis revealed a clear enrichment in the functions shown in Fig. 6B that are related to cancer regulation: regulation of apoptosis and cell death, regulation of transcription and cell adhesion, cell motion and cell migration (supplemental Table S1).
FIGURE 6.
Cystatin D modulates gene expression in HCT116 cells. A, heat map representation of significantly modulated genes by cystatin D: 23 up-regulated genes and 46 down-regulated genes. B, functional distribution of candidate target genes regulated by cystatin D overexpression. The most represented categories and the percentage of genes in them are shown.
TABLE 1.
Functional enrichment analysis of cystatin D-regulated genes
Effects of Cystatin D on the Nuclear Proteome
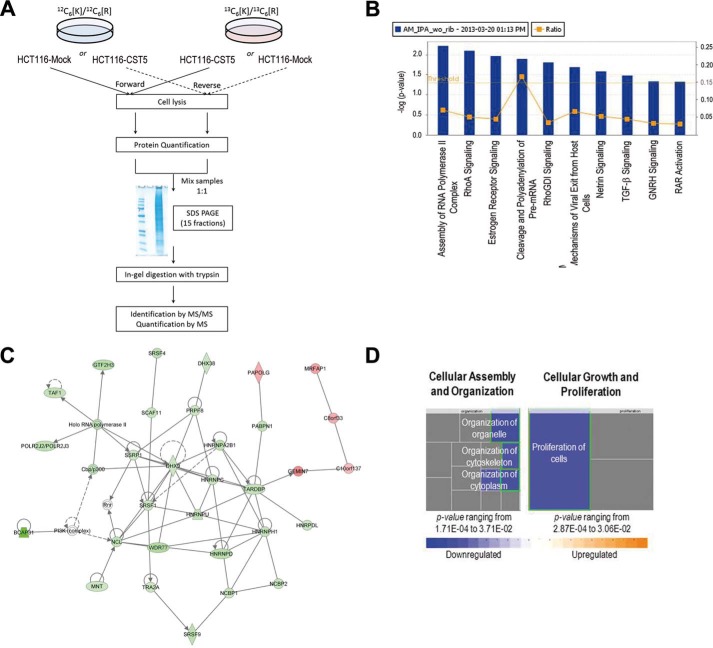
We next studied the effect of cystatin D on the nuclear proteome. To this end, HTC116-CST5 and HTC116-Mock cells were cultured for metabolic SILAC. A schematic workflow is shown in Fig. 7A. A total of 30,879 peptides resulting in 4,337 proteins were identified. From there, 26,701 peptides were quantified, resulting in 3,995 proteins. Protein ratios were normalized using a 5% trimmed means to correct any bias due to sample manipulation. Proteins with fold-change >1.5 and variability <20% were considered differentially expressed. In some cases, proteins with variability greater than 20% were manually inspected. Finally, a total of 292 proteins were found differentially expressed. In concordance with transcriptomic data, 80 (27%) proteins were found up-regulated and 212 (73%) down-regulated (supplemental Table S2).
FIGURE 7.
Effect of cystatin D on the nuclear proteome of HCT116 cells. A, scheme of the workflow followed in the quantitative proteomics analysis. B, canonical pathways most affected by the expression of cystatin D in HTC116 cells. Yellow dots represent the ratio of the number of molecules quantified in the SILAC analysis in the pathway relative to the total number of molecules in the pathway. Yellow line represents the threshold value from which data are statistically significant. Nine of the most significantly affected pathways are shown. C, RNA post-transcription modification, RNA damage and repair associated network function. This network, identified with a score of 58, shows the multiple interactions between the differentially expressed proteins due to the presence of cystatin D and proteins in IPA database. Thirty-one proteins (26 up-regulated and 5 down-regulated) of a total of 292 were used to build this network. Holo-RNA polymerase II, CBP-p300/CREBBP-EP300, PI3K (complex), and Rnr were added to complete the network. D, molecular and cellular functions were affected by cystatin D expression. Cellular assembly and organization is one of the functions most affected (p value ranging from 1.71E-04 to 3.71E-02); proliferation of cells (p value 2.87E-04; z-score: −2.102 (decreased)), function related to cell growth and proliferation was also highly affected.
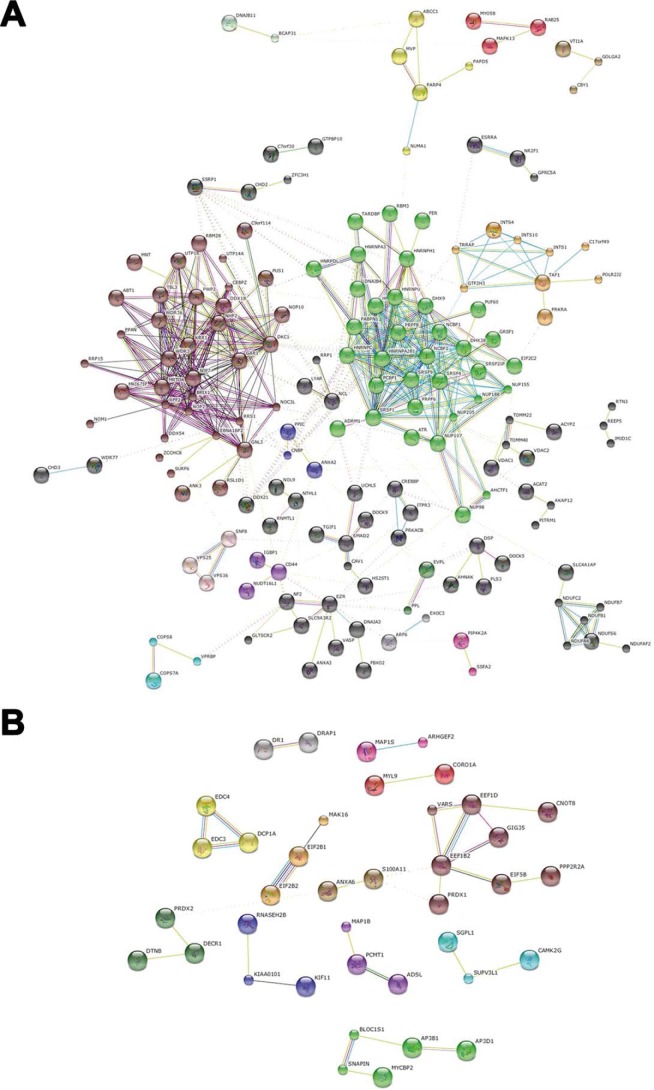
Using Ingenuity Pathway Analysis, we determined pathways and biological functions affected by expression of cystatin D in HTC116 cells. “RNA post-transcriptional modification” (n = 30) and p values ranging from 3.73E-15 to 2.89E-02, “protein synthesis” (n = 27), p values ranging from 2.03E-06 to 2.89E-02, and “DNA replication, recombination and repair” (n = 26), p values ranging from 3.91E-06 to 2.89E-02, where the molecular and cellular functions were most strongly associated with the presence of cystatin D. As for canonical pathways, “assembly of RNA-polymerase II complex” and “RhoA signaling” were the most significant (Fig. 7B). This is consistent with the localization of cystatin D at the sites of active transcription (Fig. 3) and with its effects on cell adhesion (5). Finally, one of the most significantly associated network functions was “RNA post-transcription modification, RNA damage and repair” (score: 58; Fig. 7C). By analyzing up and down-regulated proteins separately, one of the most significant canonical pathways was “cleavage and polyadenylation of pre-mRNA” and the most relevant associated network was “RNA post-transcriptional modification” (score 72) (Fig. 8). In agreement with transcriptomic data and with the effect of ectopic cystatin D on the HCT116 cell phenotype, there is a clear down-regulation of genes/proteins associated to cellular assembly, cytoskeleton and cell adhesion, as well as genes/proteins implicated in cell proliferation (Figs. 7B, 7D).
FIGURE 8.
STRING protein interaction analysis. Proteins down- and up-regulated by cystatin D were analyzed for protein interactions using STRING. Proteins were clustered setting the MCL algorithm to 2. A, down-regulated proteins. B, up-regulated proteins. Colored lines represent interaction partners retrieved from different prediction methods: neighborhood, dark green; gene fusion, red; Co-occurrence, dark blue; co-expression, black; experiments, pink; databases, light blue; text mining, light green.
Correlation between Transcriptomic and Proteomic Data
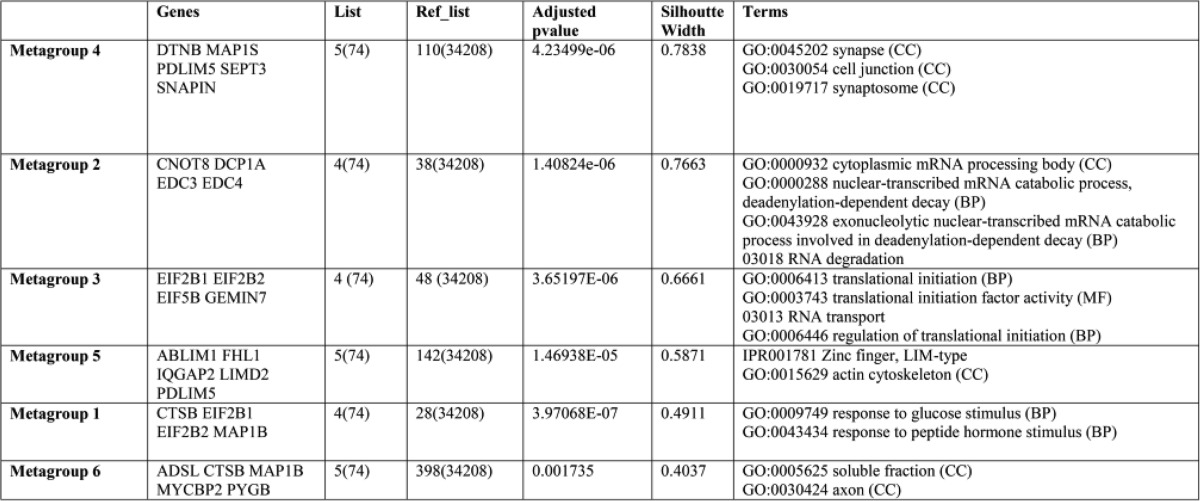
The comparative analysis of the transcriptomic and proteomic data revealed a good functional overlapping between both datasets. Although few single specific genes and proteins identified in the two studies were the same, in part because only the nuclear proteome was studied (given the nuclear location of cystatin D), the functional enrichment analysis showed a strong agreement in terms of altered biological functions. Thus, the most abundant function in the genes expression signal was cell adhesion, cell junction, cytoskeleton (22%, Fig. 6B), which was significantly represented in the proteomic data by the top proteins identified, e.g. IQGAP, MAP1S, MAP1B, PLEKHF2, FSD1, and ANXA6 (Table 2). These proteins revealed significant enrichment in functional terms like GO:0030054 cell junction and GO:0015629 actin cytoskeleton (Table 2). Moreover, the second most represented function in the genes changed was transcription (14%, Fig. 6B), and this functional annotation was also enriched in the top list of proteins derived from the proteomic analysis: GO:0000288 nuclear-transcribed RNA, GO:0000932 cytoplasmic RNA processing, KEGG:03013 RNA transport. The functional enrichment analyses of the proteins obtained in the proteomic analysis were done using the tool GeneTerm-Linker (25).
TABLE 2.
Functional enrichment analysis of the top 80 cystatin-up-regulated proteins
Validation of Cystatin D Target RNAs and Proteins
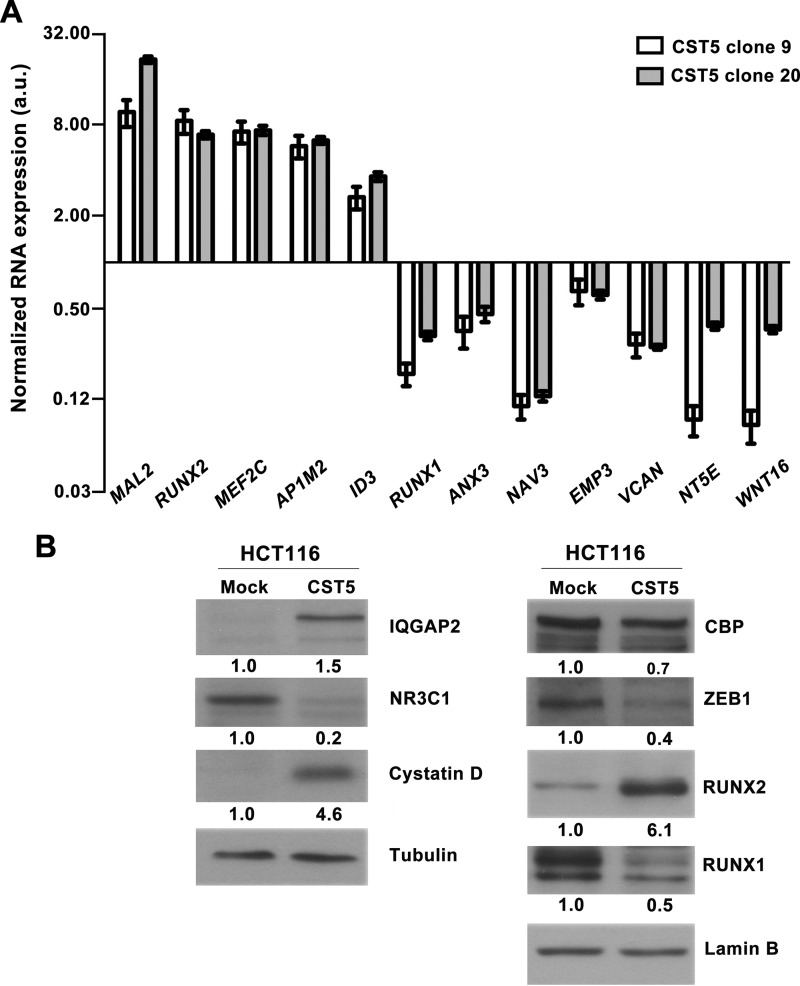
First, we used qRT-PCR to validate several genes identified as targets of cystatin D in the transcriptomic study. In agreement with this, the RNA levels of MAL2, MEF2C, AP1M2, ID3, and RUNX2 were found to be higher in two clones (clone 9 and 20) of HCT116-CST5 cells than in HCT116-Mock cells, whereas those of NAV3, NT5E, VCAN, WNT16, ANX3, EMP3, and RUNX1 showed the opposite pattern of expression (Fig. 9A). Second, Western blotting was used to validate the regulation of a subset of these genes at the protein level and also of selected proteins identified in the quantitative proteomic analysis as regulated by cystatin D. In this way, we confirmed the up-regulation of RUNX2 and the down-regulation of RUNX1 and NR3C1, which encodes the glucocorticoid receptor, at the protein level (Fig. 9B). In addition, we confirmed the up-regulation of IQGAP2, a regulator of several Rho family GTPases, and the down-regulation of CBP/CREBBP, a transcriptional regulator, as identified in the proteomic study (Fig. 9B). As control, we analyzed the protein expression of cystatin D and the transcriptional repressor ZEB1, an inducer of epithelial-mesenchymal transition that is down-regulated at the RNA level in HCT116-CST5 cells (5).
FIGURE 9.
Validation of cystatin D targets. A, qRT-PCR analysis of the expression level of several RNAs identified as candidate targets of cystatin D in the transcriptomic study. Expression levels in two clones (9 and 20) of HCT116-CST5 cells were normalized versus those in HCT116-Mock cells. Data are presented as mean ± S.E. of at least two independent experiments. B, Western blot analysis (20 μg of total cell extracts) of the expression in HCT116-CST5 and HCT116-Mock cells of several proteins selected from the transcriptomic or proteomic analyses. Cystatin D and loading controls (lamin B, β-tubulin) are also shown.
Cystatin D Changes the Pattern of Cytokine Secretion
We examined the effect of cystatin D on cytokine secretion by colon carcinoma cells. To this end, conditioned media from HCT116-CST5 and HCT116-Mock cells were incubated with human cytokine arrays containing antibodies against 79 cytokines (see Fig. 10 for a map of the localization of cytokines in the arrays). Only those cytokines showing the same expression in two biological replicate assays with a cut-off of 1.2-fold change were considered affected by the treatment (Fig. 11A). HCT116-CST5 cells showed reduced secretion (0.76–0.63-fold) of fibroblast growth factor-4, CX3CL1/fractalkine, neurotrophin 4/NT-4, oncostatin-M, pulmonary and activation-regulated chemokine/CCL18 and transforming growth factor B3/TGF-β3 as compared with HCT116-Mock cells (Fig. 11B). The reduction of CX3CL1/fractalkine secretion was further confirmed by means of ELISA (around 5-fold) (Fig. 11C).
FIGURE 10.
Scheme indicating the position of the cytokines tested in the array.
FIGURE 11.
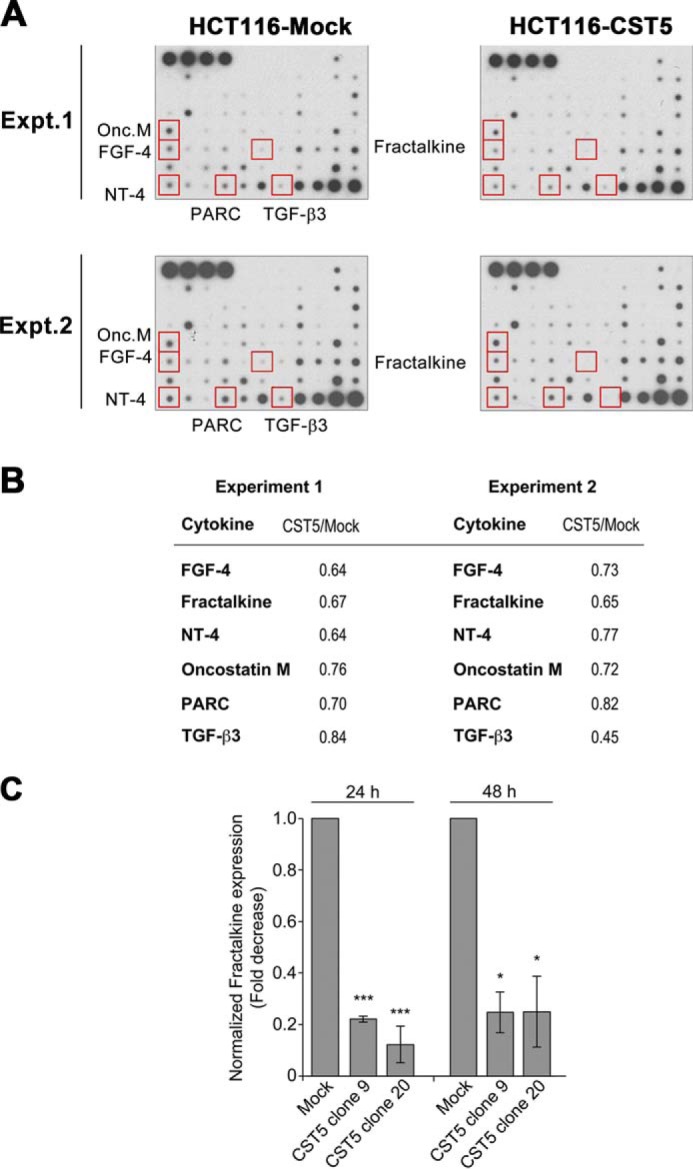
Modulation of cytokine secretion by cystatin D. A, hybridization of cytokine antibody arrays with conditioned media from HCT116-CST5 and HCT116-Mock cells. Two independent biological samples using equal amounts of conditioned media of the two cell types were used. B, quantification of the down-regulation of six cytokines by cystatin D (mean ± S.E., arbitrary units) obtained using two independent biological samples. C, down-regulation of CX3CL1/fractalkine by cystatin D as shown by a specific ELISA. Data are presented as mean ± S.E. of three independent experiments.
Effects of Silencing Endogenous Cystatin D
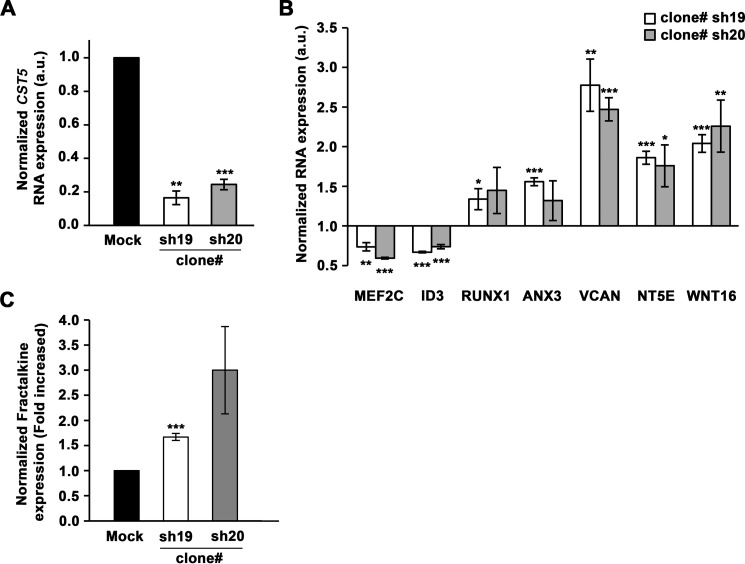
Finally, to confirm that endogenous cystatin D has the properties of an authentic transcriptional regulatory protein we knocked down CST5 by stable shRNA expression. CST5 down-regulation was confirmed in two clones, sh19 and sh20, by qRT-PCR analysis (Fig. 12A). To investigate putative effects of CST5 down-regulation on the expression of the genes identified as targets of cystatin D in the transcriptomic analysis, we performed several qPCRs. Opposite to what happened upon CST5 overexpression (Fig. 9A), the RNA levels of MEF2C and ID3 were lower and those of RUNX1, ANX3, VCAN, NT5E, and WNT16 were higher in clones sh19 and sh20 than in HCT116-shMock cells (Fig. 12B). AP1M2 and EMP3 genes were unaffected by CST5 down-regulation, indicating that their expression depends also on additional factors that compensate the reduction of cystatin D level. Additionally, we examined the effect of CST5 down-regulation of the secretion of CXC3CL1/fractalkine. In line with results found for most target genes and in contrast to the effect of CST5 overexpression (Fig. 11C), clones sh19 and sh20 secreted higher amounts of this chemokine than shMock cells. Altogether, these results reinforce the idea that cystatin D has a previously unpredicted gene regulatory action.
FIGURE 12.
Effect of CST5 knockdown on the expression of its target genes and the secretion of CX3CL1/fractalkine. A, analysis by qRT-PCR of the expression of CST5 RNA in two clones (sh19 and sh20) of HCT116-shCST5 cells as compared with those in HCT116-shMock cells. B, analysis of the expression levels in HCT116-shCST5 cells of several cystatin D target genes identified in the transcriptomic study. C, up-regulation of CXC3CL1/fractalkine by cystatin D down-regulation as shown by a specific ELISA. All data are presented as mean S.E. of three independent experiments.
Discussion
In this study, we examined the function of cystatin D in human colon carcinoma cells. We had previously reported that cystatin D exerts biological effects that are somehow unexpected for a mere protease inhibitor, such as the repression of c-MYC and the cell cycle or the increase of intercellular adhesion (5). Now, we show that a proportion of endogenous cystatin D protein in SW480-ADH cells, as well as of that ectopically expressed in HCT116 cells, locates within the cell nucleus. Evidence is provided that nuclear cystatin D is present at specific sites of defined transcriptionally active euchromatin (26). This indicates that cystatin D is not a constitutive structural component of chromatin or the general transcription machinery but, instead, is involved in the expression of a particular set of genes. Consistently, transcriptomic data have revealed that cystatin D does not change the global transcription rate in the cell but alters the expression of specific genes. These target genes preferentially affect a number of biochemical routes and cellular functions such as cell adhesion, transcription, signal transduction, or metabolism. An additional proteomic analysis of nuclear extracts confirmed that the levels of several proteins with roles in RNA biology, including the key transcription regulator CBP/CREBBP, are modulated by cystatin D. In addition to transcriptional regulation, the localization of cystatin D in euchromatin is consistent with the proteome data on the most relevant nuclear functions affected by expression of cystatin D. These include pre-mRNA processing, a nuclear function that preferentially occurs co-transcriptionally in euchromatin domains (27). Although the transcriptomic and proteomic analyses do not match in the same genes/proteins, they point to a robust phenotypic effect of cystatin D regulating cell adhesion, cytoskeleton and RNA synthesis, and processing. In summary, our study identifies a novel role of cystatin D as a specific modulator of gene expression in the nucleus.
Our attempts to identify cystatin D binding partners did not validate the strong interaction with NMI-1 and Cullin-1 found in yeast two-hybrid assays nor did they reveal specific binding to histone H3. This suggests that cystatin D action at the chromatin level relies on weak and/or transient, dynamic interactions most probably with one or more components of RNA synthesis-modification complexes. The study of the putative interaction of cystatin D with human cathepsin V, a close homologue of cathepsin L that is not found in mice, seems of especial interest giving that cathepsin V, but not cathepsin L, binds DNA and DNA modulates the inhibition of cathepsin V by MENT (28).
Our data demonstrate that cystatin D alters the expression of several genes that may contribute to its previously described tumor suppressor activity and may also partially mediate the antitumor activity of 1,25-(OH)2D3. One of these genes is CX3CL1/fractalkine, which encodes a chemokine with pro-inflammatory and pro-tumorigenic activity in several types of cancer (29–31). The repressive effect of cystatin D on the secretion of CX3CL1/fractalkine in our system supports a tumor suppressive action. This is further suggested by the inhibition of FGF-4, which has strong mitogenic, promigratory, and invasive activity (32, 33) and oncostatin-M, a proinflammatory and prometastatic cytokine (34). Two other genes whose expression is (differentially) affected by cystatin D are RUNX1 and RUNX2, which together with RUNX3 are members of a family of transcription factors that regulate a wide range of biological processes and have context-specific roles in carcinogenesis (35, 36). Mutations in RUNX1, which are down-regulated by cystatin D, are associated with some leukemias and breast and esophagous carcinomas, whereas this gene has also been reported to act as tumor suppressor in T-ALL (36). RUNX1 has recently been shown to stimulate STAT3 signaling and has been implicated in several epithelial cancers (37). Notably, genetic variations of RUNX1 and RUNX2 genes associate with the risk of colon and rectal cancer (38).
Interestingly, cystatin D down-regulates the VCAN gene encoding versican, which is associated with colon cancer progression (39). NAV3, a gene that is aberrantly expressed in colon cancer linked to inflammation and cell proliferation (40), is also repressed by cystatin D. Likewise, we found that cystatin D-expressing cells contain lower RNA levels of WNT16, an activator of β-catenin transcriptional activity and cell proliferation, and of NT5E, which encodes ecto-5′-nucleotidase (CD73) and whose high expression is proposed as an independent biomarker of poor survival of colorectal cancer patients (41).
How cystatin D protein that lacks a conventional nuclear localization signal enters into the cell nucleus is unclear. One possibility is that cystatin D (15 kDa) may enter the nucleus by passive diffusion as proposed for those proteins of molecular mass up to 40 kDa (42). Alternatively, it may be imported by interaction with other proteins that contain a functional nuclear localization signal (43).
In conclusion, our results demonstrate that cystatin D is a multifaceted protein with a previously unpredicted activity in the cell nucleus modulating the expression of specific genes, some of which are involved in key cellular functions, the control of the epithelial adhesive phenotype or encoding tumor-related cytokines. This activity of the fraction (around 10%) of cystatin D molecules present within the cell nucleus is unrelated to the protease inhibitory function of the more abundant (90%) extranuclear fraction and may contribute to its tumor suppressor activity and to the protective action of 1,25-(OH)2D3 in colon cancer.
Author Contributions
A. M. designed and supervised the study and wrote the paper. G. F. M. performed and analyzed the experiments shown in Figs. 1, 2, 5, 7, 9B, and 12. S. A. D. contributed to design the study and together with NV performed and analyzed the experiments shown in Figs. 9A and 11 and generated HCT116-shCST5. M. L. and O. T. performed electron microscopy, immunofluorescence and confocal microscopy analyses shown in Figs. 3 and 4. M. M., R. B., F. C., and J. I. C. performed proteomic and in silico studies. J. D. L. R. performed global gene expression analyses. All authors reviewed the results approved the final version of the manuscript.
Supplementary Material
Acknowledgments
We thank Dr. M. J. Larriba for advice with ELISA and qPCR analyses, Dr. M. T. Berciano for help with the immunofluorescence studies and R. Rycroft for valuable assistance in the preparation of the English manuscript.
This work was supported by Spanish Ministry of Economy and Competitiveness-Fondo Europeo de Desarrollo Regional (FEDER) Grant SAF2013-43468-R, Comunidad de Madrid Grant Colomics2 S2010/BMD-2344, and FEDER-Instituto de Salud Carlos III Grant RD12/0036/0021. The authors declare that they have no conflicts of interest with the contents of this article.

This article contains supplemental Tables S1 and S2.
- qRT
- quantitative real-time
- TMG
- 2,2,7-trimethylguanosine
- SILAC
- stable isotope labeling with amino acids in cell culture.
References
- 1.Reiser J., Adair B., and Reinheckel T. (2010) Specialized roles for cysteine cathepsins in health and disease. J. Clin. Invest. 120, 3421–3431 [DOI] [PMC free article] [PubMed] [Google Scholar]
- 2.Turk V., Stoka V., Vasiljeva O., Renko M., Sun T., Turk B., and Turk D. (2012) Cysteine cathepsins: from structure, function and regulation to new frontiers. Biochim. Biophys. Acta 1824, 68–88 [DOI] [PMC free article] [PubMed] [Google Scholar]
- 3.Balbín M., Freije J. P., Abrahamson M., Velasco G., Grubb A., and López-Otin C. (1993) A sequence variation in the human cystatin D gene resulting in an amino acid (Cys/Arg) polymorphism at the protein level. Hum. Genet. 90, 668–669 [DOI] [PubMed] [Google Scholar]
- 4.Freije J. P., Abrahamson M., Olafsson I., Velasco G., Grubb A., and López-Otín C. (1991) Structure and expression of the gene encoding cystatin D, a novel human cysteine proteinase inhibitor. J. Biol. Chem. 266, 20538–20543 [PubMed] [Google Scholar]
- 5.Alvarez-Díaz S., Valle N., García J. M., Peña C., Freije J. M., Quesada V., Astudillo A., Bonilla F., López-Otín C., and Muñoz A. (2009) Cystatin D is a candidate tumor suppressor gene induced by vitamin D in human colon cancer cells. J. Clin. Invest. 119, 2343–2358 [DOI] [PMC free article] [PubMed] [Google Scholar]
- 6.Ochieng J., and Chaudhuri G. (2010) Cystatin superfamily. J. Health Care Poor Underserved 21, 51–70 [DOI] [PMC free article] [PubMed] [Google Scholar]
- 7.Agrawal A. K., Ekonjo G. B., Teterycz E., Zyoeko D., Grzebieniak Z., Milan M., Marek G., and Siewiński M. (2010) Cysteine peptidases and their inhibitors in breast and genital cancer. Folia Histochem. Cytobiol. 48, 323–327 [DOI] [PubMed] [Google Scholar]
- 8.Cox J. L. (2009) Cystatins and cancer. Front. Biosci. 14, 463–474 [DOI] [PubMed] [Google Scholar]
- 9.Gocheva V., and Joyce J. A. (2007) Cysteine cathepsins and the cutting edge of cancer invasion. Cell Cycle 6, 60–64 [DOI] [PubMed] [Google Scholar]
- 10.Rivenbark A. G., and Coleman W. B. (2009) Epigenetic regulation of cystatins in cancer. Front. Biosci. 14, 453–462 [DOI] [PubMed] [Google Scholar]
- 11.Goulet B., Baruch A., Moon N. S., Poirier M., Sansregret L. L., Erickson A., Bogyo M., and Nepveu A. (2004) A cathepsin L isoform that is devoid of a signal peptide localizes to the nucleus in S phase and processes the CDP/Cux transcription factor. Mol. Cell 14, 207–219 [DOI] [PubMed] [Google Scholar]
- 12.Duncan E. M., Muratore-Schroeder T. L., Cook R. G., Garcia B. A., Shabanowitz J., Hunt D. F., and Allis C. D. (2008) Cathepsin L proteolytically processes histone H3 during mouse embryonic stem cell differentiation. Cell 135, 284–294 [DOI] [PMC free article] [PubMed] [Google Scholar]
- 13.Bulynko Y. A., Hsing L. C., Mason R. W., Tremethick D. J., and Grigoryev S. A. (2006) Cathepsin L stabilizes the histone modification landscape on the Y chromosome and pericentromeric heterochromatin. Mol. Cell. Biol. 26, 4172–4184 [DOI] [PMC free article] [PubMed] [Google Scholar]
- 14.Ceru S., Konjar S., Maher K., Repnik U., Krizaj I., Bencina M., Renko M., Nepveu A., Zerovnik E., Turk B., and Kopitar-Jerala N. (2010) Stefin B interacts with histones and cathepsin L in the nucleus. J. Biol. Chem. 285, 10078–10086 [DOI] [PMC free article] [PubMed] [Google Scholar]
- 15.Irving J. A., Shushanov S. S., Pike R. N., Popova E. Y., Brömme D., Coetzer T. H., Bottomley S. P., Boulynko I. A., Grigoryev S. A., and Whisstock J. C. (2002) Inhibitory activity of a heterochromatin-associated serpin (MENT) against papain-like cysteine proteinases affects chromatin structure and blocks cell proliferation. J. Biol. Chem. 277, 13192–13201 [DOI] [PubMed] [Google Scholar]
- 16.Maubach G., Lim M. C., and Zhuo L. (2008) Nuclear cathepsin F regulates activation markers in rat hepatic stellate cells. Mol. Biol. Cell 19, 4238–4248 [DOI] [PMC free article] [PubMed] [Google Scholar]
- 17.Risueño A., Fontanillo C., Dinger M. E., and De Las Rivas J. (2010) GATExplorer: genomic and transcriptomic explorer; mapping expression probes to gene loci, transcripts, exons and ncRNAs. BMC Bioinformatics 11, 221. [DOI] [PMC free article] [PubMed] [Google Scholar]
- 18.Irizarry R. A., Hobbs B., Collin F., Beazer-Barclay Y. D., Antonellis K. J., Scherf U., and Speed T. P. (2003) Exploration, normalization, and summaries of high density oligonucleotide array probe level data. Biostatistics 4, 249–264 [DOI] [PubMed] [Google Scholar]
- 19.Tusher V. G., Tibshirani R., and Chu G. (2001) Significance analysis of microarrays applied to the ionizing radiation response. Proc. Natl. Acad. Sci. U.S.A. 98, 5116–5121 [DOI] [PMC free article] [PubMed] [Google Scholar]
- 20.Benjamini Y. H. (1995) Controlling the false discovery rate: a practical and powerful approach to multiple testing. J. R. Stat. Soc. 57, 289–300 [Google Scholar]
- 21.Geiger T., Wisniewski J. R., Cox J., Zanivan S., Kruger M., Ishihama Y., and Mann M. (2011) Use of stable isotope labeling by amino acids in cell culture as a spike-in standard in quantitative proteomics. Nat. Protocols 6, 147–157 [DOI] [PubMed] [Google Scholar]
- 22.Luque-García J. L., Martínez-Torrecuadrada J. L., Epifano C., Cañamero M., Babel I., and Casal J. I. (2010) Differential protein expression on the cell surface of colorectal cancer cells associated to tumor metastasis. Proteomics 10, 940–952 [DOI] [PubMed] [Google Scholar]
- 23.Barderas R., Bartolomé R. A., Fernandez-Aceñero M. J., Torres S., and Casal J. I. (2012) High expression of IL-13 receptor α2 in colorectal cancer is associated with invasion, liver metastasis, and poor prognosis. Cancer Res. 72, 2780–2790 [DOI] [PubMed] [Google Scholar]
- 24.Huang da W., Sherman B. T., and Lempicki R. A. (2009) Systematic and integrative analysis of large gene lists using DAVID bioinformatics resources. Nat. Protocols 4, 44–57 [DOI] [PubMed] [Google Scholar]
- 25.Fontanillo C., Nogales-Cadenas R., Pascual-Montano A., and De las Rivas J. (2011) Functional analysis beyond enrichment: non-redundant reciprocal linkage of genes and biological terms. PloS One 6, e24289. [DOI] [PMC free article] [PubMed] [Google Scholar]
- 26.Carmo-Fonseca M. (2002) The contribution of nuclear compartmentalization to gene regulation. Cell 108, 513–521 [DOI] [PubMed] [Google Scholar]
- 27.Moore M. J., and Proudfoot N. J. (2009) Pre-mRNA processing reaches back to transcription and ahead to translation. Cell 136, 688–700 [DOI] [PubMed] [Google Scholar]
- 28.Ong P. C., McGowan S., Pearce M. C., Irving J. A., Kan W. T., Grigoryev S. A., Turk B., Silverman G. A., Brix K., Bottomley S. P., Whisstock J. C., and Pike R. N. (2007) DNA accelerates the inhibition of human cathepsin V by serpins. J. Biol. Chem. 282, 36980–36986 [DOI] [PubMed] [Google Scholar]
- 29.Xu X., Wang Y., Chen J., Ma H., Shao Z., Chen H., and Jin G. (2012) High expression of CX3CL1/CX3CR1 axis predicts a poor prognosis of pancreatic ductal adenocarcinoma. J. Gastrointest. Surg. 16, 1493–1498 [DOI] [PubMed] [Google Scholar]
- 30.Corcione A., Ferretti E., and Pistoia V. (2012) CX3CL1/fractalkine is a novel regulator of normal and malignant human B cell function. J. Leukoc. Biol. 92, 51–58 [DOI] [PubMed] [Google Scholar]
- 31.Kim M., Rooper L., Xie J., Kajdacsy-Balla A. A., and Barbolina M. V. (2012) Fractalkine receptor CX3CR1 is expressed in epithelial ovarian carcinoma cells and required for motility and adhesion to peritoneal mesothelial cells. Mol. Cancer Res. 10, 11–24 [DOI] [PMC free article] [PubMed] [Google Scholar]
- 32.Kosaka N., Sakamoto H., Terada M., and Ochiya T. (2009) Pleiotropic function of FGF-4: its role in development and stem cells. Dev. Dyn. 238, 265–276 [DOI] [PubMed] [Google Scholar]
- 33.Peláez-García A., Barderas R., Torres S., Hernández-Varas P., Teixidó J., Bonilla F., de Herreros A. G., and Casal J. I. (2013) FGFR4 role in epithelial-mesenchymal transition and its therapeutic value in colorectal cancer. PloS One 8, e63695. [DOI] [PMC free article] [PubMed] [Google Scholar]
- 34.Bolin C., Tawara K., Sutherland C., Redshaw J., Aranda P., Moselhy J., Anderson R., and Jorcyk C. L. (2012) Oncostatin M promotes mammary tumor metastasis to bone and osteolytic bone degradation. Genes Cancer 3, 117–130 [DOI] [PMC free article] [PubMed] [Google Scholar]
- 35.Chimge N. O., and Frenkel B. (2013) The RUNX family in breast cancer: relationships with estrogen signaling. Oncogene 32, 2121–2130 [DOI] [PMC free article] [PubMed] [Google Scholar]
- 36.Chuang L. S., Ito K., and Ito Y. (2013) RUNX family: Regulation and diversification of roles through interacting proteins. Int. J. Cancer 132, 1260–1271 [DOI] [PubMed] [Google Scholar]
- 37.Scheitz C. J., Lee T. S., McDermitt D. J., and Tumbar T. (2012) Defining a tissue stem cell-driven Runx1/Stat3 signalling axis in epithelial cancer. EMBO J. 31, 4124–4139 [DOI] [PMC free article] [PubMed] [Google Scholar]
- 38.Slattery M. L., Lundgreen A., Herrick J. S., Caan B. J., Potter J. D., and Wolff R. K. (2011) Associations between genetic variation in RUNX1, RUNX2, RUNX3, MAPK1, and eIF4E and riskof colon and rectal cancer: additional support for a TGF-β-signaling pathway. Carcinogenesis 32, 318–326 [DOI] [PMC free article] [PubMed] [Google Scholar]
- 39.Yuen H. F., McCrudden C. M., Huang Y. H., Tham J. M., Zhang X., Zeng Q., Zhang S. D., and Hong W. (2013) TAZ expression as a prognostic indicator in colorectal cancer. PloS One 8, e54211. [DOI] [PMC free article] [PubMed] [Google Scholar]
- 40.Carlsson E., Ranki A., Sipilä L., Karenko L., Abdel-Rahman W. M., Ovaska K., Siggberg L., Aapola U., Ässämäki R., Häyry V., Niiranen K., Helle M., Knuutila S., Hautaniemi S., Peltomäki P., and Krohn K. (2012) Potential role of a navigator gene NAV3 in colorectal cancer. Br. J. Cancer 106, 517–524 [DOI] [PMC free article] [PubMed] [Google Scholar]
- 41.Wu X. R., He X. S., Chen Y. F., Yuan R. X., Zeng Y., Lian L., Zou Y. F., Lan N., Wu X. J., and Lan P. (2012) High expression of CD73 as a poor prognostic biomarker in human colorectal cancer. J. Surg. Oncol. 106, 130–137 [DOI] [PubMed] [Google Scholar]
- 42.Freitas N., and Cunha C. (2009) Mechanisms and signals for the nuclear import of proteins. Curr. Genomics 10, 550–557 [DOI] [PMC free article] [PubMed] [Google Scholar]
- 43.Traweger A., Fuchs R., Krizbai I. A., Weiger T. M., Bauer H. C., and Bauer H. (2003) The tight junction protein ZO-2 localizes to the nucleus and interacts with the heterogeneous nuclear ribonucleoprotein scaffold attachment factor-B. J. Biol. Chem. 278, 2692–2700 [DOI] [PubMed] [Google Scholar]
Associated Data
This section collects any data citations, data availability statements, or supplementary materials included in this article.


