

Summary
Hematopoietic stem cells (HSCs) are preserved in co-cultures with UG26-1B6 stromal cells or their conditioned medium. We performed a genome-wide study of gene expression changes of UG26-1B6 stromal cells in contact with Lineage− SCA-1+ KIT+ (LSK) cells. This analysis identified connective tissue growth factor (CTGF) to be upregulated in response to LSK cells. We found that co-culture of HSCs on CTGF knockdown stroma (shCtgf) shows impaired engraftment and long-term quality. Further experiments demonstrated that CD34− CD48− CD150+ LSK (CD34− SLAM) cell numbers from shCtgf co-cultures increase in G0 and senescence and show delayed time to first cell division. To understand this observation, a CTGF signaling network model was assembled, which was experimentally validated. In co-culture experiments of CD34− SLAM cells with shCtgf stromal cells, we found that SMAD2/3-dependent signaling was activated, with increasing p27Kip1 expression and downregulating cyclin D1. Our data support the view that LSK cells modulate gene expression in the niche to maintain repopulating HSC activity.
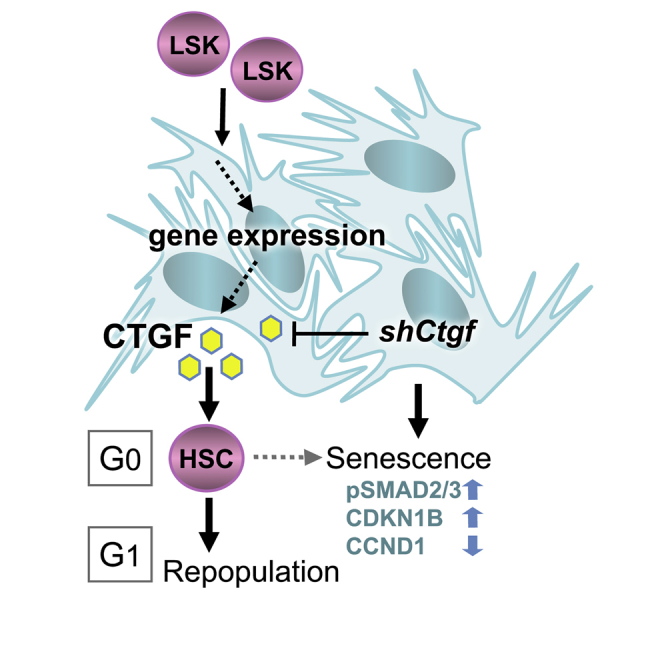
Graphical Abstract
Highlights
-
•
LSK cells induce the expression of CTGF in stromal cells
-
•
Stromal CTGF drives cell-cycle progression and proliferation of CD34− LSK cells
-
•
Decreased stromal CTGF activates TGFB signaling to decrease LSK cell cycle
-
•
Stromal CTGF improves maintenance of HSCs with long-term repopulating activity
Oostendorp and colleagues show that hematopoietic stem cells (HSCs) induce expression of connective tissue growth factor (CTGF) in stromal cells. A decrease in stromal CTGF impairs the maintenance of HSC activity in co-culture by rapid modulation of HSC signaling and cell-cycle entry. Thus, HSCs regulate their own cell cycle by modulating gene expression in stromal cells.
Introduction
The maintenance of lifelong blood cell production depends on rare hematopoietic stem cells (HSCs) that reside in the bone marrow (BM) “niche” (Schofield, 1978). The interaction of HSCs with the niche is thought to balance their ability to survive and to self-renew with multi-lineage differentiation, which is critical for HSC long-term maintenance in vivo (Morrison and Scadden, 2014). Under steady-state conditions, HSCs are maintained as slow-dividing clones of quiescent cells (Wilson et al., 2009), whereas during states of stress, for instance those in which interferons are induced, HSCs are rapidly recruited into the cell cycle (Essers et al., 2009). The ability of activated HSCs to return to the quiescent pool determines whether the HSC pool is preserved or HSC exhaustion occurs. Thus, there is a strong interest in defining factors involved in maintaining the HSC pool during stress conditions. The “niche” consists of several morphologically distinct cell types, including osteoblast lineage cells, adipocytes, endothelial (arteriolar) cells, and mesenchymal stromal cells (MSCs). One of the main questions in the study of the microenvironment is how extrinsic signals from niche cells affect the intrinsic stem cell signaling pathways to regulate their survival, differentiation, and self-renewal.
In vitro models of hematopoietic stress, such as co-culture of HSCs with stromal cells, have successfully been applied to define secreted factors involved in regulation of HSC behavior. We have previously established that the embryo-derived stromal clone UG26-1B6 maintains long-term repopulating HSCs under non-contact conditions (Oostendorp et al., 2005, Buckley et al., 2011, Wöhrer et al., 2014). Our analyses of this cell line and other embryo-derived cell lines (Ledran et al., 2008) have identified Secreted frizzled-related protein 1 (Sfrp1) and Pleiotrophin (Ptn) (Renström et al., 2009, Istvanffy et al., 2011) to be involved in HSC self-renewal, cell-cycle regulation, and engraftment in vivo. In addition, we recently showed that conditioned medium (CM) from the UG26-1B6 cell line and secreted niche factors identified in this medium: type I collagen and nerve growth factor promoted in vitro survival, proliferation, and successful self-renewal of clones of long-term in vivo repopulating HSCs (Wöhrer et al., 2014).
The latter studies were performed by combining gene expression data from stromal cells and short cultures of HSCs. It is clear from these data that potentially, not only do stromal cells communicate with HSCs but also the other way around. We studied the communication between HSCs and UG26-1B6 stromal cells within the co-culture and how the elicited signals are relevant to the regulation of HSCs. By combining transcriptomics and phenotype data with bioinformatics and functional in vivo biology approaches, we established the complexity of reciprocal biological networks between HSCs and stromal cells.
Our analyses clearly show that stromal cells react to the presence of Lineage-negative (Lin−) SCA-1+ KIT+ (LSK) cells, which are enriched for HSCs. These studies indicate that LSK cells induce expression of connective tissue growth factor (CTGF) in stromal cells. We show that CTGF is required particularly for maintenance of long-term myeloid repopulating HSC activity in culture by controlling the cell-division behavior of HSCs. Biochemical confirmation studies of a CTGF signaling network model LSK show that stromal CTGF regulates G0/G1 transition of in LSK cells by concerted action on transforming growth factor and WNT signaling pathways. Thus, we demonstrate that stromal cells respond to LSK cells and elicit signals in the extracellular space that are required to maintain the HSC pool in culture.
Results
To gain insight on the influence of HSCs on their “niche” during initial stem cell activation events, we cultured LSK cells on the HSC-supportive UG26-1B6 stromal cell line (Oostendorp et al., 2002) as a model of hematopoietic stress. LSK cells were co-cultured for 1 (d1 cc), 2 (d2 cc), and 3 (d3 cc) days (Figures 1A and S1A–S1C). To allocate changes in the gene expression induced by co-culture, we used mono-cultured stromal cells as control (d0). In addition, to exclude variations in gene expression occurring because of medium change at d1 of the co-culture, we also included mono-cultured stromal cells with medium change (d1 mc). After co-culture, side scatter (SSC)-high (SSChigh) CD45− SCA-1high stromal cells were separated from SSC-low (SSClow) CD45+ SCA-1+ LSK cells, and gene expression analyses of the mRNA of the separated cell types were performed on Affymetrix MOE 430.2 arrays.
Figure 1.

Gene Expression Analysis, Gene Prioritization, and Validation of CTGF Upregulation
(A) Experimental design: for each microarray hybridization, 2.5 × 10⁴ sorted LSK cells were co-cultured on irradiated UG26-1B2 for 1 (d1 cc), 2 (d2 cc), and 3 (d3 cc) days (stroma/LSK ratio of approximately 10:1). Co-cultured cells were separated by the expression of SSC, CD45 and Ly6A/E (SCA-1) and used for three independent experiments including all time points, providing samples for microarray analyses (d0, n = 3; d1 mc, n = 2; d1 cc, n = 3; d2 cc, n = 3; d3 cc, n = 2), qPCR, and ELISA.
(B) STEM (Ernst and Bar-Joseph, 2006) analysis of dynamic expression patterns identifies 12 significant patterns, of continuously downregulated genes (four patterns, cluster C1), upregulated genes (three patterns, cluster C2), and variable up- and/or downregulation.
(C) ToppFun analysis of the Biological Process GO terms enriched in cluster C1 of downregulated genes in the comparison of d0 and d1 cc UG26-1B6 stromal cells ordered by p value. For more details, see Table S1.
(D) ToppFun analysis of the Biological Process GO terms enriched in cluster C2 of upregulated genes in the comparison of d0 and d1 cc UG26-1B6 stromal cells ordered by p value. More details can be found in Table S2.
(E) Hierarchical clustering of differential gene expression data between controls (mono-cultured UG26-1B6 [d0.1, d0.2, and d0.3] and day 1 medium change [d1 mc.1 and d1 mc.2]) and UG26-1B6 cells co-cultured with LSK cells (d1 cc.1, d1 cc.2, and d1 cc.3). A list of DEGs can be found in Table S3.
(F) CTGF protein content in sorted d0, d1 mc, and d1 cc stromal cells as measured by ELISA of culture supernatants. ∗p < 0.05 (Student’s t test) of three independent experiments.
(G) CTGF expression in d1 mc and d1 cc stromal cells after wash-out of LSK cells, as detected with immunofluorescent stain. The scale bar represents 10 μm. One representation from two experiments is shown. DAPI was used as a counterstain.
After normalization, gene transcripts were clustered into groups behaving in a similar manner over the 3 days of co-culture using the Short Time-Series Expression Miner (STEM) algorithm (Ernst and Bar-Joseph, 2006). Thus, 12 significant model profiles were identified, which were further grouped in 5 clusters based on similarity (Figure 1B), the largest of which, clustered in C1, contained 1,191 downregulated genes with gene ontology (GO) categories that associated mostly with DNA and RNA processing, protein N-linked glycosylation, and mesenchymal cell proliferation (Figure 1C; Table S1). The second cluster (C2) contained 589 upregulated genes associated with response to stress (wounding and infection), cell activation, integrin-mediated adhesion, and bone remodeling (Figure 1D; Table S2). Further analysis of differentially expressed genes (DEGs) between the consecutive time points using the LIMMA algorithms (−1 ≥ log2FC ≥ 1, p ≤ 0.05) (Smyth, 2004) revealed most prominent changes in gene expression levels to occur at d1 cc, yielding a number of more than 2-fold regulated (837 up- and 1,826 downregulated) transcripts in UG26-1B6 stromal cells (Table S3). qRT-PCR of randomly chosen transcripts in cells isolated from independent co-cultures confirmed 86% upregulated genes in d1 cc stromal cells, whereas the confirmation of downregulated genes was less consistent, yielding 50% (Figures S1D and S1E). Considering the gene expression changes at d1 cc, we focused on this time point and compared them with d0 and d1 mc stromal cells.
To identify possible players in HSC regulation by stromal cells, we prioritized potential candidate genes utilizing ToppGene (Chen et al., 2009), which ranks a list of candidate genes on the basis of two assumptions: (1) that similar phenotypes are caused by genes with similar or related functions and (2) that genes responsible for the same phenotype tend to lie close to one another in a network of protein-protein interactions (Vanunu et al., 2010). In our analyses, hematopoiesis-associated genes collected using the text-mining tool EXERBT (Barnickel et al., 2009) (Table S4) were used as a training set. To obtain a set of test genes to be prioritized, the LIMMA-determined DEGs were filtered to include only transcripts with false discovery rate (FDR) p values ≤ 0.25, yielding 2,661 transcripts. The prioritization result, showing the top 20 highest ranked genes, is presented in Table 1. Furthermore, the top 100 DEGs with the highest significance level were hierarchically clustered, revealing 40 upregulated and 60 downregulated transcripts in the presence of LSK cells (Figure 1E). Interestingly, DEGs included the type I collagen Col1a2 gene (downregulated), plasminogen activator, urokinase receptor (Plaur, upregulated), Wnt2 (upregulated), and CTGF (Ctgf, upregulated). Because Col1a2 and Plaur have recently been shown to be involved in HSC regulation of survival (Tjwa et al., 2009, Wöhrer et al., 2014) and Wnt2 was only weakly expressed and hardly detectable by qPCR, we decided to study the role of stromal Ctgf in HSC regulation in co-cultures more closely. Induction of Ctgf and CTGF protein by LSK cell contact was confirmed by qPCR (Figure S1D) and protein (ELISA and immunofluorescence) levels (Figures 1F and 1G, respectively).
Table 1.
Results from ToppGene Candidate Gene Prioritization in UG26-1B6 Cells
| Rank | Gene | Average Score | Overall p Value |
|---|---|---|---|
| 1 | Col1a2 | 0.71 | 2.06 × 10⁻¹⁰ |
| 2 | Fgf7 | 0.67 | 1.88 × 10⁻⁸ |
| 3 | Jag1 | 0.58 | 3.91 × 10⁻⁸ |
| 4 | Nrp1 | 0.63 | 1.37 × 10⁻⁷ |
| 5 | Timp3 | 0.69 | 1.58 × 10⁻⁷ |
| 6 | Pik3r1 | 0.62 | 3.57 × 10⁻⁷ |
| 7 | Ctgf | 0.68 | 5.31 × 10⁻⁷ |
| 8 | Tgfbr1 | 0.61 | 5.65 × 10⁻⁷ |
| 9 | Wnt2 | 0.54 | 7.28 × 10⁻⁷ |
| 10 | Cd44 | 0.62 | 8.24 × 10⁻⁷ |
| 11 | Actn1 | 0.62 | 1.14 × 10⁻⁶ |
| 12 | Cdk6 | 0.57 | 1.27 × 10⁻⁶ |
| 13 | Ctss | 0.58 | 1.38 × 10⁻⁶ |
| 14 | Mmp14 | 0.63 | 1.52 × 10⁻⁶ |
| 15 | Plaur | 0.59 | 1.82 × 10⁻⁶ |
| 16 | Pparg | 0.55 | 1.89 × 10⁻⁶ |
| 17 | Jun | 0.57 | 2.10 × 10⁻⁶ |
| 18 | Itgb5 | 0.68 | 2.40 × 10⁻⁶ |
| 19 | Nfkbia | 0.58 | 2.40 × 10⁻⁶ |
| 20 | Epas1 | 0.53 | 2.84 × 10⁻⁶ |
Shown are the top 20 ranked genes in d1 cc UG26-1B6 cells compared with d0 and mc controls according to p value, when trained against a set of hematopoiesis-related genes (Table S4) with GO annotations: “GO:0005615:extracellular space” and “GO:0044421:extracellular region.”
To study the functional impact of extrinsic stromal cell-derived CTGF, we generated UG26-1B6 stromal cells with decreased CTGF protein content (shCtgf stromal cells; Figure 2A). To examine whether a decrease in stromal CTGF affects the maintenance of long-term-repopulating HSCs, we set up co-cultures of Lin− cells on either pLKO.1 or shCtgf stromal cells for 1 week and then transplanted these cultures into lethally irradiated recipient mice in a competitive setting (Figures 2B and S2). These experiments showed that initial engraftment of the co-cultured cells was unchanged, but at later time points (10 and 16 weeks), myeloid and B-lymphoid engraftment declined significantly in shCtgf co-cultured Lin− recipients, whereas T-lymphoid engraftment was not affected (Figure 2C). In addition, the donor cell compartment in the BM shCtgf co-culture-receiving mice was significantly decreased (49% versus 14% CD45.1+ donor cells) (Figure 2D). This was also reflected in the percentage of donor myeloid progenitors (MPs) and LSK cells (Figure 2E).
Figure 2.

Decreased Stromal CTGF Decreases Repopulating HSC Activity in Culture
(A) CTGF mRNA and protein content in UG26-1B6 (gray bars), Ctgf knockdown (shCtgf, black bars), and control (pLKO.1, white bars) cells as measured by qPCR and ELISA. The mean and SD of three experiments (both qPCR and ELISA) is shown.
(B) Experimental design: Lin− cells (CD45.1; Figure S2) were co-cultured with pLKO.1 or shCtgf cells for 1 week. Each culture was then harvested and transplanted into lethally irradiated (CD45.2) primary recipients (1,000 input Lin− equivalents/recipient) together with competitor BM cells. After 16 weeks, mice were sacrificed and analyzed. Two independent experiments totaling n = 7 (for pLKO.1) and n = 9 (for shCtgf) recipients were performed. In one follow-up experiment, donor LSK cells were sorted out of the BM of 1° recipients and re-transplanted in equal numbers of 1,000 LSK cells per 2° recipient mice (pLKO.1, n = 8; shCtgf, n = 4).
(C) Donor engraftment of total cells, myeloid, B and T cells in PB 5, 10, and 16 weeks after transplantation, presented as percentage of total cells.
(D) Representative FACS plots displaying donor engraftment in the BM of primary recipient mice receiving co-cultured cells, 16 weeks after transplantation.
(E) Engraftment of donor-derived MP and LSK cells in the BM, as percentage of total (donor plus recipient) MP and LSK cells, respectively.
(F) Representative FACS plots displaying donor engraftment in the PB of secondary recipients, 16 weeks after transplantation.
(G) Level of engraftment of hematopoietic cells in PB, BM, and spleen, 16 weeks after transplantation of secondary mice.
To investigate in vivo repopulating HSC quality of the HSCs regenerated in primary recipients, donor LSK cells from primary recipients from one experiment were transplanted in equal numbers per secondary recipient (1,000 LSK cells; Figure 2B). This experiment showed that none of the secondary recipients of LSK cells from primary recipients of shCtgf stromal co-cultures engrafted more than 1% in the peripheral blood (PB), BM, and spleen. In contrast, 62.5% secondary recipients of control co-cultures showed multi-lineage engraftment of more than 1% in recipient PB and spleens (five positive from eight total mice) and 50% in the BM (four positive from eight total mice) (Figures 2F and 2G). Thus, in co-cultures of LSK cells with shCtgf stroma, the quality of long-term repopulating HSCs was strongly diminished.
To determine possible mechanisms for how HSC maintenance could be diminished, we set up co-cultures (Figure 3A), and 1 day later, we found that the immunophenotype and total number of LSK cells were unchanged in shCtgf compared with pLKO.1 co-cultures (Figures 3B and 3C). However, cells from co-cultures on shCtgf stromal cells produced fewer hematopoietic colonies (Figure 3D). This decrease in hematopoietic progenitor activity was not due to alterations in apoptosis (Figure S3). Instead, we identified increased number of LSK cells residing in G0/G1 phase of the cell cycle (Figures 3E and 3F) and a larger fraction of LSK cells lacking expression of Ki67, which associates with actively cycling cells (Figure 3G).
Figure 3.

Stromal CTGF Regulates Progenitor Activity and the Cell Cycle of LSK Cells
(A) Experimental workflow: 1–2 × 10³ LSK cells were co-cultured on shCtgf and pLKO.1 control stroma for 1 and 2 days and analyzed by FACS and CFC assay.
(B) Representative FACS plots of sorted d1 cc.
(C) Absolute number of LSK cells after 1 day co-culture on pLKO.1 (white bars) and shCtgf (black bars).
(D) Hematopoietic colonies generated from sorted 200 LSK cells after 1 day of co-culture.
(E) Representative Dean/Jet/Fox DNA histograms (from FlowJo) of LSK cells sorted from 2-day co-cultures.
(F) Percentage of LSK cells in G0/G1, S and G2/M phases of the cell cycle after co-culture on pLKO.1 and shCtgf stroma (mean ± SD, n = 3).
(G) Percentage of LSK cells lacking Ki67 (in G0 of the cell cycle) after 1 day of co-culture on pLKO.1 and shCtgf stroma.
Bar graphs in (C), (D), and (F) represent the mean and SEM of three independent experiments. Representative dot plots or histograms from these experiments are shown. ∗p < 0.05.
To determine whether decreased cell-cycling activity would preserve or diminish maintenance of LSK cells, we set up co-cultures of CD34− SLAM cells, which are highly enriched for HSCs (sort scheme in Figure S4A) and would allow study of the direct effects on HSC-enriched cells. These cultures showed that CD34− SLAM cells did not form cobblestone areas on shCtgf stromal cells (Figures S4B–S4D), and no LSK cells were recovered after 1 week of co-culture (Figures S4E and S4F).
To determine whether the decrease in stromal CTGF negatively affects cell-cycling behavior depending on direct contact with stromal cells, we performed single-cell cultures of CD34− and CD34+ SLAM cells in pLKO.1-CM and shCtgf-CM supplemented with SCF and IL-11 (Figure 4A) (Wöhrer et al., 2014). We found that HSC-enriched CD34− SLAM cells cultured in shCtgf-CM show a decreased clone size during each day analyzed compared with those cultured in pLKO.1-CM because of a delay in first cell division (Figures 4B and S4G). This reduction in clone size in shCtgf-CM cultures was rescued by addition of recombinant CTGF (rCTGF; 250 ng/ml) (Figure 4B, left). Interestingly, similar cultures using progenitor-enriched CD34+ SLAM cells showed larger clones, which were not delayed in time to first cell division by the diminished level of CTGF in shCtgf-CM or affected by the addition of rCTGF (Figures 4B and S4G). The delay of first cell division might be due to an increased fraction of cells in G0/G1 to almost 40% in shCtgf-CM cultures, which was rescued by the addition of rCTGF (Figures 4C and 4D). When we assayed the clones formed in single-cell cultures for progenitor frequency, we found that cultures with rCTGF tended to show an increased number of colony-forming cells (CFCs per clone (Figure S4H). Interestingly, in line with a possible role of CTGF in lymphopoiesis (Cheung et al., 2014), a significantly larger number of B220+ and CD3ε+ lymphoid cells was found in cultures with added rCTGF, whereas the number of myeloid cells was unchanged (Figures 4E and 4F).
Figure 4.

Single-Cell Cultures of CD34− and CD34+ SLAM Cells
(A) Experimental design: single CD34− and CD34+ SLAM cells were sorted into 96-round-bottomed plate with pLKO.1-CM and shCtgf-CM, supplemented with mSCF (100 ng/ml) and IL-11 (20 ng/ml) with and without rCTGF (250ng/ml). Every 24 hr day, the number of cells in each well was microscopically evaluated. The accrued clones were harvested and plated into methylcellulose M3434 for 10 days, and the colonies were analyzed using flow cytometry.
(B) Mean number of cells per clone cultured in pLKO.1-CM and shCtgf-CM with and without rCTGF (left graph, CD34− SLAM cells, three independent experiments; right graph, CD34+ SLAM cells, two independent experiments).
(C) Cell-cycle analyses of CD34− SLAM cells, 2 days after culture in pLKO.1-CM or sh-CTGF-CM (gray histograms) with and without rCTGF (line histogram).
(D) Calculated proportion of G0/G1, S, and G2/M phase in each treatment (red lines from C).
(E) Representative dot plots of hematopoietic colonies grown from one clone cultured in shCtgf-CM with and without rCTGF stained for lymphoid (B220+, CD3ε+) and myeloid (CD11b, Gr1) markers.
(F) Means of lymphoid, and Gr1+CD11b+ and Gr1+CD11b+ myeloid populations of a total of 30 random clones analyzed (n = 15 for each of shCtgf-CM and shCtgf-CM + rCTGF). TER119+ erythroid cells were not detected.
∗p < 0.05.
To elucidate possible mechanisms underlying effects of decreased expression of stromal CTGF on co-cultured LSK cells, we constructed a CTGF signaling network model. For this purpose, we first cataloged CTGF interaction partners using the text-mining tool EXERBT (Barnickel et al., 2009) (Table S5). Thereafter, we added additional interactions among CTGF interactors from Pathway Commons (Cerami et al., 2011) (Table S5). The resulting CTGF interactome contained 1,742 interactions, involving 260 interactors, including genes/proteins, microRNAs (miRNAs), pathways, as well as some drugs and chemicals. ToppFun enrichment analysis of overrepresented GO terms included cell proliferation and migration, whereas overrepresented molecular pathways within the interactome showed that CTGF is involved in integrin signaling, canonical WNT and TGFB pathways.
To provide insights into how stromal CTGF might regulate signaling in HSCs, a CTGF signaling network model was constructed from the CTGF interactome (Table S6), which contained two interacting stromal inputs (CTGF and TGFB) as stimuli from the “niche” and five possible CTGF receptors expressed by LSK cells (LRP6, ITGAV/ITGB3, IGFR2, EGFR, and TGFBR1; Figure S5A), as well as 25 intrinsic regulatory nodes. The resulting network not only describes molecular pathways possibly regulated by CTGF but also shows how CTGF stimulation may link to G0/G1 transition (through CCND1:CDK4/6, RB1 phosphorylation, and E2F1 binding), and blockade of G1/S (through cyclin-dependent kinase inhibitors (CDKNs). A complete network using the interaction information to construct the network in the form of 32 unique nodes and 95 edges (Table S6) was visualized using the “modified Edinburgh Pathway Notation” (Freeman et al., 2010) (Figure 5).
Figure 5.

CTGF Signaling Network Model
We compiled a list of molecules known to be associated with hematopoiesis (Table S4) and reported to interact directly or indirectly with CTGF and each other using EXERBT text mining and Pathway Commons, respectively (Tables S5 and S6). Information about the nature of the interaction are described in detail in Table S5. Interaction partners with links to cell-cycle progression were chosen to determine how CTGF would affect cell-cycle progression (Table S6). The latter interaction partners were compiled into a network, which was then visualized using Edinburgh Pathway notation. (Freeman et al., 2010) In the model, activation links (A, green lines), inhibitory links (I, red lines), binding partners (B, black lines), phosphorylation targets (black lines), cytosol-nucleus transport (T, blue lines), and possible synergistic actions (&) are shown.
To assess the predictive value of each node within this simulated Ctgf signaling network, sorted LSK cells from d1 cc on pLKO.1 or shCtgf stromal cells were examined using RT-PCR (Figure S5B) and single-cell immunofluorescence (Istvanffy et al., 2011, Renström et al., 2009) (Figures S5C and 6A). Our experiments demonstrate that reduction of stromal CTGF leads to a strong increase in SMAD2/3 phosphorylation, increased p27Kip1 (CDKN1B), negative regulation of CCND1, increased phosphorylation of RB1, and decreased E2F1 in co-cultured LSK cells (Figure 6B), all events associated with diminished G0/G1 transition and/or G1/S blockade. Moreover, we find decreased canonical WNT signaling (decreased pS9-GSK3B levels and increased phosphorylated CTNNB1/decreased total CTNNB1). In addition, we find decreased PTEN/AKT1 signaling (both pT308- and pS473-AKT1), accompanied with increased PTEN when LSK cells were co-cultured with shCtgf stroma (Figure 6C). Decreased AKT1 signaling mediated by increased PTEN downregulates both TGFB (Hjelmeland et al., 2005) and canonical WNT signals (Korkaya et al., 2009), suggesting that this pathway may synergize in the observed increase in G0 and delayed time to first division. Of additional interest, comparison of protein quantifications (Figures 6B, 6C, and S5C) and qRT-PCR results (Figure S5B) strongly suggests that the increases in PTEN and CDKN1B proteins are both post-translationally regulated, because transcripts do not change (Pten) or are lower (Cdkn1b). The underlying mechanism is unclear, because the protein level of the regulatory subunit of the main CDKN1B ubiquitin ligase, the inducible SKP2, is unchanged (Figure S5C).
Figure 6.

Stromal Ctgf Deficiency Affects Signaling Events and Senescence in LSK Cells
(A) Experimental design: 5 × 10³ LSK cells or 1 × 10³ CD34− SLAM cells were co-cultured on pLKO.1 and shCtgf stroma for 1 day, harvested by trypsin/EDTA digestion, and sorted on poly-lysine coated slides and stained for the antigens shown. For each molecule, three or four independent experiments were performed.
(B) LSK cells co-cultured with shCtgf stromal cells show increased signaling along the phospho-SMAD2/3/CDKN1B axis, reportedly known to inhibit CCND1/pRB1 and E2F1. Shown are representative immunofluorescent stains, counterstained with DAPI with corresponding distribution of staining intensity (pixel numbers), as measured with ImageJ software.
(C) LSK cells co-cultured with shCtgf stomal cells show increased PTEN-mediated inhibition of canonical WNT signaling and its target CCND1. Shown are representative immunofluorescent stains as in (B).
(D) Expression of pSMAD2/3, CCND1, and CDKN1B in CD34− SLAM cells co-cultured on pLKO.1 and shCtgf stromal cells. Shown are the representative immunofluorescent stains as in (B).
(E) Expression of γH2A.X in CD34− SLAM cells after one day of co-culture on pLKO.1 and shCtgf stroma. Representative immunofluorescent stains and measurements as in (B).
(F) DAPI staining of representative nuclei of CD34− SLAM cells co-cultured on pLKO.1 and shCtgf stromal cells and corresponding SAHF (senescence-associated heterochromatin foci) number analyzed with ImageJ software. In the dot plots, each dot represents an individual cell.
All scale bars represent 5 μm. p < 0.05.
The different times to first cell division of CD34− SLAM cells in pLKO.1-CM and shCtgf-CM (Figure 4) led us hypothesize that some nodes within the CTGF signaling network might be differentially responsive to environmental CTGF in co-cultures. Although most of the nodes we studied show uniform up- or downregulation (or no regulation) some, like p-SMAD2/3 and CDKN1B, suggests that two responsive populations may exist. Thus, we also studied these proteins after co-cultures of HSC-enriched CD34− SLAM cells. In line with the hypothesis that TGFB signaling is involved in CTGF signaling, we found that TGFBR1 is detectable only in CD34− SLAM cells (Figure S6A). Also, TGFBR1 is not regulated by co-culture (Figure S6B). In support of the idea that increased G0 retention of CD34− SLAM cells on shCtgf stroma may be caused by TGFBR1 signaling, an increase in phospho-SMAD2/3, and CDKN1B (p27Kip1), with diminished CCND1 was found (Figure 6D). We further explored whether G0/G1 retention could be caused by senescence-associated chromatin re-organization. Indeed, CD34− SLAM cells co-cultured on shCtgf stroma showed increased numbers of senescence-associated heterochromatin foci (SAHF) and γH2A.X+ nuclear foci (Figures 6E and 6F). Expression of senescence-associated markers persisted in 1-week co-cultures (Figures S6C and S6D), suggesting that reduced HSC activity is, at least in part, due to induction of senescence in shCtgf stromal co-cultures.
Discussion
The activation of the HSC cell cycle is thought to be precisely coordinated by a specific combination of “niche” signals. Under steady-state conditions, HSCs exist in quiescent (dormant, hibernating) and activated states. Quiescent HSCs are activated under conditions of hematopoietic stress, such as infection, wounds, cytotoxic agents, and irradiation. Our findings demonstrate that stromal cells rapidly respond to the presence of LSK cells with gene expression changes. We show that more than 1,500 transcripts are differentially expressed between d0 (before contact), d1 mc (medium change control), and d1 cc, d2 cc, and d3 cc (co-culture with UG26-1B6 stromal cells). We found that most upregulated stromal genes were associated with GO terms associated with stress responses, such as wounding and infection. Thus, UG26-1B6 respond to normal murine LSK cells in much the same way as another stromal cell line, EL08-1D2, which shows a “wounding signature” upon contact with human CLL cells (Lutzny et al., 2013). Taken together, niche cells respond in contact with normal and malign hematopoietic cells with an inflammatory response.
One of the components of that response is an increase of CTGF in stromal cells. CTGF directs connective tissue regeneration by MSC in an injury model (Lee et al., 2010) and is associated with fibrotic responses in various organs (Chen and Lau, 2009). CTGF is known as an ECM-associated TGFB, BMP, and WNT signaling intermediate, among others, playing a role in cell-cycle control and proliferation (Kothapalli and Grotendorst, 2000). In mice, CTGF has been shown to promote the integrated growth of bone (Kubota and Takigawa, 2007). Also, CTGF was shown to be strongly expressed by MSCs from the BM and to regulate their adipogenic differentiation (Kothapalli and Grotendorst, 2000).
A recent study has shown that Ctgf −/− fetal liver HSCs repopulate recipients normally and that, in newborn mice, the number of different niche cell populations is unchanged (Cheung et al., 2014). However, a smaller number of B cells is found in the BM and spleen of Ctgf −/− newborn mice. In line with these observations is that HSCs co-cultured on shCtgf stroma show a decreased ability to engraft B cells, with concomitant decrease in myeloid cells. Our single CD34− SLAM culture in shCtgf-CM with added rCTGF shows that an increase of external CTGF promotes outgrowth of lymphoid cells without effects on myeloid cells, supporting the view that CTGF potentiates IL-7-induced B cell proliferation (Cheung et al., 2014). Though the effect of CTGF on myelopoiesis remains unclear, our study confirms the view that CTGF is induced in response to hematopoietic stress and that it is a positive regulator of lymphopoiesis.
We found that a decrease of CTGF in stromal cells impairs maintenance of long-term repopulating HSCs. In co-cultures of CD34− SLAM cells on shCtgf stroma, we observed a complete loss of LSK cells. Thus, the regenerative stress of HSCs from these cultures is much higher, explaining the loss of engraftment of shCtgf-stromal cell-co-cultured HSCs already in the primary recipients, which is propagated in secondary recipients. Considering that long-term self-renewal activity is associated with myeloid engraftment, the observed decrease in myeloid engraftment with relative preservation of lymphoid engraftment is consistent with a decreased LT-HSC quality and suggests that CTGF promotes HSC functional activity. Indeed, the rescue effect of rCTGF in the single cell cultures of CD34− SLAM cells in shCtgf-CM on clone size suggests that CTGF may promote HSC self-renewal.
To understand how extrinsic CTGF regulates intrinsic signaling in HSCs, we created a CTGF interactome and a subtracted CTGF signaling network model. Not only did we model possible signaling outcomes, we also validated the different nodes of this network to demonstrate that lower concentrations of CTGF in the extracellular space during the first day of co-culture lead to strongly increased SMAD2/3 activation in HSC-enriched CD34− SLAM cells, decreased AKT phosphorylation, and canonical WNT signaling. The end result of the concerted action on different pathways is an accumulation of CDKN1B (p27Kip1) and a decrease of CCND1 expression and cell-cycle progression. Remarkably, our findings suggest a possible synergistic decrease in canonical WNT signaling by increased PTEN expression and decreased phosphorylation of both T308 and S473 AKT1. Indeed, we find that increased PTEN is associated with reduced HSC activity, because PTEN deletion promotes primitive HSC survival and self-renewal (Perry et al., 2011).
Our experiments show that TGFBR1 is differentially expressed between CD34− and CD34+ SLAM cells, indicating that the more primitive CD34− SLAM cells would respond more strongly to TGFB than CD34+ SLAM cells. Reminiscent of our single CD34− SLAM cultures, low doses of TGFB increase production of myeloid colony-forming cells, and addition of TGFB decreases the number of myeloid-biased HSCs in G0/G1 (Challen et al., 2010). Indeed, high expression of TGFBR1 on SLAM cells identifies HSCs with high myeloid but low lymphoid engraftment potential (Quéré et al., 2014). Combining our data with these published studies suggests that CTGF is a niche-dependent downstream effector of TGFB, which prevents cell-cycle arrest and senescence of TGF-responsive (myeloid-biased) HSCs.
In summary, we have found that early hematopoietic cells induce a wounding and inflammatory expression profile associated with stress responses in stromal cells. We further identified the upregulation of the wound regeneration-promoting CTGF to be critical to prevent exhaustion of long-term-repopulating HSCs in culture. In addition, the CTGF signaling network predicts that a decrease in environmental CTGF down-modulates the cell-cycle activity of CD34− SLAM cells by upregulated signaling through the SMAD2/3/CDKN1B axis and concomitantly cross-regulated downregulation of canonical WNT-mediated regulation of CCND1/pRB1/E2F1-mediated G0/G1 progression. Our present study helps to understand the interplay of reciprocal signaling between stromal cells and HSCs in culture and in the niche during hematopoietic stress.
Experimental Procedures
Mice
C57BL/6 (8–10 weeks old, CD45.2) mice were purchased from Harlan. In transplantation experiments, B6.SJL-Ptprca Pepcb/BoyJ (CD45.1) mice from Taconic were used as recipients. All experiments were approved by the Government of Upper Bavaria. All animals were housed for at least 1 week prior to experimental use in microisolators under specific pathogen-free conditions, according to Federation of Laboratory Animal Science Associations and institutional recommendations.
Flow Cytometry Analysis and Cell Sorting
LSK cells were isolated from C57BL/6.J mice as described previously (Istvanffy et al., 2011, Renström et al., 2009). Surface antigens were stained with antibodies from eBioscience (Natutec), except for PE-Cy5.5-streptavidin conjugate, which was obtained from Invitrogen. Fluorescence-activated cell sorting (FACS) analyses were performed on a CyAn ADP Lx P8 (Coulter-Cytomation). Data were analyzed with FlowJo software (TreeStar). Sorting of cell populations was done with a MoFlo High Speed cell sorter (Beckman Coulter).
Stromal Cells and Co-cultures
The stromal cell line UG26-1B6 was cultured under non-confluent conditions at 33°C as described (Oostendorp et al., 2002, Oostendorp et al., 2005). Lentiviral shRNAmir in pLKO.1 vector (OpenBiosystems, GE Dharmacon) was used for stable knockdown of CTGF (shCtgf) in stromal cells as described previously (Istvanffy et al., 2011, Renström et al., 2009). As a control UG26-1B6 stromal cells transformed with empty vector (pLKO.1) were used. Infected cells were selected by 5 μg/mL puromycin in the medium for 3 days after infection or thawing.
For co-cultures, UG26-1B6 cells and pLKO.1 or shCtgf derivatives were grown to confluence and irradiated with 30 Gy. Lin− cells were magnetically selected (Lineage Depletion Kit; Miltenyi Biotec) according to the manufacturer’s recommendations. LSK cells were isolated on a cell sorter. We plated either up to 2.5 × 10⁴ LSK cells (for microarray analyses and immunofluorescence studies), 5,000 Lin− cells (for transplantation assays), or up to 1,000 CD34− CD150+ CD48− LSK (CD34− SLAM) on stromal cells in a 3-cm dish or 12-well plate for 1 day or 1 week. For the microarray analyses, UG26-1B6 cells were co-cultured in a 12-well plate for 1 (1d cc), 2 (2d cc), or 3 (3d cc) days. For gene expression analyses and immunofluorescence, co-cultures were separated into stromal cells (SSChigh, CD45− SCA-1high) and hematopoietic cells (SSClow, CD45+ Lin−, SCA-1+, KIT+) on a MoFlo cell sorter.
Single Cell Cultures
Serum-free CM was prepared by incubating serum-free medium (BIT; STEMCELL Technologies), 40 μg/ml low-density lipoproteins (Sigma), 100 U/ml penicillin, 100 μg/ml streptomycin, and 10−4 M β-mercaptoethanol for 3 days on irradiated (30 Gy) confluent pLKO.1 (pLKO.1-CM) and shCtgf (shCtgf-CM) stromal cells. Before use, CM was filtered through a 0.4 μm filter.
CD34− and CD34+ SLAM cells were sorted into round-bottomed 96-well plates preloaded with 100 μl of pLKO.1-CM and shCtgf-CM, supplemented with mSCF (100 ng/ml) and IL-11 (20 ng/ml), both from R&D Systems, and rCTGF (250 ng/ml; BioVendor) where indicated. Immediately after sorting, the plates were centrifuged for 5 min at 200 × g and microscopically inspected for the presence of single cells. Each well was inspected every 24 hr for clonal growth. After 5 days, each clone was harvested and studied for colony formation in growth factor-supplemented methylcellulose (M3434; STEMCELL Technologies), After 10 days, the number of colonies was counted and cells were harvested, and washed three times with HF2+, pelleted, and stained with B220-PECy7, CD3ε-PECy5.5, CD11b-APCCy7, GR1-PB, and TER119-PE (eBiosciences). Immunofluorescence staining was measured on a CyAn ADP Lx P8 (Coulter-Cytomation) and analyzed with FlowJo software (TreeStar).
Total RNA Isolation and mRNA Profiling
Total RNA was isolated using RNeasy Micro Kit (Qiagen), according to the manufacturer’s recommendation. RNA amplification, hybridization, and array scanning were performed at the Department of Microbiology and Immunology, Technische Universität München. qRT-PCR total RNA was reverse-transcribed into cDNA using the QuantiTect RT Kit (Qiagen), according to the manufacturer’s recommendation. qRT-PCR was performed using Power SYBR Green PCR Master Mix and analyzed using the StepOne Real-Time PCR System (Applied Biosystems), as described in the Supplemental Information. All primer sequences used in this study are given in Table S7.
Protein Expression Profiling
Single-cell staining of different proteins was performed as previously described (Istvanffy et al., 2011, Renström et al., 2009). In brief, stromal cells grown to confluence on gelatin-coated wells or on poly-L-lysine-coated slides were irradiated with 30 Gy, and a full medium change was performed. One day later, LSK cells were plated on the stromal cells. After 1 more day of culture at 33°C, 5% CO2, cells were harvested by trypsin digestion, and LSK cells were sorted as described above. Alternatively, LSK cells were washed off using PBS and adherent stromal cells were stained.
For immunofluorescence staining, 1 × 10³ LSK cells sorted from co-cultures were spotted on poly-L-lysine-coated slides. Cells were fixed with 4% paraformaldehyde in PBS and blocked with 10% fetal calf serum, 0.1% Triton-X in PBS and stained with the antibodies listed in Table S8. As a secondary antibody, we used anti-rabbit, Alexa Fluor 488-conjugated antibody (4412; Cell Signaling). All stains were counterstained with DAPI and mounted with SlowFade Gold Antifade Reagent (Invitrogen). Staining was assessed on the Leica DM RBE fluorescent microscope. Fluorescence intensities of stained cells were quantified in total pixels using ImageJ (NIH). Each stain included a negative Ig control for background correction.
The quantitative measurement of CTGF protein in cell lysates was performed with ELISA Kit for CTGF (USCN Life Science), following the manufacturer’s instructions.
In Vivo Transplantation Assay
In vivo repopulation assay using competitive transplantation into lethally irradiated recipient mice was performed as we have described previously (Istvanffy et al., 2011, Renström et al., 2009). In brief, 5,000 Lin− cells (CD45.1) were co-cultured with pLKO.1 or shCtgf stromal cells for 1 week. Each culture was then harvested by trypsin/EDTA digestion and transplanted into five lethally irradiated (CD45.2) recipients together with 105 competitor BM cells. After 16 weeks, mice were sacrificed and hematopoietic tissues were analyzed by flow cytometry. Subsequently, donor CD45.1+ LSK cells were sorted from the BM of primary recipients and re-transplanted in equal numbers of 1,000 LSK cells per secondary recipient mice.
Cell-Cycle Analysis
For cell-cycle analysis, LSK cells were sorted and co-cultured for 48 hr on pLKO.1 or shCtgf stromal cells, or, alternatively, CD34− SLAM were cultured for 24 hr in pLKO.1-CM and shCtgf-CM, with addition of rCTGF (250 ng/ml). After culture, LSK cells were separated from stromal cells, or CD34− SLAM cells were harvested and fixed in dropwise added cold 70% ethanol. After overnight fixation at −20°C, cells were washed twice in 1 × PBS, stained with propidium iodide (PI), and incubated with RNase A for 3 hr at room temperature. PI staining was measured by flow cytometry and analyzed using FlowJo analysis software.
Time-Series Gene Expression Data Processing and Analysis
Time-series gene expression data analysis was performed using R/Bioconductor (Gentleman et al., 2004) packages: we further used affy (Gautier et al., 2004), GCRMA (Wu and Irizarry, 2004), arrayQualityMetrics (Kauffmann et al., 2009), and LIMMA (Wettenhall and Smyth, 2004). The false discovery rate (FDR) was controlled using the Benjamini-Hochberg (BH) procedure (Benjamini, 1995). Finally, clustering was performed using STEM (http://www.sb.cs.cmu.edu/stem) (Ernst and Bar-Joseph, 2006).
Candidate Gene Prioritization
To find candidate genes, we first used the ToppGene candidate gene prioritization algorithm (http://toppgene.cchmc.org) (Chen et al., 2009). In order to further reduce the number of DEGs, we performed hierarchical clustering of the top 100 highest ranked DEGs using the function hclust in the R statistical environment (version 2.14.1), standard package stats with default parameters.
Culling the CTGF Interactome from the Literature and Public Databases
The CTGF interactome was culled from the literature by using the EXCERBT text-mining tool on the basis of semantic sentence analysis (Barnickel et al., 2009), followed by manual curation. Further interactions within CTGF first neighbors were retrieved from the Pathway Commons database (http://www.pathwaycommons.org) (Cerami et al., 2011) integrating several different protein-protein interaction resources.
Construction of the Literature-Based CTGF Signaling Network
We first selected a list of “seed genes” from the CTGF interactome and, starting from reported CTGF receptors, which are expressed by LSK cells (Figure S6A), performed text mining, again using EXERBT (Barnickel et al., 2009), and used manual curation to identify the pathway nodes and major molecular players relaying possible signals from CTGF receptors to its downstream targets within the “seed.” More details can be found in Supplemental Information.
Statistics
All analyses with data from the microarrays were performed in the R statistical environment (version 2.14.1). In the analyses of the gene expression data (microarrays as well as qRT-PCR), we used the FDR to control for the expected proportion of false discoveries among the rejected hypotheses (Benjamini, 1995).
Unless otherwise indicated, the functional biological and the biochemical data are presented as the mean and the SE associated with the mean. In these experiments, the two-tailed Student’s t test with a level of significance of 0.05 was performed for two-group comparisons of the differences between the samples under study.
Author Contributions
R.I., B.V., C.S., F.R., C. Pagel, S.G., O.P.C., and L.H. performed the experiments. K.S.G., M.S., V.S., and J.B. provided infrastructure and contributed critical reagents, materials, and analysis tools. C. Peschel and H.-W.M. designed the research. R.I., B.V., and R.A.J.O. designed the research, analyzed the data, and wrote the manuscript.
Acknowledgments
This project was supported by Technische Universität München, Graduate School of Bioengineering (GSB; http://www.bioengineering.gs.tum.de), the German José Leukemia Research Foundation (DJCLS R 11/12), and the German Research Council (DFG OO 8/5, OO 8/9, and FOR 2033/1). We gratefully acknowledge the support of Prof. Torsten Buch, of the Expression Core Facility of the Institute of Medical Microbiology, Hygiene, and Immunology of the Technische Universität München.
Published: October 29, 2015
Footnotes
This is an open access article under the CC BY-NC-ND license (http://creativecommons.org/licenses/by-nc-nd/4.0/).
Supplemental Information includes Supplemental Experimental Procedures, six figures, and eight tables and can be found with this article online at http://dx.doi.org/10.1016/j.stemcr.2015.09.018.
Accession Numbers
The accession number for the microarray data reported in this paper is GEO: GSE68834.
Supplemental Information
ToppFun analysis of functional categories significantly associated with genes down-regulated after performing two-way comparison of 24 h co-culture-derived (Day1; d1) vs. separately cultured UG26-1B6 (Day0; d0) cells (Supplementary Table1) and unified in STEM ((Ernst and Bar-Joseph, 2006); http://www.cs.cmu.edu/jernst/stem) cluster #1 (C1; Figure 1B, C). ToppFun is part of the ToppGene Suite http://toppgene.cchmc.org (Chen et al., 2009). Detects enriched terms of the gene annotations and sequence features, namely, GO: Molecular Function, GO: Biological Process, Mouse Phenotype, Pathways, Protein Interactions, Protein Domains, transcription factor binding sites, miRNA-target genes, disease-gene associations, drug-gene interactions and Gene Expression, compiled from various data sources. Hypergeometric distribution with Bonferroni correction (p-Value cutoff <= 0.05, default parameters) was used for determining statistical significance.
ToppFun analysis of functional categories significantly associated with genes up-regulated after performing two-way comparison of 24 h coculture- derived (Day1; d1 cc) vs. separately cultured UG26-1B6 (Day0; d0) cells (Supplementary Table1) and unified in STEM ((Ernst and Bar-Joseph, 2006); http://www.cs.cmu.edu/jernst/stem) cluster #2 (C2; Figure 1B, D). ToppFun is part of the ToppGene Suite http://toppgene.cchmc.org (Chen et al., 2009). Detects enriched terms of the gene annotations and sequence features, namely, GO: Molecular Function, GO: Biological Process, Mouse Phenotype, Pathways, Protein Interactions, Protein Domains, transcription factor binding sites, miRNA-target genes, disease-gene associations, drug-gene interactions and Gene Expression, compiled from various data sources. Hypergeometric distribution with Bonferroni correction (p-Value cutoff <= 0.05, default parameters) was used for determining statistical significance.
Genes differentially expressed (DEGs) after performing two-way comparison of 24 h co-culture-derived (Day1; d1 cc) vs. separately cultured UG26-1B6 (Day0; d0) cells. GcRMA-normalized gene expression data were first filtered using an additional control 24 h after changing the culture medium (d1 mc). Co-culture-derived transcripts that did not show significant positive (p-Value <= 0.05 ) associations with medium-control-derived transcripts in terms of Pearson’s correlation coefficient, as well as transcripts that were part of our microarray validation set were further subjected to empirical Bayes test statistics as implemented in LIMMA (Smyth et al., 2005). Genes where considered differentially expressed (DEGs), if their expression level difference was -1 <= log2FC >= 1 and p-Value <= 0.05 across the two time points being compared.
Hematopoiesis-associated genes retrieved by performing extensive biomedical literature search using the text-mining tool EXCERBT (Extraction of Classified Entities and Relations from Biomedical Texts) (Barnickel et al., 2009; Mewes et al., 2011). Co-occurrence search was employed in order to retrieve all the genes associated with the phenotype ‘hematopoiesis’. Thereafter, false positives were discarded by manual curation. By this, a list of 374 genes shown to modulate HSCs or hematopoiesis in general was obtained. This seed list was further supplemented with ToppGene mouse phenotypic data associated with phenotypes ‘leukemia’ (HP:0001909), ‘acute leukemia’ (HP:0002488), ‘hematological neoplasia’ (HP:0004377), ‘abnormal hematopoiesis’ (MP:0002123), ‘abnormal hematopoietic cell number’ (MP:0011180) and ‘abnormal HSC morphology’ (MP:0004808), yielding an extended list of 1737 genes.
CTGF interaction partners retrieved by performing extensive biomedical literature search using the textmining tool EXCERBT (Extraction of Classified Entities and Relations from Biomedical Texts) (Barnickel et al., 2009; Mewes et al., 2011). Co-occurrence search was employed in order to retrieve all the molecular species and phenotypes associated with Ctgf. Thereafter, false positives were discarded by manual curation. By this, a list of 274 unique interactions was obtained (since in some cases controverse results were reported and/or more than one source yealded the association, the total number of interactions was 548).
Construction of the literature-based signaling network model of CTGF-regulated HSC cell-cycle progression. Literature mining using EXCERBT (Extraction of Classified Entities and Relations from Biomedical Texts) (Barnickel et al., 2009; Mewes et al., 2011) and manual curation was performed to identify the pathways and major molecular players relaying a signal from CTGF to the terminal nodes associated with the cell-cycle regulation: Ctgf, Cyclin D1 (Ccdn1), p21Cip1 (Cdkn1a), FoxO1 (Foxo1) and LEF (Lef1). The network was split into two sub-networks associated with functional outcomes (i) G0/G1 defined as the activation of Cyclin D:Cdk4/6 and (ii) G1/S block, where the induction of p21Cip1 and/or p27Kip1 serves as the readout. In order to keep the size of the network meaningful, parts of it were simplified, for example, the MAPK cascade, in which a series of nodes and edges impinge only on each other (see KEGG map04510: Focal adhesion), was reduced to FAK → Erk1/2.
References
- Barnickel T., Weston J., Collobert R., Mewes H.W., Stümpflen V. Large scale application of neural network based semantic role labeling for automated relation extraction from biomedical texts. PLoS ONE. 2009;4:e6393. doi: 10.1371/journal.pone.0006393. [DOI] [PMC free article] [PubMed] [Google Scholar]
- Benjamini Y.H.Y. Controlling the false discovery rate: a powerful and practical approache to multiple testing. J. R. Stat. Soc., B. 1995;57:289–300. [Google Scholar]
- Buckley S.M., Ulloa-Montoya F., Abts D., Oostendorp R.A., Dzierzak E., Ekker S.C., Verfaillie C.M. Maintenance of HSC by Wnt5a secreting AGM-derived stromal cell line. Exp. Hematol. 2011;39:114–123. doi: 10.1016/j.exphem.2010.09.010. [DOI] [PMC free article] [PubMed] [Google Scholar]
- Cerami E.G., Gross B.E., Demir E., Rodchenkov I., Babur O., Anwar N., Schultz N., Bader G.D., Sander C. Pathway Commons, a web resource for biological pathway data. Nucleic Acids Res. 2011;39:D685–D690. doi: 10.1093/nar/gkq1039. [DOI] [PMC free article] [PubMed] [Google Scholar]
- Challen G.A., Boles N.C., Chambers S.M., Goodell M.A. Distinct hematopoietic stem cell subtypes are differentially regulated by TGF-beta1. Cell Stem Cell. 2010;6:265–278. doi: 10.1016/j.stem.2010.02.002. [DOI] [PMC free article] [PubMed] [Google Scholar]
- Chen C.C., Lau L.F. Functions and mechanisms of action of CCN matricellular proteins. Int. J. Biochem. Cell Biol. 2009;41:771–783. doi: 10.1016/j.biocel.2008.07.025. [DOI] [PMC free article] [PubMed] [Google Scholar]
- Chen J., Bardes E.E., Aronow B.J., Jegga A.G. ToppGene Suite for gene list enrichment analysis and candidate gene prioritization. Nucleic Acids Res. 2009;37:W305–W311. doi: 10.1093/nar/gkp427. [DOI] [PMC free article] [PubMed] [Google Scholar]
- Cheung L.C., Strickland D.H., Howlett M., Ford J., Charles A.K., Lyons K.M., Brigstock D.R., Goldschmeding R., Cole C.H., Alexander W.S., Kees U.R. Connective tissue growth factor is expressed in bone marrow stromal cells and promotes interleukin-7-dependent B lymphopoiesis. Haematologica. 2014;99:1149–1156. doi: 10.3324/haematol.2013.102327. [DOI] [PMC free article] [PubMed] [Google Scholar]
- Ernst J., Bar-Joseph Z. STEM: a tool for the analysis of short time series gene expression data. BMC Bioinformatics. 2006;7:191. doi: 10.1186/1471-2105-7-191. [DOI] [PMC free article] [PubMed] [Google Scholar]
- Essers M.A., Offner S., Blanco-Bose W.E., Waibler Z., Kalinke U., Duchosal M.A., Trumpp A. IFNalpha activates dormant haematopoietic stem cells in vivo. Nature. 2009;458:904–908. doi: 10.1038/nature07815. [DOI] [PubMed] [Google Scholar]
- Freeman T.C., Raza S., Theocharidis A., Ghazal P. The mEPN scheme: an intuitive and flexible graphical system for rendering biological pathways. BMC Syst. Biol. 2010;4:65. doi: 10.1186/1752-0509-4-65. [DOI] [PMC free article] [PubMed] [Google Scholar]
- Gautier L., Cope L., Bolstad B.M., Irizarry R.A. affy--analysis of Affymetrix GeneChip data at the probe level. Bioinformatics. 2004;20:307–315. doi: 10.1093/bioinformatics/btg405. [DOI] [PubMed] [Google Scholar]
- Gentleman R.C., Carey V.J., Bates D.M., Bolstad B., Dettling M., Dudoit S., Ellis B., Gautier L., Ge Y., Gentry J. Bioconductor: open software development for computational biology and bioinformatics. Genome Biol. 2004;5:R80. doi: 10.1186/gb-2004-5-10-r80. [DOI] [PMC free article] [PubMed] [Google Scholar]
- Hjelmeland A.B., Hjelmeland M.D., Shi Q., Hart J.L., Bigner D.D., Wang X.F., Kontos C.D., Rich J.N. Loss of phosphatase and tensin homologue increases transforming growth factor beta-mediated invasion with enhanced SMAD3 transcriptional activity. Cancer Res. 2005;65:11276–11281. doi: 10.1158/0008-5472.CAN-05-3016. [DOI] [PubMed] [Google Scholar]
- Istvanffy R., Kröger M., Eckl C., Gitzelmann S., Vilne B., Bock F., Graf S., Schiemann M., Keller U.B., Peschel C., Oostendorp R.A. Stromal pleiotrophin regulates repopulation behavior of hematopoietic stem cells. Blood. 2011;118:2712–2722. doi: 10.1182/blood-2010-05-287235. [DOI] [PubMed] [Google Scholar]
- Kauffmann A., Gentleman R., Huber W. arrayQualityMetrics--a bioconductor package for quality assessment of microarray data. Bioinformatics. 2009;25:415–416. doi: 10.1093/bioinformatics/btn647. [DOI] [PMC free article] [PubMed] [Google Scholar]
- Korkaya H., Paulson A., Charafe-Jauffret E., Ginestier C., Brown M., Dutcher J., Clouthier S.G., Wicha M.S. Regulation of mammary stem/progenitor cells by PTEN/Akt/beta-catenin signaling. PLoS Biol. 2009;7:e1000121. doi: 10.1371/journal.pbio.1000121. [DOI] [PMC free article] [PubMed] [Google Scholar]
- Kothapalli D., Grotendorst G.R. CTGF modulates cell cycle progression in cAMP-arrested NRK fibroblasts. J. Cell. Physiol. 2000;182:119–126. doi: 10.1002/(SICI)1097-4652(200001)182:1<119::AID-JCP13>3.0.CO;2-4. [DOI] [PubMed] [Google Scholar]
- Kubota S., Takigawa M. Role of CCN2/CTGF/Hcs24 in bone growth. Int. Rev. Cytol. 2007;257:1–41. doi: 10.1016/S0074-7696(07)57001-4. [DOI] [PubMed] [Google Scholar]
- Ledran M.H., Krassowska A., Armstrong L., Dimmick I., Renström J., Lang R., Yung S., Santibanez-Coref M., Dzierzak E., Stojkovic M. Efficient hematopoietic differentiation of human embryonic stem cells on stromal cells derived from hematopoietic niches. Cell Stem Cell. 2008;3:85–98. doi: 10.1016/j.stem.2008.06.001. [DOI] [PubMed] [Google Scholar]
- Lee C.H., Shah B., Moioli E.K., Mao J.J. CTGF directs fibroblast differentiation from human mesenchymal stem/stromal cells and defines connective tissue healing in a rodent injury model. J. Clin. Invest. 2010;120:3340–3349. doi: 10.1172/JCI43230. [DOI] [PMC free article] [PubMed] [Google Scholar]
- Lutzny G., Kocher T., Schmidt-Supprian M., Rudelius M., Klein-Hitpass L., Finch A.J., Dürig J., Wagner M., Haferlach C., Kohlmann A. Protein kinase c-β-dependent activation of NF-κB in stromal cells is indispensable for the survival of chronic lymphocytic leukemia B cells in vivo. Cancer Cell. 2013;23:77–92. doi: 10.1016/j.ccr.2012.12.003. [DOI] [PMC free article] [PubMed] [Google Scholar]
- Morrison S.J., Scadden D.T. The bone marrow niche for haematopoietic stem cells. Nature. 2014;505:327–334. doi: 10.1038/nature12984. [DOI] [PMC free article] [PubMed] [Google Scholar]
- Oostendorp R.A.J., Harvey K.N., Kusadasi N., de Bruijn M.F., Saris C., Ploemacher R.E., Medvinsky A.L., Dzierzak E.A. Stromal cell lines from mouse aorta-gonads-mesonephros subregions are potent supporters of hematopoietic stem cell activity. Blood. 2002;99:1183–1189. doi: 10.1182/blood.v99.4.1183. [DOI] [PubMed] [Google Scholar]
- Oostendorp R.A., Robin C., Steinhoff C., Marz S., Bräuer R., Nuber U.A., Dzierzak E.A., Peschel C. Long-term maintenance of hematopoietic stem cells does not require contact with embryo-derived stromal cells in cocultures. Stem Cells. 2005;23:842–851. doi: 10.1634/stemcells.2004-0120. [DOI] [PubMed] [Google Scholar]
- Perry J.M., He X.C., Sugimura R., Grindley J.C., Haug J.S., Ding S., Li L. Cooperation between both Wnt/beta-catenin and PTEN/PI3K/Akt signaling promotes primitive hematopoietic stem cell self-renewal and expansion. Genes Dev. 2011;25:1928–1942. doi: 10.1101/gad.17421911. [DOI] [PMC free article] [PubMed] [Google Scholar]
- Quéré R., Saint-Paul L., Carmignac V., Martin R.Z., Chrétien M.L., Largeot A., Hammann A., Pais de Barros J.P., Bastie J.N., Delva L. Tif1γ regulates the TGF-β1 receptor and promotes physiological aging of hematopoietic stem cells. Proc. Natl. Acad. Sci. U S A. 2014;111:10592–10597. doi: 10.1073/pnas.1405546111. [DOI] [PMC free article] [PubMed] [Google Scholar]
- Renström J., Istvanffy R., Gauthier K., Shimono A., Mages J., Jardon-Alvarez A., Kröger M., Schiemann M., Busch D.H., Esposito I. Secreted frizzled-related protein 1 extrinsically regulates cycling activity and maintenance of hematopoietic stem cells. Cell Stem Cell. 2009;5:157–167. doi: 10.1016/j.stem.2009.05.020. [DOI] [PubMed] [Google Scholar]
- Schofield R. The relationship between the spleen colony-forming cell and the haemopoietic stem cell. Blood Cells. 1978;4:7–25. [PubMed] [Google Scholar]
- Smyth G.K. Linear models and empirical Bayes methods for assessing differential expression in microarray experiments. Stat Appl Genet Mol Biol. 2004;3 doi: 10.2202/1544-6115.1027. article 3. [DOI] [PubMed] [Google Scholar]
- Tjwa M., Sidenius N., Moura R., Jansen S., Theunissen K., Andolfo A., De Mol M., Dewerchin M., Moons L., Blasi F. Membrane-anchored uPAR regulates the proliferation, marrow pool size, engraftment, and mobilization of mouse hematopoietic stem/progenitor cells. J. Clin. Invest. 2009;119:1008–1018. doi: 10.1172/JCI36010. [DOI] [PMC free article] [PubMed] [Google Scholar]
- Vanunu O., Magger O., Ruppin E., Shlomi T., Sharan R. Associating genes and protein complexes with disease via network propagation. PLoS Comput. Biol. 2010;6:e1000641. doi: 10.1371/journal.pcbi.1000641. [DOI] [PMC free article] [PubMed] [Google Scholar]
- Wilson A., Laurenti E., Trumpp A. Balancing dormant and self-renewing hematopoietic stem cells. Curr. Opin. Genet. Dev. 2009;19:461–468. doi: 10.1016/j.gde.2009.08.005. [DOI] [PubMed] [Google Scholar]
- Wöhrer S., Knapp D.J., Copley M.R., Benz C., Kent D.G., Rowe K., Babovic S., Mader H., Oostendorp R.A., Eaves C.J. Distinct stromal cell factor combinations can separately control hematopoietic stem cell survival, proliferation, and self-renewal. Cell Rep. 2014;7:1956–1967. doi: 10.1016/j.celrep.2014.05.014. [DOI] [PMC free article] [PubMed] [Google Scholar]
- Wu Z., Irizarry R.A. Preprocessing of oligonucleotide array data. Nat. Biotechnol. 2004;22:656–658. doi: 10.1038/nbt0604-656b. author reply 658. [DOI] [PubMed] [Google Scholar]
Associated Data
This section collects any data citations, data availability statements, or supplementary materials included in this article.
Supplementary Materials
ToppFun analysis of functional categories significantly associated with genes down-regulated after performing two-way comparison of 24 h co-culture-derived (Day1; d1) vs. separately cultured UG26-1B6 (Day0; d0) cells (Supplementary Table1) and unified in STEM ((Ernst and Bar-Joseph, 2006); http://www.cs.cmu.edu/jernst/stem) cluster #1 (C1; Figure 1B, C). ToppFun is part of the ToppGene Suite http://toppgene.cchmc.org (Chen et al., 2009). Detects enriched terms of the gene annotations and sequence features, namely, GO: Molecular Function, GO: Biological Process, Mouse Phenotype, Pathways, Protein Interactions, Protein Domains, transcription factor binding sites, miRNA-target genes, disease-gene associations, drug-gene interactions and Gene Expression, compiled from various data sources. Hypergeometric distribution with Bonferroni correction (p-Value cutoff <= 0.05, default parameters) was used for determining statistical significance.
ToppFun analysis of functional categories significantly associated with genes up-regulated after performing two-way comparison of 24 h coculture- derived (Day1; d1 cc) vs. separately cultured UG26-1B6 (Day0; d0) cells (Supplementary Table1) and unified in STEM ((Ernst and Bar-Joseph, 2006); http://www.cs.cmu.edu/jernst/stem) cluster #2 (C2; Figure 1B, D). ToppFun is part of the ToppGene Suite http://toppgene.cchmc.org (Chen et al., 2009). Detects enriched terms of the gene annotations and sequence features, namely, GO: Molecular Function, GO: Biological Process, Mouse Phenotype, Pathways, Protein Interactions, Protein Domains, transcription factor binding sites, miRNA-target genes, disease-gene associations, drug-gene interactions and Gene Expression, compiled from various data sources. Hypergeometric distribution with Bonferroni correction (p-Value cutoff <= 0.05, default parameters) was used for determining statistical significance.
Genes differentially expressed (DEGs) after performing two-way comparison of 24 h co-culture-derived (Day1; d1 cc) vs. separately cultured UG26-1B6 (Day0; d0) cells. GcRMA-normalized gene expression data were first filtered using an additional control 24 h after changing the culture medium (d1 mc). Co-culture-derived transcripts that did not show significant positive (p-Value <= 0.05 ) associations with medium-control-derived transcripts in terms of Pearson’s correlation coefficient, as well as transcripts that were part of our microarray validation set were further subjected to empirical Bayes test statistics as implemented in LIMMA (Smyth et al., 2005). Genes where considered differentially expressed (DEGs), if their expression level difference was -1 <= log2FC >= 1 and p-Value <= 0.05 across the two time points being compared.
Hematopoiesis-associated genes retrieved by performing extensive biomedical literature search using the text-mining tool EXCERBT (Extraction of Classified Entities and Relations from Biomedical Texts) (Barnickel et al., 2009; Mewes et al., 2011). Co-occurrence search was employed in order to retrieve all the genes associated with the phenotype ‘hematopoiesis’. Thereafter, false positives were discarded by manual curation. By this, a list of 374 genes shown to modulate HSCs or hematopoiesis in general was obtained. This seed list was further supplemented with ToppGene mouse phenotypic data associated with phenotypes ‘leukemia’ (HP:0001909), ‘acute leukemia’ (HP:0002488), ‘hematological neoplasia’ (HP:0004377), ‘abnormal hematopoiesis’ (MP:0002123), ‘abnormal hematopoietic cell number’ (MP:0011180) and ‘abnormal HSC morphology’ (MP:0004808), yielding an extended list of 1737 genes.
CTGF interaction partners retrieved by performing extensive biomedical literature search using the textmining tool EXCERBT (Extraction of Classified Entities and Relations from Biomedical Texts) (Barnickel et al., 2009; Mewes et al., 2011). Co-occurrence search was employed in order to retrieve all the molecular species and phenotypes associated with Ctgf. Thereafter, false positives were discarded by manual curation. By this, a list of 274 unique interactions was obtained (since in some cases controverse results were reported and/or more than one source yealded the association, the total number of interactions was 548).
Construction of the literature-based signaling network model of CTGF-regulated HSC cell-cycle progression. Literature mining using EXCERBT (Extraction of Classified Entities and Relations from Biomedical Texts) (Barnickel et al., 2009; Mewes et al., 2011) and manual curation was performed to identify the pathways and major molecular players relaying a signal from CTGF to the terminal nodes associated with the cell-cycle regulation: Ctgf, Cyclin D1 (Ccdn1), p21Cip1 (Cdkn1a), FoxO1 (Foxo1) and LEF (Lef1). The network was split into two sub-networks associated with functional outcomes (i) G0/G1 defined as the activation of Cyclin D:Cdk4/6 and (ii) G1/S block, where the induction of p21Cip1 and/or p27Kip1 serves as the readout. In order to keep the size of the network meaningful, parts of it were simplified, for example, the MAPK cascade, in which a series of nodes and edges impinge only on each other (see KEGG map04510: Focal adhesion), was reduced to FAK → Erk1/2.