Abstract
Background:
The E2F members have been divided into transcription activators (E2F1-E2F3) and repressors (E2F4-E2F8). E2F8 with E2F7 has been known to play an important physiologic role in embryonic development and cell cycle regulation by repressing E2F1. However, the function of E2F8 in cancer cells is unknown.
Methods:
E2F8 expression was assessed by immunoblotting or immunofluorescence staining in human lung cancer (LC) cells and tissues from LC patients (n = 45). Cell proliferation, colony formation, and invasion analysis were performed to evaluate the role of E2F8 in LC. Microarray analysis was used to determine the target genes of E2F8. The regulation of E2F8 on the expression of ubiquitin-like PHD and RING domain-containing 1 (UHRF1), one of E2F8 target genes, was determined using chromatin immunoprecipitation and promoter activity assays. Human LC xenograft models were used to determine the effects of inhibiting E2F8 by siRNAs (n = 7 per group) or antisense morpholino (n = 8 per group) on tumor growth. Survival was analyzed using the Kaplan-Meier method and group differences by the Student’s t test. All statistical tests were two-sided.
Results:
LC tumors overexpressed E2F8 compared with normal lung tissues. Depletion of E2F8 inhibited cell proliferation and tumor growth. E2F8 knockdown statistically significantly reduced the expression of UHRF1 (~60%-70%, P < .001), and the direct binding of E2F8 on the promoter of UHRF1 was identified. Kaplan-Meier analysis with a public database showed prognostic significance of aberrant E2F8 expression in LC (HR = 1.91 95% CI = 1.21 to 3.01 in chemo-naïve patients, P = .0047).
Conclusions:
We demonstrated that E2F8 is overexpressed in LC and is required for the growth of LC cells. These findings implicate E2F8 as a novel therapeutic target for LC treatment.
Lung cancer (LC) is the most frequent cause of cancer deaths worldwide with limited treatments for patients. Targeted inhibitors against receptor tyrosine kinases (RTKs) or epidermal growth factor receptor (EGFR) have shown some efficacy but a majority of patients develop therapeutic resistance (1–3). Even though LC development is largely associated with mutations in oncogenic Kras or in the tumor suppressor p53 (4), there are no clinically effective drugs for these patients.
Naphthol AS-TR phosphate (NASTRp) is an analog of Naphthol AS-E phosphate (NASEp), which has been identified as an inhibitor of cAMP response element-binding protein (CREB) transcriptional activity (5). We showed that NASEp inhibited IL-1β–induced CXC chemokine gene expression and angiogenic activity in LC cells (6). Recently, we have focused on the discovery and development of a subset of NASEp analogs, and NASTRp has emerged as a potential drug both in vitro and in vivo in LC (unpublished data). NASTRp is expected to have a variety of effects on LC cells, as CREB regulates numerous genes critical for cancer cell growth (7–10). Here, we performed microarray analysis to better understand the biological mechanisms. In addition to the well described molecules in the CREB-related pathway, E2F8, one of the E2F transcription factor members, was surprisingly found to be one of the top downregulated genes by NASTRp.
The E2F family members have been divided into transcription activators (E2F1-E2F3) and repressors (E2F4-E2F8) (11–19). Ectopic expression of E2F8 causes downregulation of E2F-target genes and cell-cycle arrest in fibroblasts (20,21). The synergistic function of E2F8 with E2F7 is essential for embryonic development (22), embryonic placental development (23), and embryonic angiogenesis (24) in mice. However, there are very few studies of the function of E2F8 in cancer. Here, we report a novel role of E2F8 in cancer, which provides a new therapeutic target for LC treatment.
Methods
Cell Culture
Human LC cell lines (A549, H441, H1792, H1975, H520, H1703, and H2170) were obtained from the American Type Culture Collection (ATCC). Normal human lung tracheobronchial epithelial (NHTBE) cells were obtained from the Lonza Walkersville, Inc. The 1198 human bronchial epithelial cell line was obtained from Dr. R. Lotan (The University of Texas M. D. Anderson Cancer Center, Houston, TX) and Dr. A. Klein-Szanto (Fox Chase Cancer Center, Philadelphia, PA). Human lung fibroblasts cell lines (MRC5, BJ1, and WI38) were obtained from the ATCC. Further details are available in the Supplementary Materials (available online).
Microarray Analysis
RNA was isolated using RNeasy Mini Kit (Qiagen) according to the manufacturer’s protocol. Gene expression analysis was performed on Affymetrix Human Gene 1.0 ST Genome arrays at the Yale University Keck Biotechnology Resource Laboratory. Expression values were normalized using GenePattern (http://www.broadinstitute.org/cancer/software/genepattern). Gene set enrichment analysis (GSEA; http://www.broad.mit.edu/gsea) was used to identify gene clusters. DAVID (http://david.abcc.ncifcrf.gov) functional annotation tool was used to identify gene ontology (GO) terms.
In Vivo Studies
All procedures were approved by the Institutional Animal Care and Use Committee at Yale University and conformed to the legal mandates and federal guidelines for the care and maintenance of laboratory animals. Female J:NU nude mice were obtained from Jackson Laboratory and used when six to seven weeks old. H520 cells were pretreated with 40nM of control siRNA, E2F8 siRNA-1, or E2F8 siRNA-2 for 24 hours, followed by transplantation (2 x 10⁶ cells/flank, xenograft n = 7 per group) into the flank of mice. For A549-luc xenografts, A549 cells were transfected with pGL4.51 luciferase plasmid (Promega, E132A) using Lipofectamine 2000 and selected by culturing in the presence of 600 µg/mL Geneticin (Invitrogen, 10131-035). Then, the mice received subcutaneous injections of cells (2 x 10⁶ cells/flank) and were injected intraperitoneally with mo-control or mo-E2F8 (10mg/kg) (vivo morpholino, Gene Tools, LLC) every other day, five times, once the size of the xenograft (n = 8 per group) reached approximately 5 x 5mm (length x width). All xenografts were transplanted in both the right and left dorsal flanks of mice. Tumor growth was monitored via bioluminescence imaging (IVIS spectrum, XENOGEN). Mice were killed at the end of the study by being placed in a carbon dioxide chamber.
Other Methods
Colony formation, transwell migration, comet, TUNEL, and Luciferase reporter assays, immunostaining, flow cytometry, Metacore analysis, ChIP immunoprecipitation and sequencing, western blotting, quantitative real-time polymerase chain reaction (PCR), overexpression analyses, cell proliferation, and gene knockdown analyses are described in detail in the Supplementary Materials (available online).
Statistical Methods
Statistical analyses of microarray data were computed with R (http://www.R-project.org) in combination with PostgreSQL database (http://www.postgresql.org) for data storage and retrieval. NASTRp-derived top differentially expressed genes were selected with a fold change of at least 2 and a P value of .05 or better as calculated with a two-sided Mann-Whitney/Wilcoxon test. E2F8 siRNA-derived top differentially expressed genes were selected with a fold change of at least 1.75. Survival was analyzed using the Kaplan-Meier method and compared by the log-rank test. The Cox proportional hazards assumption was examined by including time dependent covariables in the model (http://kmplot.com/analysis). Group differences were analyzed by the Student’s t test and expressed as mean ± SD. All statistical tests were two-sided.
Results
E2F Pathway Regulation by NASTRp, an Analog of NASEp, Inhibitor of CREB-CBP Interaction
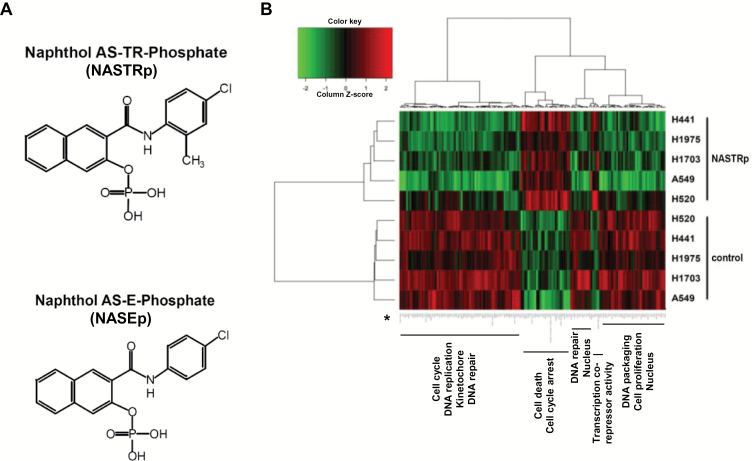
Previously, we found that NASTRp inhibited cell growth and lung tumor development of LC cells in vitro and in vivo (unpublished data). To evaluate the global effects of NASTRp (Figure 1A), we performed a microarray analysis on five LC cell lines including three lung adenocarcinoma (LUAD; A549, H1975, and H441) and two squamous cell carcinoma (LUSC; H1703 and H520). The overall pattern of genes affected by NASTRp is shown in a heat map (Figure 1B) and the list of genes (indicated by the asterisk in the heatmap) is given in Supplementary Table 1 (available online). From DAVID analysis, cell cycle– and cell proliferation–related genes were downregulated while cell death and cell cycle arrest-related genes were upregulated (Supplementary Table 2, available online).
Figure 1.
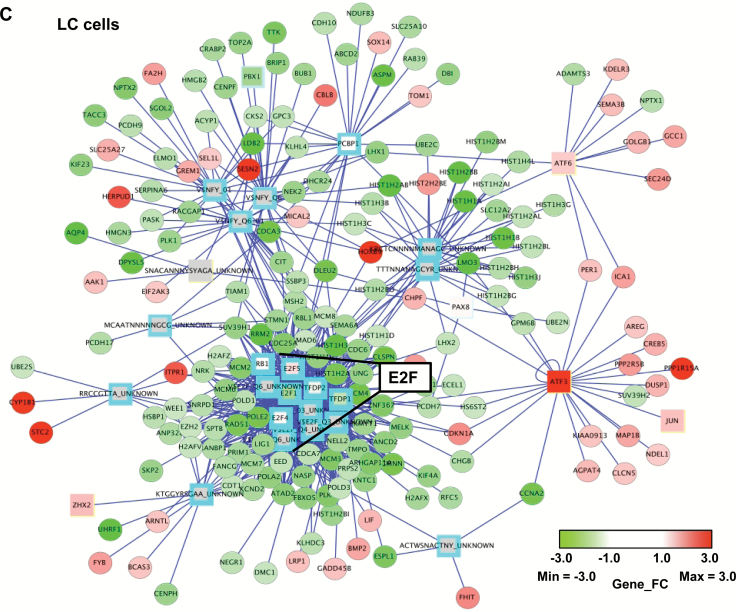
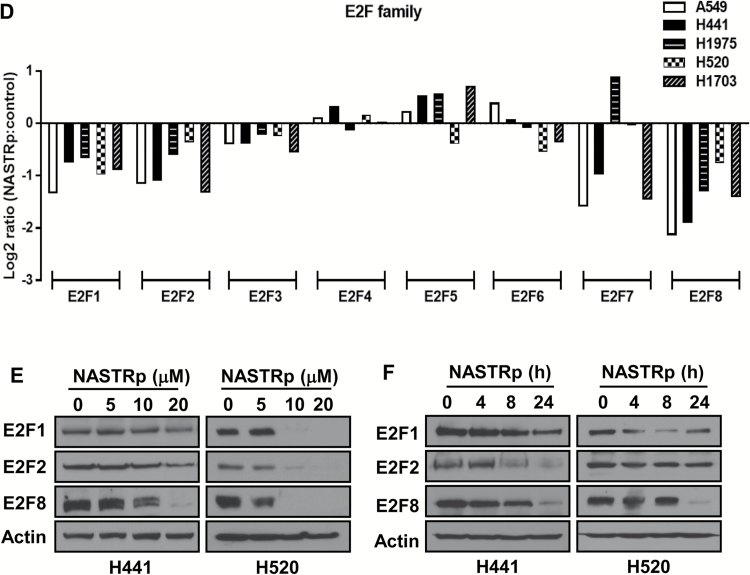
Effects of NASTRp on the E2F-related pathways. A) Chemical structures of NASTRp and NASEp. B) Heatmap of the genes regulated by NASTRp treatment at 10 μM for 24 hours in each indicated lung cancer cell line. Red: upregulated genes, green: downregulated genes. Fold change ≥ 2, P < .05. C) Whole network representing transcription factors and their targets affected by NASTRp. The center of the node for transcription factors (squares) and the whole node for target genes (circles) reflect the fold change in expression from the microarray analysis. Red: upregulated genes, green: downregulated genes, cyan border: negative enrichment in the transcription factor targets, yellow (SNACANNNYSYAGA_UNKNOWN, ZHX2, ATF6, ATF3, and JUN): positive enrichment. FC = fold change. D) Effect of NASTRp-mediated expression changes in each E2F family member in five lung cancer cell lines. Y-axis = ratio of expression values (Log 2) of NASTRp-treated vs vehicle-treated cells. X-axis = the individual genes in each cell line. E-F) Expression of E2F1, E2F2, and E2F8 by NASTRp treatment in (E) a dose-dependent (0, 5, 10, or 20 μM; 48 hours) and (F) a time-dependent manner (0, 4, 8, or 24 hours; 20 μM) in H441 and H520 cells. LC = lung cancer.
Using GSEA, we found that E2F transcription factor gene sets were mainly affected by NASTRp (Supplementary Table 3, available online). E2F transcription factors and their pathways were highly enriched in the overall transcription factor network perturbed by NASTRp (Figure 1C; Supplementary Figure 1, available online). From the microarray data, mRNA levels of E2F1, E2F2, and E2F8 were markedly downregulated by NASTRp in all cell lines we tested (Figure 1D). Also, protein levels of E2F1, E2F2, and E2F8 were downregulated by NASTRp in a dose (Figure 1E) or time (Figure 1F)-dependent manner.
Expression of E2F Family Members in LC Cells
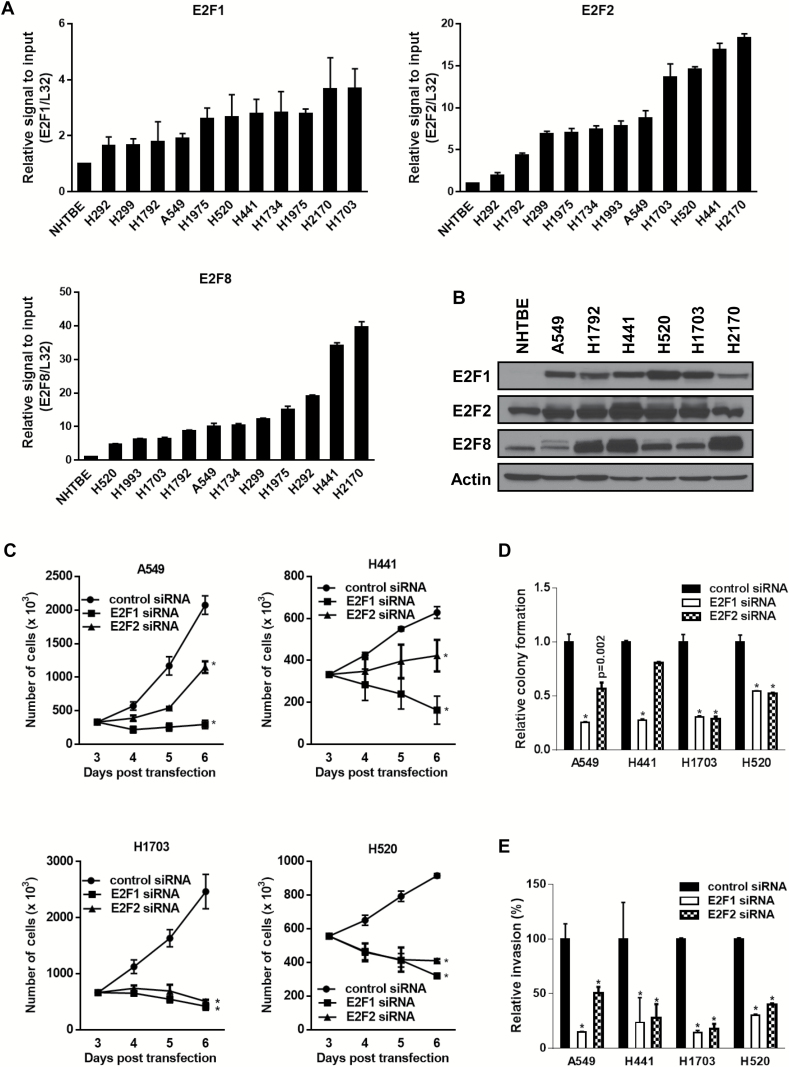
There is evidence that activators E2Fs, E2F1, and E2F2 are overexpressed in LC (25–27). However, the expression of E2F8, a repressor E2F, in LC has not been previously examined. We found that E2F family members E2F1, E2F2, and E2F8 were overexpressed in LC cells compared with normal human lung tracheobronchial epithelial cells (Figure 2A and 2B).
Figure 2.
The role of E2F1 or E2F2 in lung cancer (LC) cell growth. A) The mRNA levels of E2F1, E2F2, and E2F8 in multiple LC cell lines compared with normal human lung tracheobronchial epithelial (NHTBE) cells. Expression was quantitated by quantitative polymerase chain reaction (qPCR). Mean ± SD of three independent experiments. B) Protein levels of E2F1, E2F2, and E2F8 in LC cell lines compared with NHTBE cells. C) Effect of E2F1 or E2F2 knockdown on LC cell growth. The cells transiently transfected with indicated siRNA (40nM each) were stained with trypan blue, and the number of viable cells was counted at the indicated days. All values in the graphs represent mean ± SD of three independent experiments. Two-sided t test. *P < .001. D) Effect of E2F1 or E2F2 knockdown on colony formation. Two days after knockdown of each gene (40nM each), the cells were seeded again in six wells with low density (2 x 10³/ well) and incubated for seven to 14 days. Mean ± SD in three independent experiments. Two-sided t test. *P < .001. E) Effect of E2F1 or E2F2 knockdown on cell invasion. Three days after knockdown of each gene (40nM each), the cells were transferred into transwell inserts containing matrigel-coated membranes and assessed 24 hours after incubation. Mean ± SD in three independent experiments. Two-sided t test. *P < .001.
To determine the relative importance of E2F family members in LC cell survival, we examined the effect of E2F1 or E2F2 depletion on the cell growth of LC cells. The knockdown of E2F1 led to decreased cell numbers with time (number of cells [x103], mean ± SD; A549, control siRNA vs E2F1 siRNA: 2,075±138 vs 297±63 at day 6 after transfection, respectively, two-sided t test, *P < .001) (Figure 2C), lower colony formation (relative colony formation, mean ± SD; A549, control siRNA vs E2F1 siRNA: 1±0.076 vs 0.255±0.008, respectively, two-sided t test, *P < .001) (Figure 2D), and invasive activity of the cells (relative invasion [%], mean ± SD; A549, control siRNA vs E2F1 siRNA: 100±13.993 vs 14.677±0.663, respectively, two-sided t test, *P < .001) (Figure 2E). Although the effect of E2F2 knockdown on cell proliferation looked rather weak compared with the effect of E2F1 knockdown, it led to reduced cell proliferation in most cell lines.
E2F8 and LC Cell Survival
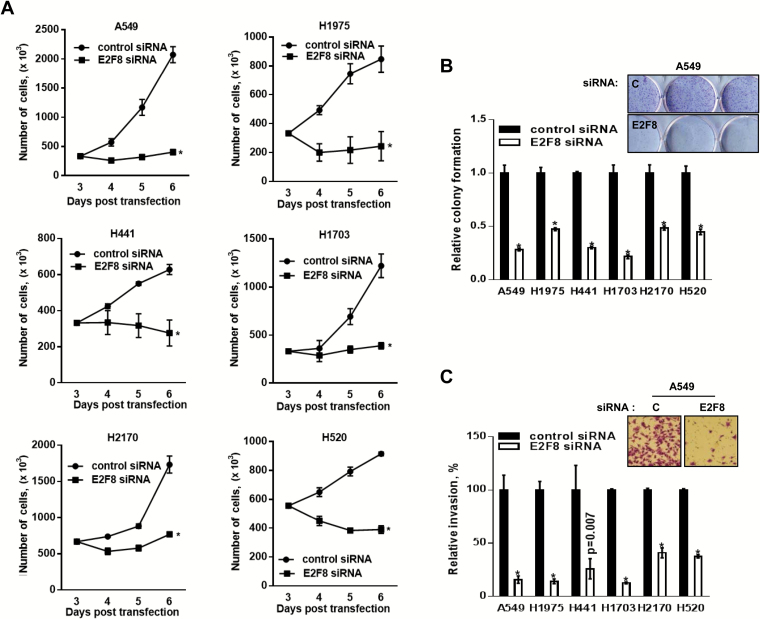
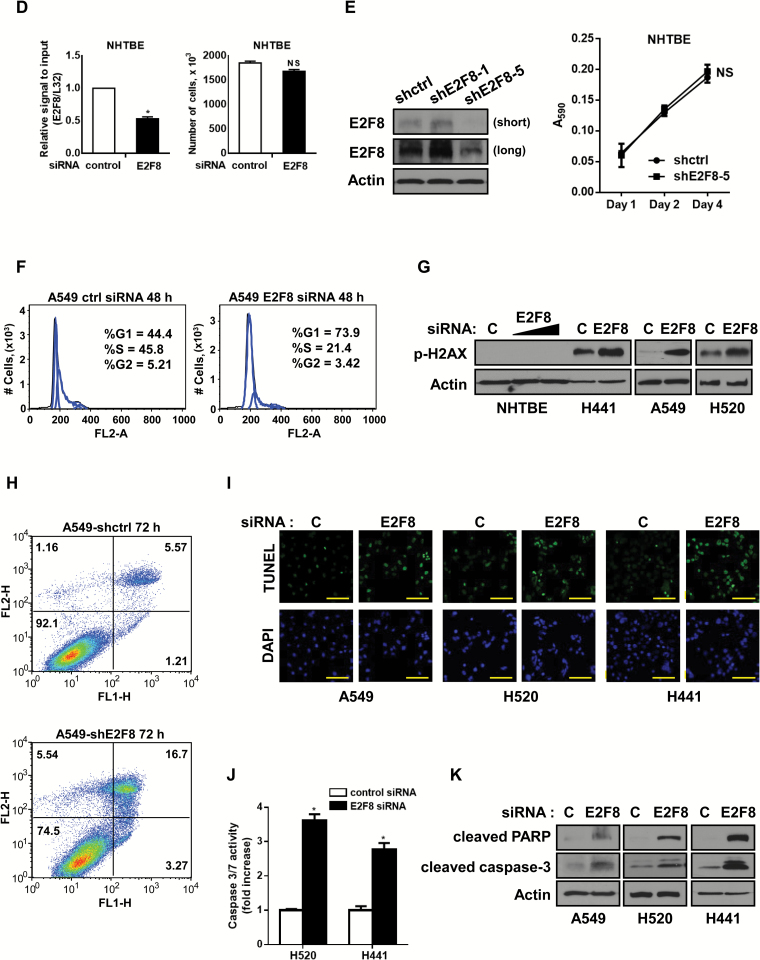
We found that the expression of E2F8 is elevated in LC cells. Surprisingly, knockdown of E2F8 resulted in a statistically significant decrease in the viability of all LC cell lines we tested (Figure 3A). Moreover, siE2F8 led to reduced colony formation (Figure 3B; Supplementary Figure 5, A and B, available online) and invasion abilities (Figure 3C) of the cells. To confirm whether E2F8 affects cell proliferation, we stably overexpressed E2F8 in transformed 1198 cells, one of the in vitro lung carcinogenesis model (IVLCM) cell lines (28,29), and A549 cells. The cells stably expressing E2F8 proliferated more rapidly than its control cells (Supplementary Figure 6, A-D, available online). Importantly, E2F8 knockdown had little effect on the viability of normal lung epithelial cells (Figure 3, D and E). Also, E2F8 depletion caused increased cell growth in normal lung fibroblasts (Supplementary Figure 5C, available online), which supported previous reports that ectopic expression of E2F8 suppressed cell growth in normal fibroblasts (20,21). The validation of siRNAs was performed by qPCR and western blot analysis (Supplementary Figure 2, available online).
Figure 3.
Effects of E2F8 knockdown on the survival of lung cancer (LC) cells. A) Effect of E2F8 knockdown on cell growth. LC cell lines (A549, H441, H1975, H2170, H1703, and H520) transiently transfected with control siRNA, or E2F8 siRNA (40nM each) were stained with trypan blue, and the number of viable cells was counted at the indicated days. All values in the graphs represent mean ± SD of three independent experiments. Two-sided t test. *P < .001. B) Effect of E2F8 knockdown on colony formation. Two days after knockdown of E2F8, the cells were seeded again in 6-wells with low density (2 x 10³/ well) and incubated for seven to 14 days. Mean ± SD in three independent experiments. Two-sided t test. *P < .001. Inset: The representative images of colonogenic assay are from the A549 cells transfected with control siRNA or E2F8 siRNA (40nM each). C) Effect of E2F8 knockdown on cell invasion. Three days after knockdown of E2F8, the cells were transferred into transwell inserts containing matrigel-coated membranes and assessed 24 hours after incubation. Mean ± SD in three independent experiments. Two-sided t test. *P < .001. Inset: The representative images of transwell invasion assay are from the A549 cells transfected with control siRNA or E2F8 siRNA (40nM each). D-E) Effect of E2F8 knockdown on the cell growth in normal human lung tracheobronchial epithelial (NHTBE) cells. D) Relative mRNA level of E2F8 after NHTBE cells were transfected with control siRNA or E2F8 siRNA (50nM each) (left) and its effect on cell viability after 72 hours incubation (right). All values in the graphs represent mean ± SD of three independent experiments. Two-sided t test. *P < .001. E) The level of protein expression of E2F8 after NHTBE cells were transfected with lentiviral shRNAs (left; short exposure/long exposure) and its effect on cell proliferation at each day after 24 hours of seeding (right). All values in the graphs represent mean ± SD of three independent experiments. Two-sided t test. NS = non-significance. F) Effect of E2F8 knockdown on cell cycle progression. A549 cells were transfected with control siRNA or E2F8 siRNA (20nM) for 48 hours. The cells were stained with propidium iodide and analyzed by flow cytometry. Percentage of cells in each phase of the cell cycle represent the corresponding histograms. G) Effect of E2F8 knockdown on the phosphorylation of H2AX (Ser139) in NHTBE and LC cells. The cells were transfected with control siRNA or E2F8 siRNA (10 or 40nM) for 48 hours and subjected to western blot analysis. H) Effect of E2F8 depletion on the cell death as assessed by flow cytometry. Representative dot plot of Annexin V (x-axis) vs propidium iodide (y-axis) analyses of A549-shctrl (top) and A549-shE2F8 (bottom) cells. I) Effect of E2F8 knockdown on the cell death in terminal deoxynucleotidyl transferase dUTP nick end labeling (TUNEL) assay. Indicated cells were transfected with control siRNA or E2F8 siRNA (40nM) for 72 hours, and then the assay was performed. Representative images of three different experiments are shown. Scale bar = 100 μm. J) Effects of E2F8 knockdown on caspase 3/7 activity and (K) expression of cleaved PARP or cleaved caspase-3. Indicated cells were transfected with control siRNA or E2F8 siRNA (40nM each) for 48 hours and then subjected to each assay. Two-sided t test. *P < .001. NHTBE = normal human lung tracheobronchial epithelial.
To test whether E2F8 plays a role in cell cycle progression in LC cells, we performed flow cytometry using siRNA or lentiviral shRNA. There was a substantial cell cycle arrest at the G1/S phase by 48 hours after siE2F8 treatment (Figure 3F) more than by 24 hours treatment (Supplementary Figure 3A, available online). The effect of E2F8 knockdown on cell cycle arrest was also confirmed using cells stably transduced with E2F8 shRNA (Supplementary Figure 3B, available online). Interestingly, E2F8 depletion induced DNA damage as indicated by increased expression of p-H2AX (Ser139), a marker for double-strand breaks, in LC cells but not in normal NHTBE cells (Figure 3G; Supplementary Figure 4A, available online). Furthermore, DNA breaks in response to siE2F8 were confirmed by an alkaline comet assay (Supplementary Figure 4B, available online). Increased cell death occurred in A549 cells treated with shE2F8 relative to its control cells as assessed by flow cytometry with Annexin V staining (Figure 3H). After siE2F8 transfection, there was a statistically significant increase in the level of TUNEL staining (Figure 3I) and caspase-3/7 activity in LC cells (relative fold increase, mean ± SD; control siRNA vs E2F8 siRNA: 1±0.035 vs 3.623±0.176 in H520, 1±0.119 vs 2.778±0.18 in H441, respectively, two-sided t test, *P < .001) (Figure 3J). We observed an increase in cleaved PARP and cleaved caspase-3 expression in E2F8-depleted cells (Figure 3K). Taken together, our data clearly indicate that E2F8, while not necessary for normal cells, is essential for the growth of LC cells.
E2F8 Expression in LC and as a Prognostic Factor
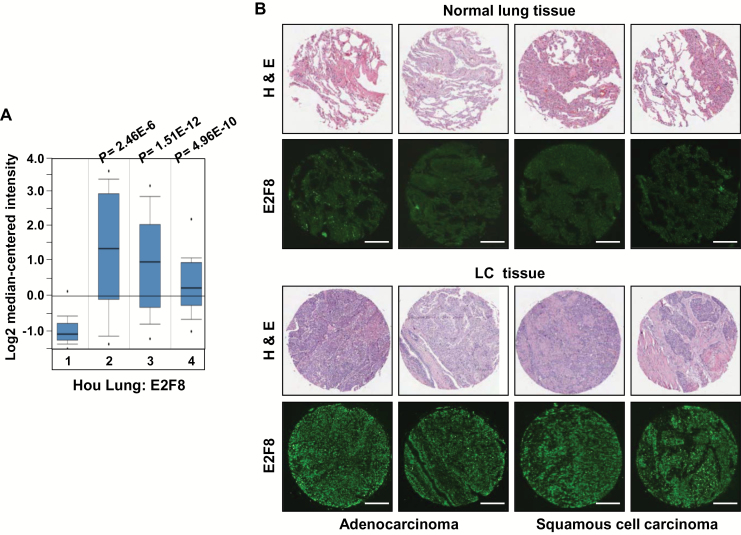
To determine the clinical relevance of E2F8 expression in human LC, we used the Oncomine database. Compared with normal tissues, our analysis revealed an elevated E2F8 expression in large cell lung carcinoma (n = 19, fold change = 4.707, P < .001), LUAD (n = 45, fold change = 3.659, P < .001), and LUSC (n = 27, fold change = 2.48, P < .001) (Figure 4A). E2F8 expression was also elevated in the early stages of LC (Supplementary Figure 7A, available online). Using the cancer cell line encyclopedia (CCLE) database (30), we found that E2F8 is expressed across a wide spectrum of cancer cells (Supplementary Figure 7B, available online). Immunofluorescence staining in human LC tissue microarray revealed that E2F8 is highly overexpressed in LUAD and LUSC tissues compared with normal lung tissues (Figure 4B).
Figure 4.
Effects of E2F8 overexpression on lung cancer (LC) prognosis. A) Association of E2F8 mRNA levels with lung tumor subtype. The identified and normalized (by ONCOMINE; www. oncomine.org) data from Hou et al. (61) was used for the analysis of the E2F8 expression. Group 1: adjacent normal lung (n = 65), 2: large cell lung carcinoma (n = 19), 3: lung adenocarcinoma (n = 45), 4: squamous cell lung carcinoma (n = 27). The 25th to 75th percentiles are indicated by a closed box, with the median indicated by a line; different degrees of outliers are indicated by the whiskers and the points, as defined for standard boxplots. B) Representative immunostains for E2F8 expression in normal and LC tissues. Samples from human LC tissue microarray containing normal, adenocarcinoma, and squamous cell carcinoma tissues were examined by immunofluorescence staining with an anti-E2F8 antibody. Each hematoxylin and eosin image was provided by US Biomax Inc. Scale bar = 200 μm. C) Kaplan-Meier analysis (http://kmplot.com/analysis) of overall survival by low or high E2F8 (E2F8 probe set 219990_s_at) expression in 1197 LC patients with adjuvant treatment. Overall survival analysis of the patients was performed by using Cox proportional hazard models and follow-up data for seven years after surgery. D) Patients (n = 171) without adjuvant treatment were separated by high vs low E2F8 expression and analyzed for overall survival. E) Overall survival curves for the lung adenocarcinoma patients (n = 414) and (F) squamous cell carcinoma patients (n = 109, GSE4573) with tumors expressing the high and low E2F8 level. All plots were analyzed in combined 10 data sets (CARRAY: n = 462, GSE14814: n = 90, GSE19188: n = 156, GSE29013: n = 55, GSE31210: n = 246, GSE3141: n = 110, GSE37745: n = 196, GSE4573: n = 130, GSE8894: n = 138, and TCGA: n = 133). H&E = hematoxylin and eosin; HR = hazard ratio; LC = lung cancer.
Overexpression of E2F8 mRNA was associated with worse overall survival of LC patients (E2F8 low vs high expression patients: hazard ratio [HR] of survival = 1.29, 95% confidence interval [CI] = 1.1 to 1.51, P = .0016) (Figure 4C). Interestingly, E2F8 mRNA levels were more strongly associated with worse overall survival of LC patients who did not receive any adjuvant therapy (E2F8 low vs high expression patients: HR of survival = 1.91, 95% CI = 1.21 to 3.01, P = .0047) (Figure 4D). Positive E2F8 expression was statistically significantly associated with shorter survival time of patients with LUAD (E2F8 low vs high expression patients: HR of survival = 1.53, 95% CI = 1.13 to 2.07, P = .0056) (Figure 4E) and LUSC (E2F8 low vs high expression patients: HR of survival = 1.67, 95% CI = 0.99 to 2.82, P = .051) (Figure 4F) histology types. Our results on clinical tumor samples demonstrate that aberrant activation of E2F8 is associated with mortality of LC patients.
Gene Signatures in LC Cells Following E2F8 Knockdown
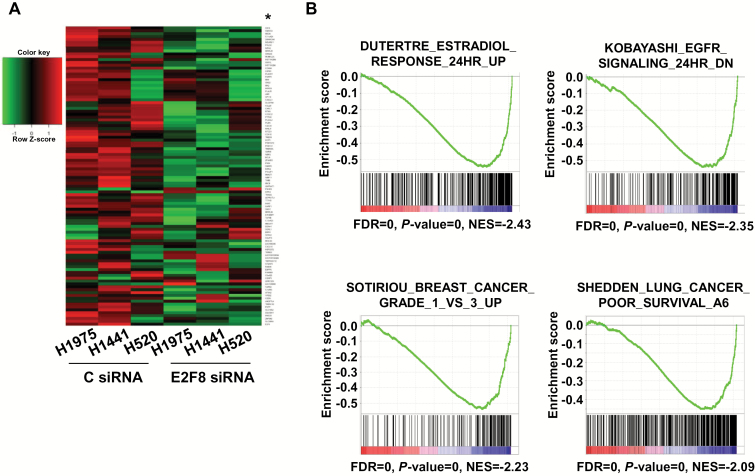
To gain insight into the role of E2F8 in LC cell growth, we examined genes perturbed by E2F8 knockdown. Genes with down- or upregulation greater than 1.75-fold in at least two of three cell lines are shown in Figure 5A, and the list of genes (indicated by the asterisk) is in Supplementary Table 5 (available online). Using GSEA, we examined gene sets altered by siE2F8 and the representative gene sets are shown in Figure 5B. DAVID (Figure 5C). MetaCore analysis (Supplementary Table 6, available online) revealed that knockdown of E2F8-deregulated gene sets involved in regulation of transcription, cancer progression, chromatin organization, regulation of immune system, glutamate receptor signaling, or cell surface receptor signaling. Among the top-down or upregulated genes by siE2F8, we confirmed the expression level of selected genes using qPCR (Figure 5D; Supplementary Figure 9, available online). Next, we examined whether there were overlaps between E2F1 targets and our genes deregulated by E2F8 knockdown using version 3.0 of the GSEA TFT targets. As shown in Supplementary Figure 10 and Supplementary Table 7 (available online), the Venn diagrams indicate that only a few genes overlap between E2F1 targets and E2F8-associated genes, suggesting that E2F8 regulates its target gene E2F1 independently, at least in LC cells.
Figure 5.
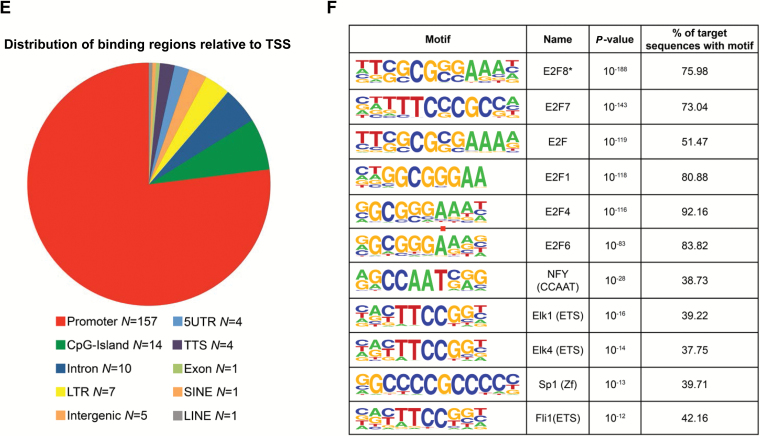
Genes that are deregulated by E2F8 knockdown in lung cancer (LC) cells. A) Heatmap of genes deregulated in E2F8-depleted LC cells. Microarray analysis was performed on three LC cell lines (H1975, H441, and H520) after the cells were transfected with control siRNA or E2F8 siRNA (40nM each) for 24 hour. Genes up or downregulated more than 1.75-fold in two of three cell lines are shown. B) The four overlapping gene set enrichment analysis (GSEA) profiles (from top 20) are shown. GSEA plots of each gene set are downregulated in the siE2F8 group compared with sicontrol group. FDR = false discovery rate; NES = normalized enrichment score. C) Enriched gene ontology (GO) pathways generated by DAVID overrepresentation analysis in E2F8 knockdown group. Representative pathways were selected from the top 30. P values are shown only for the top GO pathways. GO = gene ontology. D) LC cells were treated with control siRNA or E2F8 siRNA (40nM each) for 48 hours and quantitative polymerase chain reaction (qPCR) analysis was performed to measure the mRNA level of the representative genes (E2F8, UHRF1, POM121, NDUFB11, HAX1, EIF4EBP1, HIST2H2AB, and HIST1H2BM). All values in the graphs represent mean ± SD of three independent experiments. Two-sided t test. *P < .001. E-F) Identification of E2F8-bound motif. E) Distribution of the 204 ChIP-seq peaks revealed by E2F8 were categorized based on their location as promoter, CpG-island, intron, long terminal repeat (LTR), intergenic, 5’ untranslated region (5UTR), transcription terminal site (TTS), exon, short interspersed elements (SINE), and long interspersed elements (LINE). F) Most highly represented motif found by HOMER software with its de Novo algorithm (*), and the top 10 results of HOMER search through a library of known motifs. The identified motifs are sorted according to their P values. Letter size indicates frequency.
In order to characterize genome-wide E2F8 binding sites in the resting status, ChIP-sequencing was conducted using H441 cells, which contain high levels of endogenous E2F8. Two independent ChIP experiments were performed and statistically significant binding regions, which had at least 2-fold more normalized DNA sequence tags than in input or IgG control were identified (E2F8-1 vs IgG; n = 2328, E2F8-2 vs IgG; n = 1414, E2F8-1 vs input; n = 2120, and E2F8-2 vs input; n = 1285; n = number of binding sites). A set of 204 binding regions overlapped among all four comparisons (Supplementary Table 8, available online). Figure 5E shows the genome-wide distribution of 204 binding sites in relation to the transcriptional start site, indicating that E2F8 mostly localizes to the promoter of the genes. Also, Figure 5F shows DNA recognition sequences and statistical significance for the most highly represented E2F8-binding motif (*) and top-hit transcription factors. Taken together, these data suggest that E2F8 binds to the promoter and regulates gene transcription, acting as a novel transcription activator in LC.
UHRF1 as a Potential Target Gene of E2F8
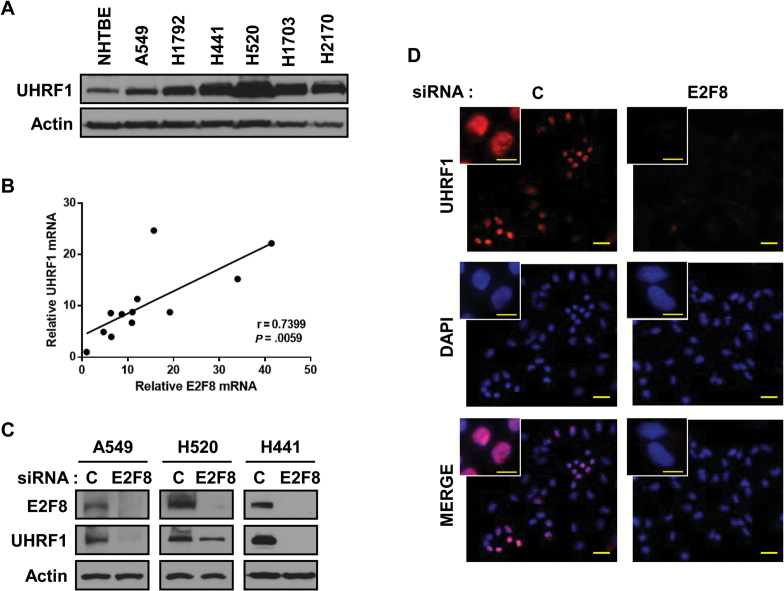
From the microarray data, UHRF1 was one of the top downregulated genes by siE2F8. Compared with other cyclins, the level of UHRF1 was substantially decreased by E2F8 (Supplementary Figure 8, available online). UHRF1 expression was increased in LC cells (Figure 6A), resulting in a statistically significant correlation between mRNA levels of E2F8 and UHRF1 (Figure 6B). E2F8 knockdown statistically significantly reduced the expression of UHRF1 (~60%-70%, P < .001). Suppression of UHRF1 expression by siE2F8 was confirmed using immunoblotting and immunofluorescence staining (Figure 6, C and D).
Figure 6.
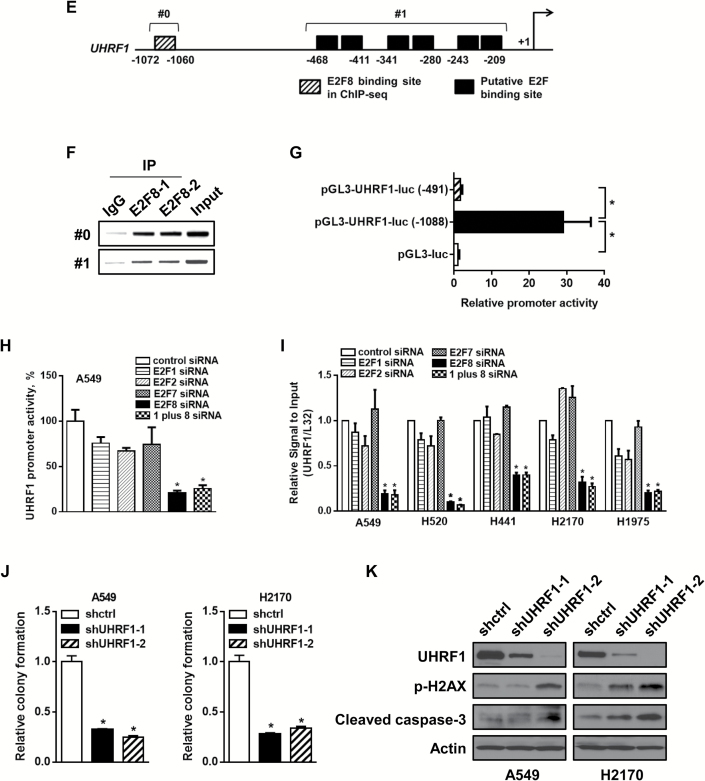
Effects of E2F8 on the regulation of UHRF1 expression. A) The level of UHRF1 in lung cancer (LC) cells compared with normal human lung tracheobronchial epithelial (NHTBE) cells. The protein expression of UHRF1 was performed by western blot analysis. B) Correlation of mRNA levels between E2F8 and UHRF1 in each individual LC cell line. R = correlation coefficient. C) Effect of E2F8 knockdown on the expression of UHRF1. Each of the indicated cell lines was transfected with control siRNA or E2F8 siRNA (40nM each) for 72 hours, followed by western blot analysis. D) Immunofluorescence staining of UHRF1 in A549 cells after 72 hours of transfection with control siRNA or E2F8 siRNA (40nM each). Representative images are shown. Scale bar = 100 μm. Inset bar = 20 μm. E) Schematic diagram showing the positions of putative E2F binding elements located in the gene promoter of human UHRF1 (http://www.genomatix.de), and the specific element corresponds to the region identified by ChIP sequencing. #0: the region for primers which covers the E2F8 binding element, #1: the region for primers which covers putative E2F binding elements. Primer sequences are in Supplementary Table 4 (available online). F) Direct binding of E2F8 on the UHRF1 promoter. ChIP assay was done with chromatins prepared from H441 cells. The binding of E2F8 to the UHRF1 promoter was detected by visualization of the polymerase chain reaction (PCR) product. The single bands detected in input samples indicate the specificity of the PCR primers. G) Relative UHRF1 promoter activity with different UHRF1-luciferease constructs. 293T cells were transfected with pGL3-UHRF1-luc (-1088), which includes all elements in Figure 6E, or pGL3-UHRF1-luc (-491), which lacks the region identified by ChIP sequencing, and cultured for two days. Luciferase activity was measured and normalized by Renilla activity. pGL3-luciferase construct was used as a negative control. Two-sided t test. *P < .001. H-I) Relative UHRF1 promoter activity and expression affected by each indicated siRNA in LC cells. The cells were transfected with indicated siRNAs (40nM each) for 48 hours, followed by (H) luciferase reporter assay or (I) quantitative PCR (qPCR) analysis. All values in the graphs represent mean ± SD of three independent experiments. Two-sided t test. *P < .001. J) Effect of UHRF1 knockdown on colony formation. Each of the cells were seeded in 12 wells with low density (1 x 10³/ well) and incubated for seven days. The cells were fixed with 10% formalin and stained with crystal violet (left) and the colonies extracted with 10% acetic acid and quantitated (right). K) Each of the cells was subjected to western blot analysis to confirm the expression levels of UHRF1, p-H2AX, and cleaved caspase-3.
We noticed that the UHRF1 promoter contained several putative E2F binding sites, including our ChIP sequencing–based E2F8 binding sites (Figure 6E). ChIP-PCR results involved primer set (#0), which covers nucleotides from -1072 to -1060 corresponding to the region identified by ChIP sequencing, and primer set (#1), which covers putative E2F BS, showed a strong binding of E2F8 on the UHRF1 promoter (Figure 6F). However, deletion of the ChIP sequencing region (#0) shows that there is basically no effect on the UHRF1 promoter activity and this data suggests that the specific E2F8 binding site (#0) plays a critical role in the regulation of UHRF1 expression (Figure 6G). Surprisingly, promoter activity (Figure 6H) and the expression of UHRF1 (Figure 6I) were both dominantly downregulated by siE2F8. Moreover, there was no additive effect on the knockdown of UHRF1 expression in the cells transfected with combined siRNAs of E2F1 and E2F8, suggesting that E2F8 directly regulates UHRF1 independently of E2F1.
We also found that UHRF1 deletion caused suppressed colony formation (Figure 6J) and increased expression of p-H2AX and cleaved caspase-3 (Figure 6K), and these results support the fact that UHRF1 contributes to the apoptotic effect of E2F8 knockdown.
E2F8 and Tumor Growth
Having established that E2F8 influences tumorigenicity in LC, we addressed its role in tumor growth using subcutaneous injections of control or E2F8-depleted cells. As shown in Figure 7, there was a statistically significant suppression in tumor growth (tumor volume [mm3], mean ± SD; control siRNA vs E2F8 siRNA-1 vs E2F8 siRNA-2: 547.44±195.945 vs 23.036±39.346 vs 8.186±21.657 on day 28, respectively, two-sided t test. *P < .001) (Figure 7, A and B) and mass (tumor mass [mg], mean ± SD; control siRNA vs E2F8 siRNA-1 vs E2F8 siRNA-2: 273.529±15.873 vs 12.414±21.578 vs 9.429±24.946 on day 28, respectively, two-sided t test. *P < .001) (Figure 7C) of the xenografts derived from E2F8-depleted cells compared with control cells.
Figure 7.
Effects of E2F8-deficient cells on the capability of tumor growth in vivo. A) Representative images of xenografts derived from control siRNA, E2F8 siRNA-1, or E2F8 siRNA-2–treated H520 cells. After 24 hours of siRNA transfection (40nM each), the cells were inoculated subcutaneously into the right and left side dorsal flanks of female nude mice (xenograft n = 7/group). B) Tumor volume and C) mass of xenografts derived from control or E2F8-knockdowned H520 cells were evaluated. Tumor volume was measured with digital calipers and calculated by the formula 0.52 x length x width2 and tumor mass was evaluated at four weeks after injection. Two-sided t test. *P < .001.
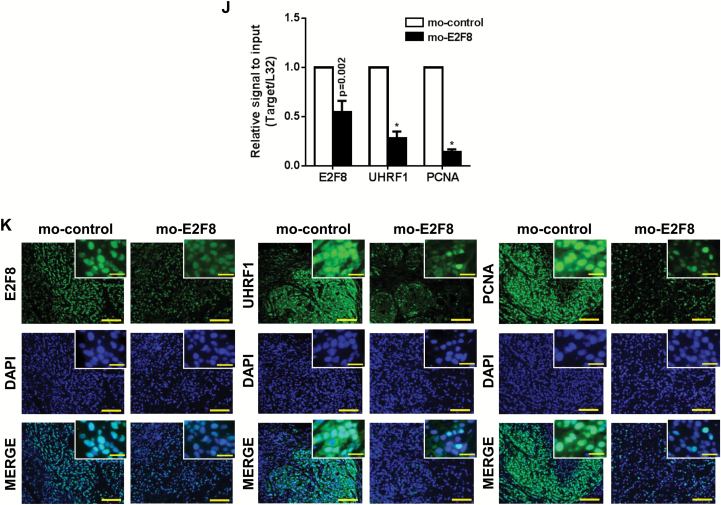
To further determine the role of E2F8 in tumor growth, we developed a unique morpholino E2F8 (mo-E2F8) that blocks expression of E2F8 in vivo (Figure 8A) (31). The treatment suppressed the expression of E2F8 and UHRF1 (Figure 8B) decreasing cell viability (cell viability [%], mean ± SD; mo-control (10 μM) vs mo-E2F8 (5 μM) vs mo-E2F8 (10 μM): 100±10.74 vs 49.20±3.1 vs 20. 73±0.73, respectively, two-sided t test. *P < .001) (Figure 8, C and D). However, the same amount of mo-E2F8 had no effect on the survival and growth of normal NHTBE cells (Figure 8, E and F).
Figure 8.
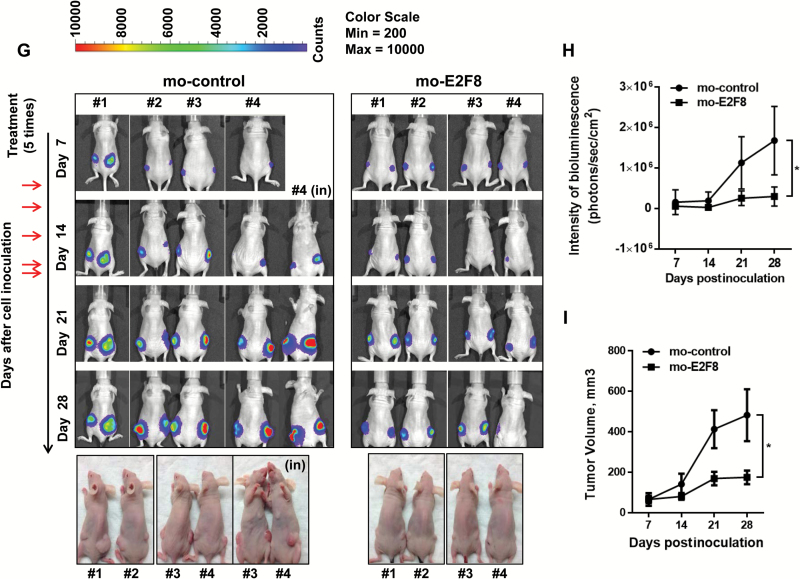
Effects of E2F8 antisense morpholino on the tumor growth in vivo. A) Oligo sequence of mo-E2F8 as a translation blocker. B) The validation of mo-E2F8 on the expression of E2F8 and UHRF1 in A549 and A549-luc cells. The cells were treated with mo-control (10 μM) or mo-E2F8 (1, 5, or 10 μM) for 72 hours and performed by western blot analysis. C-D) Effects of mo-E2F8 on cancer cell growth. A549-luc cells were treated with mo-control (10 μM) or mo-E2F8 (5 or 10 μM) for 72 hours. C) Representative images were captured. Scale bar = 100 μm. D) A549-luc cells treated with mo-control or mo-E2F8 for 72 hours were subjected to MTT assay. All values in the graphs represent mean ± SD of three independent experiments. Two-sided t test. *P < .001. E-F) Effects of mo-E2F8 on the normal human lung tracheobronchial epithelial (NHTBE) cell growth. NHTBE cells were treated with mo-control (5 or 10 μM) or mo-E2F8 (5 or 10 μM) for 72 hours. E) Representative images were captured. Scale bar = 100 μm. F) NHTBE cells treated with mo-control or mo-E2F8 for 72 hours were stained with trypan blue, and the number of viable cells was counted. All values in the graphs represent mean ± SD of three independent experiments. G) A549-luc cells were inoculated subcutaneously into the right and left side dorsal flanks of female nude mice (xenograft n = 8/group). Once the size of the xenograft reached approximately 5 x 5mm (length x width), mice were intraperitoneally injected with mo-control or mo-E2F8. Each morpholino was treated at day 7, 10, 12, 14, and day 17 after cell inoculation. Bioluminescence images of A549-luc xenografts were captured at day 7, 14, 21, and day 28 after cell inoculation. H) Bioluminescent intensity of tumors and (I) volume of xenografts derived from mo-control or mo-E2F8-treated mice. All values in the graphs represent mean ± SD of three independent experiments. Two-sided t test. *P < .001. J) Effect of mo-E2F8 on the mRNA levels of E2F8, UHRF1, and PCNA in vivo was analyzed by quantitative polymerase chain reaction (qPCR) analysis. All values in the graphs represent mean ± SD of three independent experiments. Two-sided t test. *P < .001. K) Representative immunofluorescence images of E2F8, UHRF1, and PCNA in tumors derived from mo-control or mo-E2F8-treated mice. Scale bar = 100 μm. Inset bar = 20 μm. NHTBE = normal human lung tracheobronchial epithelial.
Mice treated with mo-E2F8 showed statistically significantly suppressed/delayed tumor growth compared with control-treated mice (intensity of bioluminescence, mean ± SD; mo-control vs mo-E2F8: 1.68e+06 vs 2.98e+05 photons/sec/cm2 at day 28 after cell inoculation, respectively, two-sided t test. *P < .001) (Figure 8, G and H). Tumor volume further supported the suppressed tumor burden because of E2F8 knockdown (tumor volume [mm3], mean ± SD; mo-control vs mo-E2F8: 482.751±128.382 vs 175.357±33.846 at day 28 after cell inoculation, respectively, two-sided t test. *P < .001) (Figure 8I). Also, there was a decrease in mRNA levels (E2F8, 45.2%, P = .002; UHRF1, 72%, P < .001; PCNA, 86%, P < .001) (Figure 8J) and expression (Figure 8K) of E2F8, UHRF1, and PCNA in tumors derived from mo-E2F8-treated mice. These data clearly demonstrate that E2F8 is critical for the progression of tumors in vivo.
Discussion
Our study reveals novel roles of E2F8 as a proto-oncogenic transcription activator and as a novel prognostic biomarker in LC. E2F8 has been shown to be a suppressive regulator of cell cycle as a transcription repressor of the expression of E2F1 and E2F2 that regulate Rb-E2F–dependent cell cycle progression. In contrast, the current study shows that E2F8 supports proliferation and survival of LC cells and is required for tumor development. E2F8 is overexpressed in LC cells and lung tumors, and its overexpression seems to be associated with a worse prognosis of patients with adenocarcinoma and squamous cell carcinoma in the lung.
Members of the E2F transcription factor family have been shown to be deregulated in human cancers (12). Particularly, E2F activators which include E2F1-E2F3 were upregulated in several cancers (27,32–35). There is some evidence that E2F8, a repressor member, might also be associated with human cancers. An increase in gene copy number of E2F8 was detected in melanoma (36), and increased expression was reported in ovarian cancer (33) and hepatocellular carcinoma (37). Knockdown of E2F8 caused an almost complete blockade of cell proliferation and induction of substantial apoptosis, while it did not suppress the growth of normal bronchial epithelial cells. These results indicate that while E2F8 does not serve a role in normal cells, it plays an integral role as a tumor promoter in cancer cells.
To better understand the direct role of E2F8 in carcinogenesis, we profiled genes perturbed by knockdown of E2F8. Among them, we directed our focus to UHRF1 because of its dramatic downregulation by siE2F8. UHRF1 is overexpressed in several cancers (38–41) and binds to hemi-methylated DNA sequences in order to recruit the main DNA methyltransferase gene, DNMT1, and then regulates chromatin structure and gene expression (42–44). Recently, it was shown that its overexpression drives DNA hypomethylation in hepatocellular carcinoma as an oncogene (45). UHRF1 has been described as a target gene of E2F1 (46). However, our results showed that UHRF1 expression was regulated by E2F8, not by other E2Fs.
Unlike a previous report that E2F7/8 function as transcriptional repressors (47), our study clearly demonstrates that E2F8 is an activator of transcription of UHRF1. Although it remains unclear how E2F8, which lacks a transactivation domain, regulates UHRF1 gene expression, there is increasing evidence for a similar activator role for E2F7/8. E2F8 binds and activates the cyclin D1 promoter in a dominant-negative manner through blocking of other E2Fs (37). E2F7/E2F8 was shown to directly bind to and stimulate the VEGFA promoter by cooperating with HIF1 (24). Our ChIP-sequencing analysis revealed that E2F8 strongly binds to the promoter of UHRF1, and the identified sequence works to activate the promoter showing the possibility that E2F8 binds and regulates its target genes including UHRF1.
Targeting transcription factors is generally thought to be a more difficult task than targeting kinases. Currently, there are no clinically effective drugs or compounds that are specific for blocking expression or activity of E2F8. Interestingly, we found that NASTRp, a small molecule naphthol analog identified as an inhibitor of CREB-CBP/p300 interaction, dramatically downregulated E2F8 expression and it markedly suppressed the growth of several LC cell lines (unpublished data). We are still investigating the mechanisms by which this class of compounds modulates E2F8 expression and the anticancer effects on the growth of cancer cells.
In the meantime, the tumorigenic role of E2F8 was verified with two different methods using siRNAs or specific morpholino antisense oligonucleotides (mo-E2F8) for targeted inhibition of E2F8 expression in xenograft models. Antisense morpholinos were broadly used to efficiently suppress expression of genes in cultured cells (48–50), zebrafish (24,51–53), and mice (54–60). Recently, morpholinos of E2F7 and E2F8 were used to examine the role of those E2Fs in embryonic angiogenesis in mice (24). Our mo-E2F8 showed effective inhibition of tumor development and clearly demonstrated E2F8 as a therapeutic target for LC treatment.
This study also had some limitations. Although the mice did not show any obvious toxicity treated with mo-E2F8, detailed pharmacokinetics and pharmacodynamics were not completed in the current study. Thus, further studies should be conducted to determine the complete and subtle toxicities of targeting E2F8 as a treatment method for lung cancer.
The therapeutic potential of E2F8 inhibition is further facilitated by its impact on UHRF1 inhibition. The observations that E2F8 expression plays a causal role in survival of LC patients and E2F8 expression is already high at an early stage in patients suggest that E2F8 could be useful as a prognostic biomarker in LC. Further studies examining mechanisms up or downstream of E2F8 in cancer will be essential for determining the therapeutic applicability of E2F8 inhibitors. In conclusion, we propose that E2F8 functions as a novel E2F activator in cancer, which will set the foundation for E2F8 as a promising therapeutic target for lung cancer.
Funding
This work was supported by National Cancer Institute grant R01-CA126801 (to Ja Seok Koo) and, in part, 5R01CA155196 (to Roy S. Herbst) and by National Cancer Institute Cancer Center Support Grant CA-16359 (to Yale Cancer Center).
Supplementary Material
All other authors declare no conflicts of interest. The authors are solely responsible for the study design, data collection, analysis and interpretation of data, writing the manuscript, and the decision to submit the manuscript for publication.
References
- 1. Engelman JA, Janne PA. Mechanisms of acquired resistance to epidermal growth factor receptor tyrosine kinase inhibitors in non-small cell lung cancer. Clin Cancer Res. 2008;14(10):2895–2899. [DOI] [PubMed] [Google Scholar]
- 2. Kobayashi S, Boggon TJ, Dayaram T, et al. EGFR mutation and resistance of non-small-cell lung cancer to gefitinib. N Engl J Med. 2005;352(8):786–792. [DOI] [PubMed] [Google Scholar]
- 3. Jackman DM, Miller VA, Cioffredi LA, et al. Impact of epidermal growth factor receptor and KRAS mutations on clinical outcomes in previously untreated non-small cell lung cancer patients: results of an online tumor registry of clinical trials. Clin Cancer Res. 2009;15(16):5267–5273. [DOI] [PMC free article] [PubMed] [Google Scholar]
- 4. Herbst RS, Heymach JV, Lippman SM. Lung cancer. N Engl J Med. 2008;359(13):1367–1380. [DOI] [PMC free article] [PubMed] [Google Scholar]
- 5. Best JL, Amezcua CA, Mayr B, et al. Identification of small-molecule antagonists that inhibit an activator: coactivator interaction. Proc Natl Acad Sci U S A. 2004;101(51):17622–17627. [DOI] [PMC free article] [PubMed] [Google Scholar]
- 6. Sun H, Chung WC, Ryu SH, et al. Cyclic AMP-responsive element binding protein- and nuclear factor-kappaB-regulated CXC chemokine gene expression in lung carcinogenesis. Cancer Prev Res (Phila). 2008;1(5):316–328. [DOI] [PMC free article] [PubMed] [Google Scholar]
- 7. Sakamoto KM, Frank DA. CREB in the pathophysiology of cancer: implications for targeting transcription factors for cancer therapy. Clin Cancer Res. 2009;15(8):2583–2587. [DOI] [PMC free article] [PubMed] [Google Scholar]
- 8. Conkright MD, Guzman E, Flechner L, et al. Genome-wide analysis of CREB target genes reveals a core promoter requirement for cAMP responsiveness. Mol Cell. 2003;11(4):1101–1108. [DOI] [PubMed] [Google Scholar]
- 9. Xiao X, Li BX, Mitton B, et al. Targeting CREB for cancer therapy: friend or foe. Curr Cancer Drug Targets. 2010;10(4):384–391. [DOI] [PMC free article] [PubMed] [Google Scholar]
- 10. Zhang X, Odom DT, Koo SH, et al. Genome-wide analysis of cAMP-response element binding protein occupancy, phosphorylation, and target gene activation in human tissues. Proc Natl Acad Sci U S A. 2005;102(12):4459–4464. [DOI] [PMC free article] [PubMed] [Google Scholar]
- 11. DeGregori J, Johnson DG. Distinct and Overlapping Roles for E2F Family Members in Transcription, Proliferation and Apoptosis. Curr Mol Med. 2006;6(7):739–748. [DOI] [PubMed] [Google Scholar]
- 12. Chen HZ, Tsai SY, Leone G. Emerging roles of E2Fs in cancer: an exit from cell cycle control. Nat Rev Cancer. 2009;9(11):785–797. [DOI] [PMC free article] [PubMed] [Google Scholar]
- 13. Miller ES, Berman SD, Yuan TL, et al. Disruption of calvarial ossification in E2f4 mutant embryos correlates with increased proliferation and progenitor cell populations. Cell Cycle. 2010;9(13):2620–2628. [DOI] [PMC free article] [PubMed] [Google Scholar]
- 14. Zhang J, Lee EY, Liu Y, et al. pRB and E2F4 play distinct cell-intrinsic roles in fetal erythropoiesis. Cell Cycle. 2010;9(2):371–376. [DOI] [PMC free article] [PubMed] [Google Scholar]
- 15. Danielian PS, Bender Kim CF, Caron AM, et al. E2f4 is required for normal development of the airway epithelium. Dev Biol. 2007;305(2):564–576. [DOI] [PMC free article] [PubMed] [Google Scholar]
- 16. Endo-Munoz L, Dahler A, Teakle N, et al. E2F7 can regulate proliferation, differentiation, and apoptotic responses in human keratinocytes: implications for cutaneous squamous cell carcinoma formation. Cancer Res. 2009;69(5):1800–1808. [DOI] [PubMed] [Google Scholar]
- 17. Hazar-Rethinam M, Merida de Long L, Gannon OM, et al. A Novel E2F/Sphingosine Kinase 1 Axis Regulates Anthracycline Response in Squamous Cell Carcinoma. Clin Cancer Res. 2014;21(2):417–427. [DOI] [PubMed] [Google Scholar]
- 18. Zalmas LP, Coutts AS, Helleday T, et al. E2F-7 couples DNA damage-dependent transcription with the DNA repair process. Cell Cycle. 2013;12(18):3037–3051. [DOI] [PMC free article] [PubMed] [Google Scholar]
- 19. Zalmas LP, Zhao X, Graham AL, et al. DNA-damage response control of E2F7 and E2F8. EMBO Rep. 2008;9(3):252–259. [DOI] [PMC free article] [PubMed] [Google Scholar]
- 20. Christensen J, Cloos P, Toftegaard U, et al. Characterization of E2F8, a novel E2F-like cell-cycle regulated repressor of E2F-activated transcription. Nucleic Acids Res. 2005;33(17):5458–5470. [DOI] [PMC free article] [PubMed] [Google Scholar]
- 21. Maiti B, Li J, de Bruin A, et al. Cloning and characterization of mouse E2F8, a novel mammalian E2F family member capable of blocking cellular proliferation. J Biol Chem. 2005;280(18):18211–18220. [DOI] [PubMed] [Google Scholar]
- 22. Li J, Ran C, Li E, et al. Synergistic function of E2F7 and E2F8 is essential for cell survival and embryonic development. Dev Cell. 2008;14(1):62–75. [DOI] [PMC free article] [PubMed] [Google Scholar]
- 23. Ouseph MM, Li J, Chen HZ, et al. Atypical E2F repressors and activators coordinate placental development. Dev Cell. 2012;22(4):849–862. [DOI] [PMC free article] [PubMed] [Google Scholar]
- 24. Weijts BG, Bakker WJ, Cornelissen PW, et al. E2F7 and E2F8 promote angiogenesis through transcriptional activation of VEGFA in cooperation with HIF1. EMBO J. 2012;31(19):3871–3884. [DOI] [PMC free article] [PubMed] [Google Scholar]
- 25. Eymin B, Gazzeri S, Brambilla C, et al. Distinct pattern of E2F1 expression in human lung tumours: E2F1 is upregulated in small cell lung carcinoma. Oncogene. 2001;20(14):1678–1687. [DOI] [PubMed] [Google Scholar]
- 26. Coe BP, Lockwood WW, Girard L, et al. Differential disruption of cell cycle pathways in small cell and non-small cell lung cancer. Br J Cancer. 2006;94(12):1927–1935. [DOI] [PMC free article] [PubMed] [Google Scholar]
- 27. Huang CL, Liu D, Nakano J, et al. E2F1 overexpression correlates with thymidylate synthase and survivin gene expressions and tumor proliferation in non small-cell lung cancer. Clin Cancer Res. 2007;13(23):6938–6946. [DOI] [PubMed] [Google Scholar]
- 28. Klein-Szanto AJ, Iizasa T, Momiki S, et al. A tobacco-specific N-nitrosamine or cigarette smoke condensate causes neoplastic transformation of xenotransplanted human bronchial epithelial cells. Proc Natl Acad Sci U S A. 1992;89(15):6693–6697. [DOI] [PMC free article] [PubMed] [Google Scholar]
- 29. Chun KH, Kosmeder, Sun S, et al. Effects of deguelin on the phosphatidylinositol 3-kinase/Akt pathway and apoptosis in premalignant human bronchial epithelial cells. J Natl Cancer Inst. 2003;95(4):291–302. [DOI] [PubMed] [Google Scholar]
- 30. Barretina J, Caponigro G, Stransky N, et al. The Cancer Cell Line Encyclopedia enables predictive modelling of anticancer drug sensitivity. Nature. 2012;483(7391):603–607. [DOI] [PMC free article] [PubMed] [Google Scholar]
- 31. Summerton JE. Morpholino, siRNA, and S-DNA compared: impact of structure and mechanism of action on off-target effects and sequence specificity. Curr Top Med Chem. 2007;7(7):651–660. [DOI] [PubMed] [Google Scholar]
- 32. Imai MA, Oda Y, Oda M, et al. Overexpression of E2F1 associated with LOH at RB locus and hyperphosphorylation of RB in non-small cell lung carcinoma. J Cancer Res Clin Oncol. 2004;130(6):320–326. [DOI] [PubMed] [Google Scholar]
- 33. Reimer D, Sadr S, Wiedemair A, et al. Clinical relevance of E2F family members in ovarian cancer--an evaluation in a training set of 77 patients. Clin Cancer Res. 2007;13(1):144–151. [DOI] [PubMed] [Google Scholar]
- 34. Feber A, Clark J, Goodwin G, et al. Amplification and overexpression of E2F3 in human bladder cancer. Oncogene. 2004;23(8):1627–1630. [DOI] [PubMed] [Google Scholar]
- 35. Wu L, de Bruin A, Wang H, et al. Selective roles of E2Fs for ErbB2- and Myc-mediated mammary tumorigenesis. Oncogene. 2015;34(1):119–128. [DOI] [PMC free article] [PubMed] [Google Scholar]
- 36. Parisi F, Ariyan S, Narayan D, et al. Detecting copy number status and uncovering subclonal markers in heterogeneous tumor biopsies. BMC Genomics. 2011;12:230. [DOI] [PMC free article] [PubMed] [Google Scholar]
- 37. Deng Q, Wang Q, Zong WY, et al. E2F8 contributes to human hepatocellular carcinoma via regulating cell proliferation. Cancer Res. 2010;70(2):782–791. [DOI] [PubMed] [Google Scholar]
- 38. Unoki M, Kelly JD, Neal DE, et al. UHRF1 is a novel molecular marker for diagnosis and the prognosis of bladder cancer. Br J Cancer. 2009;101(1):98–105. [DOI] [PMC free article] [PubMed] [Google Scholar]
- 39. Jin W, Chen L, Chen Y, et al. UHRF1 is associated with epigenetic silencing of BRCA1 in sporadic breast cancer. Breast Cancer Res Treat. 2010;123(2):359–373. [DOI] [PubMed] [Google Scholar]
- 40. Sabatino L, Fucci A, Pancione M, et al. UHRF1 coordinates peroxisome proliferator activated receptor gamma (PPARG) epigenetic silencing and mediates colorectal cancer progression. Oncogene. 2012;31(49):5061–5072. [DOI] [PubMed] [Google Scholar]
- 41. Unoki M, Daigo Y, Koinuma J, et al. UHRF1 is a novel diagnostic marker of lung cancer. Br J Cancer. 2010;103(2):217–222. [DOI] [PMC free article] [PubMed] [Google Scholar]
- 42. Probst AV, Dunleavy E, Almouzni G. Epigenetic inheritance during the cell cycle. Nat Rev Mol Cell Biol. 2009;10(3):192–206. [DOI] [PubMed] [Google Scholar]
- 43. Bostick M, Kim JK, Esteve PO, et al. UHRF1 plays a role in maintaining DNA methylation in mammalian cells. Science. 2007;317(5845):1760–1764. [DOI] [PubMed] [Google Scholar]
- 44. Arita K, Ariyoshi M, Tochio H, et al. Recognition of hemi-methylated DNA by the SRA protein UHRF1 by a base-flipping mechanism. Nature. 2008;455(7214):818–821. [DOI] [PubMed] [Google Scholar]
- 45. Mudbhary R, Hoshida Y, Chernyavskaya Y, et al. UHRF1 overexpression drives DNA hypomethylation and hepatocellular carcinoma. Cancer Cell. 2014;25(2):196–209. [DOI] [PMC free article] [PubMed] [Google Scholar]
- 46. Unoki M, Nishidate T, Nakamura Y. ICBP90, an E2F-1 target, recruits HDAC1 and binds to methyl-CpG through its SRA domain. Oncogene. 2004;23(46):7601–7610. [DOI] [PubMed] [Google Scholar]
- 47. Lammens T, Li J, Leone G, et al. Atypical E2Fs: new players in the E2F transcription factor family. Trends Cell Biol. 2009;19(3):111–118. [DOI] [PMC free article] [PubMed] [Google Scholar]
- 48. Laetsch TW, Liu X, Vu A, et al. Multiple components of the spliceosome regulate Mcl1 activity in neuroblastoma. Cell Death Dis. 2014;5:e1072. [DOI] [PMC free article] [PubMed] [Google Scholar]
- 49. Radan L, Hughes CS, Teichroeb JH, et al. Microenvironmental regulation of telomerase isoforms in human embryonic stem cells. Stem Cells Dev. 2014;23(17):2046–2066. [DOI] [PMC free article] [PubMed] [Google Scholar]
- 50. Tsonis PA, Haynes T, Maki N, et al. Controlling gene loss of function in newts with emphasis on lens regeneration. Nat Protoc. 2011;6(5):593–599. [DOI] [PubMed] [Google Scholar]
- 51. Goetz JG, Steed E, Ferreira RR, et al. Endothelial cilia mediate low flow sensing during zebrafish vascular development. Cell Rep. 2014;6(5):799–808. [DOI] [PubMed] [Google Scholar]
- 52. Hughes CE, Radhakrishnan UP, Lordkipanidze M, et al. G6f-like is an ITAM-containing collagen receptor in thrombocytes. PLoS One. 2012;7(12):e52622. [DOI] [PMC free article] [PubMed] [Google Scholar]
- 53. Kizil C, Kyritsis N, Dudczig S, et al. Regenerative neurogenesis from neural progenitor cells requires injury-induced expression of Gata3. Dev Cell. 2012;23(6):1230–1237. [DOI] [PubMed] [Google Scholar]
- 54. Lee TK, Cheung VC, Lu P, et al. Blockade of CD47-mediated cathepsin S/protease-activated receptor 2 signaling provides a therapeutic target for hepatocellular carcinoma. Hepatology. 2014;60(1):179–191. [DOI] [PubMed] [Google Scholar]
- 55. Silvestre DC, Gil GA, Tomasini N, et al. Growth of peripheral and central nervous system tumors is supported by cytoplasmic c-Fos in humans and mice. PLoS One. 2010;5(3):e9544. [DOI] [PMC free article] [PubMed] [Google Scholar]
- 56. Soto-Pantoja DR, Ridnour LA, Wink DA, et al. Blockade of CD47 increases survival of mice exposed to lethal total body irradiation. Sci Rep. 2013;3:1038. [DOI] [PMC free article] [PubMed] [Google Scholar]
- 57. Maxhimer JB, Soto-Pantoja DR, Ridnour LA, et al. Radioprotection in normal tissue and delayed tumor growth by blockade of CD47 signaling. Sci Transl Med. 2009;1(3):3ra7. [DOI] [PMC free article] [PubMed] [Google Scholar]
- 58. Osorio FG, Navarro CL, Cadinanos J, et al. Splicing-directed therapy in a new mouse model of human accelerated aging. Sci Transl Med. 2011;3(106):106ra107. [DOI] [PubMed] [Google Scholar]
- 59. Velu CS, Chaubey A, Phelan JD, et al. Therapeutic antagonists of microRNAs deplete leukemia-initiating cell activity. J Clin Invest. 2014;124(1):222–236. [DOI] [PMC free article] [PubMed] [Google Scholar]
- 60. Glaser S, Meng F, Han Y, et al. Secretin stimulates biliary cell proliferation by regulating expression of microRNA 125b and microRNA let7a in mice. Gastroenterology. 2014;146(7):1795–1808 e1712. [DOI] [PMC free article] [PubMed] [Google Scholar]
- 61. Hou J, Aerts J, den Hamer B, et al. Gene expression-based classification of non-small cell lung carcinomas and survival prediction. PLoS One. 2010;5(4):e10312. [DOI] [PMC free article] [PubMed] [Google Scholar]
Associated Data
This section collects any data citations, data availability statements, or supplementary materials included in this article.


