

Abstract
Objective:
To determine whether higher adherence to a Mediterranean-type diet (MeDi) is related with larger MRI-measured brain volume or cortical thickness.
Methods:
In this cross-sectional study, high-resolution structural MRI was collected on 674 elderly (mean age 80.1 years) adults without dementia who participated in a community-based, multiethnic cohort. Dietary information was collected via a food frequency questionnaire. Total brain volume (TBV), total gray matter volume (TGMV), total white matter volume (TWMV), mean cortical thickness (mCT), and regional volume or CT were derived from MRI scans using FreeSurfer program. We examined the association of MeDi (scored as 0–9) and individual food groups with brain volume and thickness using regression models adjusted for age, sex, ethnicity, education, body mass index, diabetes, and cognition.
Results:
Compared to lower MeDi adherence (0–4), higher adherence (5–9) was associated with 13.11 (p = 0.007), 5.00 (p = 0.05), and 6.41 (p = 0.05) milliliter larger TBV, TGMV, and TWMV, respectively. Higher fish (b = 7.06, p = 0.006) and lower meat (b = 8.42, p = 0.002) intakes were associated with larger TGMV. Lower meat intake was also associated with larger TBV (b = 12.20, p = 0.02). Higher fish intake was associated with 0.019 mm (p = 0.03) larger mCT. Volumes of cingulate cortex, parietal lobe, temporal lobe, and hippocampus and CT of the superior-frontal region were associated with the dietary factors.
Conclusions:
Among older adults, MeDi adherence was associated with less brain atrophy, with an effect similar to 5 years of aging. Higher fish and lower meat intake might be the 2 key food elements that contribute to the benefits of MeDi on brain structure.
The Mediterranean diet (MeDi) has been recognized from epidemiologic studies over several different populations worldwide as one of the healthiest diets.1 We have previously showed that adherence to the MeDi was associated with reduced risk of Alzheimer disease (AD)1 and our results have been confirmed in a few populations,2–5 although not in others.6 While population differences in absolute levels of foods/nutrients intake, cultural and socioeconomic aspects, or comorbidity burdens may contribute to the inconsistencies of the findings, subjectivity and heterogeneity in procedures of clinical diagnosis may also play a role. Neuroimaging markers are sensitive measurements of structural changes in the aging brain, allowing us to examine associations between diet and aging-related brain changes that might not be detectable using clinical assessments.7 Thus, it would be interesting to examine the relationship between MeDi and structural neuroimaging markers such as brain atrophy and cortical thickness.8 To our knowledge, only 2 studies have examined this relationship,9,10 which were relatively small, and had little demographic diversity, potentially limiting the extrapolation of their findings.
In the current study, we examined the association between MeDi adherence and structural MRI-assessed brain volume and cortical thickness among elderly participants of a community-based, multiethnic cohort, the Washington Heights/Hamilton Heights Inwood Columbia Aging Project (WHICAP).
METHODS
Study design.
We performed a cross-sectional study to examine the association between MeDi and structural brain measures.
Study participants.
The current study included participants from an ongoing prospective study of aging and dementia (WHICAP) who were identified from a probability sample of elderly Medicare beneficiaries (≥65 years) residing in northern Manhattan.11 The original sample for this study included 2,776 participants. At baseline, a physician obtained each participant's medical and neurologic history, conducted a standardized physical and neurologic examination, and assessed their health and function. Cognitive status was assessed using a neuropsychological battery.12 Participants were followed every 18 months, repeating the baseline examinations. The diagnosis of dementia was based on standard research criteria DSM-III-R,13 using all available information at a consensus conference. The type of dementia was subsequently determined using the criteria of the National Institute of Neurological and Communicative Disorders and Stroke–Alzheimer's Disease and Related Disorders Association for the diagnosis of probable or possible AD,14 and using Petersen15 criteria for the diagnosis of MCI, as described elsewhere.16 Severity of dementia was rated with the Clinical Dementia Rating (CDR) scale.
The imaging substudy was started in 2004 among active dementia-free WHICAP participants.17 Overall, 769 WHICAP participants received MRI scans, and they were slightly younger, and more likely to be African American or male compared to those who were eligible but did not undergo MRI.17 Among them, T1 images were not available for 45 participants. We further excluded 10 participants without diet data and 40 participants who met diagnostic criteria for dementia at the neuroimaging visit. Therefore, in the current analysis we included a total of 674 (88% of 769) participants without dementia.
Standard protocol approvals, registrations, and patient consents.
The Columbia University Institutional Review Board has reviewed and approved this project. All individuals provided written informed consent.
MRI protocol.
Scans were acquired on a 1.5T Philips (Best, the Netherlands) Intera scanner at Columbia University. All the T1 images were analyzed using Freesurfer (V.5.1) (http://surfer.nmr.mgh.harvard.edu/). Freesurfer output underwent visual quality control and manual correction whenever necessary, and then Freesurfer steps were repeated. Regional cortical thicknesses and volumetric measures were obtained in 34 regions of interest (ROI) in each hemisphere through a series of steps including removal of nonbrain tissue using a hybrid watershed/surface deformation procedure,18 followed by automated Talairach transformation, segmentation of the subcortical white matter (WM) and deep gray matter (GM) volumetric structures,19 intensity normalization,20 tessellation of the GM-WM boundary, automated topology correction,21 and surface deformation following intensity gradients to optimally place the gray/white and gray/CSF borders at the location where the greatest shift in intensity defines the transition to the other tissue class.22,23
Volume measures.
We first explored global brain measures such as total brain volume (TBV), total GM volume (TGMV), and total WM volume (TWMV). Individual Desikan-Killiany ROIs were combined into 5 regions (left and right hemispheres summed) for regional cortical volume analysis (https://surfer.nmr.mgh.harvard.edu/fswiki/CorticalParcellation), including frontal (sum of superior frontal; rostral and caudal middle frontal; pars opercularis, pars triangularis, and pars orbitalis; lateral and medial orbitofrontal; precentral; paracentral; frontal pole), parietal (superior parietal; inferior parietal; supramarginal; postcentral; precuneus), temporal (superior, middle, and inferior temporal; banks of the superior temporal sulcus; fusiform; transverse temporal; entorhinal; temporal pole; parahippocampal), occipital (lateral occipital; lingual; cuneus; pericalcarine), and cingulate (rostral anterior; caudal anterior; posterior; isthmus). In addition, 5 regions in the depths of the brain were also analyzed, including hippocampus, caudate, putamen, thalamus, and amygdala.
To adjust for differences in head size across participants, regression models were run with intracranial volume (ICV) as the independent variable and brain volume as the outcome variable, and the regression residuals were then used in the analyses.
Cortical thickness.
We calculated mean cortical thickness (mCT) across all ROIs within each participant. We also selected 12 FreeSurfer CT ROIs (mean of left and right hemispheres) to represent 9 regions that have been shown to reflect AD-associated neurodegeneration,24 including (1) entorhinal cortex and parahippocampus (rostral medial temporal lobe), (2) inferior temporal lobe, (3) temporal pole, (4) inferior parietal lobe (angular gyrus), (5) superior frontal lobe, (6) superior parietal lobe, (7) supramarginal gyrus, (8) precuneus, and (9) pars opercularis, pars orbitalis, and pars triangularis (inferior frontal lobe).25 CT was not adjusted for ICV.
Dietary information.
Information about average diet over the prior year was collected using Willett's semi-quantitative food frequency questionnaire (FFQ) (Channing Laboratory, Cambridge, MA), administered by trained interviewers in English or Spanish. We have previously reported good validity and reliability of various components of the FFQ in WHICAP.26,27
We calculated the MeDi score as described in our previous reports.1 Individuals were assigned a value of 1 for each beneficial food component (including vegetables, legumes, cereals, fish, fruits/nuts, and a ratio of monounsaturated fats to saturated fats [SFA]) if his or her caloric-adjusted consumption of the food was equal to or greater than the sex-specific population median, for each detrimental component (meat and dairy products) if the caloric-adjusted consumption was below the median, and for mild to moderate alcohol consumption (>0 to <30 g/day). The MeDi score (ranging 0–9) was calculated for each participant by summing the scores in the 9 food components, with higher MeDi score indicating closer adherence to the MeDi. The diet data were obtained on average 0.6 (SD = 1.8) years before the MRI scan.
Other information.
We considered continuous variables including age (years), education (years), caloric intake, and body mass index (BMI; kg/m2). Ethnicity, including African American (black non-Hispanic), Hispanic, white (non-Hispanic), or other, based on self-report using the format of the 2000 US census, was used as a dummy variable, with non-Hispanic white as the reference. Sex (female vs male) and APOE genotype (presence of either 1 or 2 vs absence of ε4 alleles) were used as dichotomous variables. Stroke information was self-reported by participants or relatives as well as neurologic examination or medical records review. Presence or absence of heart disease, diabetes mellitus, and hypertension were based on self-report or use of medications. These 4 vascular comorbidities were used as dichotomous variables with absence of the condition used as the reference. Cognition was determined using a neuropsychological battery12 and exploratory factor analysis was used to derive 4 composite scores (memory, language, executive/speed, and visuospatial) based on selected neuropsychological tests scores.12
Statistical analyses.
Characteristics of participants by MeDi adherence and by tertiles of TBV or mCT were compared using t test for continuous variables and χ2 test for categorical variables.
Generalized linear models (GLMs) were used to assess the association between MeDi and brain MRI markers, initially unadjusted (model 1), then adjusted for age at time of scan only (model 2), and then adjusted for age at time of scan, sex, ethnicity, education, BMI, diabetes, and mean cognitive z score (model 3). The variables were selected into model 3 based on their associations with MeDi and brain measures. MeDi score was examined as a continuous variable as well as a dichotomized variable by population median level (i.e., high 5–9 vs low 0–4).
We performed a few supplementary analyses. First, we examined which of the 9 food components (dichotomized) of MeDi might drive the relationship between MeDi and brain measures. Second, we additionally adjusted for APOE genotype, caloric intake, hypertension, heart disease, and stroke in model 3. Third, we examined whether sex, APOE, or ethnicity modified the relationship between MeDi and brain measures. Fourth, we excluded participants with MCI and repeated the analyses on global brain measures among cognitively normal participants only. Finally, we explored regional brain measures in relation to diet using multivariate analysis of variance (MANOVA) to see whether the linear combination of the 10 regional volumes (as described previously) maximally distinguishes the diet groups; in other words, is associated with dietary variables. We then examined univariate F tests for individual ROIs. Any ROI found to be significantly associated with the dietary variables was further examined in adjusted GLMs to estimate its association with diet. A similar analysis was conducted for 12 thickness ROIs. Because individual ROI analyses were guided by the MANOVA results, and were essentially exploratory, no correction for multiple comparisons has been performed.
Statistical analyses were performed using PASW Statistics program (IBM, Chicago, IL). All p values were based on 2-sided tests with the significance level set at 0.05.
RESULTS
Characteristics of the study population.
Participants with lower and higher MeDi adherence were comparable in terms of their demographic and cognitive profiles (table 1). Compared to lower MeDi adherence participants, those with higher adherence had similar mCT, but larger TBV, TGMV, and TWMV (table 1).
Table 1.
Characteristics of the study population
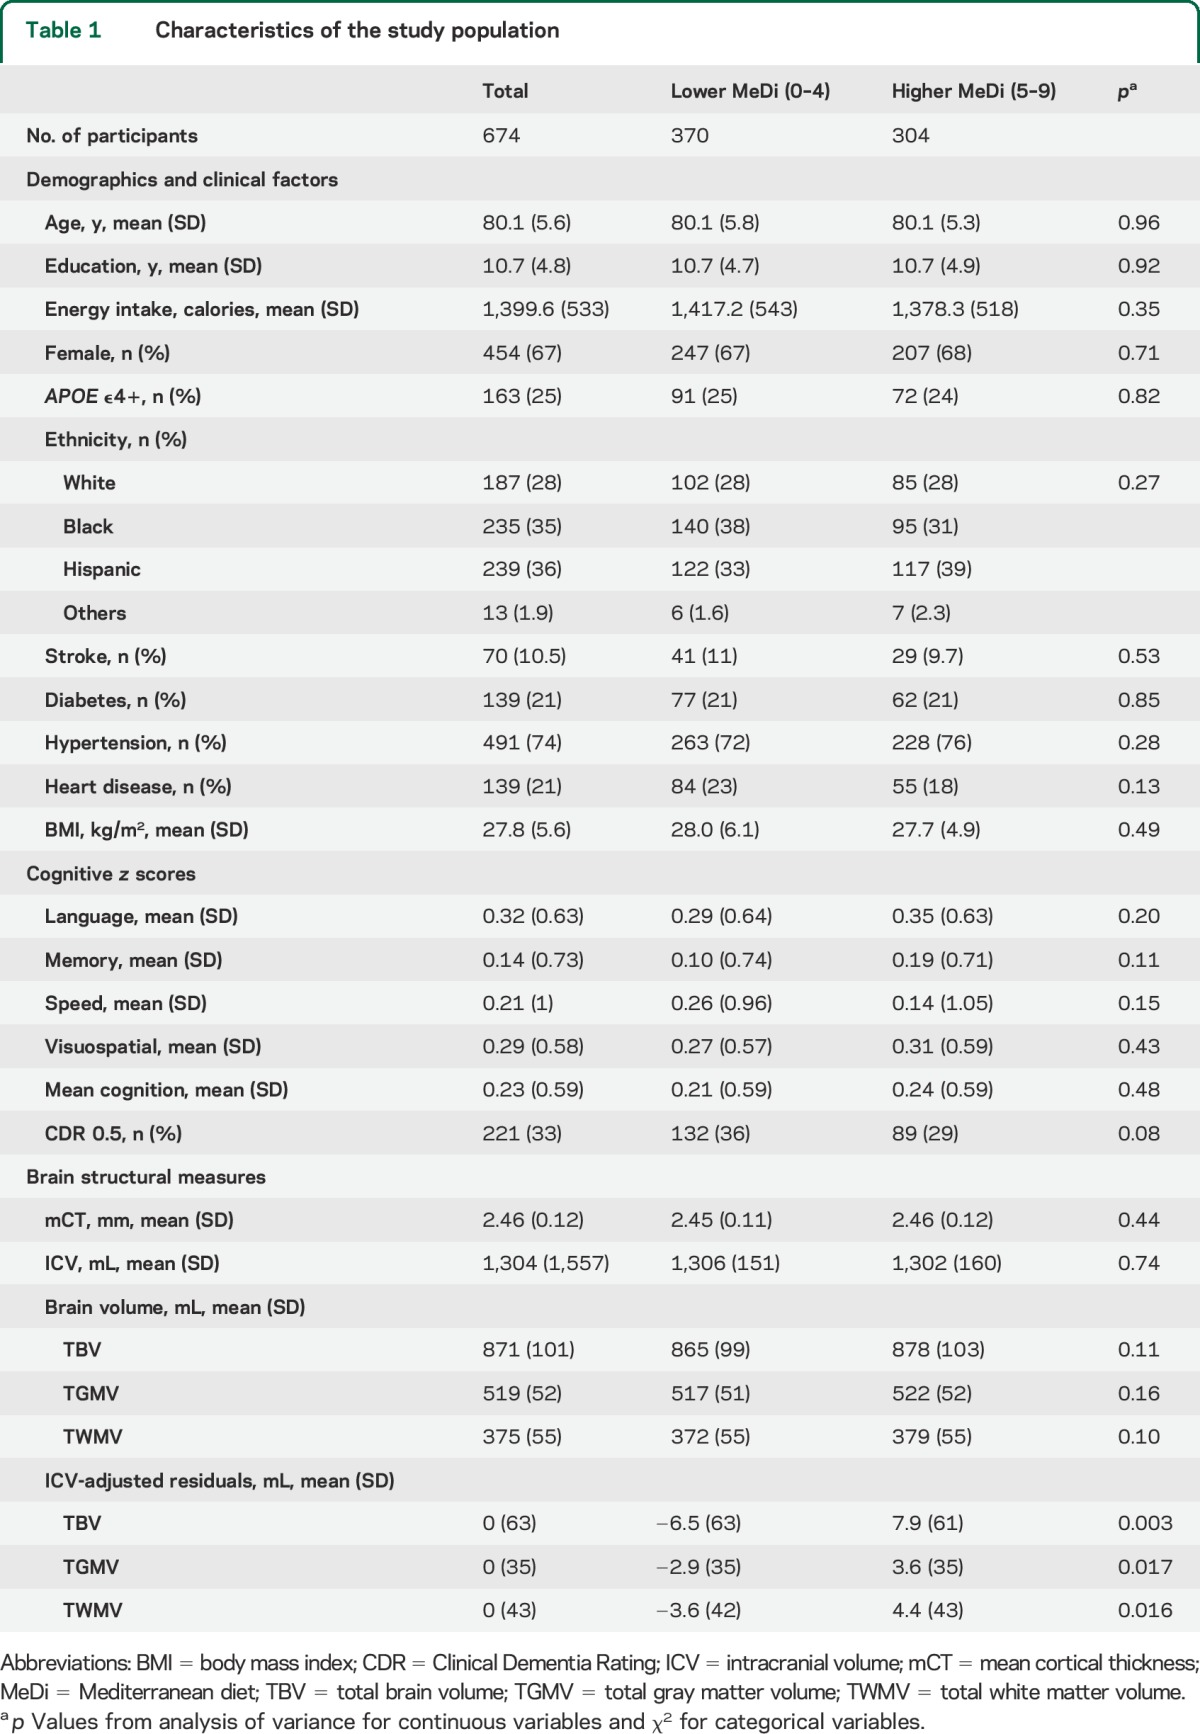
Individuals who had larger TBV tended to be younger, to have higher education, to be male, to be less likely to have diabetes, to have lower BMI, to be less likely to have mild dementia (CDR = 0.5), and to have better cognition in each of the 4 domains. Similar patterns were found for TGMV and TWMV (data not shown), and mCT, except that those with larger mCT were more likely to be female and had higher percentage of Hispanic but lower percentage of black participants (table e-1 on the Neurology® Web site at Neurology.org).
MeDi adherence with global brain MRI markers.
Higher MeDi score was associated with larger TBV, TGMV, and TWMV after adjusting for multiple covariates (table 2 and figure). In the model with dichotomous MeDi and age, 1 year increase in age was associated with 2.62 mL less TBV (p < 0.0001), indicating that the average difference in TBV between the higher and the lower MeDi score (14.43 mL) was about the same magnitude of effect corresponding to the change in TBV during half-decade of aging.
Table 2.
Cross-sectional association between Mediterranean diet and global brain measures
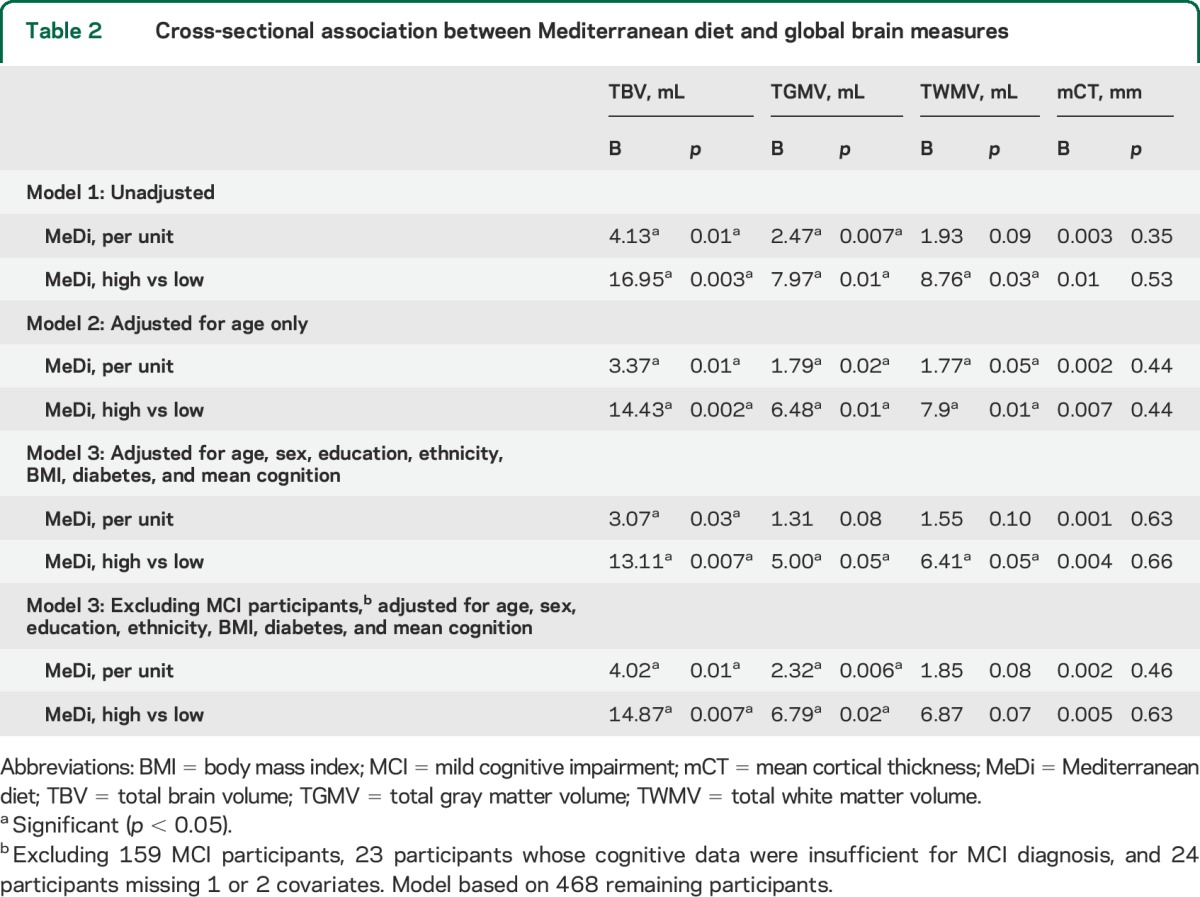
Figure. Association of Mediterranean diet, fish, and meat with brain volume and cortical thickness.
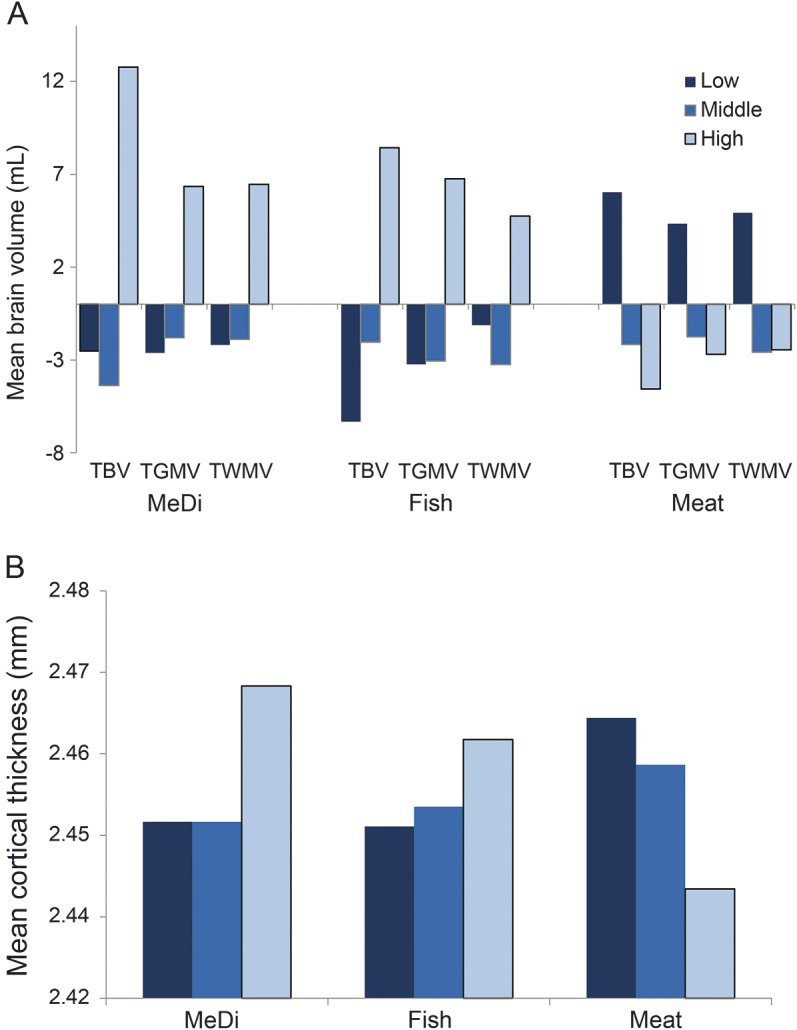
(A) Mean levels (intracranial-adjusted residuals) of total brain volume (TBV), total gray matter volume (TGMV), and total white matter volume (TWMV) among participants with low (score 0–2), middle (score 3–5), and high (score 6–9) levels of adherence to the Mediterranean diet (MeDi), among tertiles of fish consumption (caloric intake adjusted residuals), and among tertiles of meat consumption (caloric intake adjusted residuals). (B) Mean cortical thickness by levels of MeDi, fish, and meat consumption.
Supplementary analyses.
Among the 9 food components of MeDi, higher fish intake, lower meat intake, and moderate alcohol intake were associated with larger brain volumes when adjusted for age. The associations remained significant for fish and meat in multivariable-adjusted models. Higher intake of fish was associated with thicker mCT (table e-2 and figure).
Including additional covariates (see Statistical analyses) did not change the results much (data not shown).
The relationships of MeDi with brain MRI measures were not significantly modified by sex, ethnicity, or APOE ε4 status (data not shown).
MeDi or its components remained associated with brain measures among 478 cognitively normal participants (table 2 and table e-2).
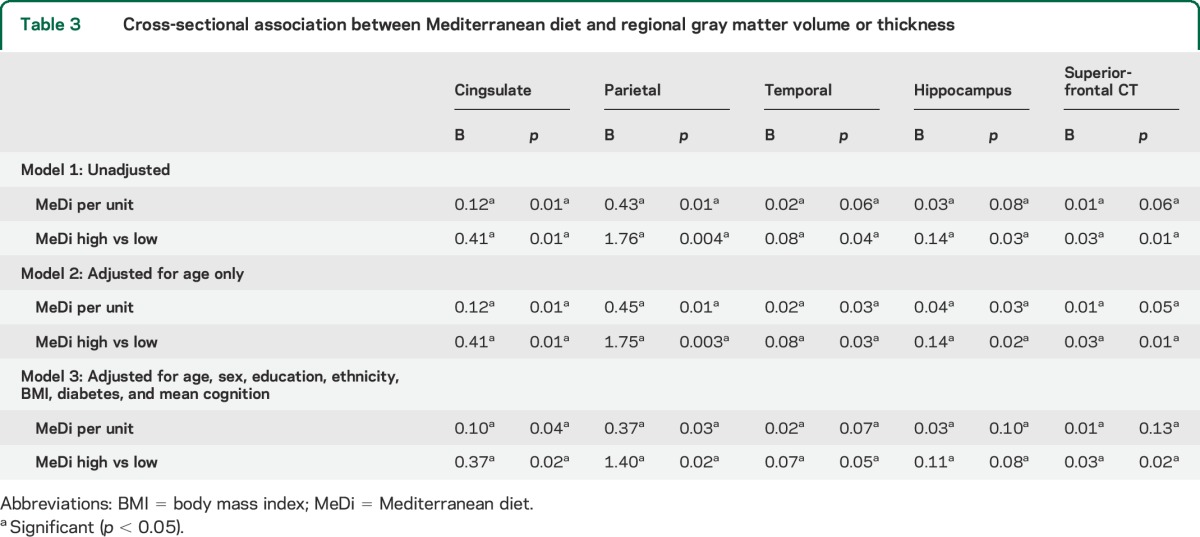
Multivariate analysis indicated marginally significant differences between MeDi groups on a linear combination of the volumes in 10 regions (Wilks λ = 0.97, p = 0.06), and on a linear combination of the 12 ROIs CT (Wilks λ = 0.97, p = 0.05). The volumes of the cingulate, parietal, temporal, and hippocampus regions (univariate p values < 0.05) contributed most to distinguish the low and high MeDi adherence. The CT in the superior-frontal region (p = 0.03) contributed most to distinguish between low and high MeDi adherence. Adjusted GLM analyses confirmed these associations (table 3). Higher fish and lower meat intakes tended to be associated with these regions, except for hippocampus (table e-3, model 3). Fruit intake was associated with lower temporal and hippocampus volumes. Lower meat intake was associated with larger CT of the superior-frontal region (table e-3, model 3).
Table 3.
Cross-sectional association between Mediterranean diet and regional gray matter volume or thickness
DISCUSSION
In this cross-sectional study of an elderly population without dementia, we found that participants who adhered more to a MeDi had larger brain volumes, both in GM and WM. The association was driven most likely by high fish and low meat consumption. MeDi was associated with volume in cingulate cortex, parietal lobe, temporal lobe, and hippocampus, and CT of the superior-frontal region. The absolute effect of MeDi on brain measures were relatively small. However, the magnitude of the effect of consuming at least 5 recommended MeDi food components on TBV is comparable to that of 5 years of increasing age. Similarly, having fish intake of 3–5 oz at least weekly, or keeping meat intake 100 g daily or less, may also provide a considerable protection against brain atrophy that is equivalent to about 3–4 years of aging. Thus, a modifiable factor such as diet is of interest from the prevention point of view.
To our knowledge, only 2 studies have examined the relationship between MeDi and brain atrophy. In contrast to our findings, a Swedish study found no association between the MeDi score and brain volumes.9 The Swedish population might have different dietary habits (for example, lower intake of legumes) compared to our US population. In addition, our study population is more diverse in terms of ethnicity (white, black, and Hispanic participants) and of lower education level. Nevertheless, similar to our study, the Swedish study also found a negative association between meat intake and TBV,9 and a positive association between dietary intakes of omega-3 polyunsaturated fatty acids (ω-3 PUFA) from marine or fish sources and TGMV.28 We found MeDi, more fish, and less meat intakes were related with larger brain volume in cingulate cortex, parietal lobe, temporal lobe, and hippocampus, partially echoing a previous study that found regular fish consumption was associated with larger GMV in the hippocampus, posterior cingulate, precuneus, and orbital frontal cortex.29 However, null association with brain atrophy has also been reported for fish30 or ω-3 PUFA dietary pattern.31 Taken together, although data regarding the relationship of MeDi or its components and markers of brain atrophy are scarce and mixed, the findings from our study and some others suggested a potential beneficial role of MeDi or fish intake, and a detrimental role of meat intake.
Only one previous study10 examined the relationship between MeDi and cortical thickness. In this small study of 52 cognitively normal middle-aged participants, higher MeDi adherence was associated with greater thickness of 3 ROIs (orbital frontal cortex, entorhinal cortex, posterior cingulate cortex of the left hemisphere).10 Combined with our findings, it seems that at least some of the AD-vulnerable cortical regions, especially the frontal region, are related with MeDi.
Accumulating evidence has shown that a closer adherence to the MeDi was associated with a reduced risk of developing MCI or AD.1–5 While the mechanisms for the beneficial role of MeDi on cognitive health remain largely unknown, the current study suggests a potential pathway involving the brain structure maintenance or delaying aging-related atrophy, especially as brain atrophy has been related to cognitive decline.32 MeDi may be related to accumulation of amyloid β33 or phosphorylation and aggregation of tau,34 which in turn contributes to the brain atrophy.35 Fish contains several beneficial nutrients including ω-3 PUFA, vitamin D, and B vitamins. The beneficial effects of ω-3 PUFA on brain include increasing neurite outgrowth and synaptogenesis, neurogenesis, and anti-inflammation.36 Vitamin D can protect against biological processes associated with AD and cognition, including amyloid-β deposition, inflammation, and calcium homeostasis,37 and vitamin D depletion has been linked with brain atrophy.38 Studies have shown that B vitamins, including B6, B12, and niacin, play important roles in slowing brain atrophy.39 Meats are high in SFA and protein and are prone to advanced glycation end products (AGE) formation through high-temperature cooking. A large body of research shows that diets high in AGE may promote AD amyloid-β generation, increased tau phosphorylation, insulin resistance, and inflammation.40
A few limitations of the present study need to be noted. Our study is cross-sectional so we cannot exclude the possibility of reverse causality, i.e., that changes in brain structure result in behavioral changes including alterations in dietary habits. Longitudinal studies are needed to examine whether baseline MeDi adherence is associated with less brain atrophy over time. We cannot completely rule out the possibility of residual confounding. Finally, despite a relatively large overall sample size, our study might be underpowered to examine interactions and for stratified analyses in subgroups.
Our study has many strengths. Few studies exist examining the relationship between MeDi and brain structures. Our study added new evidence to this line of research by including a large sample of study participants and by examining different brain regions. Our study examined the relationship among multiple ethnic groups, including not only white but also African American and Hispanic participants, and is thus likely to be more generalizable to the increasingly diverse US population.17 We used comprehensive cognitive assessments with full neuropsychological testing and physician evaluations administered to all participants. The final diagnoses of dementia and MCI were based on consensus diagnosis according to standard research criteria.13–15 We excluded participants with dementia and MCI, thus reducing potential recall bias on dietary intake due to memory deficits. Several potential confounding factors have been adjusted for in the analyses. We analyzed multiple types and levels of brain measures, including volume and cortical thickness, GM and WM volumes, cortical and deep GM volumes, and finally, selected ROIs.
Overall, our study suggests that closer adherence to MeDi might be associated with larger brain volumes in elderly people, an association conceivably driven by higher fish and lower meat intake. Cingulate, parietal, and potentially temporal regions might be more relevant in terms of the association with MeDi adherence, while higher intake of fish and lower intake of meat seem to nonspecifically protect against atrophy across cortical regions.
Supplementary Material
GLOSSARY
- AD
Alzheimer disease
- AGE
advanced glycation end products
- BMI
body mass index
- CDR
Clinical Dementia Rating
- DSM-III-R
Diagnostic and Statistical Manual of Mental Disorders, 3rd edition, revised
- FFQ
food frequency questionnaire
- GLM
generalized linear model
- GM
gray matter
- ICV
intracranial volume
- MANOVA
multivariate analysis of variance
- MCI
mild cognitive impairment
- mCT
mean cortical thickness
- MeDi
Mediterranean diet
- PUFA
polyunsaturated fatty acids
- ROI
region of interest
- SFA
saturated fats
- TBV
total brain volume
- TGMV
total gray matter volume
- TWMV
total white matter volume
- WHICAP
Washington Heights/Hamilton Heights Inwood Columbia Aging Project
- WM
white matter
Footnotes
Supplemental data at Neurology.org
AUTHOR CONTRIBUTIONS
Yian Gu: drafting/revising the manuscript, study concept or design, analysis or interpretation of data, accepts responsibility for conduct of research and final approval, statistical analysis, obtaining funding. Adam M. Brickman: drafting/revising the manuscript, analysis or interpretation of data, accepts responsibility for conduct of research and final approval, acquisition of data, obtaining funding. Yaakov Stern: drafting/revising the manuscript, study concept or design, analysis or interpretation of data, accepts responsibility for conduct of research and final approval, study supervision. Christian Habeck: analysis or interpretation of data, accepts responsibility for conduct of research and final approval, statistical analysis. Qolamreza Razlighi: analysis or interpretation of data, accepts responsibility for conduct of research and final approval, statistical analysis. Jose A. Luchsinger: drafting/revising the manuscript, study concept or design, accepts responsibility for conduct of research and final approval, acquisition of data, obtaining funding. Jennifer J. Manly: analysis or interpretation of data, accepts responsibility for conduct of research and final approval, acquisition of data, study supervision, obtaining funding. Nicole Schupf: drafting/revising the manuscript, accepts responsibility for conduct of research and final approval, acquisition of data, study supervision, obtaining funding. Richard Mayeux: study concept or design, accepts responsibility for conduct of research and final approval, acquisition of data, study supervision, obtaining funding. Nikolaos Scarmeas: drafting/revising the manuscript, study concept or design, analysis or interpretation of data, accepts responsibility for conduct of research and final approval, study supervision.
STUDY FUNDING
Supported by NIH grants AG042483, AG037212, AG034189, and P60 MD000206.
DISCLOSURE
Y. Gu reports no disclosures relevant to the manuscript. A. Brickman is on the Scientific Advisory Boards and serves as a paid consultant for ProPhase, LLC, and Keystone Heart, LLC. He serves on the Board of Directors of the International Neuropsychological Society, which has paid for his travel to annual meetings. He is supported by grants from NIH, the Groff Foundation, Mars Inc., and Columbia University. Y. Stern was on the advisory committee for Janssen Alzheimer Immunotherapy Research & Development, LLC. He serves on the Advisory Board for AbbVie, Inc., and is a consultant for Eli Lilly, Takeda, and Piramal. His scientific work is funded by NIH grants R01AG007370, R01AG038465, R01AG033546, and R01AG026158. Dr. Stern served on the Advisory Board of the Alzheimer's Association. C. Habeck and Q. Razlighi report no disclosures relevant to the manuscript. J. Luchsinger has been a consultant to Nutricia, Inc., and receives honoraria from Springer for Diabetes and the Brain. J. Manly serves on the Medical and Scientific Advisory Board of the Alzheimer's Association. She serves on the US Department of Health and Human Services Advisory Council on Alzheimer's Research, Care and Services. Her scientific work is funded by grants from NIH and the Alzheimer's Association. N. Schupf, R. Mayeux, and N. Scarmeas report no disclosures relevant to the manuscript. Go to Neurology.org for full disclosures.
REFERENCES
- 1.Scarmeas N, Stern Y, Tang MX, Mayeux R, Luchsinger JA. Mediterranean diet and risk for Alzheimer's disease. Ann Neurol 2006;59:912–921. [DOI] [PMC free article] [PubMed] [Google Scholar]
- 2.Sofi F, Cesari F, Abbate R, Gensini GF, Casini A. Adherence to Mediterranean diet and health status: meta-analysis. BMJ 2008;337:a1344. [DOI] [PMC free article] [PubMed] [Google Scholar]
- 3.Tangney CC, Kwasny MJ, Li H, Wilson RS, Evans DA, Morris MC. Adherence to a Mediterranean-type dietary pattern and cognitive decline in a community population. Am J Clin Nutr 2011;93:601–607. [DOI] [PMC free article] [PubMed] [Google Scholar]
- 4.Tsivgoulis G, Judd S, Letter AJ, et al. Adherence to a Mediterranean diet and risk of incident cognitive impairment. Neurology 2013;80:1684–1692. [DOI] [PMC free article] [PubMed] [Google Scholar]
- 5.Gardener S, Gu Y, Rainey-Smith SR, et al. Adherence to a Mediterranean diet and Alzheimer's disease risk in an Australian population. Transl Psychiatry 2012;2:e164. [DOI] [PMC free article] [PubMed] [Google Scholar]
- 6.Vercambre MN, Grodstein F, Berr C, Kang JH. Mediterranean diet and cognitive decline in women with cardiovascular disease or risk factors. J Acad Nutr Diet 2012;112:816–823. [DOI] [PMC free article] [PubMed] [Google Scholar]
- 7.Gu Y, Scarmeas N. Diet and neuroimaging markers of cerebrovascular disease. Curr Nutr Rep 2013;2:81–89. [DOI] [PMC free article] [PubMed] [Google Scholar]
- 8.Jack CR, Jr, Knopman DS, Jagust WJ, et al. Hypothetical model of dynamic biomarkers of the Alzheimer's pathological cascade. Lancet Neurol 2010;9:119–128. [DOI] [PMC free article] [PubMed] [Google Scholar]
- 9.Titova OE, Ax E, Brooks SJ, et al. Mediterranean diet habits in older individuals: associations with cognitive functioning and brain volumes. Exp Gerontol 2013;48:1443–1448. [DOI] [PubMed] [Google Scholar]
- 10.Mosconi L, Murray J, Tsui WH, et al. Mediterranean diet and magnetic resonance imaging-assessed brain atrophy in cognitively normal individuals at risk for Alzheimer's disease. J Prev Alzheimers Dis 2014;1:23–32. [PMC free article] [PubMed] [Google Scholar]
- 11.Tang MX, Cross P, Andrews H, et al. Incidence of AD in African-Americans, Caribbean Hispanics, and Caucasians in northern Manhattan. Neurology 2001;56:49–56. [DOI] [PubMed] [Google Scholar]
- 12.Stern Y, Andrews H, Pittman J, et al. Diagnosis of dementia in a heterogeneous population: development of a neuropsychological paradigm-based diagnosis of dementia and quantified correction for the effects of education. Arch Neurol 1992;49:453–460. [DOI] [PubMed] [Google Scholar]
- 13.American Psychiatric Association. Diagnostic and Statistical Manual of Mental Disorders, 3rd ed Washington, DC: American Psychiatric Press; 1987. [Google Scholar]
- 14.McKhann G, Drachman D, Folstein M, Katzman R, Price D, Stadlan EM. Clinical diagnosis of Alzheimer's disease: report of the NINCDS-ADRDA Work Group under the auspices of Department of Health and Human Services Task Force on Alzheimer's Disease. Neurology 1984;34:939–944. [DOI] [PubMed] [Google Scholar]
- 15.Petersen RC. Mild cognitive impairment as a diagnostic entity. J Intern Med 2004;256:183–194. [DOI] [PubMed] [Google Scholar]
- 16.Manly JJ, Bell-McGinty S, Tang MX, Schupf N, Stern Y, Mayeux R. Implementing diagnostic criteria and estimating frequency of mild cognitive impairment in an urban community. Arch Neurol 2005;62:1739–1746. [DOI] [PubMed] [Google Scholar]
- 17.Brickman AM, Schupf N, Manly JJ, et al. Brain morphology in older African Americans, Caribbean Hispanics, and whites from northern Manhattan. Arch Neurol 2008;65:1053–1061. [DOI] [PMC free article] [PubMed] [Google Scholar]
- 18.Segonne F, Dale AM, Busa E, et al. A hybrid approach to the skull stripping problem in MRI. Neuroimage 2004;22:1060–1075. [DOI] [PubMed] [Google Scholar]
- 19.Fischl B, Salat DH, van der Kouwe AJ, et al. Sequence-independent segmentation of magnetic resonance images. Neuroimage 2004;23(suppl 1):S69–S84. [DOI] [PubMed] [Google Scholar]
- 20.Sled JG, Zijdenbos AP, Evans AC. A nonparametric method for automatic correction of intensity nonuniformity in MRI data. IEEE Trans Med Imaging 1998;17:87–97. [DOI] [PubMed] [Google Scholar]
- 21.Segonne F, Pacheco J, Fischl B. Geometrically accurate topology: correction of cortical surfaces using nonseparating loops. IEEE Trans Med Imaging 2007;26:518–529. [DOI] [PubMed] [Google Scholar]
- 22.Dale AM. Optimal experimental design for event-related fMRI. Hum Brain Mapp 1999;8:109–114. [DOI] [PMC free article] [PubMed] [Google Scholar]
- 23.Fischl B, Dale AM. Measuring the thickness of the human cerebral cortex from magnetic resonance images. Proc Natl Acad Sci USA 2000;97:11050–11055. [DOI] [PMC free article] [PubMed] [Google Scholar]
- 24.Dickerson BC, Bakkour A, Salat DH, et al. The cortical signature of Alzheimer's disease: regionally specific cortical thinning relates to symptom severity in very mild to mild AD dementia and is detectable in asymptomatic amyloid-positive individuals. Cereb Cortex 2009;19:497–510. [DOI] [PMC free article] [PubMed] [Google Scholar]
- 25.Brickman AM, Zahodne LB, Guzman VA, et al. Reconsidering harbingers of dementia: progression of parietal lobe white matter hyperintensities predicts Alzheimer's disease incidence. Neurobiol Aging 2015;36:27–32. [DOI] [PMC free article] [PubMed] [Google Scholar]
- 26.Luchsinger JA, Tang MX, Shea S, Mayeux R. Antioxidant vitamin intake and risk of Alzheimer disease. Arch Neurol 2003;60:203–208. [DOI] [PubMed] [Google Scholar]
- 27.Luchsinger JA, Tang MX, Siddiqui M, Shea S, Mayeux R. Alcohol intake and risk of dementia. J Am Geriatr Soc 2004;52:540–546. [DOI] [PubMed] [Google Scholar]
- 28.Titova OE, Sjogren P, Brooks SJ, et al. Dietary intake of eicosapentaenoic and docosahexaenoic acids is linked to gray matter volume and cognitive function in elderly. Age 2013;35:1495–1505. [DOI] [PMC free article] [PubMed] [Google Scholar]
- 29.Raji CA, Erickson KI, Lopez OL, et al. Regular fish consumption and age-related brain gray matter loss. Am J Prev Med 2014;47:444–451. [DOI] [PMC free article] [PubMed] [Google Scholar]
- 30.Virtanen JK, Siscovick DS, Longstreth WT, Jr, Kuller LH, Mozaffarian D. Fish consumption and risk of subclinical brain abnormalities on MRI in older adults. Neurology 2008;71:439–446. [DOI] [PMC free article] [PubMed] [Google Scholar]
- 31.Bowman GL, Silbert LC, Howieson D, et al. Nutrient biomarker patterns, cognitive function, and MRI measures of brain aging. Neurology 2012;78:241–249. [DOI] [PMC free article] [PubMed] [Google Scholar]
- 32.Pacheco J, Goh JO, Kraut MA, Ferrucci L, Resnick SM. Greater cortical thinning in normal older adults predicts later cognitive impairment. Neurobiol Aging 2015;36:903–908. [DOI] [PMC free article] [PubMed] [Google Scholar]
- 33.Gu Y, Schupf N, Cosentino SA, Luchsinger JA, Scarmeas N. Nutrient intake and plasma beta-amyloid. Neurology 2012;78:1832–1840. [DOI] [PMC free article] [PubMed] [Google Scholar]
- 34.Takalo M, Haapasalo A, Martiskainen H, et al. High-fat diet increases tau expression in the brain of T2DM and AD mice independently of peripheral metabolic status. J Nutr Biochem 2014;25:634–641. [DOI] [PubMed] [Google Scholar]
- 35.Mattsson N, Insel P, Nosheny R, et al. Effects of cerebrospinal fluid proteins on brain atrophy rates in cognitively healthy older adults. Neurobiol Aging 2014;35:614–622. [DOI] [PMC free article] [PubMed] [Google Scholar]
- 36.Dyall SC. Long-chain omega-3 fatty acids and the brain: a review of the independent and shared effects of EPA, DPA and DHA. Front Aging Neurosci 2015;7:52. [DOI] [PMC free article] [PubMed] [Google Scholar]
- 37.Anastasiou CA, Yannakoulia M, Scarmeas N. Vitamin D and cognition: an update of the current evidence. J Alzheimers Dis 2014;42(suppl 3):S71–S80. [DOI] [PubMed] [Google Scholar]
- 38.Annweiler C, Annweiler T, Montero-Odasso M, Bartha R, Beauchet O. Vitamin D and brain volumetric changes: systematic review and meta-analysis. Maturitas 2014;78:30–39. [DOI] [PubMed] [Google Scholar]
- 39.Smith AD, Smith SM, de Jager CA, et al. Homocysteine-lowering by B vitamins slows the rate of accelerated brain atrophy in mild cognitive impairment: a randomized controlled trial. PLoS One 2010;5:e12244. [DOI] [PMC free article] [PubMed] [Google Scholar]
- 40.Perrone L, Grant WB. Observational and ecological studies of dietary advanced glycation end products in national diets and Alzheimer's disease incidence and prevalence. J Alzheimers Dis 2015;45:965–979. [DOI] [PubMed] [Google Scholar]
Associated Data
This section collects any data citations, data availability statements, or supplementary materials included in this article.