Abstract
Natural selection inference methods often target one mode of selection of a particular age and strength. However, detecting multiple modes simultaneously, or with atypical representations, would be advantageous for understanding a population’s evolutionary history. We have developed an anomaly detection algorithm using distributions of pairwise time to most recent common ancestor (TMRCA) to simultaneously detect multiple modes of natural selection in whole-genome sequences. As natural selection distorts local genealogies in distinct ways, the method uses pairwise TMRCA distributions, which approximate genealogies at a nonrecombining locus, to detect distortions without targeting a specific mode of selection. We evaluate the performance of our method, TSel, for both positive and balancing selection over different time-scales and selection strengths and compare TSel’s performance with that of other methods. We then apply TSel to the Complete Genomics diversity panel, a set of human whole-genome sequences, and recover loci previously inferred to be under positive or balancing selection.
Keywords: natural selection, time to most recent common ancestor, anomaly detection
Introduction
Natural selection is the driving force behind adaptive evolution. The ability to detect regions of the genome that have undergone natural selection has increased our understanding of function and evolutionary history of many loci (Nielsen et al. 2007). However, natural selection takes different forms, all of which are informative, and current selection inference methods each target only a subset of natural selection scenarios (Sabeti et al. 2006). Given the importance of many modes and degrees of natural selection, a method that could detect multiple, atypical, or combinations of selection scenarios simultaneously would be both convenient and advantageous. Furthermore, given the current amount and continuing accumulation of sequencing data, designing methods for whole-genome sequences, rather than genotype data, will harness additional genetic information.
Detecting anomalous genomic sites has long been the foundation of natural selection tests (Akey 2009). This approach is susceptible to errors, but using a statistic that better distinguishes selected and neutral sites, using multiple statistics, or both could improve performance. To be truly general, an anomaly detection algorithm should also make use of any number of features and account for correlations among features. Furthermore, instead of using statistics based directly on extended haplotypes or sequence diversity, which are characteristic signatures of particular modes of selection, a general natural selection algorithm should use a universal measure that responds uniquely to each natural selection mode. Theory and empirical studies demonstrate that natural selection distorts local genealogies in distinct ways, and exploiting these distortions could lead to a more general method (Bamshad and Wooding 2003). For example, positive selection will create a short, star-like genealogy whereas balancing selection will create an extremely deep tree. Although inferring local ancestral recombination graphs genome-wide is still computationally prohibitive, methods, such as the pairwise sequentially Markovian coalescent (PSMC), for inferring pairwise time to most recent common ancestor (TMRCA) distributions, approximations of local genealogies, are now available (Li and Durbin 2011). As we will show, key advantages of detecting selection based on TMRCA include detecting multiple and uncharacterized forms of selection and making full use of whole-genome sequence data.
Previous methods have been able to detect multiple types of selection. These approaches include classic metrics such as Tajima’s D and Fay and Wu’s H and newer programs such as SweepFinder (SF), nSL, and the H12 method (Tajima 1989; Fay and Wu 2000; Nielsen et al. 2005; Ferrer-Admetlla et al. 2014; Garud et al. 2015). However, Tajima’s D and Fay and Wu’s H are unable to distinguish influences of demography and population structure from those of selection. Newer methods are either untested on a wide variety of selection scenarios, such as Test 1 of SF, a test identifying natural selection by an aberrant local site frequency spectrum, or applicable only to a subset of related forms of selection, such as the nSL test, which was designed to detect hard and soft sweeps. Therefore, there is still a need for a more expansive natural selection inference method that, in addition, accounts for population structure. Furthermore, several of these tests were designed with genotype data rather than sequence data in mind, and a method that not only accepts but requires full sequencing data would be advantageous, especially in species like humans with large numbers of rare mutations segregating in the population.
Here, we develop an anomaly detection test using TMRCA that can simultaneously detect multiple modes of selection. There are many advantages to our formulation of the selection inference problem. Anomaly detection resembles the intuition behind many selection tests, and our implementation can include any number and type of features and account for correlations between these features (Akey 2009). By using the input data directly to construct a model of neutrality, we also account for demography without specifying an external demographic model. Furthermore, using features derived from pairwise TMRCA distributions exploits our knowledge about how natural selection causes local and systematic distortions in genealogies and creates a general test that can potentially detect uncharacterized, atypical, or combinations of natural selection modes acting on a single locus. We believe that TSel method truly deserves the label of general because of the expansiveness of the simulations outlined below and also because, unlike many previous methods, it is not a method targeting a signature of a particular natural selection mode. We discuss the performance of the method, which we call TSel for TMRCA Selection, in simulated data, on hard and soft complete sweeps, partial sweeps, and overdominance selection scenarios and in four different demographic scenarios: A population with constant size, a population that has undergone a bottleneck and recent growth, and populations with recent or ancient admixture. We then compare the method’s performance with other selection inference methods using simulated data and apply our method to the Complete Genomics (CG) diversity panel, a set of human whole-genome sequences (Drmanac et al. 2010).
New Approaches
Each nonrecombining locus in the genome can be represented as a genealogical tree over the sampled individuals. Our new method for natural selection inference, TSel, capitalizes on the idea that all forms of selection distort the shape and size of the tree in distinct ways, relative to the majority of the genome that is either evolving neutrally or under weak selection. Representing each tree as a distribution of pairwise TMRCA values, we extract features, such as the average, maximum, median, variance, skewness, kurtosis, a bimodality coefficient, fraction of pairs equal to the maximum, and various quartile values, to describe each locus as a vector. Using these features we construct an anomaly detection framework to detect loci whose feature vector is highly deviant from the genome as a whole. By outputting a score for each locus, the method encapsulates the continuum and multidimensionality of selection’s influence on the genome. Full details of the development and implementation of TSel are provided in the Materials and Methods section.
We ran TSel on the wide array of selection and demographic scenarios listed above in the introduction and compared TSel’s performance with that of five other methods. For positive selection scenarios, we compared TSel with the methods identity-by-descent (IBD), iHS, SF, and nSL (Nielsen et al. 2005; Voight et al. 2006; Albrechtsen et al. 2010; Han and Abney 2013; Ferrer-Admetlla et al. 2014). For overdominance scenarios, we compared TSel with the Hudson–Kreitman–Aguadé (HKA) test (Hudson et al. 1987). To summarize performance of each method in each simulated scenario, we used a metric called the F1-score (Zhao et al. 2014). The F1-score is the harmonic mean of the precision and recall of a classifier and has a minimum value of 0 and a maximum value of 1, indicating perfect performance. From the precision–recall curve, we extract the point that results in the largest F1-score to represent the performance of each method. For the sample sizes tested in the subsequent simulations, an F1-score of approximately 0.67 indicates random performance. More details on the description and calculation of the F1-score are outlined in the Materials and Methods section. Although some methods may be applied outside their direct area of purpose, we include these results because they serve to demonstrate that TSel has greater breadth of application than the other methods with which our method is compared.
Results
TSel Performance in Populations of Constant Size
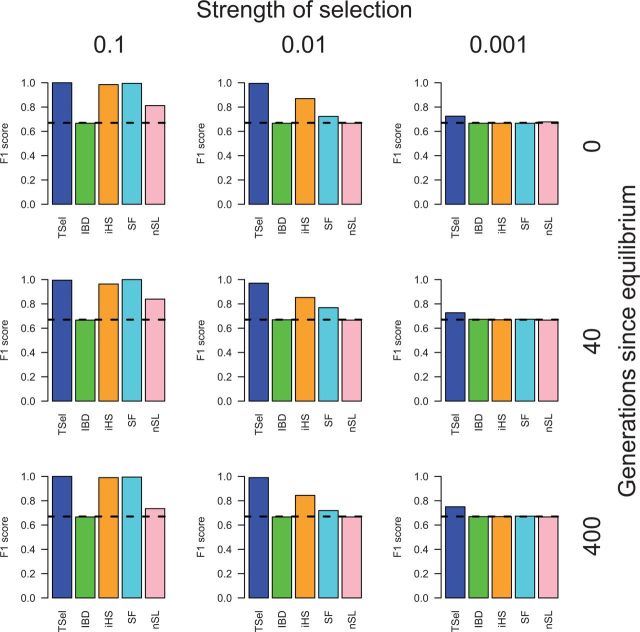
TSel exhibits excellent performance on hard sweeps, especially with stronger and more recent selection. F1-scores for TSel, in addition to competing methods, on complete hard sweeps for a constant effective population size of 10,000 are shown in figure 1. TSel has an F1-score of nearly 1 for stronger, complete hard sweeps and still shows some ability to detect weaker sweeps. F1-scores are lower for other methods with the exception of iHS and SF, whose performance matches or is only slightly below that of TSel for the strongest sweeps. However, F1-scores for iHS decline from 0.98 to 0.87, and from 0.99 to 0.72 for SF, when the selection coefficient falls from 0.1 to 0.01, whereas the F1-score for TSel remains nearly unchanged. TSel matches or substantially outperforms most other methods in detecting complete hard sweeps, especially in scenarios with weaker selection.
Fig. 1.
TSel performance on complete hard sweeps with an effective population size of 10,000. Performance is demonstrated through the maximum F1-score, the harmonic mean of the precision and recall score. The x axis of the grid corresponds to the strength of selection and the y axis corresponds to the time of sweep completion. The dashed, black line indicates the maximum F1-score when predicted calls are randomly assigned.
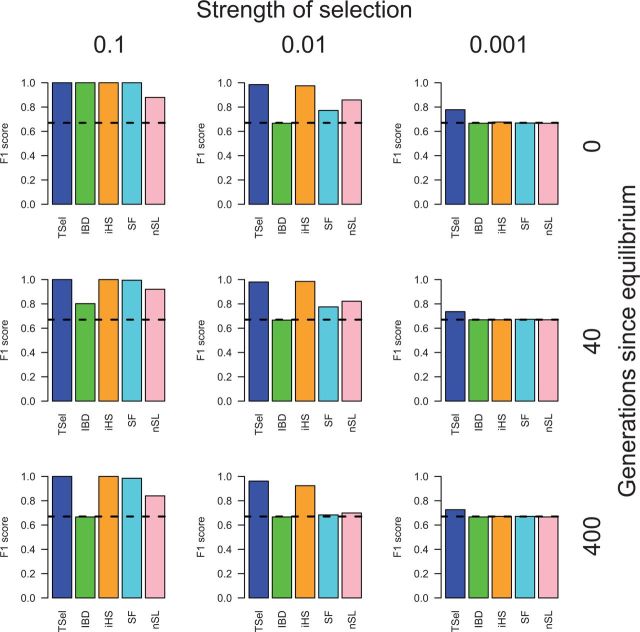
We also applied TSel to partial hard sweeps. TSel’s performance is shown for an effective population size of 10,000 and partial hard sweeps ending with the selected allele at 75% frequency in figure 2. Similar to the method’s performance on complete hard sweeps, TSel exhibits an F1-score of nearly 1 for more recent and stronger partial hard sweeps. iHS, SF, and the IBD method produce near perfect performance as well, and nSL performs with a reasonable F1-score of 0.88. Performance of the IBD method and SF diminishes with intermediate selection although the iHS and nSL retain approximately equivalent performance until the weakest selection scenario when only TSel retains an F1-score distinct from random at approximately 0.78. In general, TSel tends to have the widest breadth of performance in partial selection scenarios.
Fig. 2.
TSel performance on partial hard sweeps with an effective population size of 10,000. The final selected allele frequency of the partial hard sweep was set to 75%. The x axis of the grid corresponds to the strength of selection and the y axis corresponds to the time of sweep completion. Performance is demonstrated through the maximum F1-score, the harmonic mean of the precision and recall score. The dashed, black line indicates the maximum F1-score when predicted calls are randomly assigned.
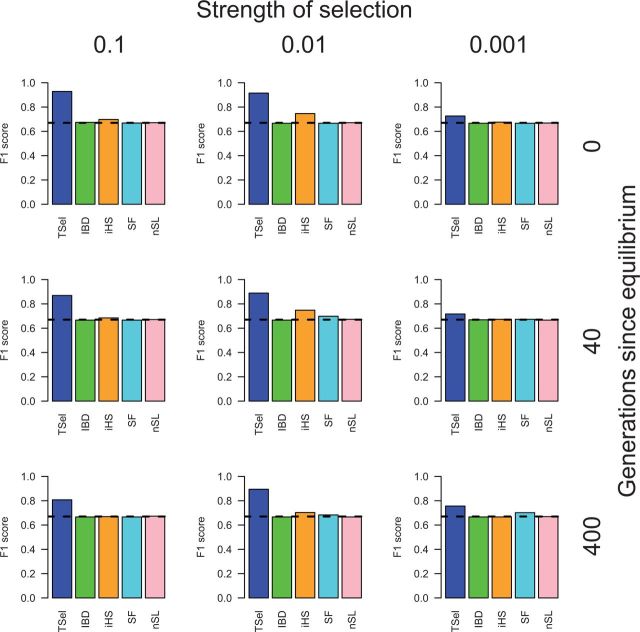
In a final positive selection test, we looked at the method’s power to detect soft sweeps arising from standing variation at 0.1%, 1%, or 10% frequency. Results are shown in figure 3 for soft sweeps starting from 1% frequency and supplementary figures S1 and S2, Supplementary Material online, for 0.1% and 10%, respectively. TSel performance suffers for soft sweeps compared with that of hard sweeps, but the method still retains the ability to detect sweeps from standing variation. For soft sweeps beginning from standing variation at 1% frequency, TSel reaches a maximum F1-score of 0.93 over all soft sweep scenarios whereas other methods do not perform notably better than random. This result is unexpected for nSL, given that the method was designed to detect soft sweeps. However, nSL was designed to detect currently ongoing soft sweeps whereas our selection scenarios are sampled after the sweeps have completed. This explanation may clarify why nSL can detect partial sweeps but not the soft sweeps simulated here. From standing variation at 0.1% frequency, TSel, iHS, and SF perform better than random, reaching a score of 1.00, 0.85 and 0.84, respectively. All methods show no power to detect soft sweeps from standing variation at 10% frequency in a population of constant size. Although TSel shows reduced power when compared with hard sweeps, the method can still detect soft sweeps starting from an initial frequency of 0.1% and even 1% in a population of constant size.
Fig. 3.
TSel performance on soft sweeps with an effective population size of 10,000. The initial frequency of the selected allele was set to 1%. Performance is demonstrated through the maximum F1-score, the harmonic mean of the precision and recall score. The x axis of the grid corresponds to the strength of selection and the y axis corresponds to the time of sweep completion. The dashed, black line indicates the maximum F1-score when predicted calls are randomly assigned.
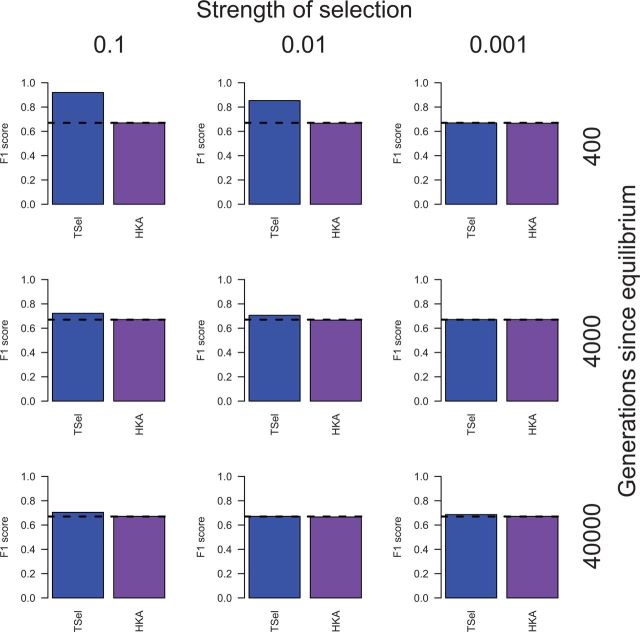
Having analyzed TSel’s performance for positive selection, we then turned to examine the method’s performance for balancing selection (fig. 4). TSel obtains a maximum F1-score of 0.92 to detect more recent overdominance. The HKA test shows limited power to detect overdominance in the scenarios tested here, with no F1-score notably better than random, and is outperformed by TSel in most cases. In a constant size population, TSel only has power to detect more recent overdominance.
Fig. 4.
TSel performance on overdominance with an effective population size of 10,000. Selection began from one copy of the selected allele. Performance is demonstrated through the maximum F1-score, the harmonic mean of the precision and recall score. The x axis of the grid corresponds to the strength of selection and the y axis corresponds to the time of the selected allele reached its equilibrium frequency of 0.5. The dashed, black line indicates the maximum F1-score when predicted calls are randomly assigned.
TSel Performance in Populations with Complex Demography
Results of natural selection inference in complex demographic contexts are shown in supplementary figures S3 through S17, Supplementary Material online, and the demographic models themselves are described in detail in the Materials and Methods section. TSel performance in a population with a bottleneck and recent growth is much the same as in constant population simulations. For the admixture scenarios, however, results are sometimes drastically different. Overall, TSel performance suffers slightly but still outperforms most other methods with the exception of the IBD and iHS methods. For recent admixture simulations, the IBD and iHS methods start to outperform TSel, but only in the most recent and strongest selection scenarios. For example, for the complete hard sweeps, TSel obtains an F1-score of 0.95 whereas the iHS method reaches 0.99, but for the next weakest selection scenario, TSel retains an F1-score of approximately 0.99 whereas the F1-score for iHS drops to 0.83. For the ancient admixture simulations, the IBD and iHS methods do even better, with performance matching or slightly exceeding that of TSel in many more scenarios, but again, TSel retains some performance in the weakest selection scenarios whereas all other methods do not perform notably better than random. In admixture contexts, TSel, IBD, iHS, and even SF to a limited extent, have the power to detect several soft sweep scenarios starting from an initial allele frequency of 10% unlike soft sweeps from the same initial frequency in other demographic contexts. Additionally, TSel shows potential for the detection of both recent and ancient overdominance in admixture contexts, unlike its performance in the constant population size simulation where the method can only detect recent overdominance. TSel’s performance, and that of other methods, is highly dependent on demographic context, but TSel demonstrates a persistence of performance over a wide variety of demographic and selection scenarios.
TSel Performance with Alternate Features
To test whether other feature subsets have equivalent performance, we examined TSel performance with exact pairwise TMRCA features, inferred pairwise TMRCA features, and diversity features (fig. 5). The exact pairwise TMRCA features refer to those extracted directly from the simulated coalescent trees, whereas the inferred pairwise TMRCA features are those output by the method PSMC when run on simulated data sequences (Li and Durbin 2011). Diversity features are π, Watterson’s θ, and Tajima’s D calculated over the simulated sample. Performance for TSel with TMRCA features versus diversity derived features is correlated, but TSel with exact or inferred TMRCA features outperforms that with diversity features in all but the cases with the weakest selection, where all three groups of features perform poorly. For example, in recent sweeps with an intermediate strength of selection TSel with exact TMRCA, inferred TMRCA, and diversity features obtains an F1-score of 1.00, 0.95, and 0.91, respectively. Performance with inferred TMRCA features is lower than that with exact pairwise TMRCA most probably due to inference errors and reduced number of pairwise TMRCA values as we use only 50 pairs rather than the full 4,950 pairs. Performance of inferred TMRCA distributions will likely improve when all pairwise TMRCA values are included and inference methods improve. The slight difference in performance between inferred TMRCA features and diversity features is most likely a result of greater stochasticity in mutations compared with local genealogies. Diversity features are also derived on larger windows in order to include sufficient variation for calculation, effectively blurring local effects. The results demonstrate that inferred TMRCA is a distinct and more informative metric than measures of diversity for the inference of natural selection.
Fig. 5.
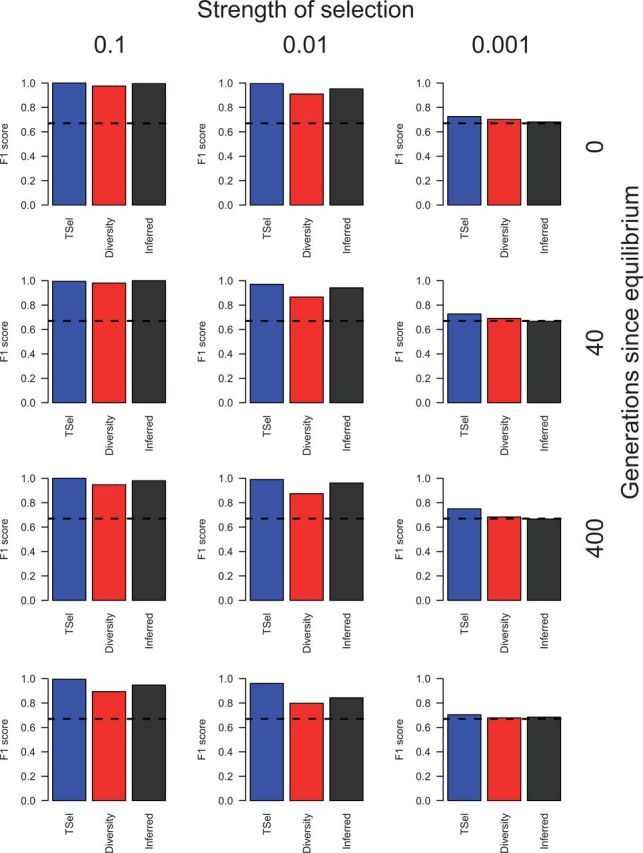
TSel performance using alternate feature sets, on complete hard sweeps with an effective population size of 10,000. Performance is shown for TSel using features calculated from exact pairwise TMRCA distributions, PSMC-inferred pairwise TMRCA distributions, and genetic diversity. Performance is demonstrated through the maximum F1-score, the harmonic mean of the precision and recall score. The x axis of the grid corresponds to the strength of selection and the y axis corresponds to the time of sweep completion. The dashed, black line indicates the maximum F1-score when predicted calls are randomly assigned.
TSel Performance When Including Selected Sites
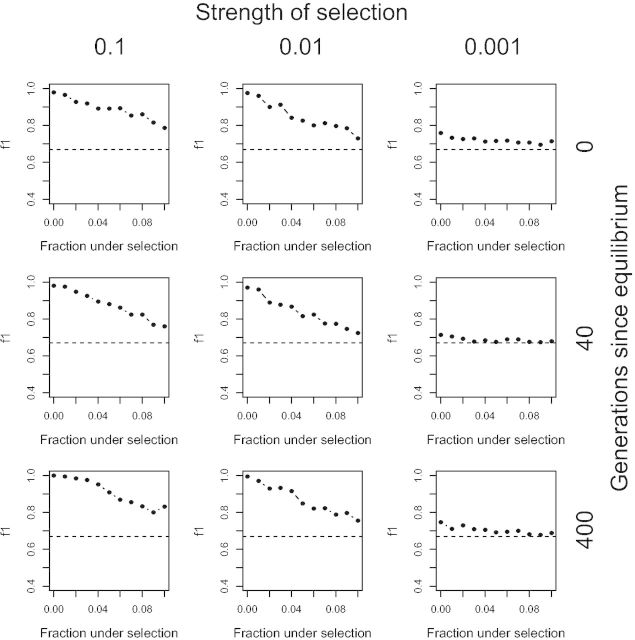
An important assumption of the anomaly detection method is that selected sites are relatively rare within the set of data upon which we calculate the feature means and covariance matrix. As real data contain loci under selection, we tested the performance of TSel with varying fractions of selected sites included in the initial data set. Results are shown in figure 6. Although performance, as measured by the maximum F1-score, declines when we include more selected sites, the F1-score is still 0.89 even when 5% of the data are under strong and recent selection of the exactly the same type, well above the F1-score threshold for random performance of 0.67. Performance may in fact be less susceptible to the inclusion of loci undergoing selection in real data because the strength of the selection on the majority of selected loci will be weak and of different types. Therefore, the method still has power to distinguish neutral and selected loci even when the data set contains a substantial proportion of sites under strong selection.
Fig. 6.
TSel performance when selected loci are not rare. The maximum F1-score, the harmonic mean of the precision and recall score, was calculated when the data upon which the mean and covariance matrix for the Mahalanobis distance were calculated contain a certain fraction of selected data. Simulation scenarios shown are for a complete hard sweep in a constant population size of 10,000 chromosomes. The dashed, black line indicates the maximum F1-score when predicted calls are randomly assigned.
Application to CG Diversity Panel
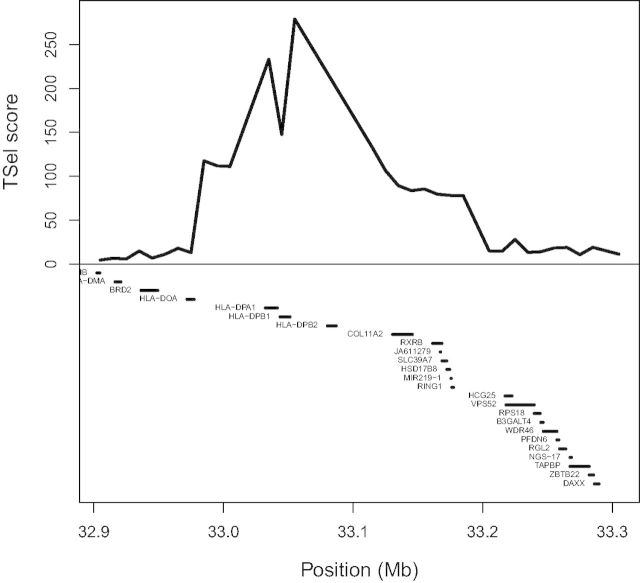
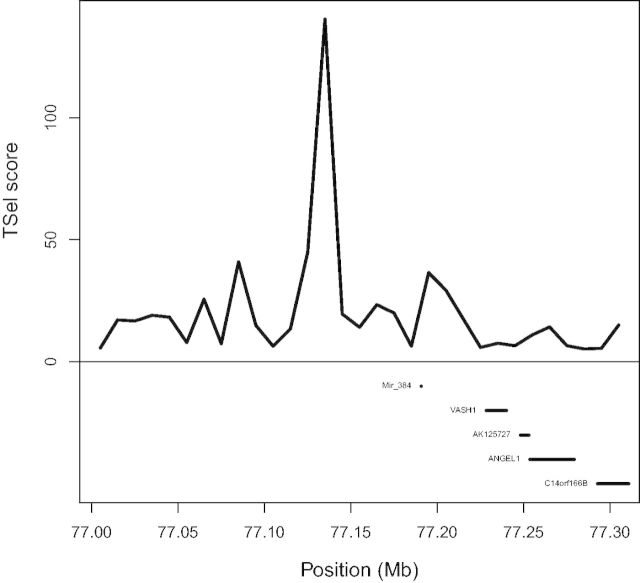
We applied TSel to the CG diversity panel data set to test our method on real data (Drmanac et al. 2010). After extensive filtering, we consolidated each PSMC 100-bp window into 10-kb windows by taking the median TSel score. Analysis of the top 1% of TSel hits among the consolidated 10-kb windows with the program GREAT reveals five enriched biological properties. The P values of enrichment with a false discovery rate correction are given in parentheses. The five biological properties include antigen processing and presentation of peptide or polysaccharide antigen through major histocompatibility complex (MHC) class II (3.25e-7), mammary gland specification (1.68e-3), eyelid development in camera-type eye (8.79e-3), columnar/cuboidal epithelial cell differentiation (2.56e-2), and mammary gland formation (3.54e-2). The top 1% of hits overlaps six regions from the Composite of Multiple Signals (CMS) positive selection scan of the 1000 Genomes Project data and three of the inferred regions for the balancing selection scan of Leffler et al. (Grossman et al. 2013; Leffler et al. 2013). Two of the replicated regions, one for the positive selection scan and the other for the balancing selection scan, are shown in figures 7 and 8, respectively. The peak overlapping the CMS-inferred region lies directly over the HLA-D genes in figure 7. In figure 8, even though the balancing selection signal is far enough away from the VASH1 gene to reduce the probability of being associated with that gene, this fact does not mean that the signal itself is invalid, as it could be highlighting a regulatory or otherwise unmarked functional element of the genome.
Fig. 7.
TSel replicates positive selection inference. The figure displays part of the HLA region on chromosome 6. The top of the figure shows the median TSel score over each consecutive 10-kb window. The bottom of the figure shows genes that lie within the window. Grossman and colleagues used the method CMS to infer positive selection around the genes HLA-DPA1, HLA-DPB1, HLA-DPB2, a region that is also among the top 1% of TSel scoring regions (Grossman et al. 2013).
Fig. 8.
TSel replicates balancing selection inference. The figure displays a region near the VASH1 gene on chromosome 14. The top of the figure shows the median TSel score over each consecutive 10-kb window. The bottom of the figure shows genes that lie within the window. Leffler and colleagues inferred ancient balancing selection near the VASH1 gene, a region that is also among the top 1% of TSel scoring regions (Leffler et al. 2013).
Discussion
We have developed a powerful and flexible method that exhibits higher performance than current natural selection inference methods in a wide parameter space of simulated data. Furthermore, in real data, we have replicated loci previously found to be under both positive and balancing selection with a single method. TSel is more general than previous methods because the method detects any mode of natural selection that leaves a detectable distortion in local genealogies, as shown in our wide range of simulated selection scenarios. TSel’s generality originates directly from its nontargeted nature, and these scenarios could include not only the classical mechanisms of natural selection but also combinations of selection modes or atypical presentations of known modes. Furthermore, the method accounts for demography by comparing loci to the data itself without specifying an external demographic model and retains performance even in the face of complex demographic processes including bottlenecks, recent growth, and admixture. Additionally, although we applied TSel to a human data set, the method could be applied to other species, and this aspect of the method is advantageous for application in species for which little demographic history information is available. Finally, because the inference of TMRCA requires whole-genome sequences, TSel takes full advantage of the growing accumulation of sequence data. These factors make TSel a powerful and flexible method for application to many data sets.
Several challenges remain. TSel is based on a statistic that ranks loci according to the Mahalanobis distance, but the method does not give a threshold for determining significant deviation from neutrality. By taking the top 1% of loci, we hoped to examine the most extreme signatures of selection. That said, we stress here that even though it is tempting to define loci in discrete classes, natural selection in reality operates along a continuum of strengths, times, and modes and that the TSel score recapitulates this continuum. Another remaining challenge is to describe the mode of selection acting on each locus. A user could examine underlying feature values of the locus along with allele frequencies in the region, and subsequent investigation into any functional annotation could also reveal the selective forces at work. Signal localization is another issue. As TSel operates on a local genealogy, the statistic is calculated on each nonrecombining region. Regions with low recombination rates will have larger nonrecombining windows, making the TSel signal more difficult to localize. Additionally, missing data and false positive or false negative variant mapping have the greatest detrimental effect on localization, but higher coverage sequence data will resolve this problem in the future. Finally, although we have tested TSel performance in simulated data over several demographic scenarios, we have not tested TSel in the context of widespread background selection. If strong background selection is present, TSel will most likely be able to detect background selection just like positive or balancing selection because of distortions in the local genealogy. Performance may suffer on particular modes of selection, especially sweeps, when confronted with strong and prevalent background selection, whereas other types of selection, such as overdominance, may be easier to detect. And although we do not test the performance explicitly in simulated scenarios, the fact that TSel replicates loci previously inferred to be under both positive and balancing selection when run on the CG diversity panel is encouraging for TSel’s performance when confronted with realistic levels of background selection.
To further improve method performance, we can pursue several avenues. It is worthy of note that TSel is not limited to using features of pairwise TMRCA. Any method statistic, along with features derived from diversity, cross-population statistics, or functional annotation, is easily incorporated into the method. Additional statistics would likely improve performance or tailor TSel to detecting modes of selection of particular interest to the user. Future features of particular interest are those derived from complete genealogical trees. New methods are being developed to extend PSMC to incorporate multiple haplotypes that can not only increase the accuracy of recent TMRCA inferences but can also reconstruct local genealogies (Sheehan et al. 2013; Rasmussen et al. 2014). With scalable methods to infer local genealogies we will be able to employ features such as tree length and height as well as tree imbalance to more accurately detect systematic distortions caused by natural selection in genetic data (Li and Wiehe 2013). Furthermore, using methods that infer TMRCA over multiple lineages will include more recombination events and allow for a more accurate inference of recent coalescences. This operation will result in an inference improvement in any downstream statistics. To address background selection, a potential solution is to use only neutral regions to construct the TSel model, inferring neutral loci through tools such as the Neutral Region Explorer (Arbiza et al. 2012). More comprehensive statistics in addition to using higher coverage sequence data and inferred neutral regions have the potential to elucidate more loci under selection and increase our understanding of the evolutionary history of samples under study.
Materials and Methods
Features of Exact Pairwise TMRCA Distributions
We extracted the exact pairwise TMRCA values for each pair of chromosomes from simulated coalescent trees output for each nonrecombining locus. Simulations are described below. For clarity, we refer to the pairwise TMRCA values extracted directly from the simulated coalescent trees as the exact pairwise TMRCA values to distinguish them from inferred pairwise TMRCA values analyzed later in the study. From the distribution of exact pairwise TMRCA values at each nonrecombining locus, we calculated a variety of features, including the average, maximum, median, variance, skewness, kurtosis, a bimodality coefficient, fraction of pairs equal to the maximum, and various quartile values. We also normalized each replicate’s exact pairwise TMRCA distribution to be between 0 and 1 and calculated relevant features on these normalized distributions as well. Because using irrelevant feature may decrease performance, we calculated the Laplacian Score on each of the features to select the most discriminative features of the set (He et al. 2005). The Laplacian Score is an unsupervised feature selection method that compares each feature with the global similarity of all the samples to select features that are most discriminative between clusters in the data. The Laplacian Score greatly outperforms feature selection that uses only the variance as a ranking metric, another method of unsupervised feature selection. We select the top 95% of the features to include in the classifier, and each nonrecombining locus was then represented by a vector of the extracted features.
Anomaly Detection Algorithm
In the TSel method, we applied a simple anomaly detection algorithm to the features of exact pairwise TMRCA distributions. This algorithm uses the Mahalanobis distance in which the mean and covariance matrix are calculated on a set of putatively neutral data samples (Bishop 2006). Before calculating the Mahalanobis distance, we removed invariant and correlated features, and selected the most discriminative features using the Laplacian Score. Because the Mahalanobis distance assumes normally distributed features, we then transformed the features using a Box–Cox transformation with the help of the R package geoR to ensure normality (Ribeiro and Diggle 2001). Using the transformed features, we calculated the mean and covariance for these features over all neutral loci and then the Mahalanobis distance for each sampled locus.
TSel is implemented as the R package tsel and can be downloaded from the Clark lab website (http://blogs.cornell.edu/clarklabblog/clark-lab/software/, last accessed June 27, 2015). More details on the package are available in the supplementary material, Supplementary Material online.
Simulations
We generated simulated data using the program MSMS (version 3.2rc Build:147), sampling 100 chromosomes for a locus size of 10 Mb with a constant recombination rate of and a mutation rate of (Ewing and Hermisson 2010; Roach et al. 2010). For computational reasons, we restricted recombination such that recombination events can occur only every 100 bp. This restriction did not appear to affect simulation results as the mean nonrecombining window size was well above the 100 bp minimum. The simulator also output coalescent trees for each nonrecombining window and diversity statistics π, Watterson’s θ, and Tajima’s D over 10-kb windows.
In order to demonstrate the method’s performance on different modes of selection, we simulated loci undergoing complete hard sweeps, partial hard sweeps, complete soft sweeps, and overdominance. We also varied the time of equilibrium and the strength of selection for each scenario. Hard sweeps began from one copy of the selected allele and the time of sweep completion was set to 0, 40, or 400 generations in the past. We chose these generation times to correspond to approximately 1,000 and 10,000 years in the past and the present time so that the scenarios would mimic those for which nSL and other positive selection inference method were designed. We used an additive model for selection coefficients, and the selection strength for individuals homozygous for the selected the allele was set to 0.1, 0.01, or 0.001. For partial hard sweeps, we set the final frequency of the selected allele to 75%, and for soft sweeps, we set the initial allele frequency of the selected allele to 0.1%, 1%, or 10% of the total effective population size to simulate selection from standing variation.
For overdominance, we parameterized selection by the approximate time in the past at which equilibrium was reached and set this value to 400, 4,000, and 40,000 generations in the past. We chose an older time frame for overdominance than for positive selection as recent overdominance tends to mimic positive selection, scenarios that we are already testing explicitly. Selection began from one copy of the selected allele. We set the selection coefficient for those individuals heterozygous for the selected allele to 0.1, 0.01, and 0.001 and homozygous individuals had a selection coefficient of 0. To ensure the allele was not lost, we conditioned on the presence of the allele in the forward simulations. Because alternative balancing selection tests require information from an outgroup relative to the tested sample, we simulated the selection scenarios with an outgroup diverging 6.5 Ma to approximate human and chimp divergence (Gronau et al. 2011).
To assess performance in different demographic scenarios, we simulated data with a constant population size of 10,000 and data undergoing complex demographic scenarios including a bottleneck with recent growth and two admixture scenarios, one recent and one ancient. In the complex demographic scenario, we simulated a population bottleneck 5,000 generations in the past, reducing the population to half its original size and then simulated recent rapid growth starting 100 generations in the past. For the recent admixture scenario, the two populations diverged 400 generations in the past and reunited 10 generations from the present time whereas, for the ancient admixture scenario, the two population populations diverged at 6,000 generations from the present time and reunited 100 generations in the past.
Time variant models and overdominance scenarios must be parameterized by the initiation of selection in MSMS. To parameterize these selection scenarios by the time at which equilibrium was reached, we estimated the time between selection initiation and equilibrium from the simulated data and fed the input generation value plus the time to equilibrium to the simulator.
TSel Performance
To evaluate Tsel’s performance, we generated 1,000 simulated replicates of each neutral scenario and 100 replicates of each selection scenario. We extracted the exact pairwise TMRCA features at the center of the simulated locus, the location of the selected variant if present, for each replicate and ran the TSel algorithm using the neutral data alone to select features, transform features, and then calculate the mean and covariance matrix. We then calculated the Mahalanobis distance on both the neutral and the selected replicates and compared performance using the maximum F1-score, the harmonic mean of the classifier’s precision and recall (Sing et al. 2005).
The F1-score is an established metric for assessing method performance. Using precision and recall concentrates on assessing performance at lower false positive rates, which is important to minimize for natural selection inference, especially for outlier approaches for which high false positive rates are a principal source of error. With the sample sizes utilized here, the F1-score for randomly assigned calls is approximately 0.67. This results because the recall, or true positive rate, will be 1 at best when every point is called positive, and the precision, which is the number of true positives over the number of total points called positive by the method, will be 0.5. Therefore, the harmonic mean between a recall rate of 1 and a precision of 0.5 results in an F1-score of approximately 0.67. Because the F1-score is a single metric, we must choose a particular point on the precision–recall curve, corresponding to a particular threshold on the TSel score, and extract the respective precision and recall rates at that point. We selected the largest F1-score along the precision–recall curve, to represent overall performance.
For comparison, we also assessed the performance of other methods on the simulated data. For hard and soft sweeps, the positive selection scenarios, we compared TSel’s performance to levels of IBD and to alternate methods iHS, SF, and nSL (Nielsen et al. 2005; Voight et al. 2006; Albrechtsen et al. 2010; Han and Abney 2013; Ferrer-Admetlla et al. 2014). We did not use the CMS test because this test requires multiple cross-population statistics and we wanted to compare TSel’s performance with that of other methods that can detect selection within a homogeneous sample (Grossman et al. 2010). Levels of IBD were calculated by drawing a threshold 100 generations in the past, roughly the limit of inference power with current methods, and calling chromosomes that coalesced more recently than this threshold IBD. We then calculated the fraction of pairs at the selected locus that were IBD. We calculated the iHS statistic using the R package “rehh” and extracted the median absolute value of the iHS score for a 100-kb window around the selected locus as the consolidation appeared to improve performance (Gautier and Vitalis 2012). SF and nSL were run using their respective publications’ software packages.
To compare TSel’s performance on balancing selection, we ran the HKA test (Hudson et al. 1987). The HKA test is a standard test for balancing selection in genetic data. We ran Jodie Hey’s implementation of the HKA test (available at https://bio.cst.temple.edu/∼hey/program_files/HKA/HKA_Documentation.htm, last accessed June 27, 2015) using a window size of 10 kb, two loci, and one sample from the outgroup, following the original test procedure. We then assessed the method’s performance and compared power to TSel with F1-scores.
TSel Performance with Alternate Features
The anomaly detection method is not limited to using features of exact pairwise TMRCA distributions, and other groups of features may also perform well. For comparison, we ran the method with features derived from diversity. We output π, Watterson’s θ, and Tajima’s D directly from MSMS for the same simulation scenarios that we tested with the exact pairwise TMRCA features but calculated over a 10-kb window. Again, we extracted the selected locus from each replicate and assessed performance with F1-scores.
We also analyzed performance with inferred pairwise TMRCA values instead of exact pairwise TMRCA values output by the simulator. We ran this check to ensure that TSel maintains improved performance with current TMRCA inference methods, and is therefore suitable for real data applications. We also compared performance with features derived from diversity to ensure that inferred TMRCA is not simply a proxy for diversity. We tested the features on complete hard sweep simulations, as described above, with an effective population size of 10,000. Instead of inferring pairwise TMRCA on all pairs of chromosomes, we ran PSMC on 50 pairs of chromosomes from our sample of 100 to resemble within individual PSMC runs on real data. We then ran PSMC on the 50 chromosome pairs for each replicate and extracted the same features from the inferred pairwise TMRCA distributions as for the exact TMRCA distributions. After extracting these features, we ran TSel and compared TSel’s performance through F1-scores for exact pairwise TMRCA features, inferred pairwise TMRCA features, and diversity features.
TSel Performance When Including Selected Sites
The anomaly detection method assumes that selected sites are rare in the data upon which we calculate the mean and covariance matrix. However, a portion of real data will be under selection, and it is important to assess the performance of the method when these data points are included. We used complete hard sweep scenarios with an effective population size of 10,000 in order to test the effect of including selected sites. We included a range from 1% to 10% of data simulated under the selected scenario, calculated the mean and covariance on these data sets. We then calculated the F1-scores to assess the effect on performance for each percentage of selected data.
Application to CG Diversity Panel
To exemplify our algorithm on real data, we used the CG diversity panel consisting of 46 individuals from 9 different populations. CG generated the data with the CG Analysis Pipeline version 2.0.0 (Drmanac et al. 2010). The 46 individuals were sequenced to high coverage, approximately 80× average genome-wide, making these samples ideal for inference of pairwise TMRCA using the PSMC method.
Before running TSel on the CG diversity panel, we filtered extensively to avoid confounding factors. Li and Durbin (2011) note in their supplementary material, Supplementary Material online, that false positive variants increase the inferred TMRCA in all time intervals. False negatives will change the scaling of the inferred values but may be easily accounted for by appropriately scaling the neutral mutation rate. To limit false positives due to sequencing or mapping errors, we marked variants as missing if the variants did not pass the CG quality thresholds, were indels, were within 10 bp of indels, or had more than twice or less than half of the average individual coverage depth. We also identified regions that had abnormally high TSel scores, probably due to mapping errors, such as within large segmental duplications, and excluded these regions from the analysis. Additional details on filtering strategies are described in the supplementary material, Supplementary Material online.
After masking variants and regions based on the above criteria, we ran PSMC on the chromosome pairs within the 46 individuals genome-wide. We then calculated the TMRCA distribution features listed above from the inferred pairwise TMRCA values for each 100-bp window. After running TSel, we consolidated the TSel scores for each 100 bp window into 10-kb windows by taking the median score. In order to avoid spurious hits, we discarded 10-kb windows that had more than 50% of the 100-bp windows missing and used the remaining 10-kb window values for subsequent analyses. This consolidation procedure is not a requirement of the TSel method itself but a procedure to balance background noise and signal dilution due to either missing windows or variant call errors present in real data. With higher coverage data and fewer missing windows, smaller consolidating window could be used.
We submitted the top 1% of 10-kb windows to the program GREAT to examine gene ontology for the top TSel hits (McLean et al. 2010). We also compared the overlap of our top 1% regions to the results of the recent positive selection scan on the 1000 Genomes Project data and a balancing selection scan of human data to ensure that TSel replicates regions previously inferred to be under positive or balancing selection (Grossman et al. 2013; Leffler et al. 2013).
Supplementary Material
Supplementary material and figures S1–S19 are available at Molecular Biology and Evolution online (http://www.mbe.oxfordjournals.org/).
Acknowledgments
This work was supported by the National Institute of Health (R01 HG003229) and the Tri-Institutional Program in Computational Biology and Medicine.
References
- Akey JM. 2009. Constructing genomic maps of positive selection in humans: where do we go from here? Genet Res. 19(5):711–722. [DOI] [PMC free article] [PubMed] [Google Scholar]
- Albrechtsen A, Moltke I, Nielsen R. 2010. Natural selection and the distribution of identity-by-descent in the human genome. Genetics 186(1):295–308. [DOI] [PMC free article] [PubMed] [Google Scholar]
- Arbiza L, Zhong E, Keinan A. 2012. NRE: a tool for exploring neutral loci in the human genome. BMC Bioinformatics 13:301. [DOI] [PMC free article] [PubMed] [Google Scholar]
- Bamshad M, Wooding SP. 2003. Signatures of natural selection in the human genome. Nat Rev Genet. 4(2):99–111. [DOI] [PubMed] [Google Scholar]
- Bishop CM. 2006. Pattern recognition and machine learning (Information Science and Statistics). Secaucus (NJ): Springer-Verlag New York, Inc. [Google Scholar]
- Drmanac R, Sparks AB, Callow MJ, Halpern AL, Burns NL, Kermani BG, Carnevali P, Nazarenko I, Nilsen GB, Yeung G, et al. 2010. Human genome sequencing using unchained base reads on self-assembling DNA nanoarrays. Science 327(5961):78–81. [DOI] [PubMed] [Google Scholar]
- Ewing G, Hermisson J. 2010. MSMS: a coalescent simulation program including recombination, demographic structure and selection at a single locus. Bioinformatics 26(16):2064–2065. [DOI] [PMC free article] [PubMed] [Google Scholar]
- Fay JC, Wu CI. 2000. Hitchhiking under positive Darwinian selection. Genetics 155:1405–1413. [DOI] [PMC free article] [PubMed] [Google Scholar]
- Ferrer-Admetlla A, Liang M, Korneliussen T, Nielsen R. 2014. On detecting incomplete soft or hard selective sweeps using haplotype structure. Mol Biol Evol. 31(5):1275–1291. [DOI] [PMC free article] [PubMed] [Google Scholar]
- Garud NR, Messer PW, Buzbas EO, Petrov DA. 2015. Recent selective sweeps in North American Drosophila melanogaster show signatures of soft sweeps. PLOS Genet. 11(2):1–32. [DOI] [PMC free article] [PubMed] [Google Scholar]
- Gautier M, Vitalis R. 2012. rehh: an R package to detect footprints of selection in genome-wide SNP data from haplotype structure. Bioinformatics 28(8):1176–1177. [DOI] [PubMed] [Google Scholar]
- Gronau I, Hubisz MJ, Gulko B, Danko CG, Siepel A. 2011. Bayesian inference of ancient human demography from individual genome sequences. Nat Genet. 43(10):1031–1034. [DOI] [PMC free article] [PubMed] [Google Scholar]
- Grossman SR, Andersen KG, Shlyakhter I, Tabrizi S, Winnicki S, Yen A, Park DJ, Griesemer D, Karlsson EK, Wong SH, et al. 2013. Identifying recent adaptations in large-scale genomic data. Cell 152(4):703–713. [DOI] [PMC free article] [PubMed] [Google Scholar]
- Grossman SR, Shlyakhter I, Shylakhter I, Karlsson EK, Byrne EH, Morales S, Frieden G, Hostetter E, Angelino E, Garber M, et al. 2010. A composite of multiple signals distinguishes causal variants in regions of positive selection. Science 327(5967):883–886. [DOI] [PubMed] [Google Scholar]
- Han L, Abney M. 2013. Using identity by descent estimation with dense genotype data to detect positive selection. Eur J Hum Genet. 21:205–211. [DOI] [PMC free article] [PubMed] [Google Scholar]
- He X, Cai D, Niyogi P. 2005. Laplacian score for feature selection. In: Weiss Y, Schölkopf B, Platt JC, editors. Advances in Neural Information Processing Systems. Cambridge (MA): MIT Press. p. 507–514. [Google Scholar]
- Hudson R, Kreitman M, Aguadé M. 1987. A test of neutral molecular evolution based on nucleotide data. Genetics 116:153–159. [DOI] [PMC free article] [PubMed] [Google Scholar]
- Leffler EM, Gao Z, Pfeifer S, Ségurel L, Auton A, Venn O, Bowden R, Bontrop R, Wall JD, Sella G, et al. 2013. Multiple instances of ancient balancing selection shared between humans and chimpanzees. Science 339(6127):1578–1582. [DOI] [PMC free article] [PubMed] [Google Scholar]
- Li H, Durbin R. 2011. Inference of human population history from individual whole-genome sequences. Nature 475(7357):493–496. [DOI] [PMC free article] [PubMed] [Google Scholar]
- Li H, Wiehe T. 2013. Coalescent tree imbalance and a simple test for selective sweeps based on microsatellite variation. PLoS Comput Biol. 9(5):e1003060. [DOI] [PMC free article] [PubMed] [Google Scholar]
- McLean CY, Bristor D, Hiller M, Clarke SL, Schaar BT, Lowe CB, Wenger AM, Bejerano G. 2010. GREAT improves functional interpretation of cis-regulatory regions. Nat Biotechnol. 28(5):495–501. [DOI] [PMC free article] [PubMed] [Google Scholar]
- Nielsen R, Hellmann I, Hubisz M, Bustamante C, Clark AG. 2007. Recent and ongoing selection in the human genome. Nat Rev Genet. 8(11):857–868. [DOI] [PMC free article] [PubMed] [Google Scholar]
- Nielsen R, Williamson S, Kim Y, Hubisz MJ, Clark AG, Bustamante C. 2005. Genomic scans for selective sweeps using SNP data. Genome Res. 15(11):1566–1575. [DOI] [PMC free article] [PubMed] [Google Scholar]
- Rasmussen MD, Hubisz MJ, Gronau I, Siepel A. 2014. Genome-wide inference of ancestral recombination graphs. PLoS Genet. 10(5):e1004342. [DOI] [PMC free article] [PubMed] [Google Scholar]
- Ribeiro PJ, Jr, Diggle PJ. 2001. geoR: a package for geostatistical analysis. R-NEWS 1(2):14–18. [Google Scholar]
- Roach JC, Glusman G, Smit AFA, Huff CD, Hubley R, Shannon PT, Rowen L, Pant KP, Goodman N, Bamshad M, et al. 2010. Analysis of genetic inheritance in a family quartet by whole-genome sequencing. Science 328(5978):636–639. [DOI] [PMC free article] [PubMed] [Google Scholar]
- Sabeti P, Schaffner S, Fry B, Lohmueller J, Varilly P, Shamovsky O, Palma A, Mikkelsen T, Altshuler D, Lander E. 2006. Positive natural selection in the human lineage. Science 312(5780):1614. [DOI] [PubMed] [Google Scholar]
- Sheehan S, Harris K, Song Y. 2013. Estimating variable effective population sizes from multiple genomes: a sequentially Markov conditional sampling distribution approach. Genetics 194:647–662. [DOI] [PMC free article] [PubMed] [Google Scholar]
- Sing T, Sander O, Beerenwinkel N, Lengauer T. 2005. ROCR: visualizing classifier performance in R. Bioinformatics 21(20):3940–3941. [DOI] [PubMed] [Google Scholar]
- Tajima F. 1989. Statistical method for testing the neutral mutation hypothesis by DNA polymorphism. Genetics 595(3):585–595. [DOI] [PMC free article] [PubMed] [Google Scholar]
- Voight B, Kudaravalli S, Wen X, Pritchard J. 2006. A map of recent positive selection in the human genome. PLoS Biol. 4(3):446–458. [DOI] [PMC free article] [PubMed] [Google Scholar]
- Zhao Q, Okada K, Rosenbaum K, Kehoe L, Zand DJ, Sze R, Summar M, Linguraru MG. 2014. Digital facial dysmorphology for genetic screening: hierarchical constrained local model using ICA. Med Image Anal. 18(5):699–710 [DOI] [PubMed] [Google Scholar]
Associated Data
This section collects any data citations, data availability statements, or supplementary materials included in this article.


