

Abstract
Molecular evolution analysis of 16S rRNA sequences of native Pseudomonas strains and different fluorescent pseudomonads were conducted on the basis of Molecular Evolutionary Genetics Analysis version 5.2 (MEGA5.2). Topological evaluations show common origin for native strains with other known strains with available sequences at GenBank database. Phylogenetic affiliation of different Pseudomonas sp based on 16S rRNA gene shows that molecular divergence contributes to the genetic diversity of Pseudomonas sp. Result indicate direct dynamic interactions with the rhizospheric pathogenic microbial community. The selection pressure acting on 16S rRNA gene was related to the nucleotide diversity of Pseudomonas sp in soil rhizosphere community among different agricultural crops. Besides, nucleotide diversity among the whole population was very low and tajima test statistic value (D) was also slightly positive (Tajima׳s test statistics D value 0.351). This data indicated increasing trends of infection of soil-borne pathogens under gangetic-alluvial regions of West Bengal due to high degree of nucleotide diversity with decreased population of plant growth promoting rhizobacteria like fluorescent Pseudomonads in soil.
Keywords: Molecular diversity, Positive selection, 16S rRNA, MEGA5.2, Pseudomonas sp
Background
To determine the distribution of genotypes among the known species of fluorescent pseudomonads, the phylogenetic analysis was initially run with the sequences of 16S rDNA. Understanding of molecular evolution was needed to analyze phylogenetics based on 16S rDNA analysis. Several workers had been worked on phylognetic study of Pseudomonas sp. [1–3]. In the phylogenetic analysis research reported so far, identification of the primary phylogenetic groups based on their 16S rDNA sequences, and to compare the relative diversity were documented [4, 5]. There are now a large number of phylotypes that can be distinguished based on their 16S rDNA sequences but detection of purification or diversifying selection of nucleotide of 16S rDNA sequences were not yet studied in detail. Two types selection pressure was occurring in molecular evolution. Negative selection in 16S rDNA sequences might have decreased the population of rhizobacteria, while there had been particular interest in identifying positive selection because it provides evidence for adaptive changes in function. The statistics used to identify positive selection in these studies is the nonsynonymous to synonymous substitution rate ratio, (dN/dS). An excess of nonsynonymous substitutions (dN) over synonymous substitutions (dS) is an unambiguous indicator of positive natural selection at the molecular level [6, 7]. The novel objective of this study was to characterize effect of positive or diversifying selection on 16S rRNA gene of different soil rhizospher.
Methodology
DNA sequencing of 16S rDNA region of Pseudomonas sp and sequence analysis:
The sequence reaction was conducted using the Sanger dideoxy sequencing Sequencing kit (Applied Biosystems, Foster City) following the manufacturer's instructions. The trimmed nucleotide sequences of different Pseudomonas sp isolates were first locally aligned using Basic Local Alignment Search Tool (BLAST) algorithm provided by National Centre for Biotechnology Information (NCBI). 16S rDNA region of Pseudomonas sp isolates were deposited to the NCBI nucleotide data base through GenBank Bankit submission tools Table 1 (see supplementary material).
Sequence retrieval:
To compare the similarity or diversity, the nucleotide sequences need to be downloaded. 16S rDNA partial sequence of 60 selected Pseudomonas species namely P. aeruginosa, P. fluorescence, P. putida, P. Strutzeri were retrieved from NCBI: GenBank (http://www.ncbi.nlm.nih.gov/) with different geographical regions of world. The locations of sample׳s accession number depicted in Table 2 (see supplementary material).
Multiple sequence alignment and model selection for maximum likelihood analysis:
The multiple sequence alignment was performed using CLUSTALW 1.6 integrated in software MEGA5.05 [8]. To identify the most appropriate nucleotide substitution model for the 16S rDNA sequences, an algorithm was used which is implemented in MEGA 5.05 [8]. The nucleotide substitution matrix and transition-transversion bias (R) were estimated for best model of maximum likelihood method. The pattern of nucleotide substitution and transition-transversion bias was also estimated in Maximum Composite Likelihood algorithm with Tamura-Nei model [9].
Molecular evolutionary relationships analysis:
The evolutionary history was inferred using the Maximum likelihood method (ML) with most suitable model. The bootstrap consensus trees inferred from 1000 replicates were taken to represent the evolutionary history of the taxa analyzed. The ML trees were obtained using the Nearest- Neighbor-Interchange heuristic algorithm. All positions containing gaps and missing data were eliminated from the dataset (Complete Deletion option). Phylogenetic analyses were conducted in MEGA5.05 [10].
Estimation of different evolutionary parameters among different species of Pseudomonas:
The sequences of same species of Pseudomonas were grouped separately for easy estimation of diversity among different species. The mean diversity within subpopulations, diversity within a species population, inter-population diversity and coefficient of differentiation among the species groups were also estimated under kimura-2-parameter model [11] with 1000 bootstrap variance estimate method. The codon positions included were 1st+2nd+3rd+Noncoding for 16S rDNA gene. All the positions containing gaps and missing data were eliminated from the dataset (Complete deletion option).
Estimate of relative evolutionary rate and Tajima׳s Neutrality test:
The mean (relative) evolutionary rate for each site of nucleotide was estimated under Kimura-2-Parameter model [11] with invariant site (+I) as this model has third lower Bayesian Information Criterion (BIC) value just higher than Kimura 2- parameter model [11] and Jukes-Cantor [12] model with uniform rate. This final data set was subjected to Tajima's Neutrality Test [13] to evaluate the neutral theory of molecular evolution and to identify the population structure.
Results & Discussion
The sequences of the 16S rDNA region of some isolates have been submitted in NCBI database Table 1 (See supplementary material). All native Pseudomonas sp strains used in the study exhibited 96 to 99% sequence similarity to the either Pseudomonas aeruginosa or Pseudomonas sp available in NCBI database with lowest E-value and maximum query coverage and maximum identity. Similar works also reported by several scientists [14, 3, 15, 1, 16, 2]. Models with the lowest BIC scores (Bayesian Information Criterion) were considered to describe the substitution pattern the best. In this context K2 model (Kimura׳s two parameters) displayed lowest BIC scores with the value of 2732.4 Table 3 (see supplementary material) used to make consensus ML tree was drawn from these aligned sequences (Figure 1). The multiple alignment file was then used to create phylogram using MEGA5 software using the K2 model based on bootstrap analysis of 1000 replicates was performed to estimate the confidence of tree topologies. The evolutionary history was inferred by using the Maximum Likelihood method based on the Kimura 2-parameter model [8]. Initial tree(s) for the heuristic search were obtained automatically by applying Neighbor-Join and BioNJ algorithms to a matrix of pairwise distances estimated using the Maximum Composite Likelihood (MCL) approach, and then selecting the topology with superior log likelihood value. The tree is drawn to scale, with branch lengths measured in the number of substitutions per site. The analysis involved 60 nucleotide sequences. All positions containing gaps and missing data were eliminated. The Phylogenetic tree revealed that all the native strain fit in to an evolutionary cluster comprising members of Pseudomonas aeruginosa and other Pseudomonas sp grouped into separate cluster according to their relatedness (Figure 1). Molecular evolution of West Bengal Pseudomonas sp population was much closely related to Indian Pseudomonas strains which strongly supported the topology of native strain. On the basis of 16S rDNA sequence homology, different evolutionary parameters and topology of ML, it can be clearly depicted that West Bengal Pseudomonas sp population is much more closely related with Pseudomonas aeruginosa. The null hypothesis of equal evolutionary rate throughout the ML tree topology was rejected at a 5% significance level (Figure 1). So, the alternative hypothesis i.e., nucleotides showed different evolutionary rate was accepted. Using 16S rRNA sequences, [17] showed the phylogenetic affiliation of most Pseudomonas sp. According to relatedness of 16S rRNA sequences monophyletic clade was formed with genera Escherichia [18]. The closest phylogenetic relative was Escherichia coli with 99% 16S rDNA gene sequence similarity. Researcher also compared the environmental conditions of strains to reveal whether the phylogentic groups were correlated with their original geographical sites based on 16S rDNA sequences [19].
Figure 1.
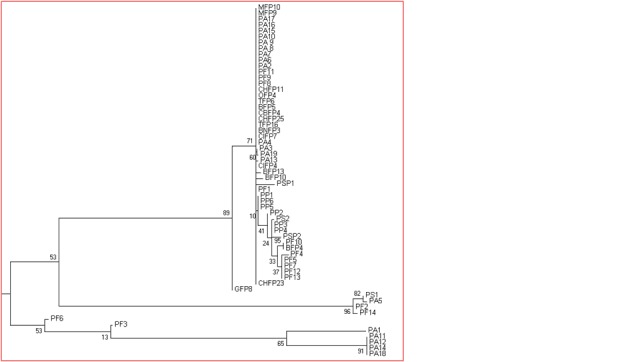
PSP: Pseudomonas sp, PA: Pseudomonas aeruginosa, PF: Pseudomonas fluorescens, PP: Pseudomonas putida, PS: Pseudomonas strutzeri; Maximum Likelihood relationship among different species of Pseudomonas in Worldwide collection.
The mean (relative) evolutionary rates (calculated in K2 parameter model) were scaled such that the average evolutionary rate across all sites was 1 [11]. This means that sites showing a rate < 1 are evolving slower than average and those with a rate > 1 are evolving faster than average (Figure 2). These relative rates were estimated under the model [20] (+I). A discrete Gamma (+G) distribution was used to model evolutionary rate differences among sites (1 category). Some sites were allowed to stay invariant (+I). It was clearly depicted from Figure 2. The maximum sites showed a mean (relative) evolutionary rate < 1and thus it can be concluded that maximum sites showed evolutionary rate slower than the average rate.
Figure 2.
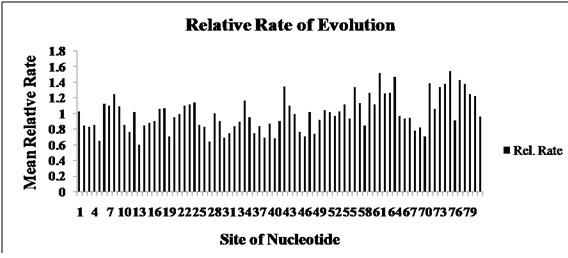
The mean (relative) evolutionary rates (calculated in K2 + I parameter model) were scaled such that the average evolutionary rate across all sites was 1. This means that sites showing a rate < 1 are evolving slower than average and those with a rate > 1 are evolving faster than average.
Tajima׳s neutrality test [13] clearly indicated that the nucleotide diversity (π) among the population was 0.230 and Tajima test statistic (D) was 0.351 Table 4 (see supplementary material). In this study, comparative sequence analysis was carried out to determine molecular evolutionary divergence and classify the sequences into different species of Pseudomonas like Pseudomonas aeruginosa, Pseudomonas fluorescens, Pseudomonas putida etc. In this study, comparative sequence analysis was carried out to determine molecular evolutionary divergence and classify the sequences into different species of Pseudomonas like Pseudomonas aeruginosa, Pseudomonas fluorescens, Pseudomonas putida etc. In addition, nucleotide substitution was evaluated in respect of different species of Pseudomonas to understand nucleotide divergences like mean evolutionary diversity within entire population and Subpopulations; mean inter population diversity, coefficient differentiation over species pairs but it was remarkable that the species of Pseudomonas from West Bengal attributed the low degree of diversity (0.010) Table 5 (see supplementary material). Several works had been demonstrated for considering the possible source of diversifying selection of different protein coding gene of bacteria like Pseudomonas. The different gene responsible for production of different protein showed diversifying selection [21–23], but this study first time demonstrated diversifying selection based molecular evolution at 16S rRNA gene. Molecular evolution of West Bengal Pseudomonas sp population was much closely related to Indian strains which strongly supported the topology of native strain. In this study Selection pressure supportive molecular evolution was hypothesized. The current analysis clearly depicted that the maximum sites in 16S rDNA region evolved in much slower rate than average. Besides, nucleotide diversity among the whole population was very low and tajima test statistic value (D) was also slightly positive. From the consequences of above result two possibilities can be assumed that either the population may have suffered a recent bottleneck (or be decreasing) or may have evidence for over dominant selection at this locus.
Conclusion
Distinct selection pressure was first time detected to estimate the mechanism underlying the evolution of the nucleotide sequences and population structure of Pseudomonas sp in soil community. In the present study, the determination of molecular evolution and population structure of native fluorescent Pseudomonads using bioinformatics tools, it can be concluded that it would create a new threat of pathogen infection in crop plants under gangetic alluvial zone of West Bengal, India due to bottleneck population structure of Pseudomonas sp in soil. If the Pseudomonas sp population has recently undergone a bottleneck, the nucleotide diversity of Pseudomonas sp will little be affected in soil community gradually resulting fluorescent Pseudomonads strains would not be able to control the crop disease in eco-friendly manner by reducing the use of harmful chemicals, along with enhancing the productivity of different crops. In this concern, this is the right time to focus our attention for altering the soil environment through organic and bio inputs for enhancing the population of native rhizobacteria and thereby converting the soil suppressive against pathogens. However, it is becoming important to map these pseudomonad populations in order to select “consortia” of different rhizospheric plant growth promoting bacteria for biological control for different hostpathogenic system instead of using any one species/strain of Fluorescent Pseudomonad.
Supplementary material
Footnotes
Citation:Adhikari et al, Bioinformation 11(10): 474-480 (2015)
References
- 1.Elomari M, et al. Int J Syst Bacteriol. 1997;47:846. doi: 10.1099/00207713-47-3-846. [DOI] [PubMed] [Google Scholar]
- 2.Dabboussi F, et al. Res Microbiol. 1999;150:303. doi: 10.1016/s0923-2508(99)80056-4. [DOI] [PubMed] [Google Scholar]
- 3.Elomari M, et al. Int J Syst Bacteriol. 1996;46:1138. doi: 10.1099/00207713-46-4-1138. [DOI] [PubMed] [Google Scholar]
- 4.Godfrey SAC, et al. J Appl Microbiol. 2001;91:412. doi: 10.1046/j.1365-2672.2001.01398.x. [DOI] [PubMed] [Google Scholar]
- 5.Behrendt U, et al. Int J Syst Evol Microbiol. 2007;57:979. doi: 10.1099/ijs.0.64793-0. [DOI] [PubMed] [Google Scholar]
- 6.Hughes AL, Nei M. Nature. 1988;335:167. doi: 10.1038/335167a0. [DOI] [PubMed] [Google Scholar]
- 7.Yang Z, Bielawski JP. Trends Ecol Evol. 2000;15:496. doi: 10.1016/S0169-5347(00)01994-7. [DOI] [PMC free article] [PubMed] [Google Scholar]
- 8.Tamura K, et al. Mol Biol Evol. 2011;28:2731. doi: 10.1093/molbev/msr121. [DOI] [PMC free article] [PubMed] [Google Scholar]
- 9.Tamura K, Nei M. Mol Biol Evol. 1993;10:512. doi: 10.1093/oxfordjournals.molbev.a040023. [DOI] [PubMed] [Google Scholar]
- 10.Tamura K, et al. Mol Biol Evol. 2007;24:1596. doi: 10.1093/molbev/msm092. [DOI] [PubMed] [Google Scholar]
- 11.Kimura M. J Mol Evol. 1980;16:111. doi: 10.1007/BF01731581. [DOI] [PubMed] [Google Scholar]
- 12.Jukes TH, Cantor CR. In: Mammalian Protein Metabolism. Munro HN, editor. New York: Academic Press; 1969. pp. 121–132. [Google Scholar]
- 13.Tajima F. Genetics. 1989;123:585. doi: 10.1093/genetics/123.3.585. [DOI] [PMC free article] [PubMed] [Google Scholar]
- 14.Kersters K, et al. Syst Appl Microbiol. 1996;19:465. [Google Scholar]
- 15.Coroler L, et al. Syst Appl Microbiol. 1996;19:600. [Google Scholar]
- 16.Dabboussi F, et al. Int J Syst Bacteriol. 1999;49:1091. doi: 10.1099/00207713-49-3-1091. [DOI] [PubMed] [Google Scholar]
- 17.Anzai Y, et al. Int J Syst Evol Microbiol. 2000;50:1563. doi: 10.1099/00207713-50-4-1563. [DOI] [PubMed] [Google Scholar]
- 18.Siraj Ud Din MM, et al. Bioinformation. 2011;6:370. [Google Scholar]
- 19.Peng H, et al. Biochem Mol Biol. 2006;39:178. doi: 10.5483/bmbrep.2006.39.2.178. [DOI] [PubMed] [Google Scholar]
- 20.Tamura K. Mol Biol Evol. 1992;9:678. doi: 10.1093/oxfordjournals.molbev.a040752. [DOI] [PubMed] [Google Scholar]
- 21.Smith EE, et al. J Bacteriol. 2005;187:2138. doi: 10.1128/JB.187.6.2138-2147.2005. [DOI] [PMC free article] [PubMed] [Google Scholar]
- 22.Polley SD, Conway DJ. Genetics. 2001;158:1505. doi: 10.1093/genetics/158.4.1505. [DOI] [PMC free article] [PubMed] [Google Scholar]
- 23.Boyd EF, Hart DL. J Mol Evol. 1998;47:258. doi: 10.1007/pl00006383. [DOI] [PubMed] [Google Scholar]
Associated Data
This section collects any data citations, data availability statements, or supplementary materials included in this article.