

Abstract
High-energy photon detectors are often made thick in order to improve their photon-detection efficiency. To avoid issues of parallax and increased signal variance that result from random interaction depth, we must determine the 3D interaction position in the imaging detector. With this goal in mind, we examine a method of calibrating response statistics of a thick-detector gamma camera to produce a maximum- likelihood estimate of 3D interaction position. We parameterize the mean detector response as a function of 3D position and estimate the parameters by maximizing their likelihood given prior knowledge of the pathlength distribution and a complete list of camera signals for an ensemble of gamma-ray interactions. Demonstrating this calibration method with simulated gamma-camera data, we show that the resulting calibration is accurate and can be used to produce unbiased estimates of 3D interaction position.
I. Introduction
Detectors used for high-energy photon detection are often made thick in order to improve their photon-detection efficiency. Use of a thick detector material, in turn, motivates our need to estimate depth of interaction (DOI) for each gamma ray. If we estimate only the 2D position of interaction in a gamma camera, ambiguity in DOI may result in a loss of detector and/or image resolution [1]. Random DOI can cause increased signal variance, which in turn can degrade the 2D resolution of a gamma camera. Additionally, DOI ambiguity for obliquely incident gamma rays causes parallax, which can subsequently limit image resolution. Random DOI can also degrade coincidence-timing resolution for a time-of-flight PET system [2]. For many clinical gamma cameras with moderately thick scintillators (<10 mm), signal-variance and parallax issues are mitigated by choice of camera geometry and optical properties. However, to avoid these issues in general for a thicker gamma-ray detector, we must estimate the 3D coordinates of interaction.
A variety of statistical methods for estimating DOI in a thick monolithic detector have been suggested [1, 3-5]. To make efficient use of information contained by the camera signals g = {gm, m = 1…M}, we determine the 3D interaction position R = {x, y, z} by maximum likelihood (ML) estimation [1, 6]:
| (1) |
Here, the operator argmax maximizes its operand with respect to the indicated parameter, and the caret denotes a parameter estimate. The operand pr(g ∣ R, E) is a probability model of g given R and energy E. However, interpreted as a function of the parameters R and/or E for given g, pr(g ∣ R, E) is called a likelihood function. In this paper, we assume E to be known and we estimate just R. An equivalent and often more convenient method of finding an ML estimate is to maximize the log likelihood ln[pr(g ∣ R, E)].
To generate this ML estimate, we need a model for pr(g ∣ R, E), and we must calibrate representative statistics of this model as a function of R for given E. Experimentally, we hold R and E fixed and measure g for an ensemble of gamma rays. Lateral interaction position and energy of a gamma ray are controlled by tightly collimating a known source. However, gamma-ray pathlength is beyond our control and remains a random variable.
In this work, we show how to use prior knowledge of the pathlength distribution and the set of observations for an ensemble of gamma-ray interactions to calibrate 3D model statistics. We demonstrate this method by simulation of signal generation and output from a monolithic-scintillator gamma camera. For this purpose, we use a photon-transport Monte Carlo algorithm (SCOUT) described in Chapter 4 of [7].
II. Modeling pr(g ∣ R, E)
We consider the detector response to single-interaction (photoelectric) events in a thick scintillation camera with multi-anode photomultiplier tube (MA-PMT) readout (Figure 1). The fraction of scintillation light collected by each PMT is small due to geometric and quantum collection efficiency. A low efficiency binomial selection of scintillation light results in an independent Poisson probability model for each PMT input signal [8]. Assuming negligible electronic and gain noise, the probability for the PMT output signals is then modeled as a multivariate scaled-Poisson:
| (2) |
Here, ⟨…⟩ is an ensemble average and u(…) is a rounding operator. There are a total of M photodetectors (channels). For the mth photodetector, Gm is the channel gain, Nm is the number of input photoelectrons, and is the mean of Nm for given R and E. We often refer to the vector as the mean detector response function (MDRF). Hence, to characterize pr(g ∣ R, E), we only need to determine Gm and for each photodetector.
Fig. 1.
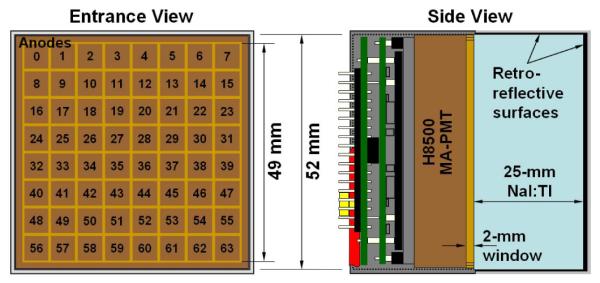
Diagram of simulated test camera.
III. Calibrating
To calibrate the 3D MDRF, we chose a parametric representation such as a polynomial (see Section IV), and then we estimate the parameters for this representation. Let Θ ≡ {Θi, i = 1…I} be a set of parameters representing the mean detector response functions for the M photodetectors, . The data from which we want to estimate the parameters is the set of observations, Γ ≡ {γj, j = 1…J}, for J events produced using a collimated gamma-ray source to control the position and orientation of incident gamma rays (Fig. 2). Observations γj for the jth gamma ray consist of the camera signals Nj ≡ {Nmj, m = 1…M}, and event tags specifying the beam position R0j, the beam orientation sj, and the gamma-ray energy Ej. Thus, we calibrate by estimating the parameters Θ that maximize the likelihood pr(Γ ∣ Θ) for given list-mode data Γ:
| (3) |
Fig. 2.
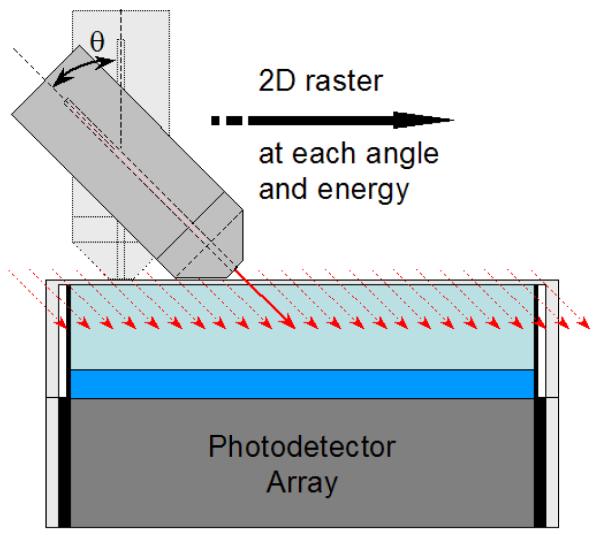
Acquisition of data for calibrating the detector response statistics as a function of 3D position of interaction. For the current work, the detector response is simulated for an ensemble of gamma rays on a regular 1.52 mm-spaced 2D array of collimator beam positions. Calibration data can also include various gamma-ray beam angles and energies.
The responses for different gamma-ray events are independent. If we have prior knowledge of the pathlength (L) distribution pr(L ∣ R0j), we can express ln[pr(Γ ∣ Θ)] as:
| (4) |
where for a multivariate scaled-Poisson:
| (5) |
Note that scales with the average amount of light produced by a gamma-ray interaction. Thus, with knowledge of the average energy dependence of scintillator light yield f(E) (as in [9]), we can separate the energy dependence of :
| (6) |
We can then use multiple gamma-ray energies to calibrate just the spatial dependence of the MDRF, η(R, Θ).
IV. Parametric Representation of η(R, Θ)
Various choices of Θ exist. For example, we can use a regular array of discrete samples (voxels). Another approach is to use a physical model for light propagation with several free parameters. Alternatively, since η(R, Θ) should vary smoothly with R, we may choose Θ as the set of parameters for an analytic form (e.g., see [10]).
For example, we use a hybrid approach; we fit the response as a function of depth with a cubic polynomial for each calibration beam position: Θ = {ck, k = 1…K}.
| (7) |
For this representation, we assume K normally oriented calibration beam positions that adequately sample the detector area. The parameters for each beam position, ck, are a set of 4 × M coefficients, where M is the number of photodetectors. ML estimation of Θ in this case conveniently separates into K optimization problems of 4 × M parameters each:
| (8) |
V. Filtering Multiple Interactions
We must filter multiple interaction events to calibrate for single interactions. We do so by applying a likelihood threshold on the 3D-position estimate of each gamma ray. We also use prior knowledge of the calibration beam profile to remove events whose position estimates are outside of the beam profile.
For an experimental calibration, a simulated 3D MDRF can serve as an initial estimate of . For this simulated proof of concept, we use the 2D MDRF, marginalizing depth and assuming no depth sensitivity. We then refine our estimate of by maximizing pr(Γ ∣ Θ) given the remaining events. We iterate this process of event filtering and estimation of Θ until a steady-state solution is reached (Fig. 3). We keep a portion of the events in each iteration that is consistent with the fraction of gamma rays expected to result in a photoelectric primary interaction.
Fig. 3.
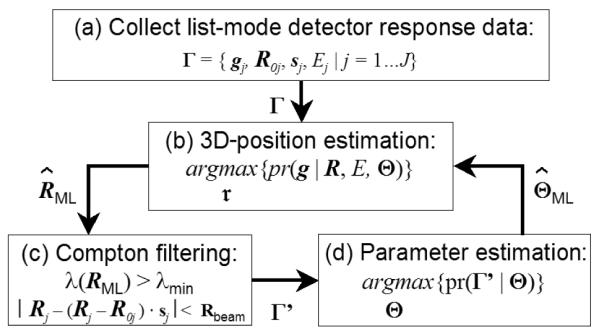
Calibration procedure of detector response statistics (i.e., as a function of 3D interaction position. (a) The detector response is measured for an ensemble of gamma rays with known input position, direction, and energy. Event data are initially filtered to keep only photopeak events. (b) An ML estimate of 3D position for each photopeak event is determined. An initial estimate of is made (from 2D MDRF or simulation). (c) Photopeak event data are filtered further by applying a likelihood threshold on 3D-position ML estimate and by using prior knowledge of the collimated beam profile. (d) An ML estimate of Θ is made. Steps (b)–(d) are repeated until a steady-state solution is reached.
VI. Pathlength Distribution
In a homogeneous detector, we expect gamma-ray pathlength to be exponentially distributed. However, due to imperfect filtering of multiple interaction events, the pathlength distribution of the calibration data is not given by Beer’s law as expected. Rather, this distribution depends on the detector geometry, the gamma-ray energy, direction and entrance position, and the specific event filter being used. We rely on simulation to determine pr(L ∣ R0j, sj, Ej) for a specific detector and filter; see Fig. 4.
Fig. 4.

Probability density of pathlength for normally incident gamma rays at the test camera center: (right) all gamma rays, and (left) filtered gamma rays. Events are filtered using a radial window of 1 mm about the beam axis and a likelihood threshold that retains a constant fraction of events equal to the photoelectric branching ratio.
VII. Results of a Simulated Calibration
We performed Monte-Carlo (MC) simulations of gamma-ray interaction, light yield, and optical transport in the test camera design shown in Fig. 1 using the SCOUT simulation tool reported in [7]. Amplification noise and electronic noise were assumed negligible for this simulation.
Making use of the filtering and calibration methods described above, we produced an estimate of . We examined two cases: use of just 511 keV gamma rays and use of a combination of 4 energies: 140, 171, 245, and 511 keV. Representative results for these calibrations of are shown in Fig. 5. The 3D-MDRF was calibrated on a 1.52-mm lateral grid of beam positions. Interpolating the calibrated 3D-MDRF to a 0.76-mm lateral grid, we then generated 3D-position estimates for simulated 511 keV gamma-ray interactions of a perfectly collimated 45°-slanted beam (shown in Fig. 6). To reject events not likely to have been produced under the assumed signal probability model and to improve estimate variance, we applied a threshold on the estimate likelihood. For the test-camera design that is simulated, resolution of interaction position is on the order of the estimate grid size (0.76 mm).
Fig. 5.

Cross section of true vs. ML estimate of as a function of depth (z) for several anodes with interactions through the camera center (x = y = 0). The position of these anodes and the lateral interaction position in this case are indicated in the anode grid shown near the top of this figure. The accuracy of fit is similar for other anodes and other positions. The estimate of approximates the cubic least squares fit in each case.
Fig. 6.

Cross section (y = 0) of 3D ML-estimate distribution for a perfectly collimated 45°-slanted 511 keV gamma-ray beam using the 4-energy ML estimate for : (top) estimate distribution for all events, (bottom) a likelihood threshold is used to remove events not likely to be primary photoelectric interactions.
To measure detector spatial-resolution as a function of position, we can interpolate the MDRF and image a slant-beam at different positions in the detector. Alternatively, for an ML estimator, we can compute bounds on detector spatial-resolution predicted by Fisher information theory [6-7]. In Fig. 7, we show the Cramér-Rao bound on lateral resolution and depth resolution of 511 keV gamma rays interacting in the test camera.
Fig. 7.

Cramér-Rao bound of (top) depth and (bottom) lateral detector resolution (FWHM) on a vertical cross section (y = 0) of the test camera for 511 keV gamma rays.
VIII. Conclusions and Outlook
By maximizing the list-mode likelihood, pr(Γ ∣ Θ), with prior knowledge of pathlength distribution, we are able to accurately calibrate detector response statistics as a function of 3D interaction position in a gamma camera. Accuracy of the 3D-MDRF calibration for the case considered was limited primarily by the parametric representation chosen. In addition, we found that use of multiple gamma-ray energies did not significantly improve calibration accuracy. However, this latter conclusion may depend on the number of events used to perform the calibration.
Making use of the calibrated 3D-position likelihood model, we have then shown how to estimate the 3D interaction position. We reject events not likely to have been produced under the assumed signal probability model by applying a threshold on estimate likelihood. The Cramér-Rao bound on spatial resolution for the simulated test-camera design was determined to be sub-millimeter for most of the detector volume in both lateral and depth dimensions.
Experimental calibration of detector response statistics as a function of 3D interaction position is an area of future work. In a companion presentation [11], a related calibration method is used to examine the 3D response function of an experimental camera. Here, a locally scaled solid-angle model is used to parametrically represent the 3D MDRF; scaling coefficients are then chosen to fit the observed spectra for normal calibration-beam data.
The use of list-mode likelihood for calibration of response statistics as a function of 3D position was demonstrated for a continuous-scintillator gamma camera, but is generally applicable for other camera types and geometries. For instance, list-mode calibration of detector response statistics with DOI can similarly be applied to segmented detectors. However, in this case, the detector response is discontinuous across segment boundaries. Therefore, the parametric representation of the MDRF that we use should reflect this fact. Calibration of each detector segment can be performed independently.
Having adequately calibrated the detector response for single interactions, we can mitigate issues of parallax and signal variance due to random interaction depth. The topic of multiple-interaction parameter estimation is another area of work that can be expanded upon once we can adequately calibrate the detector response for single interactions (see Section 3.3.6 of [7]).
Acknowledgments
This work was supported in part by the U.S. National Institutes of Health NIBIB under Grant P41-EB002035.
Contributor Information
William C. J. Hunter, Department of Physics and is now appointed in the Department of Radiology, University of Arizona, Tucson, AZ 85724 USA (whunter@email.arizona.edu).
Harrison H. Barrett, Department of Radiology, the College of Optical Sciences, the Applied Mathematics Program, and the Biomedical Engineering Program, University of Arizona, Tucson, AZ 85724 USA (hhb@email.arizona.edu)..
Lars R. Furenlid, Department of Radiology, the College of Optical Sciences, and the Biomedical Engineering Program, University of Arizona, Tucson, AZ 85724 USA (furen@radiology.arizona.edu)..
Stephen K. Moore, Biomedical Engineering Program, University of Arizona, Tucson, AZ 85724 USA (smoo@email.arizona.edu)..
References
- [1].Gagnon D, Pouliot N, Laperrikre L, Therrien M, Olivier P. Maximum likelihood positioning in the scintillation camera using depth of interaction. IEEE Trans. Med. Imag. 1993;12(no. 1):101–107. doi: 10.1109/42.222673. [DOI] [PubMed] [Google Scholar]
- [2].Ivan A, Burr KC, Shao Y, LeBlanc JW. Depth of interaction effect on timing resolution in PET block detectors. Nucl. Sci. Symp. Conf. Rec. 2004;7:4156–4158. [Google Scholar]
- [3].Lerche CW, Benlloch JM, Sánchez F, Pavón N, Escat B, Gimenez EN, Fernández M, Torres I, Giménez M, Sebastià A, Martínez J. Depth of γ-ray interaction within continuous crystals from the width of its scintillation light-distribution. IEEE Trans. Nucl. Sci. 2005;52(no. 3):560–572. [Google Scholar]
- [4].Seidel J, Vaquero JJ, Siegel S, Gandler WR, Green MV. Depth identification accuracy of a three-layer phoswich PET detector module. IEEE Trans. Nucl. Sci. 1999;46(no. 3):485–490. [Google Scholar]
- [5].Ling T, Lewellen TK, Miyaoka RS. Depth of interaction decoding of a continuous crystal detector module. Phys. Med. Bio. 2007;52:2213–2228. doi: 10.1088/0031-9155/52/8/012. [DOI] [PubMed] [Google Scholar]
- [6].Barrett HH, Myers KJ. Foundations of Image Science. John Wiley and Sons, Inc.; New York: 2004. [Google Scholar]
- [7].Hunter WCJ. Ph.D. dissertation. University of Arizona; 2007. Modeling Stochastic Processes in Gamma-Ray Imaging Detectors and Evaluation of a Multi-Anode PMT Scintillation Camera for Use with Maximum-Likelihood Estimation Methods. [Google Scholar]
- [8].Barrett HH. Small-Animal SPECT Imaging. Springer Science+Business Media, Inc.; New York: 2005. Detectors for small-animal SPECT II: Statistical limitations and estimation methods. Chapter 3. [Google Scholar]
- [9].Rooney BD, Valentine JD. Scintillator light yield nonproportionality: Calculating photon response using measured electron response. IEEE Trans. Nucl. Sci. 1997;44(no. 3):509–516. [Google Scholar]
- [10].Tomitani T, Futami Y, Iseki Y, Kouda S, Nishio T, Murakami T, Kitagawa A, Kanazawa M, Urakabe E, Shinbo M, Kanai T. Depth encoding of point-of-interaction in thick scintillation cameras. Nucl. Sci. Symp. Conf. Rec. 1999;3:1182–1186. [Google Scholar]
- [11].Moore SK, Hunter WCJ, Furenlid LR, Barrett HH. Maximum-likelihood estimation of 3D event position in monolithic scintillation crystals: experimental results. Nucl. Sci. Symp. and Med. Imag. Conf. Rec. 2007:M19–23. doi: 10.1109/NSSMIC.2007.4436923. to be published. [DOI] [PMC free article] [PubMed] [Google Scholar]