Abstract
Simple sequence repeats (SSRs) are widespread units on genome sequences, and play many important roles in plants. In order to reveal the evolution of plant genomes, we investigated the evolutionary regularities of SSRs during the evolution of plant species and the plant kingdom by analysis of twelve sequenced plant genome sequences. First, in the twelve studied plant genomes, the main SSRs were those which contain repeats of 1–3 nucleotides combination. Second, in mononucleotide SSRs, the A/T percentage gradually increased along with the evolution of plants (except for P. patens). With the increase of SSRs repeat number the percentage of A/T in C. reinhardtii had no significant change, while the percentage of A/T in terrestrial plants species gradually declined. Third, in dinucleotide SSRs, the percentage of AT/TA increased along with the evolution of plant kingdom and the repeat number increased in terrestrial plants species. This trend was more obvious in dicotyledon than monocotyledon. The percentage of CG/GC showed the opposite pattern to the AT/TA. Forth, in trinucleotide SSRs, the percentages of combinations including two or three A/T were in a rising trend along with the evolution of plant kingdom; meanwhile with the increase of SSRs repeat number in plants species, different species chose different combinations as dominant SSRs. SSRs in C. reinhardtii, P. patens, Z. mays and A. thaliana showed their specific patterns related to evolutionary position or specific changes of genome sequences. The results showed that, SSRs not only had the general pattern in the evolution of plant kingdom, but also were associated with the evolution of the specific genome sequence. The study of the evolutionary regularities of SSRs provided new insights for the analysis of the plant genome evolution.
Introduction
Plant genomes are filled with low-complexity repetitive sequences. One of the most frequent low complexity sequences is simple sequence repeats (SSRs, defined as1~6 bp unit) [1]. Studies have shown that SSRs have many important biological functions, such as the regulation of chromatin organization, DNA metabolic processes, gene activity and RNA structure [2–4]. SSRs have therefore emerged as the third major class of genetic variations, alongside copy number variations and single nucleotide polymorphisms [5].
SSRs in plant genome sequences evolve along with the plant gene and genome evolution. Gene and genome duplications are major driving forces of gene diversification and evolution [6]. Angiosperms are paleopolyploids, that is to say the genome of their common ancestor was subject to a large-scale or even genome wide duplication event during the Late Jurassic or Early Cretaceous, 100~160 million years ago [7–8]. This duplication event might have triggered the angiosperm radiation during the Late Cretaceous, which is apparent in fossil record [9]. There are evidences for several other large-scale or genome-wide duplication events among the angiosperms [8, 10–17]. The core eudicotyledon apparently duplicated their genomes in the Late Cretaceous, while the common ancestor of the Brassicales did so again in the Cenozoic [8, 18]. Moss P. patens is a paleopolyploid as well. The genome duplication to have occurred between 30 and 60 million years ago [19]. Interestingly, the retention of genes after such large-scale duplication events has been shown to be biased towards certain functional classes [20–22]. It has been argued that such biased retention of duplicated genes were a driving force for morphological complexity, increase in biological diversity and eukaryote adaptive radiation [8, 23].
At the same time SSRs themselves are variations. One striking feature of SSRs is its high mutation rate [24]. It is established that SSRs exhibit a very high expansion/contraction rate, mainly through replication errors caused by DNA polymerase strand slippage [25–27]. A typical insertion/deletion event will add/remove one unit, meanwhile changes of several units have also been observed [28]. Theoretically, shorter units allow for more potential replication slippage events per unit length of DNA [29] and are thus likely to be more unstable and carry higher mutation rates [30–31]. It has also been proved that the bases substitution rate is increased in the SSRs sequences [32–33] as well as in their flanking regions [34]. In view of the above experimental evidences, SSRs can be regarded as mutational hot spots in genome sequences.
The distributions and characteristics of SSRs in plant genomes and their relation with the annotated genome components, mainly as genes sequences (including introns and exons), promoters and transposable elements, have been investigated [35–38]. However, the evolution regularities of SSRs in individual plant genomes and plant kingdom evolution have not been extensively studied. In this paper, we studied the evolution regularities of SSRs in individual plant genome and plant kingdom and expected to shed insights onto the evolution of plant genome sequences.
Materials and Methods
1. Genome sequences
In this study, four dicotyledon species (Arabidopsis thaliana Col-0 (A. thaliana), Glycine max (G. max), Vitis vinifera (V. vinifera), Solanum lycopersicum (S. lycopersicum)), four monocotyledon species (Brachypodium distachyon (B. distachyon), Oryza sativa Japonica Group (O. sativa), Sorghum bicolor (S. bicolor), Zea mays (Z. mays)), one ferm species (Selaginella moellendorffii (S. moellendorffii)), one moss species (Physcomitrella patens (P. patens)), and two algae species (Chlamydomonas reinhardtii (C. reinhardtii), Volvox carteri (V. carteri)) were selected for analysis. To analyze whether the SSR distribution pattern is occurring randomly, the other two ecotypes of A. thaliana and Drosophila melanogaster (D. melanogaster) were selected for calculation. The genome sequences of A. thaliana (Col-0), B. distachyon, G. max, O. sativa (Japonica Group), S. lycopersicum, V. vinifera and D. melanogaster were downloaded from the National Center for Biotechnology Information (NCBI) genome database (ftp://ftp.ncbi.nlm.nih.gov/genomes/). The genome sequences of C. reinhardtii, P. patens, S. moellendorffii, S. bicolor and Z. mays were downloaded from the Ensembl plant database (http://plants.ensembl.org/). The genome sequence of V. carteri was downloaded from the PlantGDB dababase (http://www.plantgdb.org/). The genome sequences of A. thaliana ecotypes Ler-0 and Ws-0 were downloaded from http://mus.well.ox.ac.uk/19genomes/fasta/MASKED/. Details showed in S1 Table.
2. SSRs analysis
SSRs in these twelve plant genome sequences were harvested with a Perl program specifically developed for this paper (see S1 File: perl_program_for_SSR_analyze.rar). We defined a mononucleotide repeat unit with no less than six ((N)x, x≥6; N: A, T, G or C) and di- to hexnucleotide repeats units with no less than three ((N(2–6))x, x≥3, N: A, T, G or C).
In the percentage analysis of SSRs section, we classified nucleotide combinations according to the principle of complementary base and sequence of nucleotide combination and analyzed the data according to different nucleotide combination groups. In mononucleotide SSRs, we classified adenine (A) repeat SSRs and thymine (T) repeat SSRs as a group; cytosine (C) repeat SSRs and guanine (G) repeat SSRs as another group. In dinucleotide SSRs, twelve nucleotide combinations were classified into four groups, named AT/TA, CG/GC, AC/GT/CA/TG and AG/CT/GA/TC. In trinucleotide SSRs, sixty nucleotide combinations were classified into ten groups, named AAT/ATT/ATA/TAT/TAA/TTA, AAC/GTT/ACA/TGT/CAA/TTG, AAG/CTT/AGA/TCT/GAA/TTC, ATC/GAT/TCA/TGA/ATG/CAT, ACT/AGT/CTA/TAG/GTA/TAC, ACC/GGT/CCA/TGG/CAC/GTG, AGG/CCT/GGA/TCC/CTC/GAG, ACG/CGT/CGA/TCG/GAC/GTC, AGC/GCT/GCA/TGC/CAG/CTG and CCG/CGG/CGC/GCG/GCC/GGC. In this section we chose SSRs groups with the same nucleotide number SSRs units as a whole (100%) in a species.
In the percentage analysis of SSRs based on repeat number section, we chose SSRs containing the same repeat number and having more than 1000 total SSRs number to analyze. We chose SSRs groups with the same repeat number and the same nucleotide number SSRs units as a whole (100%) in a species.
3. Cluster analysis
The symmetrized Kullback–Leibler divergence analysis [39], a quantity that measures the difference between two subpopulations p and q was defined as , was according to percentage of dinucleotide combination and trinucleotide combination, p(x) and q(x) represent the percentage of the same nucleotide compositions in two species respectively, x represents different nucleotide combinations. All pairs of comparisons between the thirteen genomes were performed (including control). The cluster analysis was performed by using the UPGMA method of MEGA4 software package according to the symmetrised Kullback–Leibler divergence analysis.
Results
1. Genome size and GC content
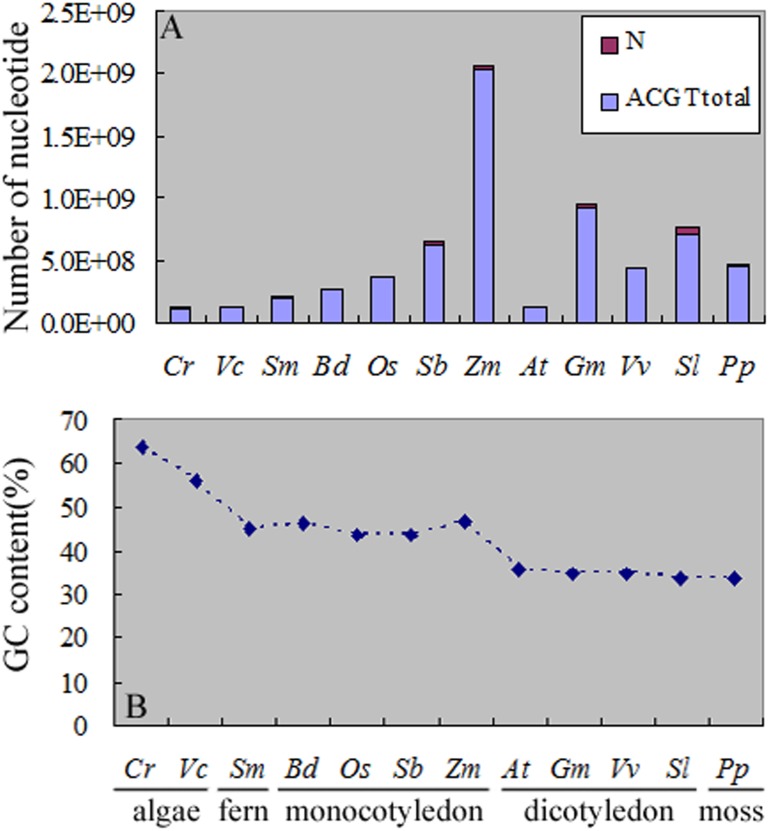
Among these twelve plants the genome sizes of C. reinhardtii (105,409,962 nucleotides), V. carteri (125,353,261 nucleotides) and A. thaliana (118,960,141 nucleotides) (referring to the ecotype Col-0 hereinafter if not labeled) were smaller than the others, and the Z. mays genome (2,046,695,782 nucleotides) was the largest (Fig 1A). We calculated the nucleotide percentage of these genomes. The percentage of adenine (A) was approximately equal to that of thymine (T) in the twelve plant single-stranded genome sequences. The cytosine (C) and guanine (G) showed the same trend (S1 Fig). In the twelve plants C. reinhardtii (63.87%) and V. carteri (56.11%) genomes were GC-rich, and the other genomes were AT-rich (Fig 1B). The GC content in fern S. moellendorffii (45.23%) and monocotyledon (43.55%~46.89%) were approximately equal and the GC content in moss P. patens (33.60%) was close to that of dicotyledon (33.95%~36.03%) (Fig 1B).
Fig 1. Genome size and GC content in the twelve species studied.
(A) Total nucleotide number in the twelve plants genome sequences. (B) The percentage of C/G in the twelve plants genome sequences.
2. Overall SSRs density
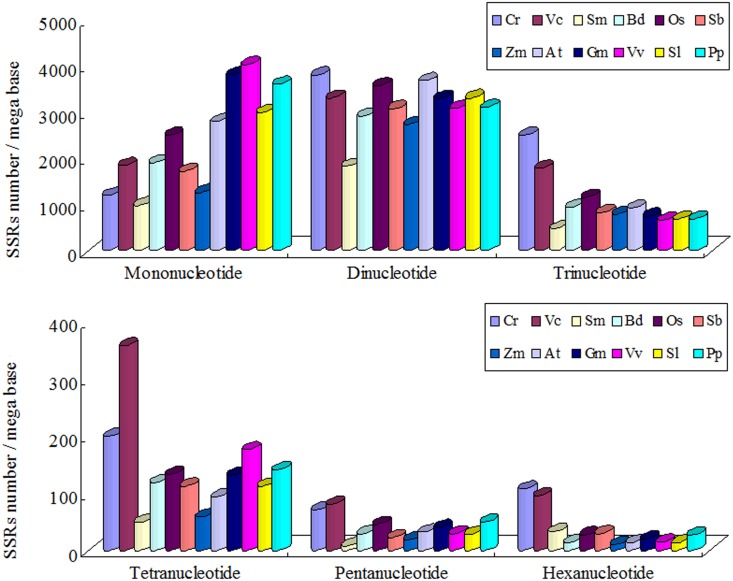
We analyzed the SSRs number and SSRs density (SSRs number / mega bases) in the plant genome sequences (Fig 2 and S2 Table). The densities of mono-, di- and tri- SSRs were significantly higher than other SSRs, so we chose these SSRs as the main SSRs. The densities of mononucleotide SSRs in moss P. patens and dicotyledon were significantly higher than other plants. The SSRs densities from trinucleotide to hexanucleotide in C. reinhardtii and V. carteri were higher than those of other plants, which was consistent with the results of zhao et al. [35]. While the SSRs densities from mononucleotide to pentanucleotide in S. moellendorffii were lower than other plants.
Fig 2. The SSRs density in the twelve plants.
3. The main SSRs analysis among plant genomes
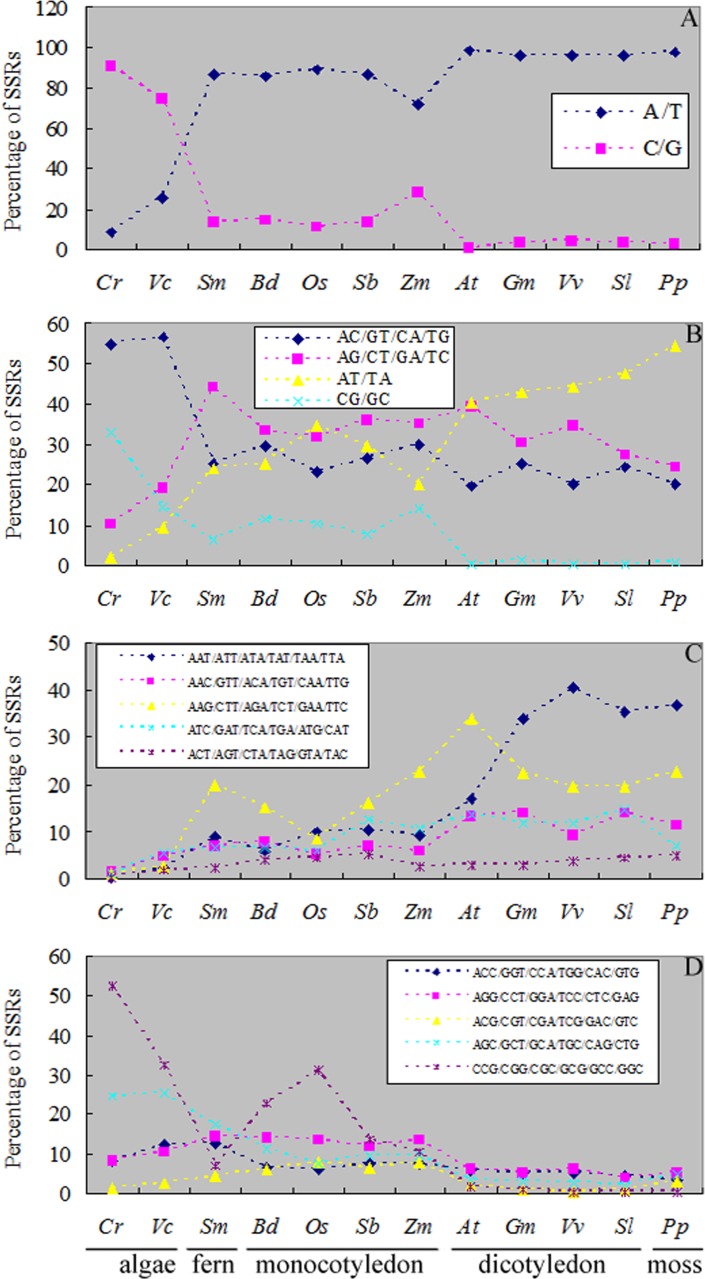
We have shown that the mononucleotide, dinucleotide, and trinucleotide repeats were more abundant than the longer repeated units SSRs, so we focused on these three types of SSRs. In mononucleotide SSRs, the A/T percentage was similar between fern S. moellendorffii (86.15%) and monocotyledon (71.96%~89.17%). While the percentages of A/T in moss P. patens (97.30%) and dicotyledon (96.01%~98.76%) were approximately equal. There was a special case that Z. mays had significantly lower A/T (71.96%) than other monocotyledon (85.85%~89.17%). The algae C. reinhardtii and V. carteri had the higher C/G content (74.55%~91.07%) (Fig 3A), which was different from other plants in mononucleotide.
Fig 3. The percentages of SSRs with different combinations in the twelve plant genomes.
(A)The SSRs percentage of mononucleotide repeats. (B) The SSRs percentage of dinucleotide repeats. (C) The SSRs percentage of trinucleotide repeats.
In dinucleotide SSRs, the AT/TA percentage increased along with the evolution of plants from algae, fern and monocotyledon to dicotyledon. The CG/GC percentage showed opposite trend. The moss P. patens was a special case which showed the same trend as dicotyledon (Fig 3B).
In trinucleotide SSRs, the percentages of combination including two or three A/T were in a rising trend along with the evolution of plants from algae, fern and monocotyledon to dicotyledon (Fig 3C). The percentage of CCG/CGG/CGC/GCG/GCC/GGC and AGC/GCT/GCA/TGC/CAG/CTG was more than 57.72% in algae. So the percentages of other trinucleotide combination including two or three C/G decreased only during the terrestrial plants evolution (Fig 3D). However, there were some exceptions. For example, the moss P. patens showed the same trend with the dicotyledon (Fig 3C and 3D) and the percentage of CCG/CGG/CGC/GCG/GCC/GGC in O. sativa was significantly higher than other monocotyledon studied in this paper.
4. The main SSRs analysis based on repeat number within plant genomes
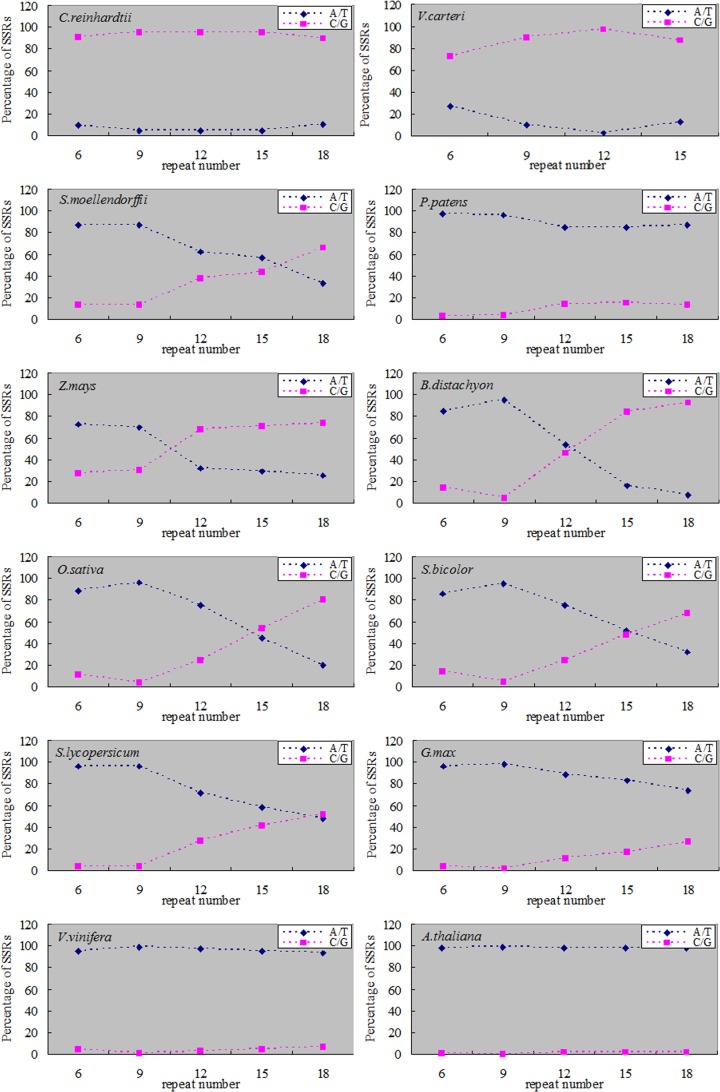
With the increase of the SSRs repeat number, different species showed a different evolutionary trend. In mononucleotide SSRs, the percentage of mononucleotide repeats was different between terrestrial plants and algae. The percentages of mononucleotide repeats had no obvious change with the increase of the repeat number and the percentage of C/G repeats (more than 90%) was obviously higher than that of the A/T repeats in algae C. reinhardtii. In the monocotyledonous plants and fern, the percentages of A/T repeats decreased along with the increase of the repeat number, and gradually lower than the percentage of C/G repeats at high repeat number. In the dicotyledonous plants and moss, A/T repeats decreased with the increase of repeat number, but the percentages of A/T repeats were always higher than the percentages of C/Gs (Fig 4).
Fig 4. The percentages of mononucleotide SSRs with different repeat number in twelve plant genomes.
6: repeat number 6, 7 and 8; 9: repeat number 9, 10 and 11; etc.
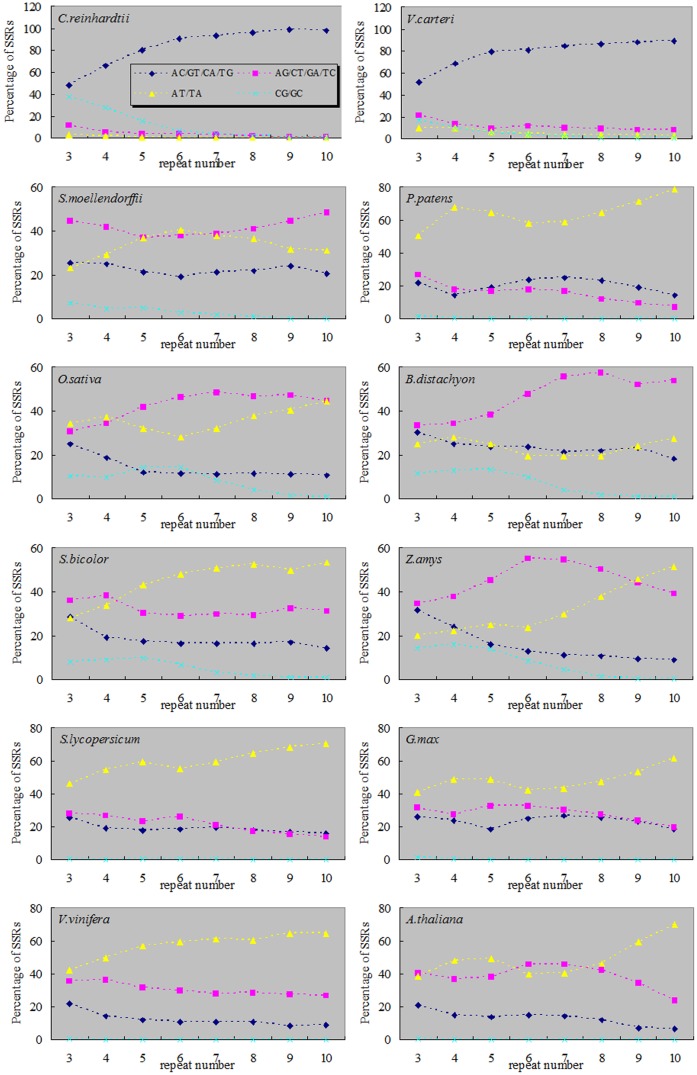
In dinucleotide SSRs, algae and terrestrial plants exhibited different patterns as well. In algae, the percentage of AC/GT/CA/TG combination was higher than other dinucleotide combinations, and it showed a significant increase along with the increase of repeat number. On the contrary, in terrestrial plants, the percentage of AC/GT/CA/TG combination decreased along with the increase of repeat number. In terrestrial plants, the percentages of AT/TA combination showed a rising trend along with the increase of repeat number (except for B. distachyon). Meanwhile, AT/TA combination was dominant in dicotyledon and moss P. patens. In monocotyledon (except for S. bicolor) and fern S. moellendorffii, AG/CT/GA/TC combination was dominant and the percentage increased along with the increase of repeat number. However the percentage of AG/CT/GA/TC combination declined along with the increase of repeat number in dicotyledon and moss P. patens. The percentages of CG/GC combination decreased along with the increase of repeat number in the twelve plants. Dicotyledon and moss were significantly lower in percentage of CG/GC combination than other plants (Fig 5).
Fig 5. The percentages of dinucleotide SSRs with different repeat number in twelve plant genomes.
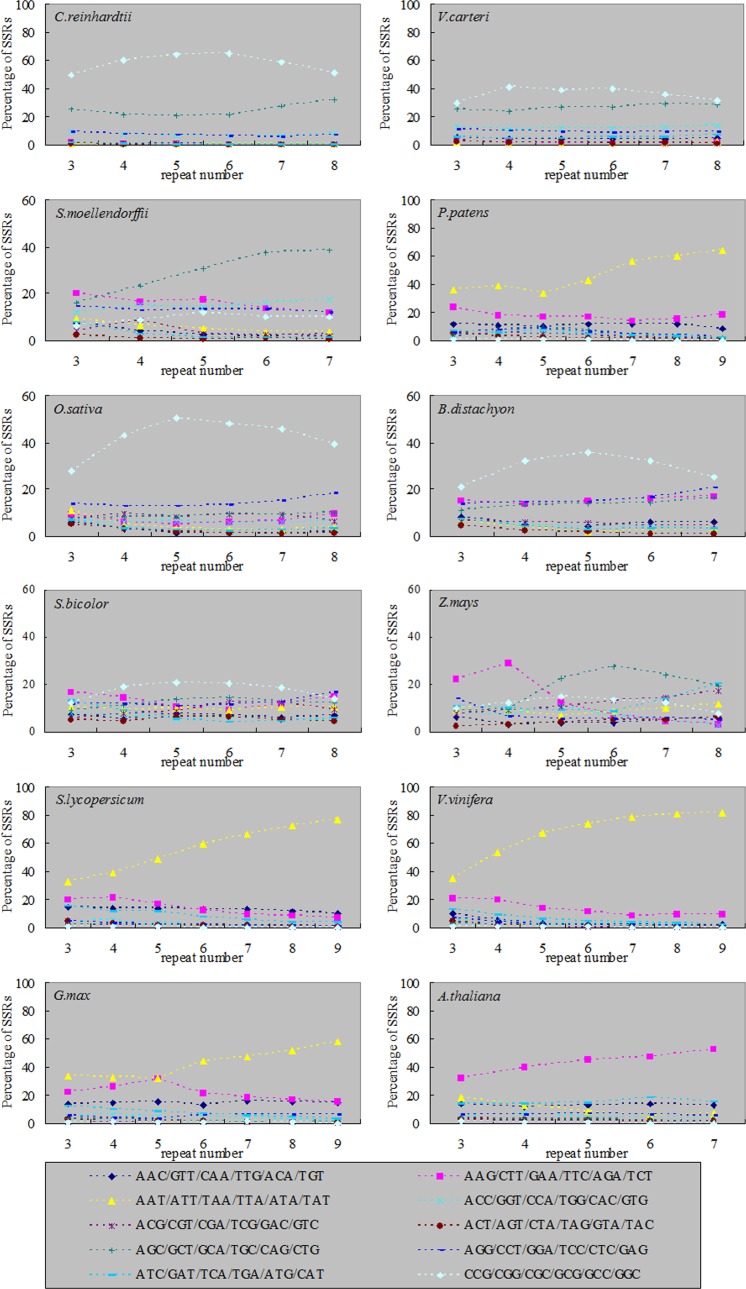
In trinucleotide SSRs, the percentages of three nucleotide combinations showed a diversification trend along with the increase of repeat number in the twelve plants. In algae and monocotyledon plants (except for Z. mays), the combinations of CCG/CGG/CGC/GCG/GCC/GGC were dominant SSRs. In moss P. patens and dicotyledon (except for A. thaliana), AAT/ATT/ATA/TAT/TAA/TTA combinations were dominant SSRs, and the percentages increased along with the increase of repeat number. The percentage of SSRs with trinucleotide combinations in A. thaliana and Z. mays differed from other plants along with the increase of repeat number (Fig 6).
Fig 6. The percentages of trinucleotide SSRs with different repeat number in twelve plant genomes.
5. Clustering analysis based on SSRs percentage
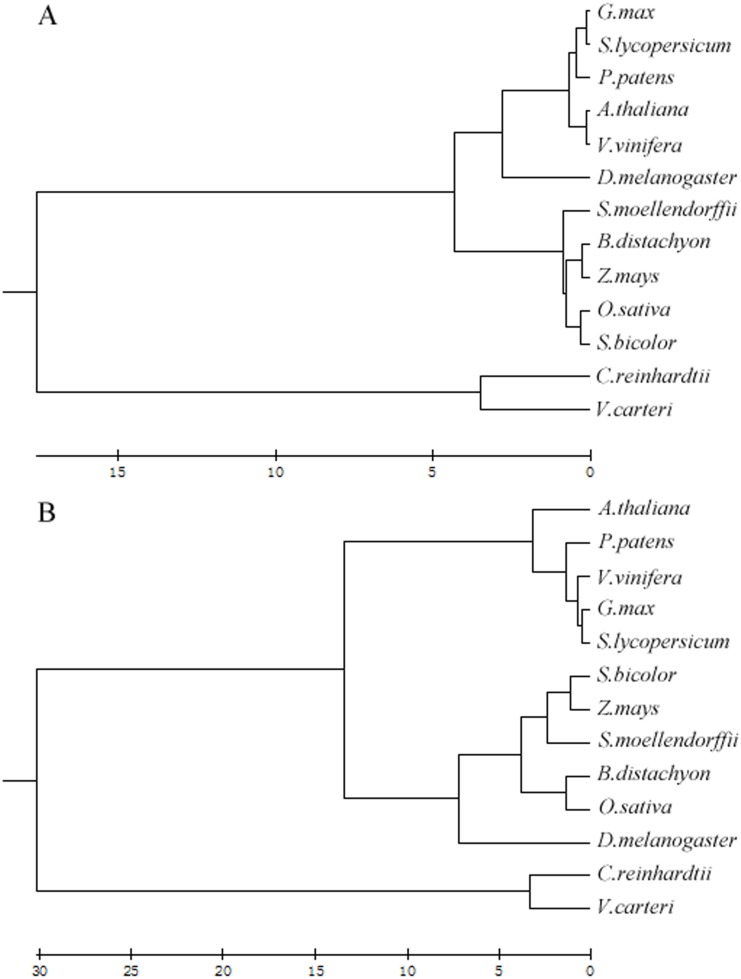
SSRs percentage clearly distinguished the algae from the terrestrial plants (Fig 7). Within the twelve plants, a symmetrised Kullback–Leibler divergence analysis based on dinucleotide combinations percentage or trinucleotide combinations percentage also divided the monocotyledonous/fern and dicotyledonous/moss species into two recognizable clades (Fig 7). The relationship between the terrestrial plants was somewhat different when a clustering analysis was applied as an alternative to the symmetrised Kullback–Leibler divergence analysis. Based on dinucleotide combination percentage, fern can separate from monocotyledonous (Fig 7). We chose D. melanogaster as a control, and found that the GC content in D. melanogaster genome was comparable to monocotyledon (S2 Table).
Fig 7. Cluster analysis of SSR percentage based on dinucleotide combination and trinucleotide combination in algal and terrestrial plants genomes.
(A) Cluster analysis of dinucleotide combination percentage. (B) Cluster analysis of trinucleotide combination percentage. We chose D. melanogaster as a control.
Discussion
1. SSRs evolution accompanied by evolution of plant genomes
Plants have undergone the process of evolution which was from aquatic to terrestrial habitats in the living environment, and from simple to complex in morphological structures. In the genome level, plants have gone through huge changes, including the duplications of chromosome fragments and/or whole genomes, loss of chromosome fragments, and so on [19, 40–41]. In this study, we found simple sequence repeats in plant genome sequences have evolutionary regularities relative to the plant genome evolution.
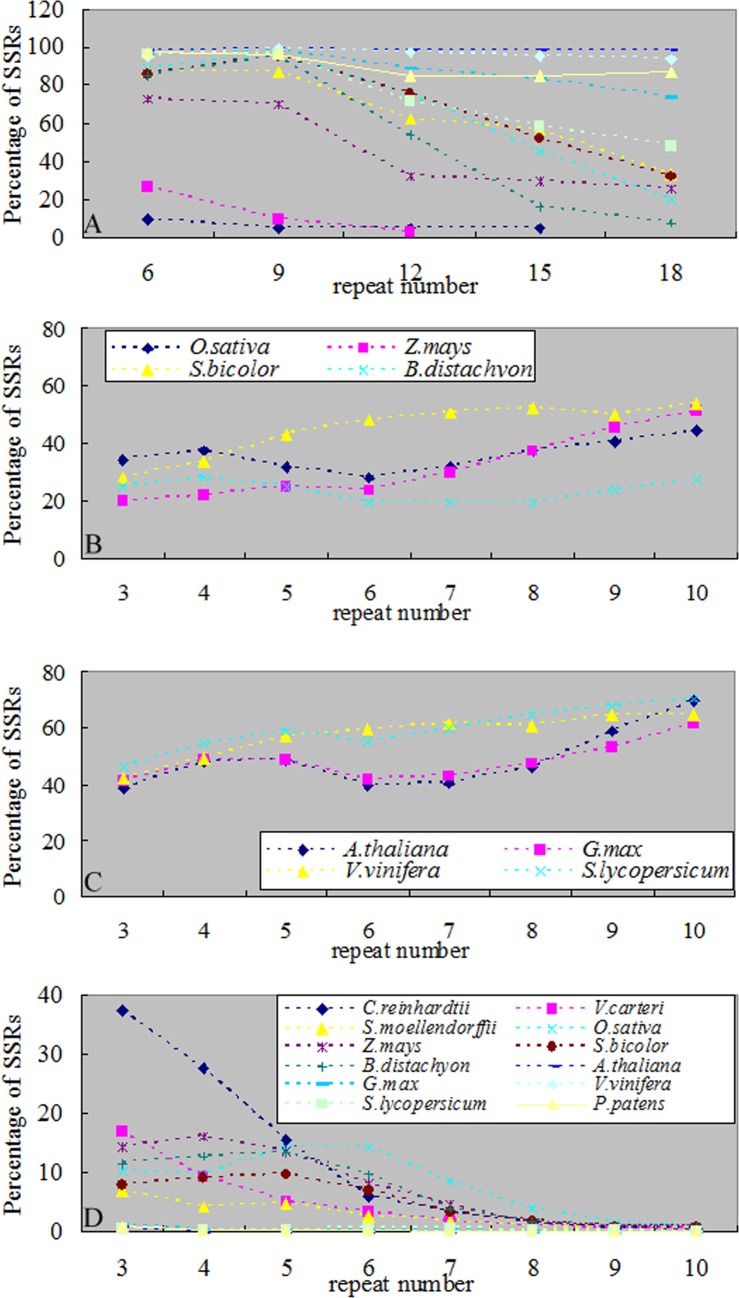
First, the main SSRs were those that contain combination of repeat units consisting of 1–3 nucleotides in both algae and terrestrial plants (Fig 2). Second, in mononucleotide SSRs, the A/T percentage gradually increased along with the evolution of plants (except for P. patens) (Fig 3A). This result was consistent with of previous studies [42–44]. With the increase of SSRs repeat number, the percentage of A/T in C. reinhardtii had no significant changes, while the percentages of A/T in terrestrial plants were gradually declining and the declining trends in monocotyledon were significantly greater than dicotyledon (Figs 4 and 8A). Toth et al. [43] suggested that the poly(A) tails of densely scattered retroposed sequences and processed pseudogenes are responsible for this higher proportion of A/T-rich repeats, which may the evolutionary driver of A/T mononucleotide SSRs. Third, in dinucleotide SSRs, the percentage of AT/TA increased along with the evolution of plants (Fig 3B). In the terrestrial plant, its percentage also increased along with the increase of repeat number (Fig 5), the trends in dicotyledon were even clearer than in monocotyledon (Fig 8B and 8C). The percentage of CG/GC showed the opposite pattern to the AT/TA (Fig 8D). However AC/GT/CA/TG was the most frequent dinucleotide repeat units in all vertebrates and arthropods [43], which was different from the terrestrial plant (S2 Table). Forth, in trinucleotide SSRs, the percentages of combinations including two or three A/T were in a rising trend along with the evolution of plants from algae, fern and monocotyledon to dicotyledon (Fig 3C). Meanwhile, the dominant SSRs were differentiated in different species with the increase of repeat number. For example, algae and monocotyledon (except for Z. mays) preferentially chose CCG/CGG/CGC/GCG/GCC/GGC as dominant SSRs, moss P. patens and dicotyledon (except for A. thaliana) chose AAT/ATT/ATA/TAT/TAA/TTA as dominant SSRs (Fig 6). It is worth noting that ACG/CGT/CGA/TCG/GAC/GTC and ACT/AGT/CTA/TAG/GTA/TAC were low frequency in most plants and animals [43–44]. Our results clearly demonstrate that the dominant SSR types are taxon-dependent.
Fig 8. Variation of different combinations of SSRs.
(A)The A/T frequency changed with different repeat number in twelve plants genome sequences. (B)The AT/TA frequency changed with different repeat number in monocotyledon genome sequences. (C) AT/TA frequency changed with different repeat number in dicotyledon genome sequences. (D) CG/GC frequency changed with different repeat number in twelve plants genome sequences. Fig8A and D with the same legend.
Toth et al. [43] thought that strand-slippage theories alone cannot explain microsatellite distribution in the genome as a whole, enzymes and other proteins involved in various aspects of DNA-processing (i.e., replication and repair) and chromatin remodeling may be responsible for the taxon-specificity of microsatellite abundance. Harr et al. [45] thought that the mismatch repair system may have an important role in shaping genome composition.
2. Algae showed different regularities of SSRs from terrestrial plants
C. reinhardtii is a unicellular green algae whose lineage diverged from terrestrial plants over one billion years ago. Many C. reinhardtii and angiosperm genes are derived from ancestral green plant genes [46]. Genes shared by C. reinhardtii and animals are derived from the last plant-animal common ancestor and many of these have been lost in angiosperms [47]. C. reinhardtii also displays extensive metabolic flexibility under the control of regulatory genes that allow it to inhabit distinct environmental niches and to survive fluctuations in nutrient availability [48]. This may account for that fact that the GC content (Fig 1B) and SSRs characteristics (Figs 3–6) were different between C. reinhardtii and terrestrial plant genome sequences.
3. Physcomitrella patens SSRs exhibit a specific distribution pattern
The haploid moss P. patens is a paleopolyploid. The genome sequences and construction of linearized phylogenetic trees suggest that a large-scale duplication, possibly involving the whole genome, has occurred between 30 and 60 million years ago [49]. Gene ontology and pathway association of the duplicated genes in P. patens revealed different biases of gene retention compared with seed plants [19, 49]. We found the characteristics of SSRs in P. patens genome sequences were obviously different from C. reinhardtii (Figs 1–6). P. patens is the earliest terrestrial plant. During the adaptation of the terrestrial environment, great changes have occurred in the structure and function, for example desiccation tolerance, auxin, ABA, cytokinin signaling, and so on [19]. These changes are based on the changes in the genome sequences [19, 49]. SSRs differences between P. patens and C. reinhardtii may reflect the changes to some extent.
Surprisingly, we discovered that P. patens shared the same characteristics of SSRs with dicotyledon (Figs 1–6). However, in comparison with the dicotyledon, P. patens possessed more tetranucleotide (except V. vinifera), pentanucleotide and hexanucleotide SSRs (Fig 2). DNA polymerase strand slippage was a major factor of SSRs chain extension [25–27]. The different characteristics of SSRs may reflect the different fidelity of DNA polymerase between P. patens and dicotyledon. Of course, further experiments are required to prove this hypothesis.
4. Monocotyledon and dicotyledon SSRs analysis
All flowering plants have survived at least three large-scale duplications/diploidizations over the last 300 million years [23]. The monocotyledon branched off from dicotyledon 140~150 million years ago [50]. In the monocotyledon and dicotyledon genome sequences the percentage of A/T are higher than C/G’s and the dicotyledon has higher A/T percentage than monocotyledon (Fig 1B). But there are special cases that the regularities of SSR variation are different from other closely related plants due to their specific changes in the genome sequences.
Our results showed that the percentages of SSRs in Z. mays genome sequences, from mononucleotide to hexanucleotide combination (except for trinucleotide) were lower than other monocotyledon plants in this paper (Fig 2). In detail, the frequencies of mononucleotide and dinucleotide combinations, which consist of A/T, were lower than other monocotyledon plants studied in this paper (Fig 3A and 3B). The Z. mays genome has undergone several rounds of genome duplication [14, 41]. Then the size of Z. mays genome has expanded dramatically (to 2.3 gigabases) (Fig 1A) over the last ~3 million years via a proliferation of long terminal repeat retrotransposons [51], which rarely contain SSRs [52] and show a tendency to insert into some SSRs, such as AT-rich repeats [53–54]. These genome changes can thus lead to a significant decrease in the percentage of SSRs.
The percentage of AG/CT/GA/TC and AAG/CTT/AGA/TCT/GAA/TTC combinations in A. thaliana were higher than other studied dicotyledons (Figs 3B, 3C and 6). The A. thaliana genome has undergone large-scale gene duplications or even duplications of the entire genome followed by subsequent the high percentage of gene loss and extensive local gene duplications (Fig 1A) [11, 40]. These combinations maybe retained in the process of the evolution.
5. SSRs comparative analysis between different ecotype plants
As we all know that SSRs are highly polymorphic. SSRs are already widely used in genetic diversity analysis and evolutionary analysis of species, and have been widely used in crop molecular assisted breeding [55–59]. In this paper we mainly analyzed the SSR difference in/among species. At the same time we analyzed the genome sequences of three A. thaliana common ecotypes (Columbia (Col-0), Landsberg erecta (Ler-0) and Wassilewskija (Ws-0)). We found there were different SSRs regularities among three ecotypes. But the differences within the three ecotypes are smaller than that between species (S2 Table).
Conclusion
With the evolution of plants and plant genomes, SSRs located in chromosome also undergone regular changes. The percentages of SSRs, which (mainly) consist of C/G, were gradually declining. And the percentages of SSRs, which (mainly) consist of A/T, were gradually increased. At the same time, for a particular species, SSRs composition and percentage were changed accompanied by the genome/genes varies (duplication, polyploidy and deletion). Thus the regularities of SSRs in the twelve plant genome sequences can provide clues for revealing the evolution of plant genomes.
Given the current of sequenced plant genome restrictions, fern and moss chose only one species, in the paper we cannot large sample analysis of SSRs feature in different evolutionary position plants.
Supporting Information
(TIF)
(RAR)
(XLS)
(XLS)
Acknowledgments
We thank Dr. Mengcheng Wang and Zhengqiu Cai for constructive comments on the manuscript.
Data Availability
All relevant data are within the paper and its Supporting Information files.
Funding Statement
This work was supported by the National Nature Science Foundation of China (31401460; http://isisn.nsfc.gov.cn/egrantweb/), the China Agriculture Research System of Sweetpotato (CARS-11-B-06 and CARS-11-B-11) and the Nature Science Foundation of Shandong province (ZR2014YL015).
References
- 1. Tautz D, Renz M. Simple sequences are ubiquitous repetitive components of eukaryotic genomes. Nucleic Acids Res. 1984;12(10):4127–38. Epub 1984/05/25. . [DOI] [PMC free article] [PubMed] [Google Scholar]
- 2. Li YC, Korol AB, Fahima T, Beiles A, Nevo E. Microsatellites: genomic distribution, putative functions and mutational mechanisms: a review. Mol Ecol. 2002;11(12):2453–65. Epub 2002/11/28. 1643 [pii]. . [DOI] [PubMed] [Google Scholar]
- 3. Li YC, Korol AB, Fahima T, Nevo E. Microsatellites within genes: structure, function, and evolution. Mol Biol Evol. 2004;21(6):991–1007. Epub 2004/02/14. 10.1093/molbev/msh073 [pii]. . [DOI] [PubMed] [Google Scholar]
- 4. Haasl RJ, Payseur BA. Microsatellites as targets of natural selection. Mol Biol Evol. 2013;30(2):285–98. Epub 2012/10/30. 10.1093/molbev/mss247 . [DOI] [PMC free article] [PubMed] [Google Scholar]
- 5. Gemayel R, Vinces MD, Legendre M, Verstrepen KJ. Variable tandem repeats accelerate evolution of coding and regulatory sequences. Annu Rev Genet. 2010;44:445–77. Epub 2010/09/03. 10.1146/annurev-genet-072610-155046 . [DOI] [PubMed] [Google Scholar]
- 6. Lynch M, Conery JS. The evolutionary fate and consequences of duplicate genes. Science. 2000;290(5494):1151–5. Epub 2000/11/10. 8976 [pii]. . [DOI] [PubMed] [Google Scholar]
- 7. Bowers JE, Chapman BA, Rong J, Paterson AH. Unravelling angiosperm genome evolution by phylogenetic analysis of chromosomal duplication events. Nature. 2003;422(6930):433–8. Epub 2003/03/28. 10.1038/nature01521 [pii]. . [DOI] [PubMed] [Google Scholar]
- 8. De Bodt S, Maere S, Van de Peer Y. Genome duplication and the origin of angiosperms. Trends Ecol Evol. 2005;20(11):591–7. Epub 2006/05/17. 10.1016/j.tree.2005.07.008 . [DOI] [PubMed] [Google Scholar]
- 9. Crane PR, Lidgard S. Angiosperm diversification and paleolatitudinal gradients in cretaceous floristic diversity. Science. 1989;246(4930):675–8. Epub 1989/11/03. 10.1126/science.246.4930.675 . [DOI] [PubMed] [Google Scholar]
- 10. Genome sequencing and analysis of the model grass Brachypodium distachyon . Nature. 2010;463(7282):763–8. Epub 2010/02/12. 10.1038/nature08747 . [DOI] [PubMed] [Google Scholar]
- 11. Analysis of the genome sequence of the flowering plant Arabidopsis thaliana. Nature. 2000;408(6814):796–815. Epub 2000/12/29. 10.1038/35048692 . [DOI] [PubMed] [Google Scholar]
- 12. Goff SA, Ricke D, Lan TH, Presting G, Wang R, Dunn M, et al. A draft sequence of the rice genome (Oryza sativa L. ssp. japonica). Science. 2002;296(5565):92–100. Epub 2002/04/06. 10.1126/science.1068275 . [DOI] [PubMed] [Google Scholar]
- 13. Yu J, Wang J, Lin W, Li S, Li H, Zhou J, et al. The Genomes of Oryza sativa: a history of duplications. PLoS Biol. 2005;3(2):e38 Epub 2005/02/03. 10.1371/journal.pbio.0030038 . [DOI] [PMC free article] [PubMed] [Google Scholar]
- 14. Schnable PS, Ware D, Fulton RS, Stein JC, Wei F, Pasternak S, et al. The B73 maize genome: complexity, diversity, and dynamics. Science. 2009;326(5956):1112–5. Epub 2009/12/08. 10.1126/science.1178534 . [DOI] [PubMed] [Google Scholar]
- 15. Van de Peer Y, Maere S, Meyer A. The evolutionary significance of ancient genome duplications. Nat Rev Genet. 2009;10(10):725–32. Epub 2009/08/05. 10.1038/nrg2600 . [DOI] [PubMed] [Google Scholar]
- 16. Schmutz J, Cannon SB, Schlueter J, Ma J, Mitros T, Nelson W, et al. Genome sequence of the palaeopolyploid soybean. Nature. 2010;463(7278):178–83. Epub 2010/01/16. 10.1038/nature08670 . [DOI] [PubMed] [Google Scholar]
- 17. Proost S, Pattyn P, Gerats T, Van de Peer Y. Journey through the past: 150 million years of plant genome evolution. Plant J. 2011;66(1):58–65. Epub 2011/03/30. 10.1111/j.1365-313X.2011.04521.x . [DOI] [PubMed] [Google Scholar]
- 18. Blanc G, Wolfe KH. Functional divergence of duplicated genes formed by polyploidy during Arabidopsis evolution. Plant Cell. 2004;16(7):1679–91. Epub 2004/06/23. 10.1105/tpc.021410 . [DOI] [PMC free article] [PubMed] [Google Scholar]
- 19. Rensing SA, Ick J, Fawcett JA, Lang D, Zimmer A, Van de Peer Y, et al. An ancient genome duplication contributed to the abundance of metabolic genes in the moss Physcomitrella patens . BMC Evol Biol. 2007;7:130 Epub 2007/08/09. 10.1186/1471-2148-7-130 . [DOI] [PMC free article] [PubMed] [Google Scholar]
- 20. Maere S, De Bodt S, Raes J, Casneuf T, Van Montagu M, Kuiper M, et al. Modeling gene and genome duplications in eukaryotes. Proc Natl Acad Sci U S A. 2005;102(15):5454–9. Epub 2005/04/01. 10.1073/pnas.0501102102 . [DOI] [PMC free article] [PubMed] [Google Scholar]
- 21. Seoighe C, Gehring C. Genome duplication led to highly selective expansion of the Arabidopsis thaliana proteome. Trends Genet. 2004;20(10):461–4. Epub 2004/09/15. 10.1016/j.tig.2004.07.008 . [DOI] [PubMed] [Google Scholar]
- 22. Blanc G, Wolfe KH. Widespread paleopolyploidy in model plant species inferred from age distributions of duplicate genes. Plant Cell. 2004;16(7):1667–78. Epub 2004/06/23. 10.1105/tpc.021345 . [DOI] [PMC free article] [PubMed] [Google Scholar]
- 23. Freeling M, Thomas BC. Gene-balanced duplications, like tetraploidy, provide predictable drive to increase morphological complexity. Genome Res. 2006;16(7):805–14. Epub 2006/07/05. 10.1101/gr.3681406 . [DOI] [PubMed] [Google Scholar]
- 24. Loire E, Higuet D, Netter P, Achaz G. Evolution of coding microsatellites in primate genomes. Genome Biol Evol. 2013;5(2):283–95. Epub 2013/01/15. 10.1093/gbe/evt003 . [DOI] [PMC free article] [PubMed] [Google Scholar]
- 25. Tautz D, Schlotterer. Simple sequences. Curr Opin Genet Dev. 1994;4(6):832–7. Epub 1994/12/01. [DOI] [PubMed] [Google Scholar]
- 26. Schlotterer C, Tautz D. Slippage synthesis of simple sequence DNA. Nucleic Acids Res. 1992;20(2):211–5. Epub 1992/01/25. . [DOI] [PMC free article] [PubMed] [Google Scholar]
- 27. Levinson G, Gutman GA. Slipped-strand mispairing: a major mechanism for DNA sequence evolution. Mol Biol Evol. 1987;4(3):203–21. Epub 1987/05/01. . [DOI] [PubMed] [Google Scholar]
- 28. Henderson ST, Petes TD. Instability of simple sequence DNA in Saccharomyces cerevisiae . Mol Cell Biol. 1992;12(6):2749–57. Epub 1992/06/01. . [DOI] [PMC free article] [PubMed] [Google Scholar]
- 29. Katti MV, Ranjekar PK, Gupta VS. Differential distribution of simple sequence repeats in eukaryotic genome sequences. Mol Biol Evol. 2001;18(7):1161–7. Epub 2001/06/23. . [DOI] [PubMed] [Google Scholar]
- 30. Schug MD, Hutter CM, Wetterstrand KA, Gaudette MS, Mackay TF, Aquadro CF. The mutation rates of di-, tri- and tetranucleotide repeats in Drosophila melanogaster . Mol Biol Evol. 1998;15(12):1751–60. Epub 1998/12/29. . [DOI] [PubMed] [Google Scholar]
- 31. Chakraborty R, Kimmel M, Stivers DN, Davison LJ, Deka R. Relative mutation rates at di-, tri-, and tetranucleotide microsatellite loci. Proc Natl Acad Sci U S A. 1997;94(3):1041–6. Epub 1997/02/04. . [DOI] [PMC free article] [PubMed] [Google Scholar]
- 32. Pumpernik D, Oblak B, Borstnik B. Replication slippage versus point mutation rates in short tandem repeats of the human genome. Mol Genet Genomics. 2008;279(1):53–61. Epub 2007/10/11. 10.1007/s00438-007-0294-1 . [DOI] [PubMed] [Google Scholar]
- 33. Shankar R, Chaurasia A, Ghosh B, Chekmenev D, Cheremushkin E, Kel A, et al. Non-random genomic divergence in repetitive sequences of human and chimpanzee in genes of different functional categories. Mol Genet Genomics. 2007;277(4):441–55. Epub 2007/03/22. 10.1007/s00438-007-0210-8 . [DOI] [PubMed] [Google Scholar]
- 34. Siddle KJ, Goodship JA, Keavney B, Santibanez-Koref MF. Bases adjacent to mononucleotide repeats show an increased single nucleotide polymorphism frequency in the human genome. Bioinformatics. 2011;27(7):895–8. Epub 2011/02/15. 10.1093/bioinformatics/btr067 . [DOI] [PubMed] [Google Scholar]
- 35. Zhao Z, Guo C, Sutharzan S, Li P, Echt CS, Zhang J, et al. Genome-wide analysis of tandem repeats in plants and green algae. G3 (Bethesda). 2014;4(1):67–78. Epub 2013/11/07. 10.1534/g3.113.008524 . [DOI] [PMC free article] [PubMed] [Google Scholar]
- 36. Shi J, Huang S, Zhan J, Yu J, Wang X, Hua W, et al. Genome-wide microsatellite characterization and marker development in the sequenced Brassica crop species. DNA Res. 2014;21(1):53–68. Epub 2013/10/17. 10.1093/dnares/dst040 . [DOI] [PMC free article] [PubMed] [Google Scholar]
- 37. Shi J, Huang S, Fu D, Yu J, Wang X, Hua W, et al. Evolutionary dynamics of microsatellite distribution in plants: insight from the comparison of sequenced brassica, Arabidopsis and other angiosperm species. PLoS One. 2013;8(3):e59988 Epub 2013/04/05. 10.1371/journal.pone.0059988 . [DOI] [PMC free article] [PubMed] [Google Scholar]
- 38. Victoria FC, da Maia LC, de Oliveira AC. In silico comparative analysis of SSR markers in plants. BMC Plant Biol. 2011;11:15 Epub 2011/01/21. 10.1186/1471-2229-11-15 . [DOI] [PMC free article] [PubMed] [Google Scholar]
- 39. Xie C, Zhang S, Li M, Li X, Hao Z, Bai L, et al. Inferring genome ancestry and estimating molecular relatedness among 187 Chinese maize inbred lines. J Genet Genomics. 2007;34(8):738–48. Epub 2007/08/21. 10.1016/S1673-8527(07)60083-6 . [DOI] [PubMed] [Google Scholar]
- 40. Simillion C, Vandepoele K, Van Montagu MC, Zabeau M, Van de Peer Y. The hidden duplication past of Arabidopsis thaliana . Proc Natl Acad Sci U S A. 2002;99(21):13627–32. Epub 2002/10/11. 10.1073/pnas.212522399 . [DOI] [PMC free article] [PubMed] [Google Scholar]
- 41. Paterson AH, Bowers JE, Chapman BA. Ancient polyploidization predating divergence of the cereals, and its consequences for comparative genomics. Proc Natl Acad Sci U S A. 2004;101(26):9903–8. Epub 2004/05/27. 10.1073/pnas.0307901101 . [DOI] [PMC free article] [PubMed] [Google Scholar]
- 42. Lawson MJ, Zhang L. Distinct patterns of SSR distribution in the Arabidopsis thaliana and rice genomes. Genome Biol. 2006;7(2):R14 Epub 2006/03/02. 10.1186/gb-2006-7-2-r14 . [DOI] [PMC free article] [PubMed] [Google Scholar]
- 43. Toth G, Gaspari Z, Jurka J. Microsatellites in different eukaryotic genomes: survey and analysis. Genome Res. 2000;10(7):967–81. Epub 2000/07/19. . [DOI] [PMC free article] [PubMed] [Google Scholar]
- 44. Mayer C, Leese F, Tollrian R. Genome-wide analysis of tandem repeats in Daphnia pulex—a comparative approach. BMC Genomics. 2010;11:277 Epub 2010/05/04. 10.1186/1471-2164-11-277 . [DOI] [PMC free article] [PubMed] [Google Scholar]
- 45. Harr B, Todorova J, Schlotterer C. Mismatch repair-driven mutational bias in D. melanogaster . Mol Cell. 2002;10(1):199–205. Epub 2002/08/02. S1097276502005750 [pii]. . [DOI] [PubMed] [Google Scholar]
- 46. Merchant SS, Prochnik SE, Vallon O, Harris EH, Karpowicz SJ, Witman GB, et al. The Chlamydomonas genome reveals the evolution of key animal and plant functions. Science. 2007;318(5848):245–50. Epub 2007/10/13. 10.1126/science.1143609 . [DOI] [PMC free article] [PubMed] [Google Scholar]
- 47. Li JB, Gerdes JM, Haycraft CJ, Fan Y, Teslovich TM, May-Simera H, et al. Comparative genomics identifies a flagellar and basal body proteome that includes the BBS5 human disease gene. Cell. 2004;117(4):541–52. Epub 2004/05/13. S0092867404004507 [pii]. . [DOI] [PubMed] [Google Scholar]
- 48. Grossman AR, Croft M, Gladyshev VN, Merchant SS, Posewitz MC, Prochnik S, et al. Novel metabolism in Chlamydomonas through the lens of genomics. Curr Opin Plant Biol. 2007;10(2):190–8. Epub 2007/02/13. 10.1016/j.pbi.2007.01.012 . [DOI] [PubMed] [Google Scholar]
- 49. Rensing SA, Lang D, Zimmer AD, Terry A, Salamov A, Shapiro H, et al. The Physcomitrella genome reveals evolutionary insights into the conquest of land by plants. Science. 2008;319(5859):64–9. Epub 2007/12/15. 10.1126/science.1150646 . [DOI] [PubMed] [Google Scholar]
- 50. Chaw SM, Chang CC, Chen HL, Li WH. Dating the monocot-dicot divergence and the origin of core eudicots using whole chloroplast genomes. J Mol Evol. 2004;58(4):424–41. Epub 2004/04/29. 10.1007/s00239-003-2564-9 . [DOI] [PubMed] [Google Scholar]
- 51. SanMiguel P, Gaut BS, Tikhonov A, Nakajima Y, Bennetzen JL. The paleontology of intergene retrotransposons of maize. Nat Genet. 1998;20(1):43–5. Epub 1998/09/10. 10.1038/1695 . [DOI] [PubMed] [Google Scholar]
- 52. Morgante M, Hanafey M, Powell W. Microsatellites are preferentially associated with nonrepetitive DNA in plant genomes. Nat Genet. 2002;30(2):194–200. Epub 2002/01/19. 10.1038/ng822 . [DOI] [PubMed] [Google Scholar]
- 53. Coates BS, Sumerford DV, Hellmich RL, Lewis LC. A helitron-like transposon superfamily from lepidoptera disrupts (GAAA)(n) microsatellites and is responsible for flanking sequence similarity within a microsatellite family. J Mol Evol. 2010;70(3):275–88. Epub 2010/03/11. 10.1007/s00239-010-9330-6 . [DOI] [PubMed] [Google Scholar]
- 54. Akagi H, Yokozeki Y, Inagaki A, Mori K, Fujimura T. Micron, a microsatellite-targeting transposable element in the rice genome. Mol Genet Genomics. 2001;266(3):471–80. Epub 2001/11/20. 10.1007/s004380100563 . [DOI] [PubMed] [Google Scholar]
- 55. Vigouroux Y, Matsuoka Y, Doebley J. Directional evolution for microsatellite size in maize. Mol Biol Evol. 2003;20(9):1480–3. Epub 2003/07/02. 10.1093/molbev/msg156 . [DOI] [PubMed] [Google Scholar]
- 56. Matsuoka Y, Vigouroux Y, Goodman MM, Sanchez GJ, Buckler E, Doebley J. A single domestication for maize shown by multilocus microsatellite genotyping. Proc Natl Acad Sci U S A. 2002;99(9):6080–4. Epub 2002/05/02. 10.1073/pnas.052125199 . [DOI] [PMC free article] [PubMed] [Google Scholar]
- 57. Matsuoka Y, Mitchell SE, Kresovich S, Goodman M, Doebley J. Microsatellites in Zea—variability, patterns of mutations, and use for evolutionary studies. Theor Appl Genet. 2002;104(2–3):436–50. Epub 2003/02/13. 10.1007/s001220100694 . [DOI] [PubMed] [Google Scholar]
- 58. Zhang P, Liu X, Tong H, Lu Y, Li J. Association mapping for important agronomic traits in core collection of rice (Oryza sativa L.) with SSR markers. PLoS One. 2014;9(10):e111508 Epub 2014/11/02. 10.1371/journal.pone.0111508 . [DOI] [PMC free article] [PubMed] [Google Scholar]
- 59. Hou L, Chen X, Wang M, See DR, Chao S, Bulli P, et al. Mapping a Large Number of QTL for Durable Resistance to Stripe Rust in Winter Wheat Druchamp Using SSR and SNP Markers. PLoS One. 2015;10(5):e0126794 Epub 2015/05/15. 10.1371/journal.pone.0126794 . [DOI] [PMC free article] [PubMed] [Google Scholar]
Associated Data
This section collects any data citations, data availability statements, or supplementary materials included in this article.
Supplementary Materials
(TIF)
(RAR)
(XLS)
(XLS)
Data Availability Statement
All relevant data are within the paper and its Supporting Information files.


