

Abstract
Decline in mitochondrial DNA (mtDNA) copy number, function, and accumulation of mutations and deletions have been proposed to contribute to age-related physical decline, based on cross sectional studies in genetically unrelated individuals. There is wide variability of mtDNA and functional measurements in many population studies and therefore we assessed mitochondrial function and physical function in 18 families of grandmothers, mothers, and daughters who share the same maternally inherited mtDNA sequence. A significant age-related decline in mtDNA copy number, mitochondrial protein expression, citrate synthase activity, cytochrome c oxidase content, and VO2 peak were observed. Also, a lower abundance of SIRT3, accompanied by an increase in acetylated skeletal muscle proteins, was observed in grandmothers. Muscle tissue–based full sequencing of mtDNA showed greater than 5% change in minor allele frequency over a lifetime in two locations, position 189 and 408 in the noncoding D-loop region but no changes were noted in blood cells mtDNA. The decline in oxidative capacity and muscle function with age in three generations of women who share the same mtDNA sequence are associated with a decline in muscle mtDNA copy number and reduced protein deacetylase activity of SIRT3.
Key Words: Mitochondrial DNA, Aging, SIRT3, Oxidative capacity, Acetylated protein, Skeletal muscle
People over 65 years of age are a rapidly expanding demographic, and age-related morbidities have a substantial impact on healthcare and associated costs (1). Skeletal muscle weakness and physical inactivity are hallmarks of aging and major contributors to age-related declines in physical performance, quality of life, and mortality (2,3). Studies in a wide range of species from worms to humans (4–6) demonstrate that aging is associated with decreased physical activity due to the deterioration of skeletal muscle (ie, sarcopenia). In Caenorhabditis elegans, life span is extended by a genetic mutation that delays the decline in physical activity and onset of sarcopenia in these worms (4). Similarly, in humans there is increasing evidence that both morbidity and mortality are lower in elderly people who maintain high levels of physical activity (7). Given that skeletal muscle function is important in maintaining health and quality of life, it is imperative that the mechanisms responsible for the age-related decline in muscle function are uncovered. Such information would contribute to the discovery of therapeutic strategies targeting specific underlying mechanisms responsible for the functional decline of aging skeletal muscle.
It is a reasonable hypothesis that, being largely a postmitotic organ, skeletal muscle could over a lifetime accumulate environmental damage to cellular components, such as proteins, lipids, and DNA. Decline in skeletal muscle mitochondrial ATP synthesis has been reported to occur with age at both maximal (8) and basal conditions (9). Age-related decline in mitochondrial function can occur due to mitochondrial DNA (mtDNA) mutations (10,11), or due to decline in mtDNA copy number as has been reported to occur in sedentary people (8,12). Alternatively, a decline in protein quality can occur either due to reduced protein turnover or alterations in post-translational modifications (13). A causal link between mtDNA mutations and a senescent phenotype was demonstrated using a mtDNA mutator mouse that accumulates extensive mtDNA mutations and deletions resulting in accelerated aging (14,15). However, the levels of point mutations in tissues of aged normal mice are much lower than in the mutator mice, and mtDNA abundance varies widely within an age-group in cross sectional population comparisons thus leaving uncertainty about the causal role of mtDNA mutations or abundance in normal aging. Cross sectional studies in genetically unrelated individuals show variable levels of mtDNA abundance and mutations (8,10,12,16–18).
Because of the potential variability in the mtDNA sequence and mtDNA abundance among unrelated individuals, we investigated three generations of healthy sedentary women (sets of daughters, mothers, and grandmothers), who share the same mtDNA to provide a more definitive conclusion on the effect of age on muscle mitochondrial function, mtDNA, and physical function. We chose to study only women, which offered additional advantages because physical activity, skeletal performance, oxidative capacity, and life span differ between men and women (19), and the impact of sarcopenia is much more evident in women because they have a smaller initial muscle mass than men and therefore have less functional reserve. We sequenced the entire mtDNA genome from skeletal muscle and blood cells to represent tissues with slow and fast turnover, respectively, in three generations of women. In addition, we also measured mtDNA copy number and the expression of SIRT3 deacetylase and acetylated protein abundance.
Methods
Participants
Fifty-two healthy sedentary women were recruited. The family units were as follows: 13 families with a daughter, mother, and grandmother; one five-member family comprised of a grandmother, two mothers, and two daughters; a family consisting of a mother and daughter; a family consisting of a grandmother and daughter; and finally a family of a grandmother, a mother, and two daughters. Participants exercised less than 30 minutes per day twice per week. Health status was assessed by medical history, physical examination, comprehensive blood tests, graded treadmill test, and resting electrocardiogram. Exclusion criteria included diabetes or other metabolic or endocrine disorders, cardiovascular disease, liver disease, neurological disease, kidney failure, myopathy, fasting blood glucose > 110mg/dl, anemia, substance abuse, pregnancy, or use of medications that could affect the outcome measures. The Mayo Foundation Institutional Review Board approved all procedures and all participants provided informed consent before entering the study.
Study Protocol
Dual x-ray absorptiometry was used to determine fat mass and fat free mass (20). Energy expenditure was determined from gas exchange measurements using a DeltaTrac system (Sensormedics, Yorba Linda, CA). Whole-body maximal oxygen uptake (VO2 peak) was determined from expired gas analysis during a graded bicycle test as previously reported (21). At least 7 days after VO2 peak testing, participants were given a weight-maintaining diet containing 55% of calories from carbohydrate, 30% from fat, and 15% from protein for 3 days prior to the study day. On Day 3 of the weight-maintaining diet, participants were admitted to the Mayo Clinic Clinical Research Unit. Participants were given a standardized snack at 22:00 hours then remained fasted until the completion of the study the following day. Fasting blood glucose was measured enzymatically, and fasting plasma insulin was measured with a two-site immunoenzymatic assay (22). Vastus lateralis muscle biopsies were performed under local anesthesia as previously described (23). The muscle was rapidly frozen in liquid nitrogen and stored at −80°C.
Muscle strength and physical activity were quantified on a subset of the enrolled participants (8 families—23 participants). Strength was assessed using a one repetition maximum leg press, chest press, and arm curl as previously described (20), and physical activity, body posture, and movement pattern data were collected every half-second for 10 days using the physical activity monitoring system (24,25). The physical activity monitoring system included three sensors, two inclinometers (each of which captures two axes of acceleration against the earth’s gravitational field, CXTA02, Crossbow Technology Inc., San Jose, CA) and one triaxial accelerometer (captures motion in x, y, and z axes, CXL02LF3-R, Crossbow Technology Inc). The 7 axes of data were binned and stored every half-second on one data logger (Ready DAQ AD2000, Crossbow Technology Inc). Data from the data logger were downloaded to a computer and analyzed using Matlab, which collapses the data into a summation of postures and accelerations associated with these postures.
Citrate Synthase and Cytochrome C Oxidase
Skeletal muscle citrate synthase enzyme activity was measured using standard spectrophotometric techniques (26). Cytochrome C oxidase (COX) activity and content was measured using a commercially available ELISA-based kit (Abcam, ab101991, Cambridge, MA). Briefly, 20mg of muscle tissue was homogenized, and a protein quantification was performed (Pierce 660 Protein Assay, Thermo Scientific, Rockford, IL) to adjust all samples to the same concentration (4.05 µg/µL). COX enzyme was immunocaptured within the wells of the microplate. Activity was measured using a colorimetric absorbance-based change of the oxidation of reduced cytochrome C over a 2 hour time period. Subsequently, the amount of COX enzyme was quantified using a COX specific detector antibody and an alkaline phosphatase-conjugated antibody which was measured calorimetrically in a time-dependent manner proportionate to the amount of enzyme bound within the wells.
Western Blotting
Muscle tissue was homogenized on ice in a RIPA buffer with phosphatase and protease inhibitors. Gel separation and blotting for mitochondrial respiratory chain complexes, PGC1a, SIRT3, acetylated lysine, and vinculin were performed as described previously (12,27). Mitochondrial respiratory chain proteins were probed with an antibody cocktail (Abcam ab110411) containing five monoclonal antibodies (Complex I subunit NDUFB8, Complex II subunit 30kDa, Complex III subunit Core 2, Complex IV subunit II, and ATP synthase subunit alpha). Of these 5 proteins, Complex IV subunit II is mitochondrial-encoded, and the others are nuclear-encoded.
DNA Extraction
Total DNA (nuclear and mitochondrial) was extracted from frozen muscle samples using the QIAamp DNA mini kit (Qiagen) and from blood using an automated platform (AutoGen FlexStar Qiagen chemistries). The resulting DNA was quantified by UV absorbance and was used for subsequent analysis.
mtDNA Abundance
mtDNA abundance was determined using real-time quantitative PCR. Samples were run in duplicate and were normalized to 28S ribosomal RNA. Primer and probe sequences for NADH dehydrogenase 1 and 4 and 28S ribosomal RNA were reported previously (8).
mtDNA Sequencing and Analysis
mtDNA was amplified from muscle and blood total DNA samples using two sets of mtDNA specific primers (Primer set 1 forward: 5′-ACATAGCACATTACAGTCAAA TCCCTTCTCG TCCC-3′, Primer set 1 reverse: 5′- ATTGCTAGGGTGGCGCTTCCA ATTAGGTGC -3′, Primer set 2 forward: 5′- TCATTTTTATTGCCAC AACTAACCTCCTCGGACTC -3′, Primer set 2 reverse: 5′- CGTGAT GTCTTATTTAAGGGGAACGTGTGGGCTAT -3′). Amplification was performed in a 25 μL PCR reaction using the high-fidelity TaKaRa LA Taq with the following cycling conditions: 94°C for 2 minutes, 30 cycles of [94°C for 30 seconds, 68°C for 10 minutes], 68°C for 15 minutes, 4°C hold. Amplified mtDNA was purified with the High-Pure PCR Product Purification kit (Roche) and quantified by Picogreen fluorescence (Molecular Probes). Equimolar concentrations of both amplicons were pooled and a small aliquot was run on an agarose gel to verify amplification and pooling; and to identify large (>500bp) deletions. About 1 µg of mtDNA was used to prepare indexed DNA libraries with Illumina’s sample preparation kit and indexing oligonucleotide kit. Sequencing of mitochondrial genomes was performed on Illumina’s Genome Analyzer II (GAII). DNA libraries were mixed at equimolar concentrations and clusters were generated using Illumina’s cluster kit and protocol. The resulting flow cell was sequenced on Illumina’s GAII using the manufacturer’s version 3 cycle sequencing kit and indexing protocol. Up to 12 indexed samples were run in each lane of the flow cell. Read-lengths of up to 50bp were obtained.
Data were collected using Illumina’s SCS data collection software. GAII sequences were extracted from .tiff images using the Firecrest and Bustard tools from the Illumina Genome Analyzer pipeline v1.3. These sequence reads were aligned to the revised Cambridge Reference Sequence (28) using MAQ version 0.7.1 (29), disregarding any reads with multiple best alignments. The pileup file generated by MAQ was used for further statistical analysis. Perl and shell scripts were used for converting formats and parsing files. Data were aligned a second time using Novoalign (20) to verify the results from MAQ. From the parsed pileup files, we obtained the counts of each base for each position the minor allele frequency (MAF) was computed. The median (interquartile range) read depth was 5262 (3835–7569) reads. Since the data were multiplexed into lanes of the flowcell, we were able to estimate the global miscall rate for each lane. A two-way model was fit to lane and position by median polish. Miscall rates for each lane varied from 0.3% to 0.7%, which is well within advertised specifications. The sensitivity of the gel method for the detection of large deletions has been determined in our laboratory to be approximately 2%–3% (data not shown)
The homo-polymeric cytidine tract from nucleotides 303 to 315 is a known length heteroplasmy within the mtDNA sequence (30). This induces alignment and variant calling errors with the short read sequencing data leading to spurious results, and therefore these positions were excluded from further analysis. There are additional indels of C 3106–3107 and 16184–93. Therefore, we also excluded these mitochondrial positions from further analysis.
MAF Analysis
For each base position and tissue type, the large depth of coverage allowed us to determine the MAF on an individual participant basis. The primary metric used to measure instability was the difference in MAF for each position with respect to a 50 year change in age (31). This change was estimated using a separate logistic regression model for each position and tissue type, and assumed a quasi-binomial model for the variance. This allowed the model to account for extrabinomial sources of variation, for example, sequencing errors. The fit for any given position allowed for a separate intercept per family to account for the possibility of a baseline level of heteroplasmy for a given family/position pair. We considered that an age-related change in MAF of 5% for muscle tissue over a 50 year age span (eg, 15% at age 80 vs 5% at age 30) is a biologically relevant effect (31). The number of effects of that size observed in blood tissue, however, likely represents biological noise and thus provides a natural within-experiment threshold for the false discovery rate.
Statistical Analysis of Physiological Data Over Generations and with Age
The analysis fit a separate model MAF = a + b × age for each location. The primary base was separately determined for each location/family pair to allow for possible genetic diversity, the resultant MAF values fall in the range of 0–0.5. For each fit, the intercept term was allowed to vary per family by using a random effects model. This allows for potentially different baseline levels of heteroplasmy for each location within each family. Model parameters were estimated using the restricted maximum likelihood estimator. Post hoc comparisons among generations were corrected for multiple comparisons using the Tukey–Kramer correction. No correction for multiple testing has been applied to reported p values. Analyses were done using the SAS system (version 9.3, Cary, NC).
The target value from the analysis is the rate b for accumulation of new mutations, for each location. Any systematic errors in sequencing, for example, a baseline rate of miscalls or incorrect alignments from the analysis pipeline, will change the estimated intercepts but have no effect on the calculated rate of acquisition b. Any increases whose final level remain below the global miscall rate of 0.7% would not be visible, but the physiologic impact of such a low rate is debatable
Results
Declining Physical Performance With Age
As expected, skeletal muscle strength declined significantly with increasing age (Table 1). This age-related strength loss was evident in several major upper and lower body muscle groups, measured from 1-repetition maximal strength during leg press, chest press, and arm curl movements (Table 1). These changes in muscle strength were not accompanied by changes in fat-free mass, although a modest increase in body mass index and percent body fat were evident with increasing age (Table 1). Whole-body aerobic capacity (VO2 peak) was measured from a graded exercise test to exhaustion on a cycle ergometer. VO2 peak significantly declined with increasing age (Table 1, Figure 1A). Since physical activity is an important determinant of muscle function and whole-body VO2 peak, we comprehensively measured free-living physical activity patterns in a subset of eight families. A significant age-related decline in total acceleration was observed (Table 1), which showed a significant correlation with whole body VO2 peak (Figure 3A) and muscle oxidative capacity (Figure 3B). In spite of clear reductions in whole-body maximal O2 uptake, there were no significant changes in resting metabolic rate with age (Table 1). Although fasting plasma glucose concentrations increased with age, there were no changes in fasting insulin levels (Table 1).
Table 1.
Anthropometric, Metabolic, and Physical Function Parameters
| Daughters (D) | Mothers (M) | Grandmothers (G) | p Value | Post hoc comparisons* | ||||
|---|---|---|---|---|---|---|---|---|
| Mean | Range | Mean | Range | Mean | Range | |||
| Clinical characteristics | N = 19 | N = 17 | N = 16 | |||||
| Age (years) | 23 | (18–39) | 48 | (40–62) | 70 | (61–89) | <0.001 | D < M,G; M < G |
| BMI (kg/m2) | 24.9 | (18.7–38.7) | 28.9 | (20.9–37.5) | 28.0 | (19.1–34.2) | 0.038 | D < M |
| Body fat (%) | 35.3 | (15.5–47.8) | 42.3 | (30.8–52.3) | 44.0 | (30.3–54.2) | <0.001 | D < M,G |
| Fat free mass (kg) | 41.0 | (35.5–54.4) | 42.0 | (33.6–61.8) | 38.3 | (29.5–47.1) | 0.086 | — |
| Fasting glucose (mg/dL) | 89.8 | (79.5–100.5) | 95.8 | (85.0–106.5) | 97.7 | (77.5–116.5) | 0.001 | D < M,G |
| Fasting insulin (µU/mL) | 6.4 | (3.1–11.8) | 6.5 | (2.5–13.8) | 7.0 | (1.2–15.8) | 0.86 | — |
| VO2 peak (mL/kg FFM/min) | 44.2 | (33.1–55.6) | 37.9 | (27.1–49.1) | 28.6 | (21.3–35.2) | <0.001 | G < M<D |
| Resting metabolic rate, indirect cal EE (kcal/kg FFM/d)† | 41.3 | (32.1–51.1) | 40.0 | (27.9–51.0) | 38.5 | (25.7–45.3) | 0.17 | — |
| Muscle strength | N = 8 | N = 8 | N = 7 | |||||
| Leg press | 87.1 | (63.6–111.4) | 76.4 | (56.8–104.5) | 58.3 | (36.4–84.1) | 0.010 | G < D |
| Chest press | 38.6 | (29.5–43.2) | 40.8 | (33.0–56.8) | 29.5 | (15.9–36.4) | 0.002 | G < D,M |
| Arm curl | 27.6 | (19.5–36.4) | 26.5 | (17.3–33.1) | 16.3 | (3.6–26.4) | 0.001 | G < D,M |
| Activity measurements | N = 9 | N = 7 | N = 7 | |||||
| Total accelerations (acceleration units) | 4502 | (3336–5879) | 4883 | (3221–7023) | 3338 | (2599–4318) | 0.004 | G < D,M |
*Comparisons of daughter (D), mother (M), and grandmother (G) statistically significant at the p < 0.05 after Tukey adjustment.
†Resting metabolic rate was available on 17 daughters and 15 grandmothers. Muscle strength and activity measurement was available on a mutually exclusive subset of the sample.
Figure 1.
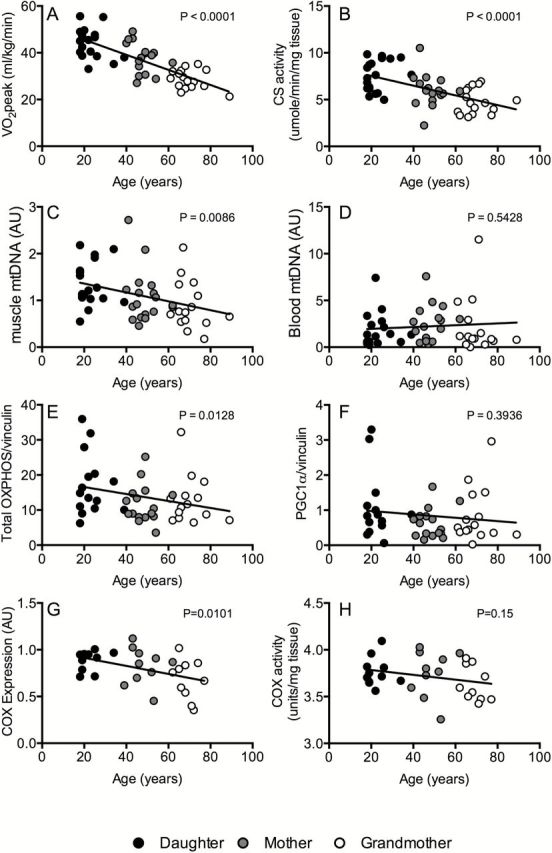
Changes with age in whole-body VO2 peak (A), skeletal muscle citrate synthase activity (B), mtDNA copy number in skeletal muscle (C) and blood (D), protein levels of total oxidative phosphorylation muscle proteins (E) PGC-1α expression (F), cytochrome c oxidase protein content (G), and activity (H). These data show significant correlation of age to oxidative capacity measured at the level of the whole-body (beta = −3.225; p < 0.001) and skeletal muscle (beta = 0.536; p < 0.001). There was significant correlation of age with muscle mtDNA (beta = −0.095; p = 0.009), but not with blood mtDNA (beta = 0.088; p = 0.54). Skeletal muscle expression levels of oxidative phosphorylation proteins were significantly correlated to age (beta = −1.153; p = 0.013) but not that of PGC-1α protein levels and age (beta = −0.063; p = 0.39). Beta represents the estimated change in each measurement per 10-year increase in age and is estimated from a hierarchal linear model with a random intercept for each family unit.
Figure 3.

Associations of total accelerations units (AU) with citrate synthase (CS) activity (Panel A) and VO2 peak (Panel B). Greater total accelerations were associated with increased CS activity (beta = 306.3; p = 0.010) and VO2 peak (beta = 109.1; p < 0.001). Beta represents the estimated change in AU for each unit increase in CS activity and VO2 peak estimated from a hierarchal linear model with a random intercept for each family unit.
The Age-Related Loss of Mitochondrial Function and Abundance Cannot Be Explained by Accumulation of mtDNA Mutations
The progressive decline in whole-body aerobic fitness can be partly explained by an age-related reduction in the oxidative capacity of mitochondria in skeletal muscle, measured from the maximal activity of citrate synthase in muscle tissue homogenates (Figure 1B). Next, we determined if this apparent loss of muscle oxidative capacity could be explained by an age-related loss of mitochondrial abundance. mtDNA abundance was measured by real-time quantitative PCR using a probe specific to the mitochondrial-encoded NADH dehydrogenase 4 (ND4). There was a significant age-related decline in mtDNA abundance in skeletal muscle (Figure 1C), but not in blood (Figure 1D). As an additional measure of mitochondrial abundance in skeletal muscle, we measured the expression of representative subunits of the five respiratory chain complexes by western blot. As observed with mtDNA abundance, there was an age-related decline in the abundance of mitochondrial proteins (Figure 1E, Supplemental Figure 1) but no age-related changes in the abundance of PGC1α, a transcriptional regulator of mitochondrial biogenesis (Figure 1F). A significant age-related decline in COX protein expression was observed.
Next, we determined whether the observed changes in mitochondrial function could be associated with increased mutations to mtDNA with aging by performing full sequencing of the mitochondrial genomes from skeletal muscle and blood and scanning for large deletions by gel electrophoresis. Changes in MAF between grandmothers and daughters at all positions within the mitochondrial genomes sequenced from skeletal muscle and blood cells are shown in Figure 2. No large deletions were noted in any of the cases (Supplement Figure 2). Only two positions in muscle mtDNA—positions 189 and 408 within the noncoding D-loop region—showed a >5% change in MAF over a 50-year span (eg, grandmothers vs daughters). This modest change in MAF with aging suggests that accumulation of deletions or mutations in mtDNA may not be a major determinant of mitochondrial dysfunction that occurs with aging. Among the variables measured in the present study, we found that physical activity level was the best predictor of whole-body and muscle-specific oxidative capacity in this cohort of women (Figure 3). Given the emerging role of sirtuins in regulating mitochondrial biology (32) and our previous observations in unrelated individuals that the age-related reduction in the expression of the mitochondrial-localized SIRT3 was prevented by exercise (12), we determined if such a mechanism could potentially explain the loss of mitochondrial function in spite of modest changes in mtDNA MAF in the present cohort that share the same mitochondrial genome. The expression of SIRT3 was significantly lower in grandmothers in comparison to the daughters, and the levels of acetylated lysine were higher in grandmothers compared to daughters (Figure 4).
Figure 2.

Changes in minor allele frequency (MAF) by position number. Changes are based on a position-by-position analysis of using a logistic regression model with a quasi-binomial variance structure and family-specific intercept. The change in MAF was estimated from the fitted model for a 50-year difference (80 years vs 30 years of age). Changes >5% in the MAF over this 50-year period were considered clinical relevant. Only two locations (positions 189 and 408) reached this criterion, both in the noncoding D-loop region.
Figure 4.

The abundance of acetylated lysine residues was significantly increased in skeletal muscle proteins of grandmothers compared to daughters. The expression of mitochondrial-localized SIRT3 was decreased in grandmothers compared to daughters. Data represent means ± SEM. * denotes significant (p < 0.05) difference in a pairwise comparison of grandmothers and daughters.
Discussion
In the current study, we present evidence that in three generations of women, the skeletal muscle mtDNA abundance declines with age in parallel to the age-related decline in muscle oxidative capacity, whole-body aerobic fitness, muscle strength and total acceleration counts on physical activity monitors. The observed accumulation of specific point mutations based on mtDNA sequencing and gel electrophoresis do not explain these functional alterations with age. Nevertheless, these biopsy-based measurements from muscle tissue may not capture the whole mutations and deletions of mtDNA. These results together indicate that the declines in physical activity and physical performance are related to the decline in oxidative capacity and mtDNA abundance. In addition, a decline in skeletal muscle SIRT3 expression in association with an increase in lysine acetylation suggests a potential role for a decline in SIRT3 as a key deacetylase in age-related mitochondrial decline.
The current results indicate that mtDNA mutations, as demonstrated by a MAF >5%, only occurred in two noncoding locations. The finding of an age-related change in the MAF in skeletal muscle at positions 189 and 408 in the current study is consistent with a previous cross sectional study that also found an age-related increase in muscle specific mutations in positions 189 and 408 (33). These locations do not encode any proteins therefore mutations in these locations are unlikely to explain the decline in physical function clearly noted in the current study. However, we recognize that the possibility that these mutations could have an impact on mtDNA replication cannot be completely excluded as potentially important to age-related phenotypes. Nevertheless, our methods of next-generation sequencing and gel electrophoresis interrogate for the presence of accumulated mitochondrial point mutations or deletions at the tissue level. The mtDNA deletions reported previously in aged muscle (34–36) are not uniformly distributed. mtDNA deletion mutations have been reported not to occur uniformly but are clonally expanded in short segments of muscle fibers causing local electron chain transport deficiency (37,38). Such localized deletions could potentially lead to fiber degradation (38). Such a fiber degeneration may contribute to decline in fiber numbers reported with age (39). Recently, Kennedy et al. (40) applying a sensitive approach have shown that the load of point mutations in mitochondria is quite high, but consists of many mutations, each found in a very small fraction of mitochondria in a tissue. The human study we performed analyzed mtDNA in tissue and not in single fibers and found that the accumulation of such mutations and deletions are not extensive. Nevertheless, our muscle mitochondrial oxidative capacity (citrate synthase) measurement was also performed at tissue levels, and these correlate well with whole body decline in maximal oxidative capacity. The decline in whole body oxidative capacity associated with the decrease in the mtDNA copy number with respect to age.
The finding in the current study that a significant decline in mtDNA abundance does occur with age might have important implications in developing measures to prevent and/or treat age-related sarcopenia. The previous reports in genetically unrelated people (8,12) showing that decline in maximal oxidative capacity based (VO2 peak and skeletal muscle citrate synthase) with age is confirmed in the current study in three generations of genetically related women. In previous studies in unrelated individuals higher oxidative DNA damage (8) and lower endogenous antioxidants, SOD2 and catalase protein expressions are noted in older individuals (41). Oxidative damage to mtDNA has been shown to cause degradation of DNA (42,43) and thus may not necessarily cause accumulation of deletions but may cause a decline in mtDNA copy numbers. The replication of mtDNA is regulated by transcription factor A mitochondrial which is under the regulation of peroxisome-proliferator-activated receptor α (PGC1-α) both of which are nuclear encoded genes (12,44). In the current study in women who do not engage in regular aerobic training, mtDNA abundance and expression of mitochondrial proteins are reduced with age with no compensatory increase in PGC1-α. mtDNA copy number and maximal oxidative capacity have been reported to increase in elderly individuals engaged in aerobic exercise program when the expression of PGC-1 α increases along with its downstream transcription factor transcription factor A mitochondrial (12,45). The responsiveness to an aerobic exercise program argues against any permanent change to mtDNA integrity. Accumulation of DNA mutations or deletions, if they occurred, would be an irreversible change unlike the decline in mtDNA copy number that can be corrected by an exercise program.
The current findings in genetically related women show that the decline in mtDNA copy number is significantly associated with a decline in citrate synthase activity, which is a determinant of skeletal muscle oxidative capacity. Moreover, this change in the oxidative capacity of skeletal muscle is closely associated with whole-body oxygen capacity, which is a major determinant of endurance that is known to decline with age (46). Although the decline in muscle strength is also associated with the decline in muscle oxidative capacity, another key determinant of muscle function and strength is contractile proteins such as myosin heavy chain. Previous studies have shown that myosin heavy chain synthesis rates, an ATP dependent process, also decline with age (47). It is therefore likely that reduced skeletal muscle oxidative capacity may affect many energy requiring processes and at least partly explain the decline in muscle strength with age. The current study also showed that a decline in oxidative capacity is associated with a decline in acceleration measured by physical activity monitoring system. This observation is consistent with a hypothesis that activity levels are related to mitochondrial oxidative capacity (48). Humans and many other species slow down with age (5,6,49) and this slowing down has been shown to accelerate mortality (49). Aerobic exercise and enhancement of muscle mitochondrial oxidative capacity have been shown to increase activity levels in rodents (50) and decrease overall mortality and morbidity in humans (51). It has been shown that the relative risk of death in people with various morbidities increases significantly and survival is significantly lower when aerobic exercise capacity is low (52) and it is known that muscle mitochondrial oxidative capacity is a major determinant of aerobic capacity (8). It is, therefore, a reasonable approach to attempt to prevent many age-related physical disabilities that result in mortality and morbidity by preventing mitochondrial decline or by enhancing mitochondrial oxidative capacity by exercise or other means.
Another finding in the current study is that skeletal muscle SIRT3 expression was lower in grandmothers. SIRT3 is localized to the mitochondrial matrix and belongs to the Sirtuin family of nicotinamide-adenine-dinuceotide-dependent protein deacetylases (53). SIRT3 has been reported to be a regulator of adaptive thermogenesis and decreases mitochondrial membrane potential and reactive oxygen species production while increasing mitochondrial respiration (54). SITRT3 regulates acetylation levels of many mitochondrial enzymes including acetyl coenzyme A2 (55), glutamate dehydrogenase (56), and superoxide dismutase 2 (57). SIRT3 gene variability has been linked to survivorship in the elderly people (58). In the current study, the lower expression of skeletal muscle SIRT3 in combination with higher lysine acetylation of several proteins also indicate that factors other than mtDNA mutation likely explain reduced mitochondrial oxidative capacity with age. Due to the limitation of the size of the muscle biopsy sample, we did not analyze the specific proteins that are more acetylated in the grandmother, but in a recent study we reported that in elderly people aerobic exercise increased SIRT3 expression in association with a decrease acetylation of IDH2, a mitochondrial protein regulating cellular antioxidant stress response (41). Another study demonstrated that NAD+ enhances mitochondrial OXPHOS function in SIRT1 dependent manner. It remains to be determined whether SIRT3 another member of the Sirtuins family has similar effect on mitochondrial homeostasis.
Unlike studies in flies, worms and mice with short life-spans, prospective studies on mitochondrial aging and mutations are not feasible in humans and therefore to our best knowledge all the age-related changes in mitochondrial function and mtDNA studies have been done in cross sectional populations. Here, our study design of studying different generations of women who inherit the same mtDNA offered us a unique opportunity to study the age effect on mtDNA and oxidative capacity. We also recruited women without any major comorbidity. We however cannot exclude the potential impact on mitochondria of other illnesses incurred during the aging of our study participants.
In summary, here we report that mtDNA integrity remains relatively intact across multiple generations of women. It is, however, evident that oxidative capacity declines across the three generations of women in conjunction with the physical performance including acceleration time. The decline in mtDNA and the oxidative capacity are potentially reversible, offering opportunities for potential interventions to prevent decline in many of the physical disabilities associated with age.
Funding
This work was supported by grants from the National Institutes of Health R01 AG09531, CTSA Grant Number UL1 TR000135 from the National Center for Advancing Translational Science (NCATS), and Mayo Clinic Metabolomics Resource Core (grant number U24DK100469) from the National Institute of Diabetes and Digestive and Kidney Diseases which originates from the National Institutes of Health Director’s Common Fund.
Supplementary Material
Acknowledgments
We gratefully acknowledge the nursing staff of the Clinical Research Unit and skillful technical support of Ms. Jill Schimke and Dawn Morse and study coordination by Maureen Bigelow and for expert statistical analysis by Doug Mahoney. The authors have no conflict of interest or financial interest to disclose.
S.H. analyzed samples, interpreted data, and wrote the manuscript; P.M.R. analyzed the data and wrote manuscript; I.R.L. analyzed and interpreted data and wrote the manuscript; S.M.S. performed the study and wrote the manuscript; J.A.L. designed the study and wrote the manuscript; S.M. analyzed the data and wrote the manuscript; R.E.C. analyzed the data and wrote the manuscript; K.K. analyzed the samples and wrote the manuscript; T.T. analyzed the data and wrote the manuscript; E.H. interpreted the data and wrote the manuscript. K.S.N. designed the study, supervised the conduct of the study and analysis of samples and data, interpreted the data and wrote the manuscript.
References
- 1. United Nations Department of Economic and Social Affairs Population Division. World Population Ageing. The University of California; 2013;207:1950–2050. [Google Scholar]
- 2. Nicklett EJ, Semba RD, Xue QL, et al. Fruit and vegetable intake, physical activity, and mortality in older community-dwelling women. J Am Geriatr Soc. 2012;60:862–868. doi:10.1111/j.1532-5415.2012.03924.x [DOI] [PMC free article] [PubMed] [Google Scholar]
- 3. Paffenbarger RS, Jr, Hyde RT, Wing AL, Hsieh CC. Physical activity, all-cause mortality, and longevity of college alumni. N Engl J Med. 1986;314:605–613. doi:10.1056/NEJM198603063141003 [DOI] [PubMed] [Google Scholar]
- 4. Herndon LA, Schmeissner PJ, Dudaronek JM, et al. Stochastic and genetic factors influence tissue-specific decline in ageing C. elegans. Nature. 2002;419:808–814. doi:10.1038/nature01135 [DOI] [PubMed] [Google Scholar]
- 5. Kirkwood TB, Finch CE. Ageing: the old worm turns more slowly. Nature. 2002;419(6909):794–795. doi:10.1038/419794a [DOI] [PubMed] [Google Scholar]
- 6. Harris AM, Lanningham-Foster LM, McCrady SK, Levine JA. Nonexercise movement in elderly compared with young people. Am J Physiol Endocrinol Metab. 2007;292:E1207–E1212. doi:10.1152/ajpendo.00509.2006 [DOI] [PubMed] [Google Scholar]
- 7. Chelius D, Bondarenko PV. Quantitative profiling of proteins in complex mixtures using liquid chromatography and mass spectrometry. J Proteome Res. 2002;1:317–323. doi:10.1021/pr025517j [DOI] [PubMed] [Google Scholar]
- 8. Short KR, Bigelow ML, Kahl J, et al. Decline in skeletal muscle mitochondrial function with aging in humans. Proc Natl Acad Sci U S A. 2005;102:5618–5623. doi:10.1073/pnas.0501559102 [DOI] [PMC free article] [PubMed] [Google Scholar]
- 9. Petersen KF, Befroy D, Sufour S, et al. Mitochondrial dysfunction in the elderly: possible role in insulin resistance. Science. 2003;300(5622):1140–1142. [DOI] [PMC free article] [PubMed] [Google Scholar]
- 10. Wallace DC. Mitochondrial genetics: a paradigm for aging and degenerative diseases? Science. 1992;256:628–632. [DOI] [PubMed] [Google Scholar]
- 11. Harman D. The biologic clock: the mitochondria? J Am Geriatr Soc. 1972;20:145–147. [DOI] [PubMed] [Google Scholar]
- 12. Lanza IR, Short DK, Short KR, et al. Endurance exercise as a countermeasure for aging. Diabetes. 2008;57:2933–2942. doi:10.2337/db08-0349 [DOI] [PMC free article] [PubMed] [Google Scholar]
- 13. Liesa M, Shirihai OS. Mitochondrial dynamics in the regulation of nutrient utilization and energy expenditure. Cell Metab. 2013;17:491–506. doi:10.1016/j.cmet.2013.03.002 [DOI] [PMC free article] [PubMed] [Google Scholar]
- 14. Trifunovic A, Wredenberg A, Falkenberg M, et al. Premature ageing in mice expressing defective mitochondrial DNA polymerase. Nature. 2004;429:417–423. doi:10.1038/nature02517 [DOI] [PubMed] [Google Scholar]
- 15. Kujoth GC, Hiona A, Pugh TD, et al. Mitochondrial DNA mutations, oxidative stress, and apoptosis in mammalian aging. Science. 2005;309:481–484. doi:10.1126/science.1112125 [DOI] [PubMed] [Google Scholar]
- 16. Linnane AW, Marzuki S, Ozawa T, Tanaka M. Mitochondrial DNA mutations as an important contributor to ageing and degenerative diseases. Lancet. 1989;1:642–645. doi:10.1016/S0140-6736(89)92145-4 [DOI] [PubMed] [Google Scholar]
- 17. Lee CM, Chung SS, Kaczkowski JM, Weindruch R, Aiken JM. Multiple mitochondrial DNA deletions associated with age in skeletal muscle of rhesus monkeys. J Gerontol Biol Sci. 1993;48(6):B201–B205. doi:10.1093/geronj/48.6.B201 [DOI] [PubMed] [Google Scholar]
- 18. Katayama M, Tanaka M, Yamamoto H, Ohbayashi T, Nimura Y, Ozawa T. Deleted mitochondrial DNA in the skeletal muscle of aged individuals. Biochem Int. 1991;25:47–56. [PubMed] [Google Scholar]
- 19. Karakelides H, Irving BA, Short KR, O’Brien P, Nair KS. Age, obesity, and sex effects on insulin sensitivity and skeletal muscle mitochondrial function. Diabetes. 2010;59:89–97. doi:10.2337/db09-0591 [DOI] [PMC free article] [PubMed] [Google Scholar]
- 20. Nair KS, Rizza RA, O’Brien P, et al. DHEA in elderly women and DHEA or testosterone in elderly men. N Engl J Med. 2006;355:1647–1659. doi:10.1056/NEJMoa054629 [DOI] [PubMed] [Google Scholar]
- 21. Proctor DN, Beck KC. Delay time adjustments to minimize errors in breath-by-breath measurement of Vo2 during exercise. J Appl Physiol (1985). 1996;81:2495–2499. doi:0161-7567/96 [DOI] [PubMed] [Google Scholar]
- 22. Villareal DT, Holloszy JO. DHEA enhances effects of weight training on muscle mass and strength in elderly women and men. Am J Physiol Endocrinol Metab. 2006;291:E1003–E1008. doi:10.1152/ajpendo.00100.2006 [DOI] [PubMed] [Google Scholar]
- 23. Nair KS, Halliday D, Griggs RC. Leucine incorporation into mixed skeletal muscle protein in humans. Am J Physiol Endocrinol Metab. 1988;254(17):E208–E213. [DOI] [PubMed] [Google Scholar]
- 24. Levine JA, Lanningham-Foster LM, McCrady SK, et al. Interindividual variation in posture allocation: possible role in human obesity. Science. 2005;307:584–586. doi:10.1126/science.1106561 [DOI] [PubMed] [Google Scholar]
- 25. Levine J, Melanson EL, Westerterp KR, Hill JO. Measurement of the components of nonexercise activity thermogenesis. Am J Physiol Endocrinol Metab. 2001;281:E670–E675. doi:0193-1849/01 [DOI] [PubMed] [Google Scholar]
- 26. Robinson JB, Brent LG, Semgei B, Srere PA. An enzymatic approach to the study of the Krebs tricarboxylic acid cycle. In: Darley-Usmar V, Rickwood D, Wilson MT, eds. Mitochondria. Oxford: IRL Press; 1987: 153–170. [Google Scholar]
- 27. Lanza IR, Zabielski P, Klaus KA, et al. Chronic caloric restriction preserves mitochondrial function in senescence without increasing mitochondrial biogenesis. Cell Metab. 2012;16:777–788. doi:10.1016/j.cmet.2012.11.003 [DOI] [PMC free article] [PubMed] [Google Scholar]
- 28. Andrews RM, Kubacka I, Chinnery PF, Lightowlers RN, Turnbull DM, Howell N. Reanalysis and revision of the Cambridge reference sequence for human mitochondrial DNA. Nat Genet. 1999;23:147. doi:10.1038/13779 [DOI] [PubMed] [Google Scholar]
- 29. Li H, Ruan J, Durbin R. Mapping short DNA sequencing reads and calling variants using mapping quality scores. Genome Res. 2008;18:1851–1858. doi:10.1101/gr.078212.108 [DOI] [PMC free article] [PubMed] [Google Scholar]
- 30. Lutz S, Weisser HJ, Heizmann J, Pollak S. Mitochondrial heteroplasmy among maternally related individuals. Int J Legal Med. 2000;113:155–161. [DOI] [PubMed] [Google Scholar]
- 31. The International HapMap Consortium. A haplotype map of the human genome. Nature. 2005;437(7063):1299–1320. doi:10.1038/nature04226 [DOI] [PMC free article] [PubMed] [Google Scholar]
- 32. Brown K, Xie S, Qiu X, et al. SIRT3 reverses aging-associated degeneration. Cell Rep. 2013;3:319–327. doi:10.1016/j.celrep.2013.01.005 [DOI] [PMC free article] [PubMed] [Google Scholar]
- 33. Wang Y, Michikawa Y, Mallidis C, et al. Muscle-specific mutations accumulate with aging in critical human mtDNA control sites for replication. Proc Natl Acad Sci U S A. 2001;98:4022–4027. doi:10.1073/pnas.061013598 [DOI] [PMC free article] [PubMed] [Google Scholar]
- 34. Vermulst M, Bielas JH, Kujoth GC, et al. Mitochondrial point mutations do not limit the natural lifespan of mice. Nat Genet. 2007;39:540–543. doi:10.1038/ng1988 [DOI] [PubMed] [Google Scholar]
- 35. Khrapko K, Vijg J. Mitochondrial DNA mutations and aging: a case closed? Nat Genet. 2007;39:445–446. doi:10.1038/ng0407-445 [DOI] [PubMed] [Google Scholar]
- 36. Marette A, Mitchell P. Statin-induced insulin resistance through inflammasome activation: sailing between Scylla and Charybdis. Diabetes. 2014;63:3569–3571. doi:10.2337/db14-1059 [DOI] [PubMed] [Google Scholar]
- 37. Bua E, Johnson J, Herbst A, et al. Mitochondrial DNA-deletion mutations accumulate intracellularly to detrimental levels in aged human skeletal muscle fibers. Am J Hum Genet. 2006;79:469–480. doi:10.1086/507132 [DOI] [PMC free article] [PubMed] [Google Scholar]
- 38. Herbst A, Pak JW, McKenzie D, Bua E, Bassiouni M, Aiken JM. Accumulation of mitochondrial DNA deletion mutations in aged muscle fibers: evidence for a causal role in muscle fiber loss. J Gerontol A Biol Sci Med Sci. 2007;62:235–245. [DOI] [PMC free article] [PubMed] [Google Scholar]
- 39. Larsson L, Sjödin B, Karlsson J. Histochemical and biochemical changes in human skeletal muscle with age in sedentary males, age 22–65 years. Acta Physiol Scand. 1978;103:31–39. [DOI] [PubMed] [Google Scholar]
- 40. Kennedy SR, Salk JJ, Schmitt MW, Loeb LA. Ultra-sensitive sequencing reveals an age-related increase in somatic mitochondrial mutations that are inconsistent with oxidative damage. PLoS Genet. 2013;9:e1003794. doi:10.1371/journal.pgen.1003794 [DOI] [PMC free article] [PubMed] [Google Scholar]
- 41. Johnson ML, Irving BA, Lanza IR, et al. Differential effect of endurance training on mitochondrial protein damage, degradation, and acetylation in the context of aging. J Gerontol A Biol Sci Med Sci. 2015;pii:glu221 [Epub ahead of print]. doi:10.1093/gerona/glu221 [DOI] [PMC free article] [PubMed] [Google Scholar]
- 42. Shokolenko I, Venediktova N, Bochkareva A, Wilson GL, Alexeyev MF. Oxidative stress induces degradation of mitochondrial DNA. Nucleic Acids Res. 2009;37:2539–2548. doi:10.1093/nar/gkp100 [DOI] [PMC free article] [PubMed] [Google Scholar]
- 43. Shokolenko IN, Wilson GL, Alexeyev MF. Persistent damage induces mitochondrial DNA degradation. DNA Repair (Amst). 2013;12:488–499. doi:10.1016/j.dnarep.2013.04.023 [DOI] [PMC free article] [PubMed] [Google Scholar]
- 44. Wu Z, Puigserver P, Andersson U, et al. Mechanisms controlling mitochondrial biogenesis and respiration through the thermogenic coactivator PGC-1. Cell. 1999;98:115–124. doi:10.1016/S0092-8674(00)80611-X [DOI] [PubMed] [Google Scholar]
- 45. Short KR, Bigelow ML, Nair KS. Age effect on muscle mitochondrial function and impaired glucose tolerance after a mixed meal. Diabetes 52(suppl 1): A346 2003. [Google Scholar]
- 46. Heath GW, Hagberg JM, Ehsani AA, Holloszy JO. A physiological comparison of young and older endurance athletes. J Appl P. 1981;51:634–640. [DOI] [PubMed] [Google Scholar]
- 47. Balagopal P, Rooyackers OE, Adey DB, Ades PA, Nair KS. Effects of aging on in vivo synthesis of skeletal muscle myosin heavy-chain and sarcoplasmic protein in humans. Am J Physiol Endocrinol Metab. 1997;273:E790–E800. [DOI] [PubMed] [Google Scholar]
- 48. Nair KS. Aging muscle: what causes it? E.V. McCollum lecture 2004. Am J Clin Nutr. 2005;81:953–963. [DOI] [PubMed] [Google Scholar]
- 49. Talbot LA, Morrell CH, Fleg JL, Metter EJ. Changes in leisure time physical activity and risk of all-cause mortality in men and women: the Baltimore longitudinal study of aging. Prev Med. 2007;45:169–176. doi:10.1016/j.ypmed.2007.05.014 [DOI] [PubMed] [Google Scholar]
- 50. Chow LS, Greenlund LJ, Asmann YW, et al. Impact of endurance training on murine spontaneous activity, muscle mitochondrial DNA abundance, gene transcripts, and function. J Appl Physiol (1985). 2007;102:1078–1089. doi:10.1152/japplphysiol.00791.2006 [DOI] [PubMed] [Google Scholar]
- 51. Chakravarty EF, Hubert HB, Lingala VB, Fries JF. Reduced disability and mortality among aging runners: a 21-year longitudinal study. Arch Intern Med. 2008;168:1638–1646. doi:10.1001/archinte.168.15.1638 [DOI] [PMC free article] [PubMed] [Google Scholar]
- 52. Myers J, Prakash M, Froelicher V, Do D, Partington S, Atwood JE. Exercise capacity and mortality among men referred for exercise testing. N Engl J Med. 2002;346:793–801. doi:10.1056/NEJMoa011858 [DOI] [PubMed] [Google Scholar]
- 53. Schwer B, North BJ, Frye RA, Ott M, Verdin E. The human silent information regulator (Sir)2 homologue hSIRT3 is a mitochondrial nicotinamide adenine dinucleotide-dependent deacetylase. J Cell Biol. 2002;158:647–657. doi:10.1083/jcb.200205057 [DOI] [PMC free article] [PubMed] [Google Scholar]
- 54. Shi T, Wang F, Stieren E, Tong Q. SIRT3, a mitochondrial sirtuin deacetylase, regulates mitochondrial function and thermogenesis in brown adipocytes. J Biol Chem. 2005;280:13560–13567. doi:10.1074/jbc.M414670200 [DOI] [PubMed] [Google Scholar]
- 55. Hallows WC, Lee S, Denu JM. Sirtuins deacetylate and activate mammalian acetyl-CoA synthetases. Proc Natl Acad Sci U S A. 2006;103:10230–10235. doi:10.1073/pnas.0604392103 [DOI] [PMC free article] [PubMed] [Google Scholar]
- 56. Schlicker C, Gertz M, Papatheodorou P, Kachholz B, Becker CF, Steegborn C. Substrates and regulation mechanisms for the human mitochondrial sirtuins Sirt3 and Sirt5. J Mol Biol. 2008;382:790–801. doi:10.1016/j.jmb.2008.07.048 [DOI] [PubMed] [Google Scholar]
- 57. Qiu X, Brown K, Hirschey MD, Verdin E, Chen D. Calorie restriction reduces oxidative stress by SIRT3-mediated SOD2 activation. Cell Metab. 2010;12:662–667. doi:10.1016/j.cmet.2010.11.015 [DOI] [PubMed] [Google Scholar]
- 58. Rose G, Dato S, Altomare K, et al. Variability of the SIRT3 gene, human silent information regulator Sir2 homologue, and survivorship in the elderly. Exp Gerontol. 2003;38:1065–1070. doi:10.1016/S0531-5565(03)00209-2 [DOI] [PubMed] [Google Scholar]
Associated Data
This section collects any data citations, data availability statements, or supplementary materials included in this article.