Leaves from different species exhibit divergence in growth allometry and expression differences in key regulatory molecules underlay this diversity.
Abstract
Lateral appendages often show allometric growth with a specific growth polarity along the proximo-distal axis. Studies on leaf growth in model plants have identified a basipetal growth direction with the highest growth rate at the proximal end and progressively lower rates toward the distal end. Although the molecular mechanisms governing such a growth pattern have been studied recently, variation in leaf growth polarity and, therefore, its evolutionary origin remain unknown. By surveying 75 eudicot species, here we report that leaf growth polarity is divergent. Leaf growth in the proximo-distal axis is polar, with more growth arising from either the proximal or the distal end; dispersed with no apparent polarity; or bidirectional, with more growth contributed by the central region and less growth at either end. We further demonstrate that the expression gradient of the miR396-GROWTH-REGULATING FACTOR module strongly correlates with the polarity of leaf growth. Altering the endogenous pattern of miR396 expression in transgenic Arabidopsis thaliana leaves only partially modified the spatial pattern of cell expansion, suggesting that the diverse growth polarities might have evolved via concerted changes in multiple gene regulatory networks.
INTRODUCTION
Leaf growth dynamics in several model plant species involve a basipetal growth gradient in the proximo-distal axis (Poethig and Sussex, 1985; Freeling, 1992; Donnelly et al., 1999; Nath et al., 2003; Ori et al., 2007). An early pattern with the highest growth rate at the proximal end and progressively lower growth rates toward the distal end is established at the primordial stage and persists till later stages of growth (Andriankaja et al., 2012; Kuchen et al., 2012; Remmler and Rolland-Lagan, 2012). This basipetal growth pattern of leaves is also reflected in cellular activities. Cell proliferation is arrested early at the distal region of a growing leaf while cells at the proximal region continue to divide for a longer period (Nath et al., 2003; Andriankaja et al., 2012). By contrast, cells toward the distal end display early signs of differentiation and maturation compared with the more proximal cells. While the genetic mechanisms governing the precise timing of this exit from the proliferative stage still remain speculative, factors that promote differentiation or allow continued proliferation have been studied in some detail (Powell and Lenhard, 2012).
Recent molecular genetic studies have implicated two modules of microRNA-regulated transcription factors as important regulators of the proximo-distal patterning of cell proliferation and differentiation during leaf growth, namely, the miR319-TEOSINTE BRANCHED1, CYCLOIDEA, PROLIFERATING CELL FACTORS (miR319-TCPs) and the miR396-GROWTH-REGULATING FACTOR (GRF) modules (Palatnik et al., 2003; Ori et al., 2007; Pulido and Laufs, 2010; Rodriguez et al., 2010; Wang et al., 2011; Debernardi et al., 2012; Hepworth and Lenhard, 2014). Several class II TCP genes promote cell differentiation along the proximo-distal axis of leaves in a spatio-temporally regulated manner (Nath et al., 2003; Ori et al., 2007; Martín-Trillo and Cubas, 2010). The TCP genes and miR319 show opposite expression patterns in young Arabidopsis thaliana leaves (Palatnik et al., 2003; Ori et al., 2007; Nag et al., 2009), which has been interpreted to indicate that the TCP genes promote exit from cell proliferation in their domain of expression while miR319 restricts the expression of its target TCP genes at the proximal region, thus allowing continued proliferation at the base (Ori et al., 2007). The miR319 sequence and its target sites in the TCP transcripts are conserved across the plant kingdom, suggesting their conserved role during plant evolution (Palatnik et al., 2003, 2007; Axtell and Bartel, 2005; Axtell and Bowman, 2008). The GRFs and miR396 also show opposite expression gradients in young Arabidopsis leaves, with the GRFs being expressed in a declining base-to-tip gradient and miR396 in a declining tip-to-base gradient (Rodriguez et al., 2010; Wang et al., 2011; Debernardi et al., 2012). Reporter analysis has shown that the promoter of GRF2 is active throughout the leaf lamina in developing Arabidopsis leaves (Rodriguez et al., 2010; Debernardi et al., 2012). This implicates miR396 in shaping the final expression gradient of its target GRFs. Interestingly, reporters for cell division such as CYCLINB1;1 and CYCLINB1;2 are coexpressed in the regions where GRF genes are expressed (Rodriguez et al., 2010; Debernardi et al., 2012), while the expression of these cell division markers is absent from the miR396 expression domain (Debernardi et al., 2012). Furthermore, the miR319-TCP and the miR396-GRF pathways seem to interact in planta since an increased TCP4 activity in Arabidopsis leads to increased levels of miR396 (Rodriguez et al., 2010). The miR319-TCP and miR396-GRF modules regulate leaf size and shape by affecting cell division and maturation both spatially and temporally. Given that both these modules profoundly affect leaf morphogenesis, they may serve as evolutionary targets to modify leaf growth pattern across species.
Differential growth within an organism or an organ has been historically studied in the field of allometry, which has extensively involved studies on animal growth (Huxley, 1932; Stern and Emlen, 1999). Although most studies on growth allometry aim at establishing a relationship between a growing organ and the rest of the body, allometric growth within an organ, such as between the distal and the proximal counterparts, has also been acknowledged (Huxley, 1932). For example, in a human limb, the growth rate is maximal at the proximal end (e.g., girdle and humerus/femur) and drops gradually toward the distal part, with the metacarpals/metatarsals having the lowest growth rates (Huxley, 1932). The growth rates of different regions bear a constant relationship to each other as well as to that of the whole body. The term “growth gradient” has been applied to explain such a phenomenon (Huxley, 1932). Growth allometry within an organ is most relevant to our study since we are dealing with the development of a specific organ: the leaf. Though allometry is relevant to leaf growth in light of its polar growth pattern described above, earlier studies have not attempted to find a growth relationship between differentially growing parts within a leaf. This is perhaps because the leaf lamina usually does not have morphologically distinct distal and proximal parts. In this study, we revisited leaf growth from the allometric perspective and studied the growth pattern in several eudicot species. We empirically demarcated the proximal and the distal halves of growing leaves by introducing surface markers along the proximo-distal axis and used the law of simple allometry to investigate the relationship between the growing parts. Our analysis uncovers novel aspects of leaf growth polarity and its molecular basis.
RESULTS
Diverse Leaf Growth Allometry
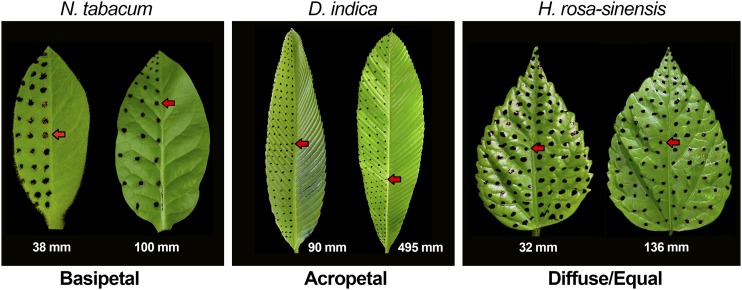
Leaves of all model angiosperms studied to date show a characteristic growth gradient wherein growth progressively declines in the base-to-tip direction (Poethig and Sussex, 1985; Freeling, 1992; Donnelly et al., 1999; Nath et al., 2003; Andriankaja et al., 2012; Nelissen et al., 2012). To test whether variations of this stereotypic growth pattern exist in nature, we marked the adaxial surface of developing leaves with ink spots and monitored their growth by tracking the spots over time (Figure 1; Supplemental Figure 1). A survey of 45 species using this method and covering a wide range of eudicots (listed in Supplemental Tables 1 and 2) identified four types of growth patterns: (1) basipetal growth gradient, as in Nicotiana tabacum, Antirrhinum majus, and Tecoma stans; (2) diffused growth with no apparent growth gradient, as in Hibiscus rosa-sinensis, Bauhinia purpurea, and Cassia spectabilis; (3) acropetal growth gradient, as in Codiaeum variegatum and Dillennia indica; and (4) bidirectional growth pattern (basipetal gradient from middle-to-tip and acropetal gradient from base-to-middle), as in Syzygium jambos.
Figure 1.
Growth Gradients in Growing Leaves.
Ink spots were introduced on the surface of young leaves (pictures to the left) and recorded again at maturity (pictures to the right). The photographs of the young and mature leaves were normalized to the length to compare the relative distribution of the spots and derive the growth polarity. Red arrows show the positions of a particular spot at young and mature stages. Leaf lengths are indicated.
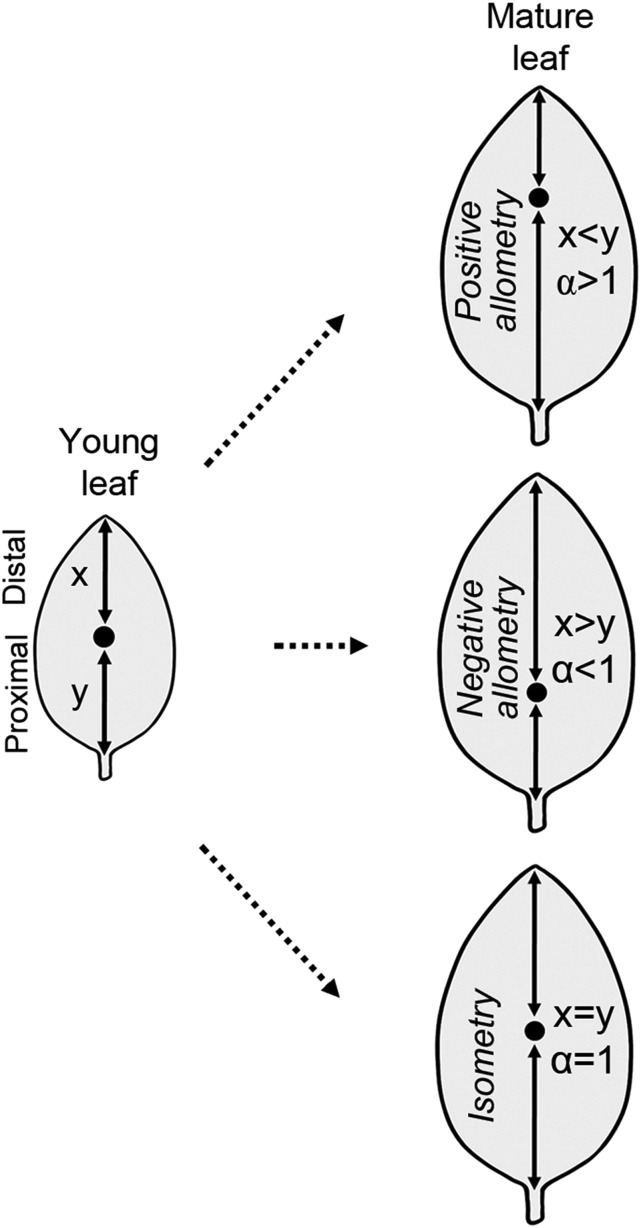
Growth of lateral organs along the proximo-distal axis can in principle be allometric with preferential growth at either end or isometric with no preferred growth polarity. In case of simple allometry between the proximal (y) and the distal (x) parts of a growing organ, y is expected to be proportional to xα, where α is the differential growth constant (or growth ratio) between y and x (Figure 2). In positive allometry, y is greater than x (α > 1), whereas in negative allometry, y is less than x (α < 1). In isometry, y and x are equal; hence, α equals unity (Figure 2). Thus, the value of the parameter α reports on the direction and magnitude of growth polarity (Huxley, 1932; Huxley and Teissier, 1936).
Figure 2.
Schematic Representation of the Method Used in Determining Allometric Leaf Growth Pattern in Diverse Species.
The filled dot represents an ink spot introduced at the middle of the length axis in a young lamina and serves as a traceable surface marker of linear growth. At the start of the measurement, the length of the distal half (x) equals the proximal half (y). A set of (xi,yi) value is collected during leaf growth and fitted to the power equation y∞xα (shown in Figure 3). Depending on the growth polarity, the ink spot is traced within the distal half (x < y, positive allometry), the proximal half (x > y, negative allometry), or in the middle (x = y, isometry) of the mature lamina.
The relative distribution of surface markers in the young and the mature leaves clearly showed that different regions of a growing leaf have different local growth rates along the proximo-distal axis. We wanted to examine whether two given regions of a growing leaf bear a constant relationship to each other as seen in many species of animals. For example, we studied whether the growth ratios between the proximal and the distal halves of a leaf remain constant during growth. However, unlike animals that have morphologically distinct segments in growing organs, leaves do not have any such inherent delineation. Therefore, in order to study the relationship of the growth rates of different parts of the leaves more objectively, we demarcated the distal and proximal halves of a growing leaf by introducing a spot at the center of the proximo-distal axis and followed its relative position during growth (Figures 2 and 3).
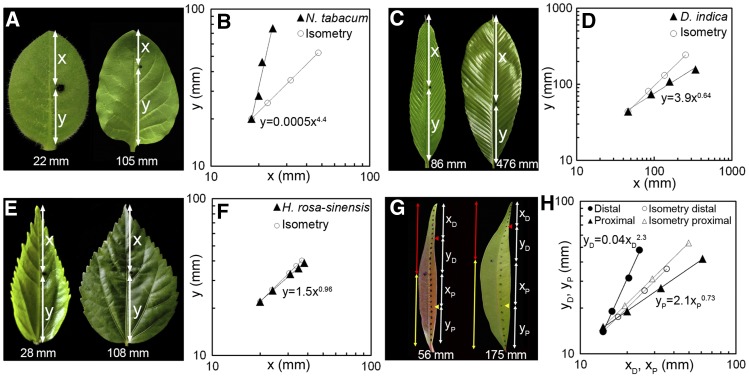
Figure 3.
Analysis of Leaf Growth Allometry.
Ink spots were introduced on the surface of young leaves (pictures on the left in [A], [C], [E], and [G]) of N. tabacum ([A] and [B]), D. indica ([C] and [D]), H. rosa-sinensis ([E] and [F]), and S. jambos ([G] and [H]) and tracked until maturity (pictures on the right) (also see Supplemental Figure 1). For N. tabacum, D. indica, and H. rosa-sinensis, lengths of the distal (x) and the proximal (y) halves were measured at regular intervals, and the (x, y) values were plotted on double logarithmic scale ([B], [D], and [F], respectively) and fitted to the equation y = bxα to determine the value of growth ratio (α). The actual values of x and y during growth are represented by triangles, while circles represent the theoretical values of x and y had the growth been isometric. For S. jambos, which showed bidirectional growth pattern ([G] and [H]), similar analysis of growth allometry was performed for the distal half (red line in [G]) and the proximal half (yellow line in [G]) separately. In the young S. jambos leaf (56 mm long), centers of the distal and the proximal halves are shown by the red and the yellow arrowheads, respectively. xD and yD represent the distal and the proximal parts of the distal half, respectively; xP and yP represent the same in the proximal half (G). The same points are marked in the mature (175 mm long) leaf. Plotting the values of xD and yD on the log scale shows that the distal part of the leaf grows with positive allometry (αDistal = 2.3), while the proximal half of the leaf grows with negative allometry (αProximal = 0.73) (H). Closed circles indicate the actual values of xD and yD and closed triangles those of xP and yP during growth; theoretical values of xD, yD, and xP, yP for isometric growth are represented by open circles and triangles, respectively.
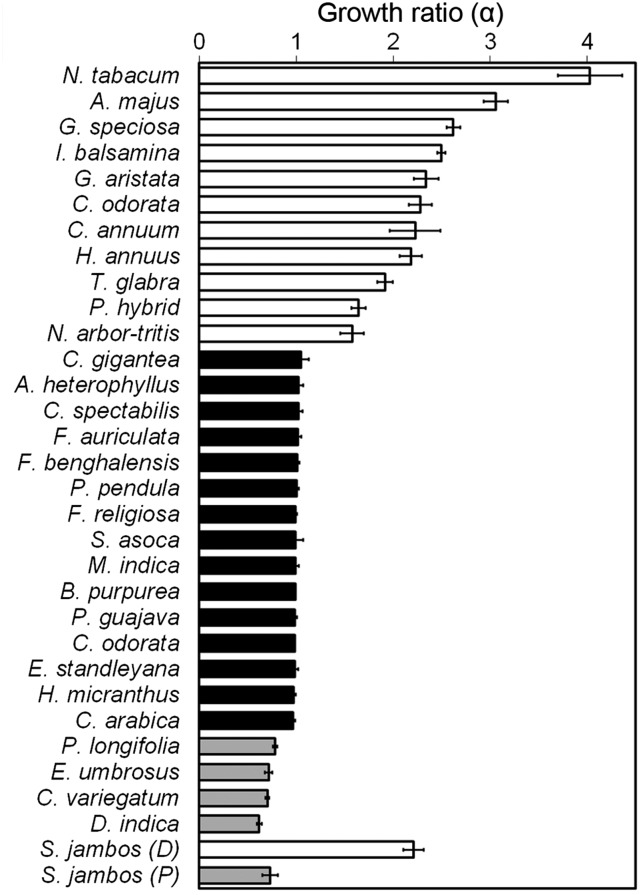
As in allometric growth, if the ratio of the growth rates of the distal and the proximal parts remain constant throughout leaf growth, then plotting the values of x and y on a double logarithmic grid would yield a straight line with a slope (α) equal to the ratio of the growth rates. In all the species studied, we found that the ratio of growth rates of the demarcated proximal and the distal regions remained constant as long as growth occurred in the respective parts, as all the points fell in a straight line in a double logarithmic plot (Figure 3). Based on the law of simple allometry that has been used to calculate the growth ratio (Huxley, 1932), we classified the leaf growth patterns as follows: (1) basipetal growth was classified as positive allometry (α > 1); (2) diffused growth as isometry (α = 1); (3) acropetal growth as negative allometry (α < 1); and (4) bidirectional growth as complex allometry (αDistal > 1 and αProximal < 1) (Figures 2 and 3). The growth ratios (α) derived for several species showed that there is a considerable variation in the α-value across species growing with the same polarity (Figure 4). For example, N. tabacum has a growth ratio of 4 ± 0.3, while Nyctanthes arbor-tritis shows a value of 1.6 ± 0.1 (Figure 4). These differences in values represent the strength of growth gradient in the proximo-distal axis and reflect the differences in the timing at which the different regions of the leaves from different species decelerate in growth.
Figure 4.
Values of α Determined for Leaves from Diverse Eudicot Species.
Values >1, 1, and <1 represent positive allometry (open bars), isometry (black bars), and negative allometry (gray bars), respectively (n = 3 to 5; average ± sd). For S. jambos, α was determined separately for the distal [S. jambos (D)] and the proximal (S. jambos (P)] halves.
Growth Allometry Correlates with the Pattern of Cell Proliferation and Differentiation
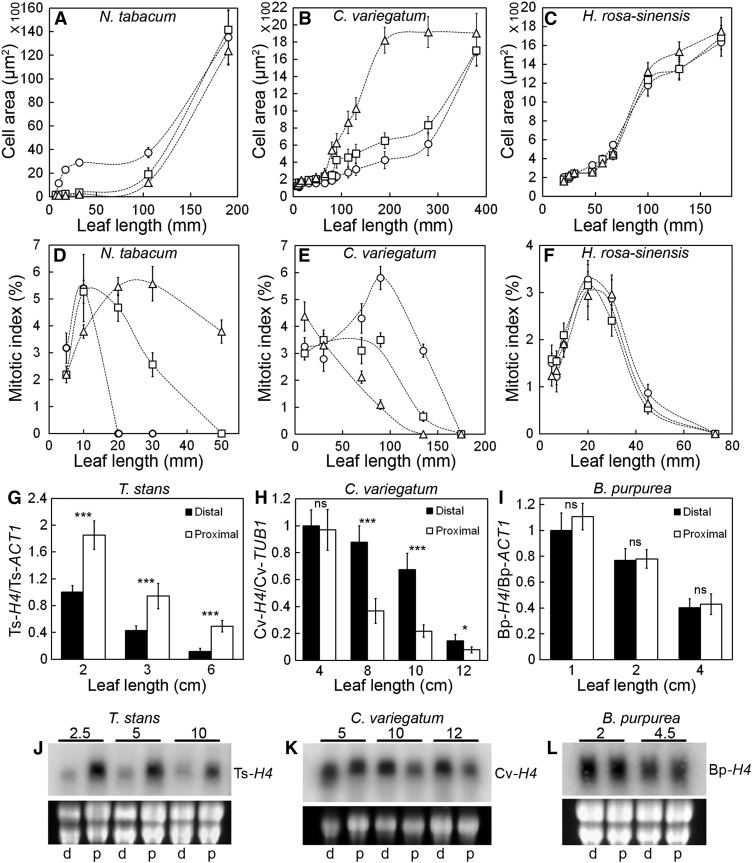
In basipetal growth as seen in many model plants, the base of the leaf shows a longer duration of proliferative activity (Donnelly et al., 1999; Nath et al., 2003; Andriankaja et al., 2012). However, whether this prolonged phase of cell proliferation is also associated with more growth in absolute terms has not been objectively analyzed in many species, although some studies suggest that this might be the case (Poethig and Sussex, 1985; Kuchen et al., 2012). To examine whether the diverse growth allometry described above correlates with the corresponding changes in the direction of cell maturation and proliferation, we studied the dynamics of cell size of the adaxial pavement cells, alongside cell division by quantifying the mitotic cells and HISTONE H4 (H4) expression (Gaudin et al., 2000; Nath et al., 2003). Consistent with the earlier studies (Poethig and Sussex, 1985), in leaves with positive growth allometry such as N. tabacum and T. stans, the cells near the tip matured early, followed by the cells in the middle and then the base (Figure 5A; Supplemental Figure 2A). Correspondingly, mitotic activity fell sharply near the tip with the onset of cell expansion, compared with the more proximal region (Figure 5D). Graded cellular maturity along the proximo-distal axis was also evident in the anatomy of the growing N. tabacum leaves (Supplemental Figure 3A). In striking contrast, the leaves of C. variegatum (negative allometry) showed the earliest signs of cell maturation and cell division arrest near the base while the cells in the more distal region continued to divide for the longest period and matured later (Figures 5B and 5E; Supplemental Figure 3B). In leaves with uniform growth, such as in H. rosa-sinensis and in B. purpurea, all the cells across the proximo-distal direction matured simultaneously and exited mitotic activity synchronously (Figures 5C and 5F; Supplemental Figures 2B and 3C). In S. jambos leaves, tip-to-middle as well as base-to-middle directions of cell maturation were observed at all stages of growth studied (Supplemental Figure 2C). The patterns of mitotic activity described above were also mirrored by the expression of H4. While H4 expression declined first from the distal half of T. stans leaves (positive allometry) (Figures 5G and 5J), an opposite pattern was observed in C. variegatum leaves (negative allometry) (Figures 5H and 5K), and an equal distribution was seen in the B. purpurea leaves (Figures 5I and 5L). Interestingly, young leaves of S. jambos with bidirectional growth pattern showed higher H4 expression at the center compared with either end (Supplemental Figure 2D). These results, combined with the analyses on the overall growth patterns (Figure 1) and growth ratios (Figure 4), indicate that a region of higher cell proliferation is associated with more growth in absolute as well as relative terms. Furthermore, since early leaf growth is driven exclusively by cell proliferation and differentiation starts at a later stage, we propose that the different growth polarities evolved by the superposition of specific patterns of cell differentiation over the continuously dividing mass of cells.
Figure 5.
Dynamics of Cell Size and Cell Division in Growing Leaves.
(A) to (C) Epidermal cell sizes on the adaxial leaf surface at different developmental stages plotted against leaf length (n = 100 to 200; average ± sd). Cells were measured near tip (circles), middle (squares), and base (triangles).
(D) to (F) Mitotic indices calculated from the leaf sections at different developmental stages (n = 1000 to 1500 nuclei; average ± sd). Mitotic figures were counted from sections near the tip (circles), middle (squares) and base (triangles).
(G) to (I) RT-qPCR analysis showing the relative levels of HISTONE H4 in the distal and proximal halves at different developmental stages (n = 3 to 6; average ± sd; *P ≤ 0.05; ***P ≤ 0.0005; ns, P > 0.05).
(J) to (L) RNA gel blots showing the distribution of HISTONE H4 at different stages. Leaf lengths (in cm) are indicated above the blots. Proximal and distal halves are represented by p and d, respectively. Ethidium bromide-stained gels are shown below the blots to indicate RNA loading.
Expression of miR396-GRF Components Correlates with Diverse Growth Polarities
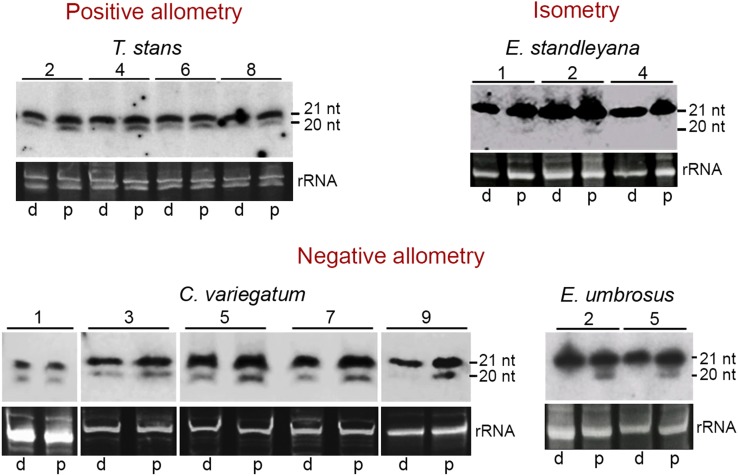
To investigate the molecular basis of divergent polarity in leaf growth, we studied the expression pattern of miR319-TCP and miR396-GRF modules that are conserved across plant kingdom (Supplemental Figure 4) and are known to regulate cell proliferation/differentiation during leaf growth in various species (Palatnik et al., 2003; Martín-Trillo and Cubas, 2010; Pulido and Laufs, 2010; Rodriguez et al., 2010; Debernardi et al., 2012). If the miR319-TCP module is responsible for generating divergent growth polarity, then we would expect corresponding changes in the expression pattern of miR319 and its target TCP genes. However, small RNA gel blots showed that the expression of the 20-nucleotide isoform of miR319 is conserved across the species, irrespective of their growth allometry. This miR319 isoform was always detected more in the proximal half at all developmental stages of the leaves growing with positive allometry (T. stans), negative allometry (Erythrina umbrosus and C. variegatum), or isometry (Erythrina standleyana) (Figure 6). Therefore, we ruled out the association of miR319 expression with the diverse polarity of leaf growth.
Figure 6.
Expression Pattern of miR319 in Developing Leaves.
Small RNA gel blots showing the expression pattern of miR319 in developing leaves with positive allometry, negative allometry, and isometry. The 20-nucleotide band represents miR319, while the 21-nucleotide band is thought to be contributed mostly by the closely related miR159. Leaf lengths (in cm) are indicated above the blots. Proximal and distal halves are represented by p and d, respectively. Ethidium bromide-stained gels are shown for loading control.
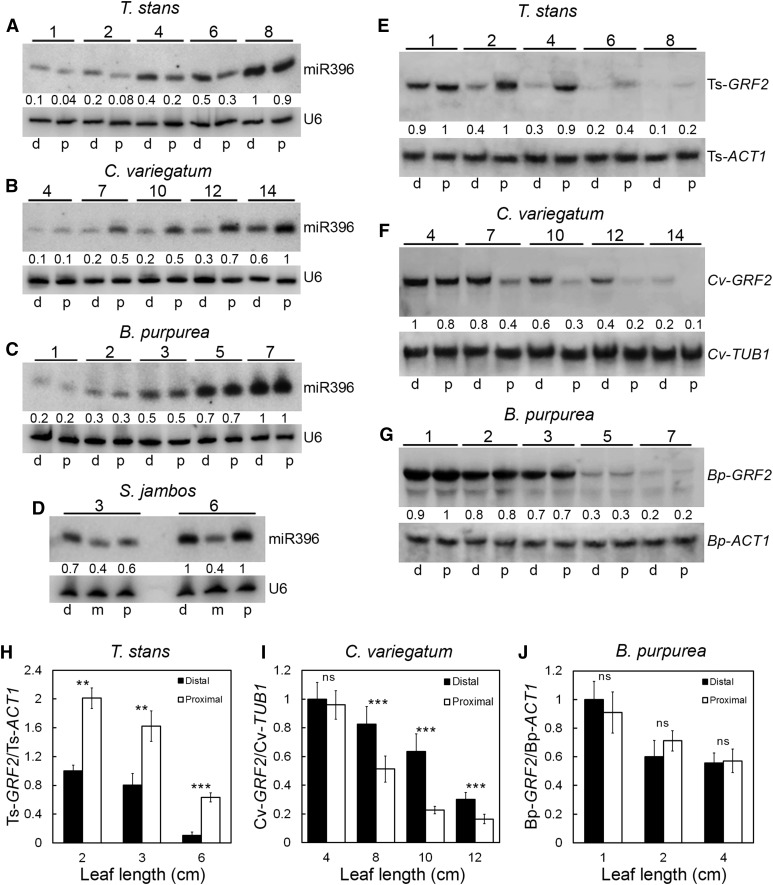
miR396 is expressed in a tip-to-base gradient in young leaves of Arabidopsis and generates an opposite gradient of the target transcripts for the target GRF genes that promote cell proliferation in a basipetal manner (Rodriguez et al., 2010; Debernardi et al., 2012). The domain of the GRF transcripts overlaps with the proliferating zone of the leaf. However, the promoters of miR396-targeted GRFs, such as that of GRF2, are uniformly active throughout the growing Arabidopsis leaf and the gradient of their transcripts is generated by miR396 activity (Rodriguez et al., 2010; Debernardi et al., 2012). Furthermore, in many of the species studied to date, most of the GRFs seem to be targeted by miR396. For example, 7 out of 9 GRFs in Arabidopsis (Rodriguez et al., 2010), 12 out of 14 GRFs in maize (Zea mays; Zhang et al., 2008), and 11 out of 12 GRFs in rice (Oryza sativa; Choi et al., 2004) have the target sequence for miR396. Therefore, miR396 expression can be used to predict the expression pattern of the targeted GRFs. We analyzed the expression gradient of miR396 and one of its target GRFs in leaves with diverse growth allometry. In leaves with positive allometry, as in T. stans (Figure 7A; Supplemental Figures 5 and 6) and A. majus (Supplemental Figure 5), more miR396 was detected in the distal half than in the proximal. An opposite pattern with more expression in the proximal half (Figures 7E and 7H) was observed for T. stans GRF2 (Ts-GRF2) that contains a conserved miR396 target site (Supplemental Figure 7A). By contrast, more miR396 and less Cv-GRF2 transcripts were detected in the proximal halves of C. variegatum leaves (Figures 7B, 7F, and 7I; Supplemental Figures 6 and 7). Equal levels of miR396 were detected in the proximal and distal halves of leaves of B. purpurea (Figure 7C; Supplemental Figures 6 and 7) and C. spectabilis (Supplemental Figure 5) at all growth stages. Proximal and distal distributions of the target Bh-GRF2 transcripts in B. purpurea were also equal (Figures 7G and 7J). In the leaves of S. jambos, which showed bidirectional growth polarity, more miR396 was detected at either end compared with the center (Figure 7D). Total miR396 level increased with corresponding decrease in the level of target GRF2 transcripts in maturing leaves of all the species studied, suggesting that the function of the miR396/GRF2 module is conserved across eudicot species (Figure 7). A strongly correlated distribution of miR396/GRF2 transcripts with growth allometry implies that expression diversity of this module may underlie the divergent allometry in leaf growth (Figure 8).
Figure 7.
Expression Patterns of miR396 and Its Target GRF2 Genes in Developing Leaves.
(A) to (D) Small RNA gel blots showing the expression pattern of miR396 in developing leaves with positive allometry (A), negative allometry (B), isometry (C), and complex allometry (D). U6 expression was used as internal control.
(E) to (G) RNA gel blots showing the distribution of miR396-targeted GRF2 genes in growing leaves with positive allometry (E), negative allometry (F), and isometry (G). The probes for the GRF2 genes and the internal controls are indicated. Leaf lengths (in cm) are indicated above the blots.
For (A) to (C) and (E) to (G), d and p refer to distal and proximal halves of the leaves, respectively. For (D), d, m, and p refer to distal, middle, and proximal thirds of the leaves, respectively. Quantification of the band intensities of miR396 and the target GRF2 relative to the respective loading controls is indicated below the blots.
(H) to (J) RT-qPCR analysis showing the relative distribution of GRFs in the distal and proximal halves of leaves at different growth stages (n = 3 to 6; average ± sd; *P ≤ 0.05; **P ≤ 0.005; ***P ≤ 0.0005; ns, P > 0.05).
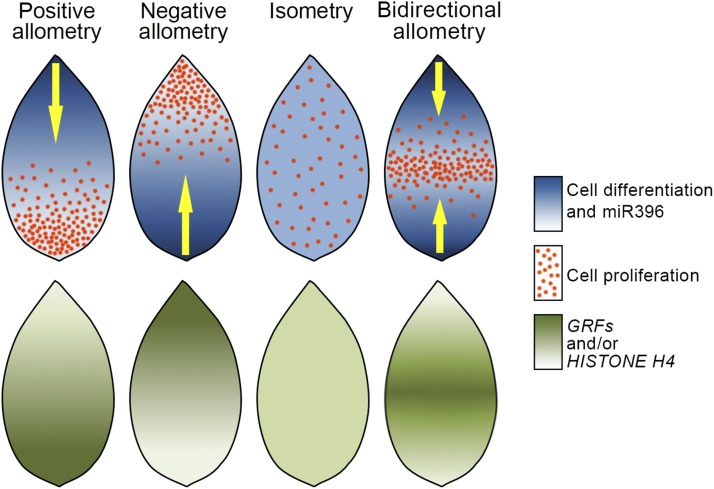
Figure 8.
Schematics of Expression Patterns of Regulatory Molecules in Young Leaves with Different Allometries.
Distribution of the patterning molecules like miR396, HISTONE H4, and miR396-targeted GRFs are schematically shown along the proximo-distal axis of young leaves and compared with the pattern of cell proliferation/differentiation. Expression of miR396 shows a strong correlation with the pattern of cellular maturation in leaves with different growth allometries. Expression of HISTONE H4 and miR396-targeted GRFs, by contrast, closely matches with the domains of cell proliferation.
Misexpression of miR396 Alters Cell Differentiation Pattern in Arabidopsis Leaves
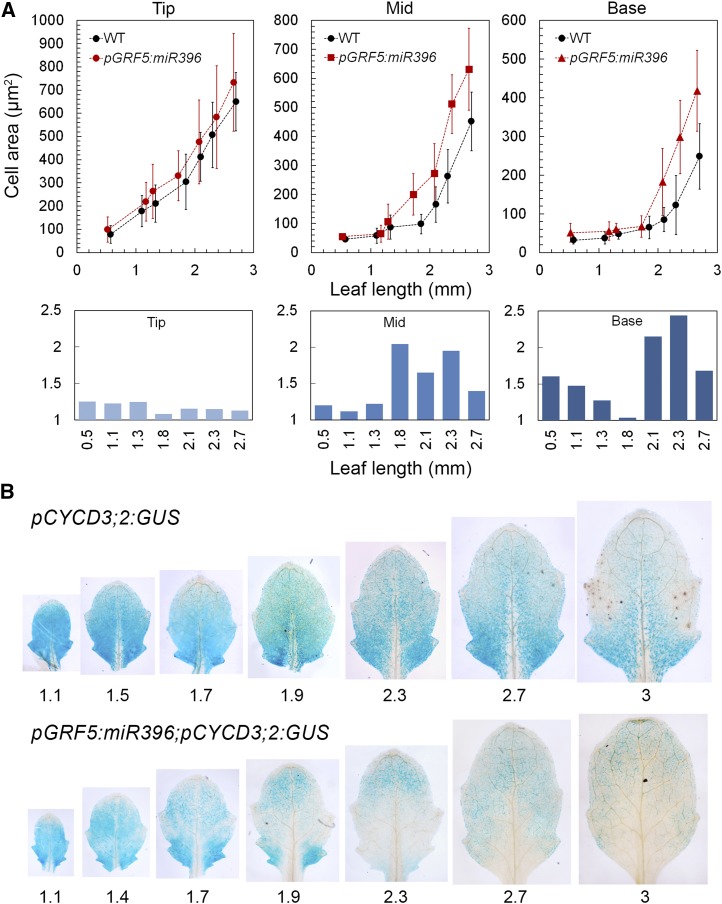
Leaf growth in Arabidopsis is characterized by an initial period of cell proliferation throughout the lamina, followed by a patterned arrest of proliferation (Kazama et al., 2010; Andriankaja et al., 2012). Thus, cell proliferation is the default state of the primordial leaf and different growth polarities can be achieved by superposing a specific pattern of cell maturation over the proliferating leaf. The strong association of the expression of miR396 with diverse growth polarities encouraged us to hypothesize that an alteration in miR396 expression may be sufficient to cause a corresponding change in the pattern of cell differentiation. To test this, we expressed recombinant miR396 under the GRF5 promoter (Horiguchi et al., 2005) that is active in a declining base-to-tip gradient in young Arabidopsis leaves (GRF5 is not a target of miR396) (Supplemental Figure 8). The resulting pGRF5:miR396 lines expressed a higher level of total miR396 and reduced levels of target GRFs, HISTONE H4, and CYCD3;2 and also produced smaller leaves (Supplemental Figure 9). Although the misexpression seemed to affect cell expansion throughout the developing leaves, the greatest effect on cell expansion was recorded in the proximal and the medial regions of the transgenic leaves where miR396 was expected to be misexpressed (Figure 9A). While the size of the pGRF5:miR396 epidermal cells remained comparable to the wild type at the distal region, the more proximal cells were ∼2 times larger in the young transgenic leaves, especially at the early cell expansion phase of leaf growth (Figure 9A; Supplemental Figure 10C).
Figure 9.
Effects of Altered miR396 Expression on Cell Expansion.
(A) Upper panel: epidermal cell size of the fifth leaf in the pGRF5:miR396 and wild-type plants (n = 50 to 100; average ± sd). Cell sizes were measured near the tip, middle, and base. Lower panel: ratios of cell sizes of pGRF5:miR396 to the wild type near the tip, middle, and base of the leaves (see Supplemental Figure 10C for statistical analysis).
(B) Promoter activity of CYCD3;2 in the fifth rosette leaf in wild-type and pGRF5:miR396 plants. Leaf lengths (in mm) are indicated.
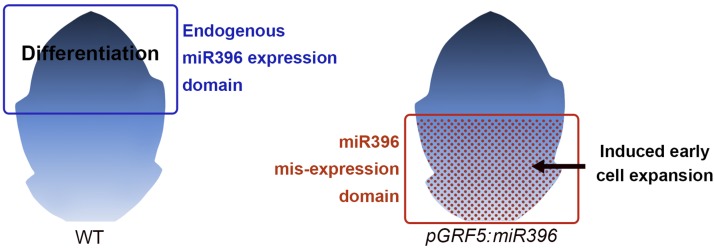
We also monitored the expression of pCYCD3;2:GUS and pCYCB1;1:GUS reporters in the pGRF5:miR396 backgrounds along with the epidermal cell sizes. Expression of pCYCB1;1:GUS reporter was restricted only to the proximal part of the wild-type leaf by the ∼1-mm stage (Donnelly et al., 1999), whereas it was completely absent from the pGRF5:miR396 leaf of similar growth stage (Supplemental Figure 11). By contrast, though the pCYCD3;2:GUS activity showed similar basipetal expression in wild-type leaves (Figure 9B; Dewitte et al., 2007), it persisted until later stages of growth and was therefore used to compare with pGRF5:miR396 leaves. At early stages (<1.7-mm-long lamina), the pCYCD3;2:GUS activity was comparable between wild-type and pGRF5:miR396 leaves with higher expression near the base. This early expression pattern matches with the overall tip-to-base cell expansion pattern in both wild-type and pGRF5:miR396 leaves (Andriankaja et al., 2012; Figure 9A). However, at later stages, pCYCD3;2 expression was strongly reduced specifically near the middle and the base of the pGRF5:miR396 leaves (Figure 9B). The loss of CYCD3;2 expression in the proximal part of the leaves might have been caused by the increased expression of miR396 (Supplemental Figure 9A), which is restricted to the proximal part of the leaves at these stages (Supplemental Figure 8). This early loss of CYCD3;2 expression was also associated with precocious cell expansion at the proximal region of pGRF5:miR396 leaves (Figure 9A). The diffused CYCD3;2 expression at the distal end of the pGRF5:miR396 leaves is comparable to that in wild-type leaf and probably represents the region of leaf that was not affected by miR396 misexpression. These observations suggest a role for miR396 in early exit from proliferation and induction of cell expansion in its domain of expression (Figure 10).
Figure 10.
Schematics Showing the Endogenous Domain of miR396 Expression Overlapping with the Zone of Cell Differentiation and the Novel Domain of miR396 Expression in the pGRF5:miR396 Lines Where It Induces Early Cell Expansion.
Furthermore, to study the effect of reduced miR396 at the distal tip, we expressed a short tandem target mimic under the endogenous miR396a promoter (pMIR396a:STTM396) (Yan et al., 2012). The pMIR396a:STTM396 leaves showed a mild delay in cell expansion near the distal tip and no significant differences in cell size near the middle and base of the growing leaves (Supplemental Figures 10A and 10B). The relatively mild effect of the STTM on cell expansion could be due to either incomplete abolition of miR396 activity or the function of other parallel pathways that promote cell differentiation in the distal region independent of the miR396 function. Taken together, miR396 seems to promote cell differentiation in its expression domain in a relatively context-independent manner. Since the different growth allometries seem to be brought about by superimposition of distinct cell differentiation patterns over a uniform field of proliferating cells, the expression changes in miR396, along with other pathways promoting cell differentiation, could have been a crucial factor in the evolution of these distinct growth patterns.
DISCUSSION
Divergent Growth Allometries as Cases of Modified Patterning of Cell Differentiation
Most studies on leaf growth reported so far rely on model species that are amenable to molecular and genetic studies. Though these model plants include representatives from both eudicots and monocots, they are still limited to only a handful of plant families of the vast plant kingdom, namely, Brassicaceae, Lamiaceae, Solanaceae, Plantaginaceae (eudicots), and Poaceae (monocots). However, plants from different taxa can produce leaves that are by and large similar in form; hence, it may be argued that the developmental mechanisms operating in the leaves of the model species would apply to other plants as well. Our study reiterates that early cell proliferation followed by expansion as a general phenomenon in leaf growth. However, it also reveals that the spatial patterning of the growth regulatory mechanisms has been extensively modified across species to achieve similar final structures. For example, species with similar leaf shapes showed different allometric patterns of leaf growth (Supplemental Figure 12 and Supplemental Data Set 1). Importantly, while all leaves shared the common feature of an initial period of organ-wide cell proliferation, the later patterning by cell differentiation seems to have undergone extensive modifications. This emphasizes that the divergent growth allometries might have evolved by changes in the mechanisms that promote patterned cell differentiation in a body of proliferating tissue rather than changes in the patterns of cell proliferation itself. To this end, we also find that the expression of miR396, a molecule that promotes cell differentiation, has also undergone related changes and shows a strong correlation with the direction of arrest front progression. The related expression changes in genes like the GRFs and H4 could be the outcome of the changes in the upstream regulators that promote differentiation.
By contrast, the expression of miR319, which is thought to allow continued cell proliferation near the leaf base (Ori et al., 2007), did not show any correlation with the growth gradients. In fact, we find that miR319 is expressed near the base of the leaves irrespective of the growth pattern. This could be due to either or both of the following two reasons: (1) the networks that promote exit from proliferation and that have been modified to cause the divergent differentiation patterns are able to overrule the effects of miR319 in promoting cell proliferation near the base and (2) the class II TCP genes that promote differentiation might still have had undergone respective expression changes to suit the modified growth patterns irrespective of the miR319 expression pattern. This would entail that these TCP genes may lack the additional posttranscriptional regulation by miR319. In fact, Arabidopsis has 24 class II TCP genes, out of which only five are regulated by miR319 (Palatnik et al., 2003). Therefore, it would be difficult to comment on the expression of the miR319-targeted or nontargeted TCP genes across species because the dynamic expression pattern of the TCPs is generated by a combined activities of cis-regulatory elements and the posttranscriptional regulation by miR319 (Martín-Trillo and Cubas, 2010). Moreover, the 20-nucleotide isoform of miR319 may not fully represent its distribution since it occurs in both 20- and 21-nucleotide isoforms and the level of the 21-nucleotide isoform may be masked by the closely related microRNA, miR159 (Palatnik et al., 2007).
Additionally, there is evidence that the class II TCPs can promote the expression of miR396 in Arabidopsis leaves (Rodriguez et al., 2010; Schommer et al., 2014). The expression of some of the class II TCPs, like that of miR396, also starts from the distal part of leaves with basipetal growth and progressively moves toward the proximal part (Nath et al., 2003; Palatnik et al., 2003). Moreover, the TCP genes also play an important role in the temporal patterning of cellular differentiation. So, it is possible that such TCP genes are the upstream regulators of miR396 expression in other species as well and may show altered patterns of expression in leaves with different growth polarities. Therefore, further investigations into the expression pattern of TCP genes in leaves with differing growth polarities would give deeper insight into the evolution of leaf growth patterns.
Divergent Growth Polarities as Models to Distinguish Cell-Autonomous and Non-Cell-Autonomous Mechanisms in Regulating the Timing of Differentiation
Contrary to the current understanding, we show that leaf growth polarity is divergent. Importantly, all studies aiming to understand the genetic control of the timing of exit from cell proliferation use basipetal growth as a paradigm (Kazama et al., 2010; Kuchen et al., 2012). This conceptual framework is based on two important aspects of basipetal growth as has been studied in Arabidopsis: (1) the proliferative zone is maintained at a fixed distance from the leaf base and (2) it is sustained likewise for certain period before an abrupt cessation (Kazama et al., 2010; Andriankaja et al., 2012). Therefore, these studies also work under the assumption that the proliferative zone is anchored to the base of the leaf, i.e., the junction between the petiole and leaf blade (Ichihashi et al., 2011; Lenhard, 2012). The resulting models predict a non-cell-autonomous mechanism of a diffused gradient of a morphogenetic factor emanating from the base of the leaf wherein the cells in this morphogenetic field continue to divide and those displaced away from this zone start differentiating (Ichihashi et al., 2010; Kazama et al., 2010; Lenhard, 2012; Powell and Lenhard, 2012). However, there are other models based on cell-autonomous mechanisms via accumulation of inhibitors of cell proliferation to explain timely differentiation (Kawade et al., 2010; Johnson and Lenhard, 2011; Lenhard, 2012; Powell and Lenhard, 2012). Our studies show that leaves have different patterns of cell differentiation and proliferation (e.g., negative allometry and mixed allometry); therefore, the proliferation zone need not be anchored to the junction between the leaf blade and petiole throughout the growth phase. In leaves with negative allometry, the proliferative zone has been displaced to the distal tip away from the leaf base. In leaves with isometric growth, there is no growth gradient in the proximo-distal axis and all the cells across the leaves seem to exit cell proliferation coordinately. This pattern of growth does not necessarily argue against the existence of a non-cell-autonomous mechanism to promote differentiation. However, the coordinated differentiation across the leaf could be indicative of a role of a cell-autonomous mechanism wherein the accumulation of an inhibitor with each cell division is used to count the number of cells and therefore promote timely differentiation. Modeling studies that have used basipetal direction as the paradigm to explain leaf growth can now therefore be extended to accommodate this diversity, considering leaves growing with different polarities can attain similar overall forms (Supplemental Figure 12 and Supplemental Table 5).
Differential Patterning of Growth as a System to Study Evolution of Gene Regulatory Networks
Evolutionary or phylogenetic allometric studies that have used animal models have often pointed out how changes in growth allometry have caused drastic changes in organ shapes due to altered allometric growth. For example, animal limbs generally show a negative proximo-distal growth gradient wherein the extremities have the lowest growth rates (e.g., in mammals, metacarpals and metatarsals grow slower that humerus or femur and similar gradients are seen in most arthropod limbs as well) (Huxley, 1932). Modifications in the growth gradient in certain cases have given rise to exaggerated traits like the right chela of the fiddler crab (Uca pugnax) (Huxley, 1932).
Changes in patterning mechanisms during divergence of species has been widely studied using animal and plant models and have often been linked to changes in expression of upstream regulatory genes, mostly transcription factors and other morphogens (Carroll, 2000). For example, sets of Hox genes are expressed at different relative positions among chick, mouse, and python embryos in the head-to-tail (rostro-caudal) axis, leading to variation in the number of cervical, thoracic, and lumbar segments (Belting et al., 1998; Cohn and Tickle, 1999; Carroll, 2000). Such shifts in the expression patterns can be brought about by trans-acting factors or changes in the cis-regulatory regions. In the case of Hox genes, the shift in expression domain among birds and mammals has been attributed to changes in the cis-regulatory regions (Belting et al., 1998). Variation in wing size within the genera in male parasitoid jewel wasp Nasonia has been attributed to changes in the expression of upd-like, which is thought to affect cell proliferation by encoding a ligand for the JAK-STAT signaling pathway (Loehlin and Werren, 2012). Similarly, variations in patterning of leaf serrations, lobing, and compoundness across species have also been attributed to changes in the expression of a set of transcription factors and their regulatory microRNAs (Blein et al., 2008; Efroni et al., 2010; Adam et al., 2011).
Diverse growth polarities in leaves seem to be associated with modifications of the spatial and temporal patterns of two basic cellular processes, proliferation and maturation, implying underlying expression changes in the conserved genetic pathways. Our analysis suggests that the different growth polarities probably arose by the superimposition of different patterns of cell division arrest over the proliferating tissue and that the expression differences in miR396, in part, underlie the diversity in leaf growth polarity. Changes in the expression of miR396 itself could be due to changes in its cis- or trans-regulatory elements and would need further studies for a better understanding. However, it also needs to be emphasized that the expression differences in the miR396-GRF module is not sufficient to explain the differences in growth patterns. miR396 is a late-acting molecule, and its expression is detectable only after the inception of the leaf. Our analyses suggest that culmination of miR396 expression coincides with the phase of exit from cell proliferation. Furthermore, the maintenance of a basipetal growth pattern in Arabidopsis leaves in spite of miR396 misexpression near the base suggests that miR396 may not be sufficient to cause a complete change or reversal in the growth gradient. Rather, this module may be functioning to sculpt the gradient of cell differentiation progress along the proximo-distal axis in conjunction with other growth patterning mechanisms. The insufficiency of miR396 to completely abolish cell proliferation near the base of the Arabidopsis leaves at early stages could also be due to the presence of additional GRFs that are not targeted by miR396 in Arabidopsis (Rodriguez et al., 2010) as well as due to the presence of endogenous miR319, which can allow cell proliferation to proceed by restricting the class II TCPs. Additionally, the relatively mild effect of miR396 downregulation on cell expansion may also indicate that the miR396-GRF module is a part of a larger network of genes that have been employed for regulating the progression of the arrest front.
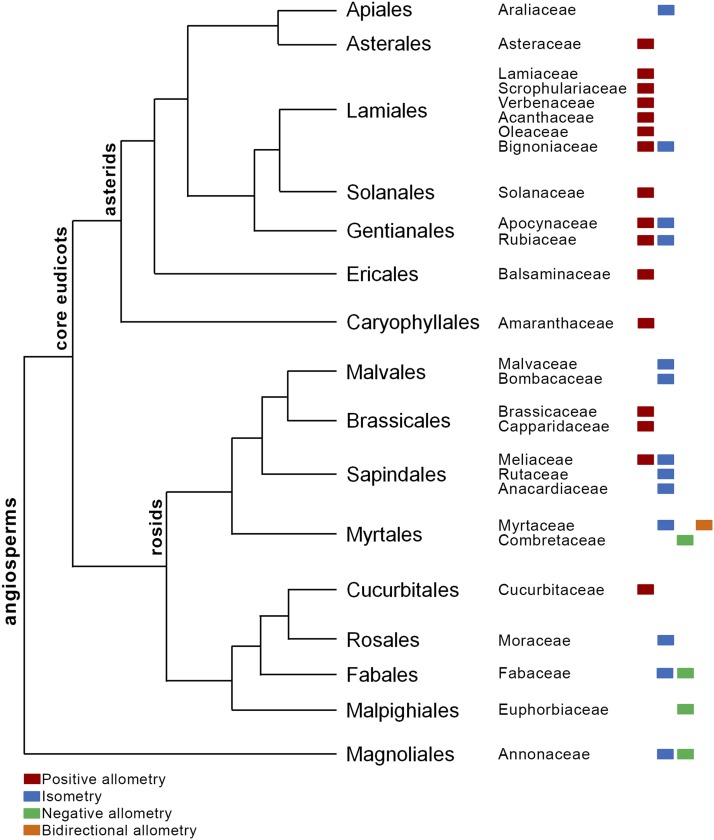
It is interesting to note that related species can have different leaf growth patterns irrespective of common ancestry. For example, E. umbrosus and E. stadleyana (Fabaceae) or Polyalthia pendula and Polyalthia longifolia (Annonaceae) differ in their growth patterns (Figure 11; Supplemental Figure 12). Different growth patterns in closely related species also suggest independent evolution of leaf growth polarity. A preliminary analysis of the phylogenetic distribution of the growth patterns indicates the prevalence of isometric growth in the basal plant lineages, while the more derived lineages (e.g., Asterales and Lamiales) show a predominance of positive allometry (Figure 11). However, more detailed phylogenetic analyses employing a larger data set would be needed to indicate the actual ancestral and derived patterns of leaf growth. Nevertheless, the origin of the same growth pattern in unrelated species or different patterns in closely related species would also entail concomitant changes in the expression patterns of several growth patterning genes.
Figure 11.
Phylogenetic Relationship among the Plant Lineages Used in This Study and the Distribution of the Growth Patterns Therein.
The phylogenetic tree was modified from AGPIII (The Angiosperm Phylogeny Group, 2009).
Our study indicates that genes including the components of miR396-GRF module were co-opted to suit the different growth patterns. Further investigations are needed to find the other developmentally important genes that were co-opted to give rise to the derived patterns. Furthermore, comparative genomic and functional studies on the gene regulation in the ancestral and derived states can be used to answer important evolutionary questions, e.g., whether the set of genes were co-opted independently to a new expression domain or they were co-opted all together by regulatory changes in an upstream master regulator (Monteiro and Podlaha, 2009).
METHODS
Cell Size and Leaf Area Measurements
Leaf surface impressions were taken from the adaxial side using transparent nail enamel (Revlon). The impressions were viewed under differential interference contrast mode of an Olympus BX52a upright microscope and imaged using a CapturePro CCD camera. The cell areas were measured using ProgResCapturePro 2.5 software (Jenoptic). Areas of 100 to 200 cells were measured from near the tip, middle, and base of the leaves (shown in Supplemental Figure 2D) and plotted against the leaf lengths. Cell areas were averaged from three to five leaves of similar lengths for each point. For Arabidopsis thaliana transgenic plants, leaves were cleared in 70% alcohol for 48 h and mounted using Hoyer’s medium (chloral hydrate, glycerol, and water in the ratio of 8:2:1) for measuring the epidermal cell area from the adaxial side.
Leaf Marking, Determination of the Growth Ratio (α), and Classification of Growth Patterns
For an initial survey of growth patterns, young, growing leaves from 45 eudicot species were spotted with ink dots on the dorsal surface when they were approximately one-fifth of the mature size in length. Leaves were photographed and the pattern of growth was analyzed by comparing the distribution of spots on the young and mature leaves (Figure 1; Supplemental Figure 1). Adaxial epidermal cell sizes near the tip, middle, and base of the leaves were also measured for the different growth stages of these leaves (Supplemental Figure 13). For measurement of the differential growth ratio, an ink spot was introduced at the middle of the length axis in a young lamina and served as a traceable surface marker of linear growth. At the start of the measurement, the lengths of the distal half (x) and the proximal half (y) were equal in the young lamina. A set of (xi,yi) values was collected during leaf growth and fitted to the power equation y∞xα and plotted on a double logarithmic grid. The slope of the straight line gave the value for the differential growth ratio (α). Depending on the growth polarity, the ink spot was traced within the distal half (x < y, positive allometry), the proximal half (x > y, negative allometry), or in the middle (x = y, isometry) of the mature lamina. For annual plants with determinate growth, the same leaf metamer was used for all the analyses. For perennial plants with indeterminate growth, analyses were done on leaves from the same plant. The growth ratio was determined for 31 species using this method. Growth patterns for an additional 21 species were assigned solely based on the cell size measurements (see Supplemental Table 2 for the summary of methods used to assign growth pattern to each species). All the species for which the ratios of cell sizes near the tip and base were within the range of 0.9 to 1.2 were classified under isometry. The species with tip:base cell size ratios ≤0.7 for three or more growth stages were assigned as negative allometry. The species with tip:base cell size ratios ≥1.5 for three or more growth stages of growth were assigned as positive allometry (Supplemental Figure 13).
Tissue Fixation, Staining, and Mitotic Index
Plant tissues were fixed in 4% formaldehyde solution, taken through alcohol series, embedded in paraplast (Sigma-Aldrich), and sectioned to 5 µm thicknesses. Nuclei were stained with Hematoxilin (Qualigen), and either Eosin (Sigma-Aldrich) or Per-iodic acid Schiff’s reaction was used to counterstain the cytoplasm and cell wall. Mitotic figures were counted from different regions of the leaves and plotted against the leaf lengths such that each point represented values from 1000 to 1500 nuclei counted from three to five leaves of similar stages.
Only metaphase, anaphase, and telophase (Supplemental Figure 3) were used to calculate the mitotic index. The following formula was used:
 |
Nicotiana tabacum, Codiaeum variegatum, and Hibiscus rosa-sinensis were selected for determination of mitotic index due to the relatively large size of the nuclei and unambiguous determination of mitotic cells. Sections from Dillenia indica, Tecoma stans, Bauhinia purpurea, and Syzygium jambos showed very small nuclei and dividing nuclei could not be ascertained unambiguously.
Expression Analysis
Partial H4, GRF, ACTIN, and TUBULIN cDNA sequences were amplified from the respective species using degenerate primers (Supplemental Tables 3 and 4), cloned into either pGEM T Easy (Promega) or pCR 2.1 (Invitrogen), sequenced, and used as probes in RNA gel blotting. Total RNA was extracted from the proximal (p) and distal (d) halves of leaves at different developmental stages using TRI reagent (Sigma-Aldrich). Total RNA samples (10 µg) were resolved on 1.5% denaturing formaldehyde agarose gels and transferred by capillary method to positively charged nylon membrane (Immobilion NY+; Millipore). For small RNA gel blotting, 10 to 15 μg of the total RNA samples were resolved on 16 to 18% denaturing urea-polyacrylamide gels and transferred to positively charged nylon membrane using a semidry transfer apparatus. LNA-modified oligonucleotides (Exiqon) with At-miR396a and At-miR319a sequences were used as probes for detecting the respective microRNAs (Várallyay et al., 2008). A conserved 24-nucleotide sequence from Arabidopsis U6 (Supplemental Table 4) was used as probe for U6 internal controls in all small RNA gel blots. All hybridizations were performed using PerfectHyb (Sigma-Aldrich) according to the manufacturer’s directions.
For RT-qPCR, total RNA treated with RQ1 RNase-free DNase (Promega) was reverse transcribed using RevertAid reverse transcriptase (Thermo Scientific) according to the manufacturer’s instructions. Quantitative real-time PCR was performed with KAPA SYBR FAST 2X qPCR Master Mix (KapaBiosystems) in an ABI PRISM7900HT (Applied Biosystems) machine. Gene-specific primers used for PCR are listed in Supplemental Table 4. Statistical analysis was performed using two-tailed Mann-Whitney t test in the GraphPad Prism 5 software.
Leaf tissues from D. indica and H. rosa-sinensis yielded either very low amounts or poor quality RNA, which precluded further analyses by RNA gel blotting or RT-PCR. Of the five species showing negative allometry (Supplemental Table 1), D. indica, Terminalia catappa, and Polyalthia longifolia did not yield sufficient RNA for analyses, while miR396 could not be detected in Erythrina umbrosus using At-miR396 as probe sequence. Although sufficient amounts of RNA could be isolated from S. jambos leaves, good quality cDNA using reverse transcriptase could not be obtained and degenerate PCR using primers specific to either H4, GRF, ACTIN, or TUBULIN genes did not yield any amplicon. Homology-based RNA gel blotting of S. jambos RNA using a mix of At-H4, Bh-H4, and Ts-H4 sequences as probes gave a single band of around 500 bases. However, the same method did not yield any result when repeated with GRF-specific probes, probably due to lesser sequence conservation in the latter case. miR319-targeted TCPs could not be amplified using degenerate primers from T. stans, B. purpurea, C. variegatum, and S. jambos.
Transgenic Arabidopsis Plants
A construct for expression of miR396 stem-loop under the promoter of At-GRF5 (2.2 kb) was cloned into pCAMBIA1300 (primers listed in Supplemental Table 4). miR396 stem-loop was cloned into the PstI site and the promoter of At-GRF5 was cloned into the SmaI and BamHI sites. For downregulation of miR396, STTM396a (Supplemental Table 4) was synthesized and placed under the promoter of miR396a (3.1 kb) cloned into the EcoRI and BamHI sites in pCAMBIA1301. Arabidopsis plants harboring a reporter for the CYCD3;2 promoter (Dewitte et al., 2007) were transformed using these constructs and transgenic seedlings were selected on culture plates containing 15 µg/mL hygromycin.
Accession Numbers
The data reported in this article have been deposited in GenBank under the following accession numbers: Bp-H4 (KF042292), Bp-GRF2 (KF042295), Bp-ACT1 (KF042293), Ts-H4 (KF042290), Ts-GRF2 (KF188429), Ts-ACT1 (KF188428), Cv-H4 (KF042291), Cv-GRF2 (KF042296), and Cv-TUB1 (KF042294).
Supplemental Data
Supplemental Figure 1. Ink-tracking studies on growing leaves reveal different forms of polar growth in leaves.
Supplemental Figure 2. Epidermal cell size in growing leaves of T. stans, B. purpurea, and S. jambos.
Supplemental Figure 3. Correlation between epidermal cell morphology, tissue anatomy, and cell division.
Supplemental Figure 4. Sequence alignment of miR319 and miR396 from different species.
Supplemental Figure 5. Expression patterns of miR396 in developing leaves.
Supplemental Figure 6. Quantification of relative distribution of miR396 in developing leaves.
Supplemental Figure 7. Conservation of the miR396 target sequence in the GRFs.
Supplemental Figure 8. Promoter activity of At-GRF5.
Supplemental Figure 9. Expression of miR396 and phenotypes of transgenic Arabidopsis plants with altered miR396 expression.
Supplemental Figure 10. Effects of altered miR396 expression on cell expansion.
Supplemental Figure 11. Effect of miR396 misexpression on CYCB1;1 expression.
Supplemental Figure 12. Different allometric growth patterns in leaves with similar final shapes.
Supplemental Figure 13. Determination of allometric growth patterns in leaves using cell sizes.
Supplemental Table 1. List of species used in the study.
Supplemental Table 2. Methods used to classify the growth patterns.
Supplemental Table 3. Accession numbers of sequences used in the study.
Supplemental Table 4. Primers used in the study.
Supplemental Table 5. Shape of mature leaves used in the study.
Supplementary Material
Acknowledgments
We thank Hirokazu Tsukaya (Japan) and A.H. Murray (UK) for pGRF5:GUS and pCYCD3;2:GUS lines, respectively; K. Sankara Rao for help in identification of plant species; Enrico Coen (UK), N.V. Joshi, V. Nanjundiah, R. Gadagkar, K.V. Krishnamurthy, Abdur Rahaman, Kaustuv Sanyal (India), and Antónia Monteiro (Singapore) for helpful discussions; P.C. Sreejith for initial help in cell size measurement; Javier Palatnik (Argentina) for help with protocols on miRNA analysis; and Sushil Kumar for help with experiments related to CYCB1;1:GUS reporter assay. This work was supported by the Department of Biotechnology, Government of India, through Grant BT/PR12881/AGR/36/616/2009 to U.N. and by the Council of Scientific and Industrial Research, Government of India, through research scholarships to M.D.G.
AUTHOR CONTRIBUTIONS
M.D.G. and U.N. designed the experiments, analyzed the data, and wrote the article. M.D.G. performed the experiments.
References
- Adam H., Marguerettaz M., Qadri R., Adroher B., Richaud F., Collin M., Thuillet A.-C., Vigouroux Y., Laufs P., Tregear J.W., Jouannic S. (2011). Divergent expression patterns of miR164 and CUP-SHAPED COTYLEDON genes in palms and other monocots: implication for the evolution of meristem function in angiosperms. Mol. Biol. Evol. 28: 1439–1454. [DOI] [PubMed] [Google Scholar]
- Andriankaja M., Dhondt S., De Bodt S., Vanhaeren H., Coppens F., De Milde L., Mühlenbock P., Skirycz A., Gonzalez N., Beemster G.T., Inzé D. (2012). Exit from proliferation during leaf development in Arabidopsis thaliana: a not-so-gradual process. Dev. Cell 22: 64–78. [DOI] [PubMed] [Google Scholar]
- Axtell M.J., Bartel D.P. (2005). Antiquity of microRNAs and their targets in land plants. Plant Cell 17: 1658–1673. [DOI] [PMC free article] [PubMed] [Google Scholar]
- Axtell M.J., Bowman J.L. (2008). Evolution of plant microRNAs and their targets. Trends Plant Sci. 13: 343–349. [DOI] [PubMed] [Google Scholar]
- Belting H.G., Shashikant C.S., Ruddle F.H. (1998). Multiple phases of expression and regulation of mouse Hoxc8 during early embryogenesis. J. Exp. Zool. 282: 196–222. [PubMed] [Google Scholar]
- Blein T., Pulido A., Vialette-Guiraud A., Nikovics K., Morin H., Hay A., Johansen I.E., Tsiantis M., Laufs P. (2008). A conserved molecular framework for compound leaf development. Science 322: 1835–1839. [DOI] [PubMed] [Google Scholar]
- Carroll S.B. (2000). Endless forms: the evolution of gene regulation and morphological diversity. Cell 101: 577–580. [DOI] [PubMed] [Google Scholar]
- Choi D., Kim J.H., Kende H. (2004). Whole genome analysis of the OsGRF gene family encoding plant-specific putative transcription activators in rice (Oryza sativa L.). Plant Cell Physiol. 45: 897–904. [DOI] [PubMed] [Google Scholar]
- Cohn M.J., Tickle C. (1999). Developmental basis of limblessness and axial patterning in snakes. Nature 399: 474–479. [DOI] [PubMed] [Google Scholar]
- Debernardi J.M., Rodriguez R.E., Mecchia M.A., Palatnik J.F. (2012). Functional specialization of the plant miR396 regulatory network through distinct microRNA-target interactions. PLoS Genet. 8: e1002419. [DOI] [PMC free article] [PubMed] [Google Scholar]
- Dewitte W., Scofield S., Alcasabas A.A., Maughan S.C., Menges M., Braun N., Collins C., Nieuwland J., Prinsen E., Sundaresan V., Murray J.A. (2007). Arabidopsis CYCD3 D-type cyclins link cell proliferation and endocycles and are rate-limiting for cytokinin responses. Proc. Natl. Acad. Sci. USA 104: 14537–14542. [DOI] [PMC free article] [PubMed] [Google Scholar]
- Donnelly P.M., Bonetta D., Tsukaya H., Dengler R.E., Dengler N.G. (1999). Cell cycling and cell enlargement in developing leaves of Arabidopsis. Dev. Biol. 215: 407–419. [DOI] [PubMed] [Google Scholar]
- Efroni I., Eshed Y., Lifschitz E. (2010). Morphogenesis of simple and compound leaves: a critical review. Plant Cell 22: 1019–1032. [DOI] [PMC free article] [PubMed] [Google Scholar]
- Freeling M. (1992). A conceptual framework for maize leaf development. Dev. Biol. 153: 44–58. [DOI] [PubMed] [Google Scholar]
- Gaudin V., Lunness P.A., Fobert P.R., Towers M., Riou-Khamlichi C., Murray J.A., Coen E., Doonan J.H. (2000). The expression of D-cyclin genes defines distinct developmental zones in snapdragon apical meristems and is locally regulated by the Cycloidea gene. Plant Physiol. 122: 1137–1148. [DOI] [PMC free article] [PubMed] [Google Scholar]
- Hepworth J., Lenhard M. (2014). Regulation of plant lateral-organ growth by modulating cell number and size. Curr. Opin. Plant Biol. 17: 36–42. [DOI] [PubMed] [Google Scholar]
- Horiguchi G., Kim G.T., Tsukaya H. (2005). The transcription factor AtGRF5 and the transcription coactivator AN3 regulate cell proliferation in leaf primordia of Arabidopsis thaliana. Plant J. 43: 68–78. [DOI] [PubMed] [Google Scholar]
- Huxley J.S. (1932). Problems of Relative Growth. (London: Methuen; ). [Google Scholar]
- Huxley J.S., Teissier G. (1936). Terminology of relative growth. Nature 137: 780–781. [Google Scholar]
- Ichihashi Y., Horiguchi G., Gleissberg S., Tsukaya H. (2010). The bHLH transcription factor SPATULA controls final leaf size in Arabidopsis thaliana. Plant Cell Physiol. 51: 252–261. [DOI] [PubMed] [Google Scholar]
- Ichihashi Y., Kawade K., Usami T., Horiguchi G., Takahashi T., Tsukaya H. (2011). Key proliferative activity in the junction between the leaf blade and leaf petiole of Arabidopsis. Plant Physiol. 157: 1151–1162. [DOI] [PMC free article] [PubMed] [Google Scholar]
- Johnson K., Lenhard M. (2011). Genetic control of plant organ growth. New Phytol. 191: 319–333. [DOI] [PubMed] [Google Scholar]
- Kawade K., Horiguchi G., Tsukaya H. (2010). Non-cell-autonomously coordinated organ size regulation in leaf development. Development 137: 4221–4227. [DOI] [PubMed] [Google Scholar]
- Kazama T., Ichihashi Y., Murata S., Tsukaya H. (2010). The mechanism of cell cycle arrest front progression explained by a KLUH/CYP78A5-dependent mobile growth factor in developing leaves of Arabidopsis thaliana. Plant Cell Physiol. 51: 1046–1054. [DOI] [PubMed] [Google Scholar]
- Kuchen E.E., Fox S., de Reuille P.B., Kennaway R., Bensmihen S., Avondo J., Calder G.M., Southam P., Robinson S., Bangham A., Coen E. (2012). Generation of leaf shape through early patterns of growth and tissue polarity. Science 335: 1092–1096. [DOI] [PubMed] [Google Scholar]
- Lenhard M. (2012). All’s well that ends well: arresting cell proliferation in leaves. Dev. Cell 22: 9–11. [DOI] [PubMed] [Google Scholar]
- Loehlin D.W., Werren J.H. (2012). Evolution of shape by multiple regulatory changes to a growth gene. Science 335: 943–947. [DOI] [PMC free article] [PubMed] [Google Scholar]
- Martín-Trillo M., Cubas P. (2010). TCP genes: a family snapshot ten years later. Trends Plant Sci. 15: 31–39. [DOI] [PubMed] [Google Scholar]
- Monteiro A., Podlaha O. (2009). Wings, horns, and butterfly eyespots: how do complex traits evolve? PLoS Biol. 7: e37. [DOI] [PMC free article] [PubMed] [Google Scholar]
- Nag A., King S., Jack T. (2009). miR319a targeting of TCP4 is critical for petal growth and development in Arabidopsis. Proc. Natl. Acad. Sci. USA 106: 22534–22539. [DOI] [PMC free article] [PubMed] [Google Scholar]
- Nath U., Crawford B.C., Carpenter R., Coen E. (2003). Genetic control of surface curvature. Science 299: 1404–1407. [DOI] [PubMed] [Google Scholar]
- Nelissen H., Rymen B., Jikumaru Y., Demuynck K., Van Lijsebettens M., Kamiya Y., Inzé D., Beemster G.T. (2012). A local maximum in gibberellin levels regulates maize leaf growth by spatial control of cell division. Curr. Biol. 22: 1183–1187. [DOI] [PubMed] [Google Scholar]
- Ori N., et al. (2007). Regulation of LANCEOLATE by miR319 is required for compound-leaf development in tomato. Nat. Genet. 39: 787–791. [DOI] [PubMed] [Google Scholar]
- Palatnik J.F., Allen E., Wu X., Schommer C., Schwab R., Carrington J.C., Weigel D. (2003). Control of leaf morphogenesis by microRNAs. Nature 425: 257–263. [DOI] [PubMed] [Google Scholar]
- Palatnik J.F., Wollmann H., Schommer C., Schwab R., Boisbouvier J., Rodriguez R., Warthmann N., Allen E., Dezulian T., Huson D., Carrington J.C., Weigel D. (2007). Sequence and expression differences underlie functional specialization of Arabidopsis microRNAs miR159 and miR319. Dev. Cell 13: 115–125. [DOI] [PubMed] [Google Scholar]
- Poethig R.S., Sussex I.M. (1985). The developmental morphology and growth dynamics of the tobacco leaf. Planta 165: 158–169. [DOI] [PubMed] [Google Scholar]
- Powell A.E., Lenhard M. (2012). Control of organ size in plants. Curr. Biol. 22: R360–R367. [DOI] [PubMed] [Google Scholar]
- Pulido A., Laufs P. (2010). Co-ordination of developmental processes by small RNAs during leaf development. J. Exp. Bot. 61: 1277–1291. [DOI] [PubMed] [Google Scholar]
- Remmler L., Rolland-Lagan A.-G. (2012). Computational method for quantifying growth patterns at the adaxial leaf surface in three dimensions. Plant Physiol. 159: 27–39. [DOI] [PMC free article] [PubMed] [Google Scholar]
- Rodriguez R.E., Mecchia M.A., Debernardi J.M., Schommer C., Weigel D., Palatnik J.F. (2010). Control of cell proliferation in Arabidopsis thaliana by microRNA miR396. Development 137: 103–112. [DOI] [PMC free article] [PubMed] [Google Scholar]
- Schommer C., Debernardi J.M., Bresso E.G., Rodriguez R.E., Palatnik J.F. (2014). Repression of cell proliferation by miR319-regulated TCP4. Mol. Plant 7: 1533–1544. [DOI] [PubMed] [Google Scholar]
- Stern D.L., Emlen D.J. (1999). The developmental basis for allometry in insects. Development 126: 1091–1101. [DOI] [PubMed] [Google Scholar]
- The Angiosperm Phylogeny Group (2009). An update of the Angiosperm Phylogeny Group classification for the orders and families of flowering plants: APG III. Bot. J. Linn. Soc. 161: 105–121. [Google Scholar]
- Várallyay E., Burgyán J., Havelda Z. (2008). MicroRNA detection by northern blotting using locked nucleic acid probes. Nat. Protoc. 3: 190–196. [DOI] [PubMed] [Google Scholar]
- Wang L., Gu X., Xu D., Wang W., Wang H., Zeng M., Chang Z., Huang H., Cui X. (2011). miR396-targeted AtGRF transcription factors are required for coordination of cell division and differentiation during leaf development in Arabidopsis. J. Exp. Bot. 62: 761–773. [DOI] [PMC free article] [PubMed] [Google Scholar]
- Yan J., Gu Y., Jia X., Kang W., Pan S., Tang X., Chen X., Tang G. (2012). Effective small RNA destruction by the expression of a short tandem target mimic in Arabidopsis. Plant Cell 24: 415–427. [DOI] [PMC free article] [PubMed] [Google Scholar]
- Zhang D.-F., Li B., Jia G.-Q., Zhang T.-F., Dai J.-R., Li J.-S., Wang S.-C. (2008). Isolation and characterization of genes encoding GRF transcription factors and GIF transcriptional coactivators in Maize (Zea mays L.). Plant Sci. 175: 809–817. [Google Scholar]
Associated Data
This section collects any data citations, data availability statements, or supplementary materials included in this article.


