Summary
Activation of mechanosensitive ion channels by physical force underlies many physiological processes including the sensation of touch, hearing and pain1–5. TRAAK ion channels are neuronally expressed members of the two-pore domain K+ (K2P) channel family and are mechanosensitive6. They are involved in controlling mechanical and temperature nociception in mice7. Mechanosensitivity of TRAAK is mediated directly through the lipid bilayer: it is a membrane tension gated channel8. However, the molecular mechanism of TRAAK channel gating and mechanosensitivity is unknown. Here we present crystal structures of TRAAK in conductive and nonconductive conformations defined by the presence of permeant ions along the conduction pathway. In the nonconductive state, a lipid acyl chain accesses the channel cavity through a 5 Å-wide lateral opening in the membrane inner leaflet and physically blocks ion passage. In the conductive state, rotation of a transmembrane helix (TM4) about a central hinge seals the intramembrane opening, preventing lipid block of the cavity and permitting ion entry. Additional rotation of a membrane interacting TM2-TM3 segment, unique to mechanosensitive K2Ps, against TM4 may further stabilize the conductive conformation. Comparison of the structures reveals a biophysical explanation for TRAAK mechanosensitivity: an expansion in cross sectional area up to 2.7 nm2 in the conductive state is expected to create a membrane tension-dependent energy difference between conformations that promotes force activation. Our results show how tension of the lipid bilayer can be harnessed to control gating and mechanosensitivity of a eukaryotic ion channel.
How physical force gates mechanosensitive ion channels in animals is unknown1–5. Mechanosensitivity in the bacterial MscL and MscS ion channels is proposed to result from a membrane tension-dependent energy difference between open and closed conformations due in part to cross sectional area expansion with opening9–11. The eukaryotic K+ channel TRAAK, like MscL and MscS, is gated open by membrane tension8. TRAAK is a member of K2P K+ channel family. The architecture of K2Ps is unique among metazoan K+ channels because two of the four subunits that form canonical K+ channels are fused into a single protein chain, thus, K2Ps are dimers12–14. Constraints imposed by this architecture preclude direct extension of the canonical mechanism of gating four fold-symmetric K+ channels involving symmetric dilation of a helical bundle at the intracellular channel surface15,16. Interestingly, crystal structures of TRAAK12,13 revealed intramembrane openings to the lipid bilayer between subunits and a role for lipids in gating the channel has been hypothesized4.
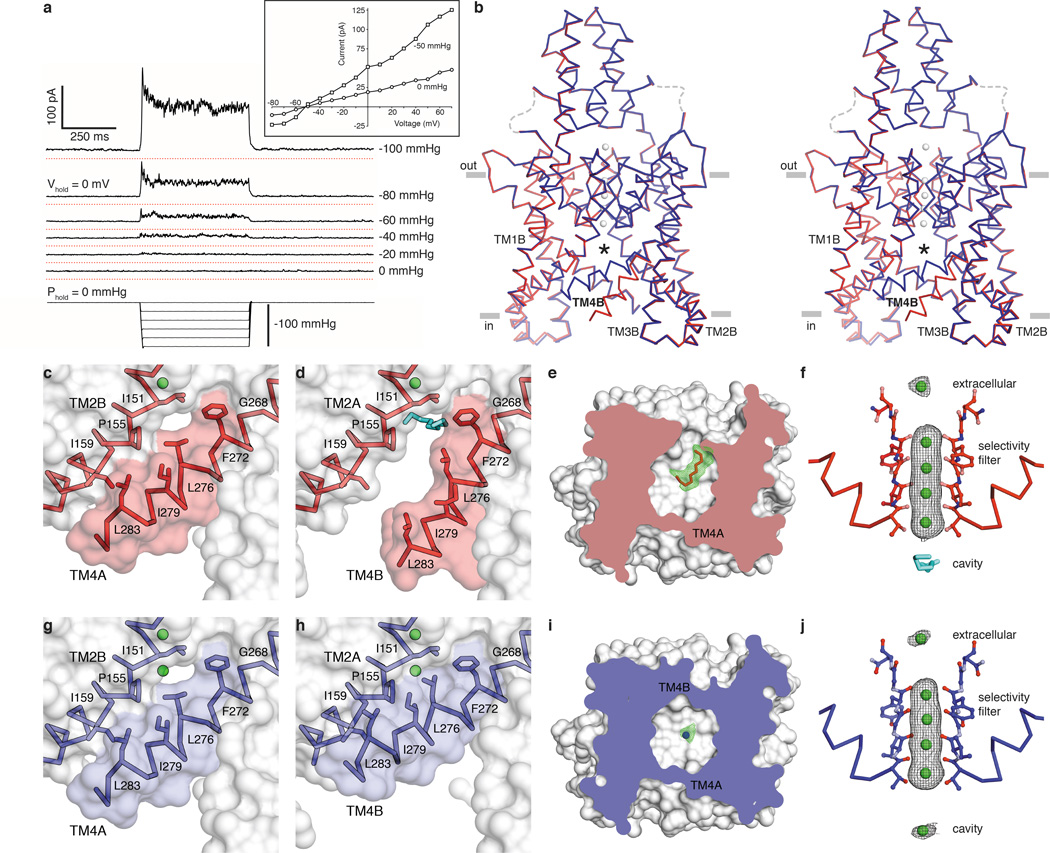
Figure 1a shows the effect of stretching the membrane on TRAAK channel activity. Pressure application to inside-out patches induces a rapid and reversible increase of K+-selective current. The construct used for these studies removed the disordered C-terminus from TRAAK because it improved the resolution of x-ray crystal structures by ~0.25 Å without affecting function. We determined the structure of TRAAK purified in decyl maltoside detergent and 150 mM K+ in complex with Fabs from mouse monoclonal antibodies at 2.5 Å resolution (Fig. 1b, Extended Data Table 1).
Figure 1. Structures of TRAAK in nonconductive and conductive conformations.
(a) Current response to pressure applied to an inside-out patch from a TRAAK-expressing cell held at 0 mV in a ten-fold [K+] gradient (EK+=−59 mV). Recordings are vertically offset with red lines at the zero current level. (Inset) Current-voltage relationship from the same patch before and during pressure application. (b) Stereo view of an overlay of conductive (blue) and nonconductive (red) conformations of TRAAK in K+ (gray). The central cavity (with ligands removed) is marked with an asterisk. (c–f) Nonconductive TRAAK structures. (c,d) Membrane view of the cytoplasmic half of (c) TM4A and (d) TM4B with a cavity-bound acyl chain (cyan). (d) is rotated 180° about the conduction axis from (c). (e) Cytoplasmic view clipped to the cavity plane with Fo-Fc positive omit density at 2.5σ (green) around the acyl chain (red). (f) Anomalous density (gray) at 3σ (extracellular ion) or 5σ (selectivity filter ions) around Tl+ (green) in the conduction pathway of nonconductive TRAAK with a cavity-bound acyl chain (cyan). (g–j) Conductive TRAAK structures in the same views as (c–f). The cavity-bound ion is shown in Fo-Fc positive omit density (i, green) and anomalous density (j, gray) at 3σ.
We find in this structure that TRAAK is asymmetric because transmembrane helix 4 (TM4) from each subunit adopts a different conformation (Fig. 1b–e). TM4 from subunit A (TM4A) is “up” – it is kinked approximately halfway through the membrane around the hinge glycine conserved in K+ channels (G268) and packs hydrophobic residues on its extracellular-facing side against the cytoplasmic-facing side of TM2B (Fig. 1c). This creates a continuous protein surface facing the membrane that seals the channel cavity from lipids (the ~3 Å-wide gap between L276 and I151 is smaller than an acyl chain). On the other side of the channel, TM4B is “down” – it traverses the membrane without kinking at the hinge glycine (Fig. 1d). This creates a ~5 Å-wide intramembrane opening between TRAAK subunits that exposes the channel cavity to the inner leaflet of the lipid bilayer.
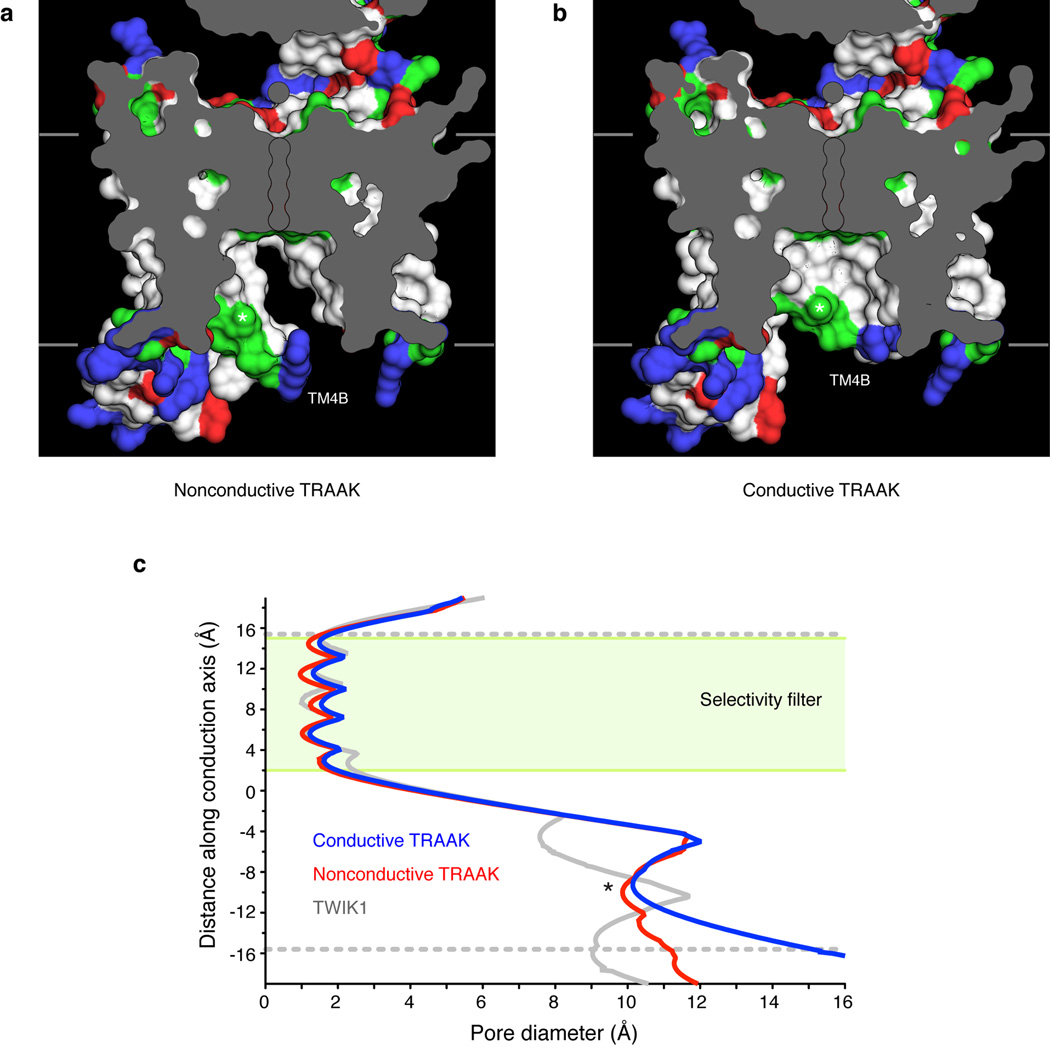
An elongated tube of electron density consistent with a ten-carbon acyl chain extends from this intramembrane opening to the central cavity underneath the selectivity filter (Fig. 1e). We cannot distinguish crystallographically whether this acyl chain is from a co-purified lipid or a detergent molecule due to the lack of strong density features outside of the channel. This suggests that TRAAK does not tightly bind the head group of the molecule occupying the cavity. Electrophysiological evidence presented below, the presence of acyl chains in analogous positions in the structure of the related K2P TWIK114, the hydrophobic nature of the site (Extended Data Fig. 1) and geometric considerations (a typical acyl chain from an inner leaflet lipid can reach the site) leads us to believe that a lipid acyl chain can occupy the cavity in a membrane.
Does the presence of this acyl chain preclude ion binding in the cavity of TRAAK? We utilized the anomalous dispersion of X-rays by the permeant ion Tl+ as a sensitive measure of ion occupancy to test this idea. A structure in which 150 mM Tl+ replaced K+ was determined at 3.0 Å resolution. The overall structure in Tl+ is essentially identical to the structure in K+ (Extended Data Table 2). The cavity is similarly exposed to the membrane on the side of TM4B and acyl chain density is observed, although the intracellular half of TM4B is apparently disordered. Anomalous density maps show five Tl+ ions along the conduction pathway: one above the extracellular mouth of the pore and four in the selectivity filter (Fig. 1f). No Tl+ is observed in the cavity site that is occupied by lipid.
We next screened for crystallization conditions to capture TRAAK with both intramembrane openings sealed and identified chemical additives that promoted this conformation (Fig. 1b, g–j). The best diffracting K+- and Tl+-bound crystals contained 4% (vol/vol) polypropylene glycol or 52 mM trichloroethanol (a known TRAAK activator17) and structures were determined to 2.5 Å and 3.0 Å resolution, respectively (Extended Data Table 1). Compared to the previous structures, TM4A remains in the same “up” conformation (Fig. 1g). The conformation of TM4B changes by bending around the hinge G268 to pack against TM2A and seal the intramembrane opening (Fig. 1h). With both intramembrane openings sealed, elongated acyl chain density is no longer observed in the cavity of these structures. In its place, there is approximately spherical density (Fig. 1i) and the Tl+-containing structure has a strong (5.1 σ) additional anomalous peak in the cavity (Fig. 1j). We note that while we do not observe density for the additives that promote this conformational change, TFE functionally activates TRAAK channels in patches17.
The structures show that when TM4 is down, a lipid acyl chain can access the channel cavity through intramembrane openings and compete with ion binding. When TM4 is up, the intramembrane opening is sealed and an ion occupies the cavity site. These observations lead us to the following hypothesis: the TM4-down, lipid-blocked structure is a nonconductive TRAAK conformation while the TM4-up structure is a conductive TRAAK conformation.
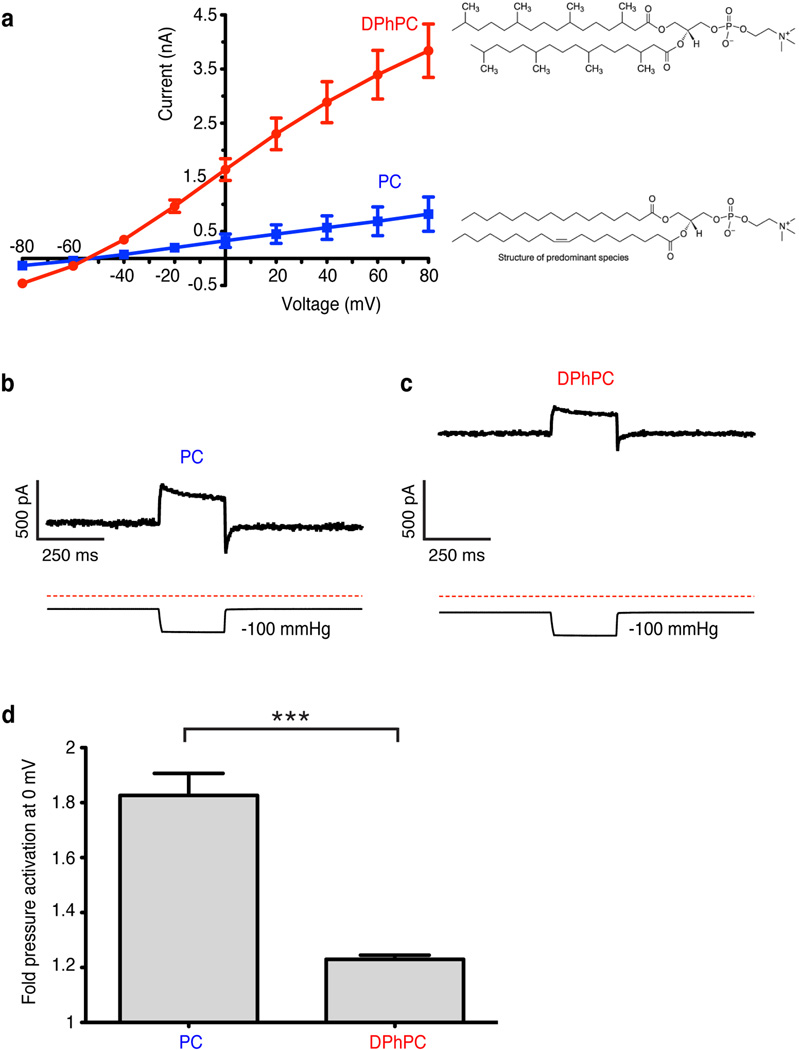
The above hypothesis predicts that a lipid less capable of entering through the intramembrane opening would render channels more conductive. To test this, we reconstituted purified TRAAK in phophatidylcholine with either unbranched (PC) or branched diphytanoyl (DPhPC) acyl chains and recorded from proteoliposome patches (Extended Data Fig. 2). We observed higher levels of current in DPhPC compared to PC. This could result from either more active channels or more efficient reconstitution (i.e. more channels) in DPhPC. Notably, when the patch is inflated the mechanically activatable component is not proportionally increased as would be expected if there simply were a larger number of channels. Thus, the baseline activity of TRAAK is higher in DPhPC consistent with the notion that the diphytanoyl chain is less able to enter the cavity and block ion conduction.
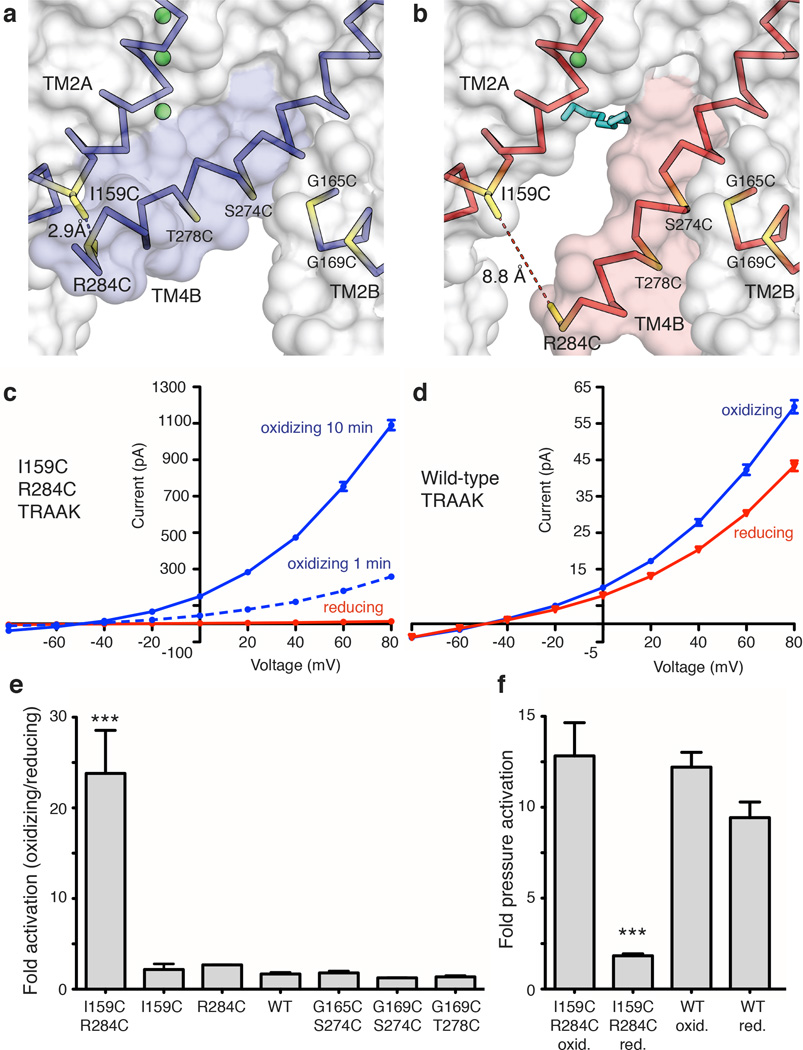
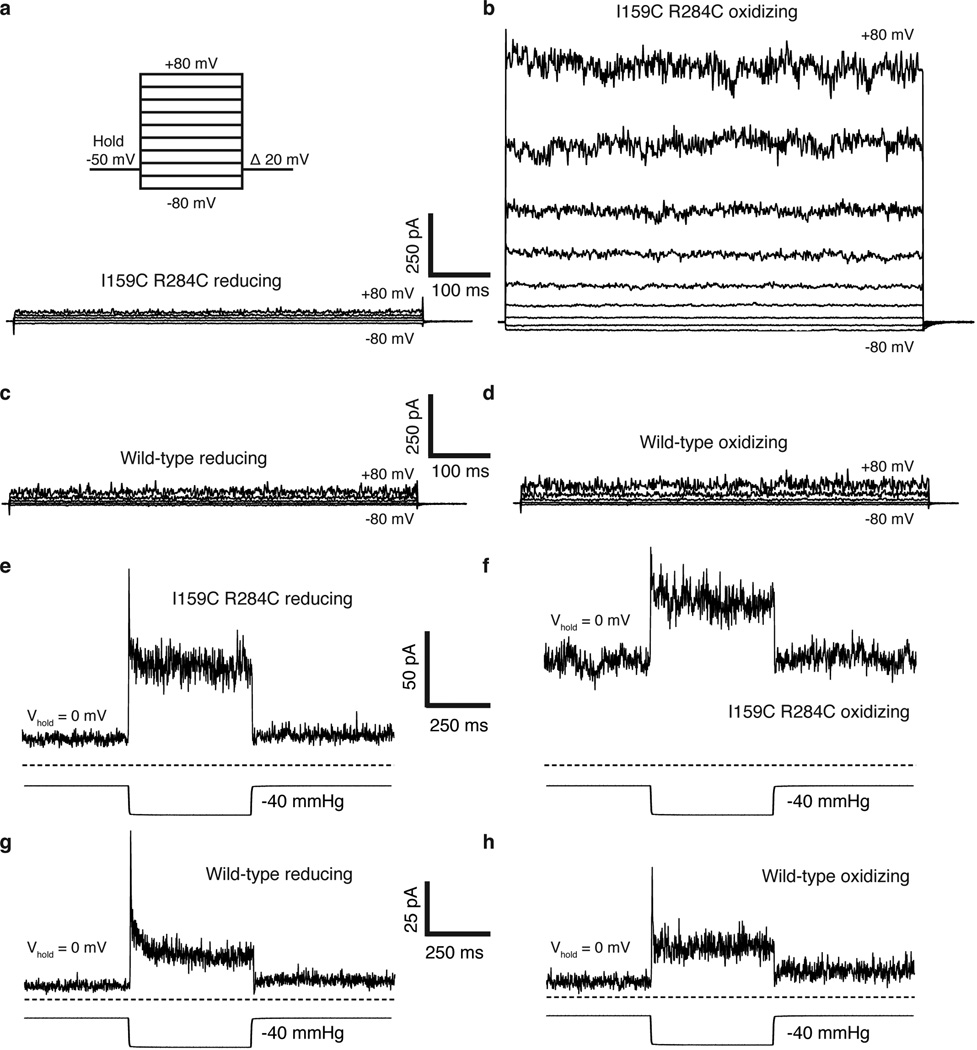
A second prediction from the model is if TM4 is trapped in the up conformation the channel should be more conductive. To test this, we exploited the large conformational change in TM4 to design a double cysteine mutant I159C R284C that could be disulfide bridged only in the predicted conductive conformation (Fig. 2a,b). The I159C R284C double cysteine mutant was rapidly activated upon exposure to oxidizing solution (greater than 10 fold within 1 minute) and activation continued over several minutes to 23.8 ± 4.7 fold (Fig. 2c, e, Extended Data Fig. 3). Wild-type channels in contrast showed only a small effect (1.67 ± 0.19 fold activation) (Fig. 2d,e, Extended Data Fig. 3). Single cysteine mutants or three other double cysteine mutants close in space to I159C R284C showed no effect relative to wild-type (Fig. 2e). Therefore, the activation of I159C R284C in oxidizing solution depends on the three-dimensional orientation of the cysteine pair. These results suggest that the formation of a disulfide bridge between TM4 and TM2 stabilizes a conductive conformation of TRAAK.
Figure 2. Redox-dependent activation of a TRAAK double cysteine mutant between TM2 and TM4.
(a,b) Cysteine mutations (yellow) and predicted distance between sulfur atoms in I159C R284C TRAAK in the (a) conductive and (b) nonconductive conformations. (c,d) Current-voltage relationship from a representative (c) I159C R284C or (d) wild-type (WT) TRAAK patch in reducing (red) and oxidizing (blue) bath solutions. (e) Quantification of fold activation in oxidizing compared to reducing bath solutions (mean ± SEM at 0 mV, I159C R284C 23.8 ± 4.7 (n=6 patches), I159C 2.17 ±0.62 (n=3), R284C 2.68 ± 0.03 (n=3), WT 1.67 ± 0.19 (n=6), G165C S274C 1.80 ±0.21 (n=3), G169C S274C 1.25±0.02 (n=3), G169C T278C 1.37 ±0.14 (n=3), ***p<0.0001, one way ANOVA). (f) Quantification of pressure activation in oxidizing or reducing bath solutions (mean fold activation at 0 mV ± SEM, I159C R284C reducing 12.83 ± 1.83, I159C R284C oxidizing 1.83 ± 0.11, WT reducing 12.21 ± 0.82 and WT oxidizing 8.43 ± 0.86, n=3 patches each, ***p=0.0003, one way ANOVA).
As in the case of TRAAK reconstituted in DPhPC, the mechanically activatable component of oxidized I159C R284C is a smaller fraction of the baseline current compared to reduced I159C R284C or wild-type TRAAK (Fig. 2f, Extended Data Fig. 3). In principle, if all channels were locked open with a disulfide bridge, we should observe no further opening with mechanical perturbation. However, TRAAK open probability is low in all circumstances in which we study it (Extended Data Fig. 4). Together, the increased baseline activity and relative reduction of mechanosensitivity in these experiments are consistent with the proposed TM4-mediated gating of TRAAK.
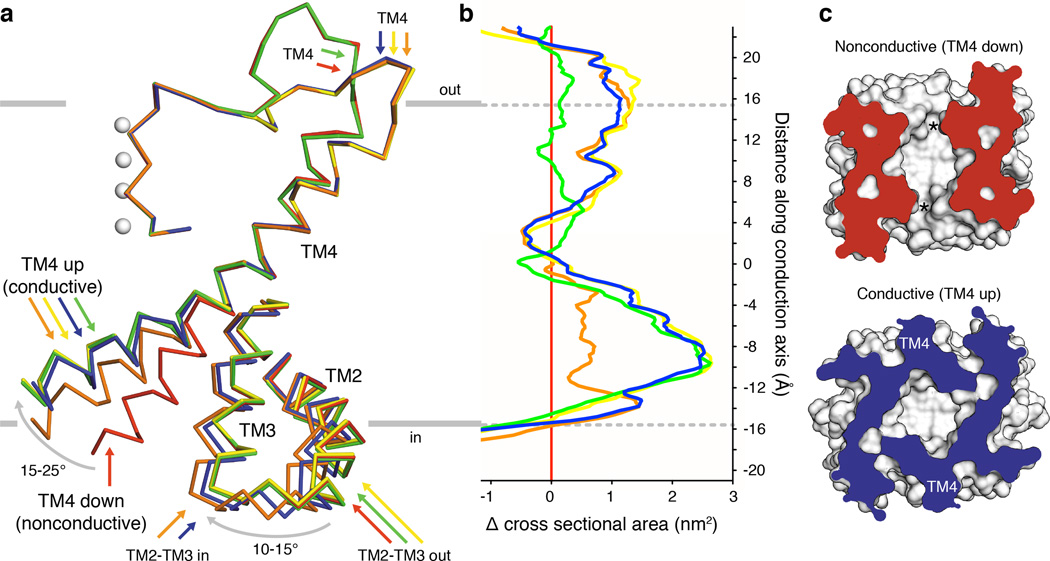
We next asked whether comparison of the structures could provide additional insight into the physical basis of TRAAK mechanosensitivity. Figure 3a shows the spectrum of conformational changes observed in TRAAK structures (Extended Data Table 3). The cytoplasmic half of TM4 is observed in one nonconductive (TM4-down, red) and two conductive (TM4-up) conformations. From the nonconductive conformation, rearrangement of the intracellular half of TM4 by a ~15° bend (around G268) and a ~15° right-handed rotation about the helical axis gives the orange TM4-up conformation. Alternatively, a ~25° bend and a ~10° rotation gives the blue, green, or yellow TM4-up conformations.
Figure 3. Conformational changes in conductive TRAAK structures expand the channel cross sectional area.
(a) Membrane view of an overlay of mobile elements in nonconductive (red) and conductive conformations (orange, green, yellow and blue) of TRAAK. (b) Difference in cross sectional area versus membrane depth calculated between each conductive conformation and the nonconductive conformation (positive values indicate area expansion upon channel opening, colors as in (a)). Depth is on the same scale as (a) with gray indicating bilayer boundaries. (c) Cytoplasmic view of nonconductive and conductive conformations clipped at –9 Å depth. Intramembrane openings (asterisks) or TM4 positions are indicated.
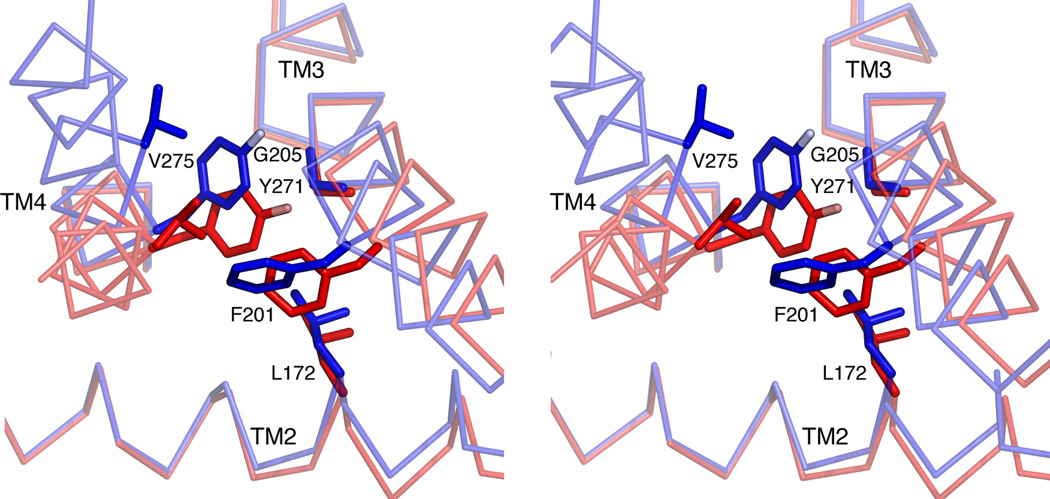
The transition from a nonconductive to conductive state can occur by movement of TM4 alone (compare the red and green structures) or with additional conformational changes (Fig. 3a). In the blue and orange structures, the linked inner extension of TM2-TM3 rotates ~10–15° towards TM4. This can only occur if TM4 is up because a rotated TM2-TM3 would sterically clash with TM4 in a down conformation (Extended Data Fig. 5). By creating a steric barrier to the nonconductive conformation of TM4, rotation of TM2-TM3 may stabilize the conductive conformation. In the blue, orange, and yellow structures, the selectivity filter to TM4 linker rearranges and the extracellular end of TM4 is laterally displaced from the conduction axis compared to the red structure. This displacement is observed only in TM4 up structures, although unlike with the TM2-TM3 rotation, there is no apparent structural constraint that necessitates the changes be coupled.
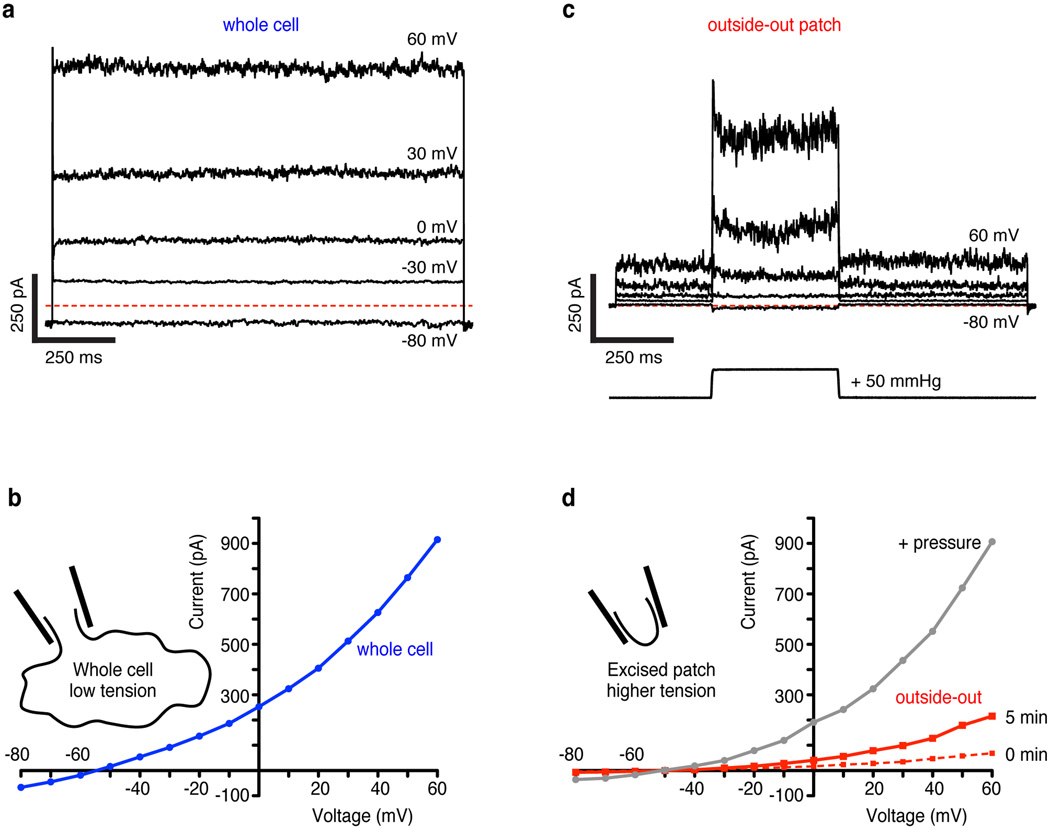
The effect of membrane tension on TRAAK activity can be observed in a simple experiment. A cell expressing TRAAK recorded in whole-cell mode gives ~1000 pA of current (Extended Data Fig. 4a,b). An outside-out patch excised from this cell runs up over several minutes to give ~250 pA and applying pressure to the patch gives ~1000 pA of current (Extended Data Fig. 4c,d). How can a patch containing a small fraction of the whole cell membrane (< 1 %) give currents similar in magnitude to the whole cell? The explanation is that membrane tension varies in these recordings. The whole-cell has near zero tension, the excised patch has low to intermediate tension due to the adhesion of lipid to glass (~ 0.5–4 mN/m) and patch pressurization causes high tension (up to lytic values ~12 mN/m)5,18,19. From these experiments we can estimate that TRAAK has very low basal activity near zero tension (<1% of maximum activity) and is activated over a broad tension range from ~0.5–4 mN/m to ~12 mN/m.
Can the structural differences between conductive and nonconductive states explain mechanosensitivity of TRAAK? Membrane tension (γ) favors an expansion of protein cross sectional area (ΔA) by an energy equal to -γΔA. Plotting the change in cross-sectional area between conductive and nonconductive conformations shows a marked expansion of TRAAK with channel opening (Fig. 3b) with each conformational change described above contributing to expansion at different membrane depths. The transition to TM4-up expands the channel by up to 2.7 nm2 in the cytoplasmic leaflet due to its elevated projection in the membrane (Fig. 3b,c). At the membrane-cytoplasm boundary, rotation of TM2-TM3 expands TRAAK by 1.5 nm2 by sealing a crevice between TM3 and TM4. In the extracellular leaflet, displacement of the cytoplasmic half of TM4 away from the conduction axis expands TRAAK by 1 nm2. Over the range of tensions that activates TRAAK (~0.4–4 to 12 mN/m), area expansion between nonconductive and conductive TRAAK conformations gives a calculated energy difference of 0.3–8.1 kBT that promotes force activation.
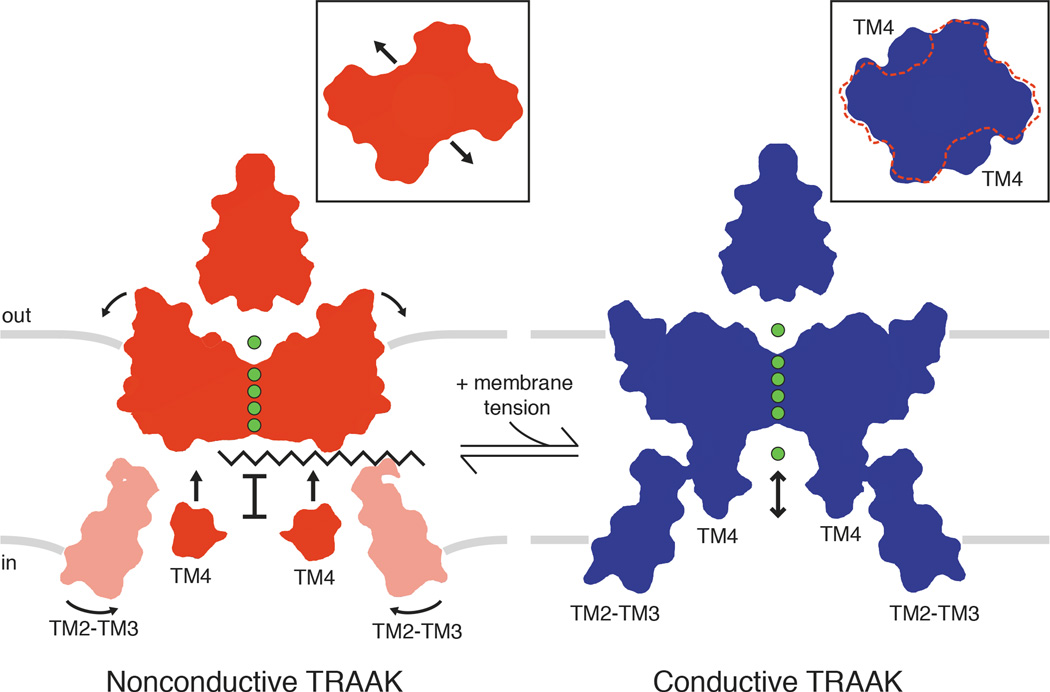
Changes in lipid deformation may also contribute to tension activation of TRAAK. Inspection of the structures gives a qualitative appreciation of this effect. The nonconductive channel forms a distinctly angled cavity between subunits (bound by the inner halves of TM2, TM3 and TM4) (Fig. 3,4). In the conductive channel this cavity becomes sealed by elevation of TM4 and rotation of TM2-TM3 to create a flatter membrane-facing surface. In other words, the nonconductive channel is more wedge shaped and the conductive channel more cylindrical. These shapes have energetic consequences20. A cylinder matches the average flat plane of a membrane better than a wedge. A wedge forces to the membrane to curve where it meets the surface of the channel and this curving costs a midplane bending free energy penalty: the higher the tension the higher the cost20. Consequently as membrane tension is increased the cylindrical shape becomes more energetically favored relative to the wedge shape. Tension favors opening.
Figure 4. Model for TRAAK gating and physical basis of mechanosensitivity.
In the nonconductive conformation (red), a lipid acyl chain accesses the central cavity through intramembrane openings above TM4 to sterically block ion (green) conduction. In the conductive conformation (blue), conformational changes in TM4 seal the intramembrane openings to prevent lipid access and permit ion conduction through the channel. Conformational changes upon channel opening increase the channel cross sectional area (insets). Rotation of TM2-TM3 towards TM4 in the cytoplasmic leaflet and displacement of the extracellular half of TM4 further expand the channel and may stabilize the conductive conformation. Area expansion and reduced midplane bending of the membrane (gray bars) result in a membrane tension-dependent energy difference between conformations that explains mechanosensitivity of TRAAK.
The data presented here support a model for gating and mechanosensitivity of TRAAK shown in Fig. 4. The conformational change in two TM4s that gates TRAAK is similar to the conformational change in four inner helices that gate canonical K+ channels15,16. However, instead of opening a protein seal to the cytoplasm, TM4 movement in TRAAK seals intramembrane openings to prevent lipid from blocking ion conduction. Might other channels use this unprecedented gating mechanism? The closely related K2Ps TREK1 and TREK2 share the key functional and structural features of TRAAK8,12,21. Predictions of area expansion and energy differences from electrophysiological studies of TREK1 agree closely with the values calculated for TRAAK here22,23. Increasing the interaction of a cytoplasmic sensor region immediately following TM4 with the membrane is proposed to activate TREK channels24–28, but how this sensor is physically coupled to a channel gate is unknown. Extension of the model presented here suggests a simple explanation: increasing the proximity of the intracellular end of TM4 to the membrane in TREK channels stabilizes a conductive TM4-up conformation.
Comparison of TRAAK and TWIK1 suggests an explanation for why among K2Ps only TRAAK subfamily channels are mechanosensitive8. TWIK1 was observed in a TM4-down conformation with intramembrane openings filled with acyl chains14. Pore dehydration of TWIK1 has been proposed to stabilize the nonconductive state and introducing polar residues in the cavity increases channel acivity, consistent with a hydrophobic barrier to conduction29. TRAAK has a wider cavity than TWIK1 that expands in the conductive conformation (Extended Data Fig. 1). Notably, two structural differences appear to restrict TWIK1 TM4s from adopting a membrane sealing conformation. First, an amphipathic helix after TWIK1 TM4 anchors the cytoplasmic end of the helix to the membrane. Second, TWIK1 TM4 interacts extensively with the cytoplasmic half of TM2-TM3. In TRAAK, the amphipathic nature of TM2-TM3 results in its lateral extension in the membrane away from TM4, enabling free rotation of the inner half of TM4. If TM4 is prevented from rotating to an up conformation in TWIK1, gating would not produce the area expansion and shape changes we propose underlie mechanosensitivity of TRAAK.
Methods
Protein expression and purification
Cloning of a codon-optimized variant of the Homo sapiens TRAAK gene (UniProt Q9NYG8-2) and heterologous expression in Pichia pastoris was previously described8,12,13. The construct used in this study is C-terminally truncated by an additional ten amino acids compared to our previous reports and similarly incorporates two mutations to remove N-linked glycosylation sites (N104Q/N108Q) and is expressed as a C-terminal Precission protease-cleavable EGFP-10xHis fusion protein. TRAAK1–290(N104Q,N108Q)-SNS-LEVLFQ/GP-EGFP-H10 is referred to as TRAAK in the text for simplicity.
Frozen Pichia cells expressing TRAAK were disrupted by milling (Retsch model MM301) 5 times for 3 minutes at 25 Hz. All subsequent purification steps were carried out at 4° C. For crystallization in K+, cell powder was added to lysis buffer (50 mM Tris pH 8.0, 150 mM KCl, 60 mM decyl-β-D-maltoside (DM, Affymetrix), 0.1 mg/mL DNAse 1, 1 µg/ml pepstatin, 1 µg/ml leupeptin, 1 µg/ml aprotinin, 10 µg/ml soy trypsin inhibitor, 1 mM benzamidine, and 1 mM phenylmethysulfonyl fluoride added immediately before use) at a ratio of 1 g cell pellet/4 mL lysis buffer. Membranes were extracted for 3 hours with stirring followed by centrifugation at 35000×g for 45 minutes. Cobalt resin (Clontech) was added to the supernatant (1 mL resin/5 g cell pellet) and stirred gently for 3 hours. Resin was collected on a column and serially washed and eluted in buffer (50 mM Tris pH 8.0, 150 mM KCl, 6 mM DM) with 10 mM, 30 mM, and 300 mM imidazole pH 8.0. EDTA pH 8.0 (1 mM final) and PreScission protease (~1:50 wt:wt) were added to the elution before incubation with gentle rocking overnight. Cleaved protein was concentrated (50 kDa MWCO) and applied to a Superdex 200 column (GE Healthcare) equilibrated in SEC buffer (20 mM Tris pH 8.0, 150 mM KCl, 1 mM EDTA, 4mM n-Decyl-β-D-Maltopyranoside (DM)).
Fab was prepared from monoclonal antibody 13E9 against TRAAK as described13 and buffer exchanged on a HiTrap desalting column (GE Healthcare) into 20 mM Tris 150 mM KCl pH 8.0 for crystallization in KCl or 20 mM Tris 150 mM KNO3 pH 8.0 for crystallization in TlNO3. TRAAK-Fab complexes were prepared by incubating purified channel concentrated (50 kDa MWCO) to ~10 mg/mL with purified Fab concentrated (10 kDa MWCO) to ~30 mg/mL at a 1:2.5 molar ratio in SEC buffer for 10 min at 4°C. TRAAK-Fab complex was separated from excess free Fab on a Superdex 200 column (GE Healthcare) equilibrated in SEC buffer. TRAAK-Fab complexes were concentrated (10 kDa MWCO) to 30 mg/mL for crystallization.
For crystallization in Tl+, TRAAK-Fab complexes were purified identically except that 150 mM KNO3 replaced the 150 mM KCl in all buffers except for the final SEC buffer in which 150 mM TlNO3 replaced the 150 mM KCl.
Crystallization, data collection, and structure determination
Crystals were grown in drops of 0.25–0.35 µL protein added to an equal volume of reservoir in hanging drops over 100 µL reservoir at 4°C. Reservoir for the nonconductive conformation in K+ was 50 mM TRIS pH 8.8, 200 mM CaCl2, 27–30% (vol/vol) PEG400. Reservoir for the nonconductive conformation in Tl+ was 50 mM TRIS pH 8.8, 200 mM Ca(NO3)2, 27–30% (vol/vol) PEG400. Reservoir for the conductive conformation in K+ was 50 mM TRIS pH 8.8, 200 mM CaCl2, 27–30% (vol/vol) PEG400, 4% (vol/vol) polypropylene glycol 400. Reservoir for the conductive conformation in Tl+ was 50 mM TRIS pH 8.8, 200 mM Ca(NO3)2, 27–30% (vol/vol) PEG400, 52 mM trichloroethanol. Crystals grew to ~ 100 µm × 100 µm × 200 µm in 4–6 weeks. For cryoprotection, an approximately equal volume of mother liquor supplemented to be 30% (vol/vol) PEG 400 was added to one side of the drop and crystals were moved through this solution with a cryoloop before being plunged into liquid nitrogen.
Data were collected at beamline 23-IDB or 24-IDC at the APS. Thallium-containing crystals were collected at the energy giving a maximum imaginary scattering component f’’ determined by a fluorescent scan. Data were processed with HKL200030 and structures were solved by molecular replacement with Phaser31 using the previously solved TRAAK-Fab structure13 with ligands, TM2-TM3 and TM4 regions removed as the search model. Consistent with recent analysis32, incorporation of weak data at high resolution (to CC1/2=35–60%) improved map quality. The structures were modeled in Coot33 and refined in Refmac34. Molprobity35 was used to assess model geometry. Two-fold local NCS and jelly body restraints were used throughout refinement and three TLS groups per protein chain were incorporated during the final rounds of refinement. 1350 of 1454 total amino acids (93%) are modeled in the structures: the termini (amino acids 1–26 and 285–290 plus a nine amino acid linker) and a loop connecting the helical cap to pore helix 1 (amino acids A104-A109 and B106-B109) in each TRAAK protomer and a loop in each Fab heavy chain (amino acids 130–135) were not visible in the electron density. In the nonconductive structure in Tl+, residues 275–284 from TRAAK subunit B were additionally not modeled.
The positions of seven Tl+ ions in the nonconductive conformation (two bound to the extracellular surface of TRAAK, one above the cytoplasmic mouth of the filter, and four in the selectivity filter) and eight Tl+ ions in the conductive conformation (with an additional Tl+ in the cavity) were identified in model phased anomalous difference Fourier maps as the highest peaks above background. PhaserEP36 automatically found the same sites. The presence of an acyl chain in the channel cavity was evaluated based on the shape of the electron density (in omit maps) and statistics after crystallographic refinement. The mean B-factor and real space correlation coefficient of the acyl chain (101 Å2 / 0.76 in the K+ structure and 132 Å2 / 0.74 in the Tl+ structure) are comparable to the values of nearby residues in TM2 and TM4 that project into the cavity (amino acids 154,155,158,161,269,272,273, and 276 have an average B-factor / real space correlation coefficient of 125 Å2 / 0.78 in the K+ structure and 142 Å2 / 0.83 in the Tl+ structure).
Phases for omit maps were calculated from a ligand-free model with every atom randomly shifted by a maximum of 0.5 Å prior to 20 cycles of refinement in Refmac to remove model bias. Omit density in these maps was essentially indistinguishable from maps generated with naïve models that never had ligands modeled or simulated annealing omit maps calculated with Phenix.
Structures were compared after alignment of pore helices and selectivity filters (119–133 and 228–242 from chain A and B) using LSQKAB in CCP4. Cross sectional area calculations were performed with CHARMM37,38. The area calculation used a surface calculated with 1.4 Å added to Van der Waals radii of protein atoms and a probe radius of 3.5 Å to approximate the lipid accessible surface area. A water cylinder with a 6 Å radius was used to fill the cavity of the TRAAK channels to exclude its contribution from the calculation. All area calculations and structures in Figs. 3 and 4 were made with symmetric TRAAK channels (i.e. both subunits had the same conformation) generated by rotation of a copy of one subunit onto the other. Internal pore diameters were calculated with the program Hole39. Structure figures were made with Pymol (Version 1.7.2 Schrödinger, LLC) or the UCSF Chimera40 package. Chimera is developed by the Resource for Biocomputing, Visualization, and Informatics at the University of California, San Francisco (supported by NIGMS P41-GM103311).
Electrophysiology
For cellular recording, CHO-K1 cells (ATCC) (which do not express endogenous mechanosensitive channels8) were cultured in DMEM-F12 (Gibco) with 10% FBS, 0.2 mM L-alanyl-L-glutamine (Glutamax, Gibco), 100 U/mL penicillin, and 100 ug/mL streptomycin. Cells were plated in 35 mm polystyrene dishes (BD Biosciences) or on polyester Thermanox™ coverslips (Thermo Scientific) ~24 hrs before transfection with FugeneHD (Promega) following manufacturers protocol. After 48 hrs, dishes or coverslips were transferred to a recording chamber and cells were washed with bath solution. DNA encoding amino acids 1–290 of Homo sapiens TRAAK was cloned into a pIR ES2-AcGFP vector (Clontech) to generate untagged TRAAK1–290 used in experiments shown in Fig. 1a. DNA encoding amino acids 1–300 of Homo sapiens TRAAK was cloned into the EcoR1/Xho1 sites of a modified pCEH vector to generate a C-terminally EGFP tagged construct (TRAAK1–300 - SNSAVDAGLVPRGSAAA-EGFP-H10). This construct and mutants generated with inverse PCR were used in experiments presented in Fig. 2 and Extended Data Figs. 3,4.
Reconstitution of TRAAK1–290(N104Q,N108Q)-SNS-LEVLFQ/GP-EGFP-H10 and recording from proteoliposome blisters was performed as described for TRAAK1–300(N104Q,N108Q)-SNS-LEVLFQ/GP-EGFP-H108. Azolectin (egg L-α-phosphatidylcholine, 840051) and DPhPc (1,2-diphytanoyl-sn-glycero-3-phosphocholine, 850356) lipids were from Avanti Polar Lipids, Inc.
Pipettes were pulled from borosilicate glass (Sutter Instruments BF150-86-10) to 3–4 MΩ resistance. Recordings were made with an Axopatch 200B amplifier (Molecular Devices), filtered at 1 kHz and digitized at 10–100 kHz (Digidata 1440A, Molecular Devices). All recordings were performed at room temperature. Pressure application through the patch pipette was accomplished with a high-speed pressure clamp (HSPC, ALA Scientific) controlled through the Clampex software. Pressure application velocity was set to the maximum rate of 8.3 mmHg/msec.
All recordings were performed in a ten-fold concentration gradient of K+. For cellular recordings, pipette solution was 10 mM Hepes, 150 mM KCl, 3 mM MgCl2, 5 mM EGTA, pH 7.2 (adjusted with KOH) and bath solution was 10 mM Hepes, 15 mM KCl, 135 mM NaCl, 3 mM MgCl2, 1 mM CaCl2, pH 7.3 (adjusted with NaOH). For experiments in Fig. 2 and Extended Data Fig. 3, reducing bath solution additionally contained 10 mM DTT added from a freshly thawed 1M stock of DTT in water. Reducing solution was used within one hour of preparation. For recordings from proteoliposomes, pipette solution was 5 mM Hepes, 180 mM NaCl, 20 mM KCl, pH 7.2 (adjusted with NaOH) and bath solution was 5 mM Hepes, 200 mM KCl, 40 mM MgCl2, pH 7.2 (adjusted with KOH). Perfusion was accomplished with a nitrogen pressurized micro-perfusion system (VC3-8xP, ALA Scientific). All recordings in the manuscript are presented such that positive currents indicate K+ flux from the high [K+] to low [K+] side.
Extended Data
Extended Data Figure 1. The central cavity in conductive and nonconductive TRAAK conformations.
(a,b) View from the membrane plane of the TRAAK central cavity in the (a) nonconductive and (b) conductive conformations. The exposed surface of hydrophobic amino acids are colored white, arginine and lysine are blue, glutamate and aspartate are red, and polar residues are green. The positions of K+ ions in the filter are outlined and residue T277 in TM4 is indicated with an asterisk. (c) Diameter of the ion conduction pathway as a function of distance through the membrane for nonconductive TRAAK (red), conductive TRAAK (blue) and TWIK1 (gray, PDB:3UKM). The green box indicates the position of the selectivity filter and dashed gray lines are the approximate boundaries of the lipid membrane. The ~10 Å diameter constriction formed partially by T277 is indicated with an asterisk. The pore diameter is larger in TRAAK than in TWIK1 and expands below T277 in the conductive conformation.
Extended Data Figure 2. Reconstituted TRAAK activity in different lipids.
(a) Current recorded from TRAAK proteoliposome patches as a function of holding voltage (mean ± SEM, n=9 patches each). Current through TRAAK reconstituted in phosphatidylcholine lipids with branched acyl chains (1,2-diphytanoyl-sn-glycero-3-phosphocholine, DPhPC) was significantly higher than in non-branched acyl chains (egg L-α-phosphatidylcholine, PC) at each voltage measured (5.0 fold higher at 0 mV, p < 0.0001, Student’s t-test). (b,c) Representative recording of pressure (lower trace) activation of TRAAK current (upper trace) in (b) PC or (c) DPhPC lipids. (d) Quantification of pressure activation of TRAAK in PC and DPhPC (mean fold pressure activation at 0 mV ± SEM, n=9 patches each, ***p < 0.0001, Student’s t-test).
Extended Data Figure 3. Representative electrophysiological recordings from wild-type and I159C R284C TRAAK.
In these experiments and those in Fig. 2, inside-out patches from cells expressing wild-type or mutant TRAAK channels were excised and perfused with reducing bath solution (with 10 mM DTT). After stabilization of the patch (TRAAK channels exhibit a gradual run-up of current following excision to an equilibrium value, e.g. Extended Data Fig. 4), the perfusion solution was switched to oxidizing bath solution (no DTT). (a,b) Representative voltage family from a I159C R284C TRAAK patch during perfusion of (a) reducing and (b) oxidizing solution. The voltage family protocol is illustrated. (c,d) Same as (a,b) but from a wild-type TRAAK patch. (e,f) Current response (upper) to pressure application (lower) at 0 mV from the same I159C R284C TRAAK patch during perfusion of (e) reducing or (f) oxidizing bath solution. (g,h) Same as (e,f), but from a wild-type TRAAK patch. Scale is shown between each pair of recordings in reducing and oxidizing bath solutions.
Extended Data Figure 4. Basal activity and tension activation of TRAAK.
(a) Whole cell current from a TRAAK-expressing cell during a voltage step protocol in a ten-fold gradient of [K+] (EK+ = −59 mV, holding voltage = −80 mV, ΔV = 10 mV, indicated steps shown). Red dashed line indicates zero current level. (b) Current-voltage relationship from experiment in (a). (c) Currents (upper traces) recorded from an outside-out patch excised from the same cell as in (a,b). The voltage protocol in (a) was used with an additional pressure step (lower trace) during each voltage step. (d) Current-voltage relationship from data in (b) (mean current 5 min after patch excision before pressure (red) and peak current during pressure step (gray)) and a recording immediately after pulling the patch (red dashes). The excised patch contains < 1% of the whole cell membrane area, but gives ~25% of the whole cell current before and similar current during a pressure step. This is explained by very low basal activity of TRAAK with near-zero membrane tension (whole cell) and channel activation by increasing membrane tension over a broad range (intermediate tension in an excised patch to high tension in a pressurized patch).
Extended Data Figure 5. Detailed view of TM2-TM3 rotation in TRAAK.
Stereo view from the cytoplasm of an overlay of nonconductive (red) and conductive TM2-TM3 rotated (blue) conformations. Amino acids that sterically prevent TM2-TM3 rotation when TM4 is down are shown as sticks. TM2-TM3 rotates about hinges at positions G169 and G205. This rotation can only occur if TM4 is up because amino acids L172, F201 and G205 on TM2-TM3 shift (0.75 –2.1 Å) to a position that would sterically clash with amino acids Y271 and V275 on TM4 in a down conformation. Translation of Y271 and V275 3.1–4.1 Å in TM4 up conformations creates space for the TM2-TM3 rotation.
Extended Data Table 1.
Data collection and refinement statistics
| Conductive K+ bound PDB: 4WFE |
Conductive Tl+ bound PDB: 4WFG |
Nonconductive K+ bound PDB: 4WFF |
Nonconductive Tl+ bound PDB: 4WFH |
|
|---|---|---|---|---|
| Data collection | ||||
| Space group | P21 | P21 | P21 | P21 |
| Cell dimensions | ||||
| a, b, c (Å) | 80.8, 138.5, 96.8 | 80.8, 138.8, 96.3 | 80.7, 138.9, 96.5 | 81.0, 138.8, 96.8 |
| α=γ, β (°) | 90, 95.1 | 90, 94.6 | 90, 95.1 | 90, 94.6 |
| Wavelength (Å) | 1.0332 | 0.9781 | 1.0332 | 0.9781 |
| Resolution (Å) | 50-2.5 (2.54-2.5)* | 50-3.0 (3.05-3) | 50-2.5 (2.54-2.5) | 50-3.0 (3.05-3) |
| Rsym (%) | 6.3 (>100) | 9.7 (>100) | 9.3 (>100) | 15.3 (>100) |
| Rpim (%) | 4.3 (97.6) | 5.8 (98.6) | 4.0 (94.2) | 7.0 (97.9) |
| CC1/2 (%) | (35.1) | (58.6) | (44.5) | (44.2) |
| //σ/ | 22.6 (0.9) | 14.7 (0.9) | 34.8 (1.0) | 11.3 (0.6) |
| Completeness (%) | 99.8 (99.8) | 99.6 (99.7) | 99.9 (100) | 100 (100) |
| Redundancy | 3.8 (3.7) | 5.6 (5.7) | 10.1 (10.3) | 10.5 (10.7) |
| Refinement | ||||
| Resolution (Å) | 48.2 - 2.5 | 48.0 - 3.0 | 48.1 - 2.5 | 48.2 - 3.0 |
| No. reflections† | 65770 | 40099 | 68997 | 39746 |
| Rwork/Rfree | 19.9 / 23.4 | 20.2 / 23.6 | 21.3 / 24.5 | 20.3 / 23.9 |
| No. atoms | ||||
| Total | 10598 | 10599 | 10585 | 10506 |
| K+ / Tl+ | 6 | 8 | 5 | 7 |
| Decane | 0 | 0 | 10 | 10 |
| B-factors | ||||
| All atoms | 90 | 109 | 98 | 112 |
| K+ / Tl+ | 89 | 94 | 137 | 170 |
| Decane | n/a | n/a | 101 | 131 |
| R.m.s deviations | ||||
| Bond lengths (Å) | 0.008 | 0.006 | 0.008 | 0.006 |
| Bond angles (°) | 1.058 | 0.898 | 1.002 | 0.908 |
| Ramachandran | ||||
| favored (%) | 96.69 | 97.37 | 97.14 | 96.51 |
| allowed (%) | 3.16 | 2.48 | 2.71 | 3.26 |
| disallowed (%) | 0.15 | 0.15 | 0.15 | 0.23 |
Data from 1, 1, 3 and 2 crystals were merged for the conductive K+, conductive Tl+, nonconductive K+ and nonconductive Tl+ structures, respectively.
Values for the highest resolution shell are shown in parenthesis.
5% of these reflections were used to calculate Rfree.
Extended Data Table 2.
Pairwise root mean square deviation (Å) between conformationally static regions between TRAAK structures
| Conductive K+ bound PDB: 4WFE |
Nonconductive K+ bound PDB: 4WFF |
Conductive Tl+ bound PDB: 4WFG |
|
|---|---|---|---|
| Nonconductive K+ bound PDB: 4WFF |
0.217 | - | - |
| Conductive Tl+ bound PDB: 4WFG |
0.186 | 0.227 | - |
| Nonconductive Tl+ bound PDB: 4WFH |
0.221 | 0.137 | 0.193 |
Conformationally static regions of the TRAAK channel in these structures include the entire A chain and residues 1–155 of chain B.
Extended Data Table 3.
Summary of TRAAK channel conformations in crystal structures
| State as a homodimer |
PDB ID | Chain ID | TM4 inner half conformation |
TM2–TM3 conformation |
TM4 outer half conformation |
|---|---|---|---|---|---|
| Nonconductive | 419W | B | Down | Out | Up |
| 4WFF | B | Down | Out | Up | |
| 4WFH | B | Down | Out | Up | |
| 3UM7 | B | Down | Out | Up | |
| 3UM7 | A | Down | Out | Up | |
| Conductive | 4WFE | A | Up | In | Displaced |
| 4WFF | A | Up | In | Displaced | |
| 4WFG | A | Up | In | Displaced | |
| 4WFH | A | Up | In | Displaced | |
| 419W | A | Up | In | Displaced | |
| 4WFE | B | Up | Out | Up | |
| 4WFG | B | Up | Out | Displaced |
Structures shown in Figure 3 are highlighted with the color used in the figure.
Acknowledgements
We thank staff at APS beamlines 23-IDB/D, especially Ruslan Sanishvili and Stephen Corcoran and at 24-IDC/E, especially Igor Kourinov, David Neau and Kanagalaghatta Rajashankar for assistance at the synchrotron and members of the MacKinnon laboratory for helpful discussions. S.G.B. is a Howard Hughes Medical Institute postdoctoral fellow of the Helen Hay Whitney Foundation and R.M. is an investigator of the Howard Hughes Medical Institute.
Footnotes
Author Contributions
S.G.B designed and performed the experiments. E.B.C. performed hybridoma cell culture. R.M. supervised the project. S.G.B and R.M. analyzed the data and wrote the manuscript.
The X-ray crystallographic coordinates and structure factors for the nonconductive conformation of TRAAK in K+ (4WFF) and Tl+ (4WFH) and the conductive conformation of TRAAK in K+ (4WFE) and Tl+ (4WFG) are available at the Protein Data Bank.
The authors declare no competing financial interests.
References for the main text
- 1.Arnadóttir J, Chalfie M. Eukaryotic mechanosensitive channels. Annual review of biophysics. 2010;39:111–137. doi: 10.1146/annurev.biophys.37.032807.125836. [DOI] [PubMed] [Google Scholar]
- 2.Bautista DM, Lumpkin EA. Perspectives on: information and coding in mammalian sensory physiology: probing mammalian touch transduction. J Gen Physiol. 2011;138:291–301. doi: 10.1085/jgp.201110637. [DOI] [PMC free article] [PubMed] [Google Scholar]
- 3.Delmas P, Coste B. Mechano-Gated Ion Channels in Sensory Systems. Cell. 2013;155:278–284. doi: 10.1016/j.cell.2013.09.026. [DOI] [PubMed] [Google Scholar]
- 4.Nilius B, Honore E. Sensing pressure with ion channels. Trends Neurosci. 2012;35:477–486. doi: 10.1016/j.tins.2012.04.002. [DOI] [PubMed] [Google Scholar]
- 5.Anishkin A, Loukin SH, Teng J, Kung C. Feeling the hidden mechanical forces in lipid bilayer is an original sense. Proc Natl Acad Sci USA. 2014;111:7898–7905. doi: 10.1073/pnas.1313364111. [DOI] [PMC free article] [PubMed] [Google Scholar]
- 6.Fink M, et al. A neuronal two P domain K+ channel stimulated by arachidonic acid and polyunsaturated fatty acids. EMBO J. 1998;17:3297–3308. doi: 10.1093/emboj/17.12.3297. [DOI] [PMC free article] [PubMed] [Google Scholar]
- 7.Noël J, et al. The mechano-activated K+ channels TRAAK and TREK-1 control both warm and cold perception. EMBO J. 2009;28:1308–1318. doi: 10.1038/emboj.2009.57. [DOI] [PMC free article] [PubMed] [Google Scholar]
- 8.Brohawn SG, Su Z, Mackinnon R. Mechanosensitivity is mediated directly by the lipid membrane in TRAAK and TREK1 K+ channels. Proc Natl Acad Sci USA. 2014;111:3614–3619. doi: 10.1073/pnas.1320768111. [DOI] [PMC free article] [PubMed] [Google Scholar]
- 9.Kung C, Martinac B, Sukharev SI. Mechanosensitive Channels in Microbes. Annu. Rev. Microbiol. 2010;64:313–329. doi: 10.1146/annurev.micro.112408.134106. [DOI] [PubMed] [Google Scholar]
- 10.Sukharev SI, Blount P, Martinac B, Kung C. Mechanosensitive channels of Escherichia coli: the MscL gene, protein, and activities. Annu Rev Physiol. 1997;59:633–657. doi: 10.1146/annurev.physiol.59.1.633. [DOI] [PubMed] [Google Scholar]
- 11.Perozo E, Cortes DM, Sompornpisut P, Kloda A, Martinac B. Open channel structure of MscL and the gating mechanism of mechanosensitive channels. Nature. 2002;418:942–948. doi: 10.1038/nature00992. [DOI] [PubMed] [Google Scholar]
- 12.Brohawn SG, del Mármol J, Mackinnon R. Crystal structure of the human K2P TRAAK, a lipid- and mechano-sensitive K+ ion channel. Science. 2012;335:436–441. doi: 10.1126/science.1213808. [DOI] [PMC free article] [PubMed] [Google Scholar]
- 13.Brohawn SG, Campbell EB, Mackinnon R. Domain-swapped chain connectivity and gated membrane access in a Fab-mediated crystal of the human TRAAK K+ channel. Proc Natl Acad Sci USA. 2013;110:2129–2134. doi: 10.1073/pnas.1218950110. [DOI] [PMC free article] [PubMed] [Google Scholar]
- 14.Miller AN, Long SB. Crystal Structure of the Human Two–Pore Domain Potassium Channel K2P1. Science. 2012;335:432–436. doi: 10.1126/science.1213274. [DOI] [PubMed] [Google Scholar]
- 15.del Camino D, Yellen G. Tight steric closure at the intracellular activation gate of a voltage-gated K(+) channel. Neuron. 2001;32:649–656. doi: 10.1016/s0896-6273(01)00487-1. [DOI] [PubMed] [Google Scholar]
- 16.Jiang Y, et al. The open pore conformation of potassium channels. Nature. 2002;417:523–526. doi: 10.1038/417523a. [DOI] [PubMed] [Google Scholar]
- 17.Harinath S, Sikdar SK. Trichloroethanol enhances the activity of recombinant human TREK-1 and TRAAK channels. Neuropharmacology. 2004;46:750–760. doi: 10.1016/j.neuropharm.2003.11.023. [DOI] [PubMed] [Google Scholar]
- 18.Phillips R, Ursell T, Wiggins P, Sens P. Emerging roles for lipids in shaping membrane-protein function. Nature. 2009;459:379–385. doi: 10.1038/nature08147. [DOI] [PMC free article] [PubMed] [Google Scholar]
- 19.Opsahl LR, Webb WW. Lipid-glass adhesion in giga-sealed patch-clamped membranes. Biophys J. 1994;66:75–79. doi: 10.1016/S0006-3495(94)80752-0. [DOI] [PMC free article] [PubMed] [Google Scholar]
- 20.Ursell T, Kondev J, Reeves D, Wiggins PA, Phillips R. In: Mechanosensitive Ion Channels. Kamkin A, Kiseleva I, editors. Vol. 1. Netherlands: Springer; 2008. pp. 37–70. [Google Scholar]
- 21.Enyedi P, Czirják G. Molecular background of leak K+ currents: two-pore domain potassium channels. Physiol Rev. 2010;90:559–605. doi: 10.1152/physrev.00029.2009. [DOI] [PubMed] [Google Scholar]
- 22.Honore E, Patel AJ, Chemin J, Suchyna T, Sachs F. Desensitization of mechano-gated K2P channels. Proc Natl Acad Sci USA. 2006;103:6859–6864. doi: 10.1073/pnas.0600463103. [DOI] [PMC free article] [PubMed] [Google Scholar]
- 23.Maksaev G, Milac A, Anishkin A, Guy HR, Sukharev SI. Analyses of gating thermodynamics and effects of deletions in the mechanosensitive channel TREK-1: comparisons with structural models. channels. 2011;5:26–34. doi: 10.4161/chan.5.1.13906. [DOI] [PMC free article] [PubMed] [Google Scholar]
- 24.Chemin J, et al. A phospholipid sensor controls mechanogating of the K+ channel TREK-1. EMBO J. 2005;24:44–53. doi: 10.1038/sj.emboj.7600494. [DOI] [PMC free article] [PubMed] [Google Scholar]
- 25.Murbartián J, Lei Q, Sando JJ, Bayliss DA. Sequential phosphorylation mediates receptor- and kinase-induced inhibition of TREK-1 background potassium channels. J Biol Chem. 2005;280:30175–30184. doi: 10.1074/jbc.M503862200. [DOI] [PubMed] [Google Scholar]
- 26.Patel AJ, et al. A mammalian two pore domain mechano-gated S-like K+ channel. EMBO J. 1998;17:4283–4290. doi: 10.1093/emboj/17.15.4283. [DOI] [PMC free article] [PubMed] [Google Scholar]
- 27.Honore E, Maingret F, Lazdunski M, Patel AJ. An intracellular proton sensor commands lipid- and mechano-gating of the K(+) channel TREK-1. EMBO J. 2002;21:2968–2976. doi: 10.1093/emboj/cdf288. [DOI] [PMC free article] [PubMed] [Google Scholar]
- 28.Bagriantsev SN, Clark KA, Minor DL. Metabolic and thermal stimuli control K2P2.1 (TREK-1) through modular sensory and gating domains. EMBO J. 2012:1–12. doi: 10.1038/emboj.2012.171. [DOI] [PMC free article] [PubMed] [Google Scholar]
- 29.Aryal P, Abd-Wahab F, Bucci G, Sansom MSP, Tucker SJ. A hydrophobic barrier deep within the inner pore of the TWIK-1 K2P potassium channel. Nature Communications. 2014;5:1–9. doi: 10.1038/ncomms5377. [DOI] [PMC free article] [PubMed] [Google Scholar]
References for the online-only methods section
- 30.Minor W, Cymborowski M, Otwinowski Z, Chruszcz M. HKL-3000: the integration of data reduction and structure solution--from diffraction images to an initial model in minutes. Acta Crystallogr D Biol Crystallogr. 2006;62:859–866. doi: 10.1107/S0907444906019949. [DOI] [PubMed] [Google Scholar]
- 31.McCoy AJ, et al. Phaser crystallographic software. J Appl Crystallogr. 2007;40:658–674. doi: 10.1107/S0021889807021206. [DOI] [PMC free article] [PubMed] [Google Scholar]
- 32.Karplus PA, Diederichs K. Linking Crystallographic Model and Data Quality. Science. 2012;336:1030–1033. doi: 10.1126/science.1218231. [DOI] [PMC free article] [PubMed] [Google Scholar]
- 33.Emsley P, Lohkamp B, Scott WG, Cowtan K. Features and development of Coot. Acta Crystallogr D Biol Crystallogr. 2010;66:486–501. doi: 10.1107/S0907444910007493. [DOI] [PMC free article] [PubMed] [Google Scholar]
- 34.Murshudov GN, et al. REFMAC5 for the refinement of macromolecular crystal structures. Acta Crystallogr D Biol Crystallogr. 2011;67:355–367. doi: 10.1107/S0907444911001314. [DOI] [PMC free article] [PubMed] [Google Scholar]
- 35.Chen VB, et al. MolProbity: all-atom structure validation for macromolecular crystallography. Acta Cryst. 2010;D66:12–21. doi: 10.1107/S0907444909042073. [doi:10.1107/S0907444909042073] 1–10 (2009). [DOI] [PMC free article] [PubMed] [Google Scholar]
- 36.Read RJ, McCoy AJ. Using SAD data in Phaser. Acta Crystallogr D Biol Crystallogr. 2011;67:338–344. doi: 10.1107/S0907444910051371. [DOI] [PMC free article] [PubMed] [Google Scholar]
- 37.Brooks BR, et al. CHARMM: The biomolecular simulation program. J. Comput. Chem. 2009;30:1545–1614. doi: 10.1002/jcc.21287. [DOI] [PMC free article] [PubMed] [Google Scholar]
- 38.Jo S, Kim T, Im W. Automated Builder and Database of Protein/Membrane Complexes for Molecular Dynamics Simulations. PLoS ONE. 2007;2:e880. doi: 10.1371/journal.pone.0000880. [DOI] [PMC free article] [PubMed] [Google Scholar]
- 39.Smart OS, Goodfellow JM, Wallace BA. The pore dimensions of gramicidin A. Biophys J. 1993;65:2455–2460. doi: 10.1016/S0006-3495(93)81293-1. [DOI] [PMC free article] [PubMed] [Google Scholar]
- 40.Pettersen EF, Goddard TD, Huang CC. UCSF Chimera—a visualization system for exploratory research and analysis. Journal of …. 2004 doi: 10.1002/jcc.20084. [DOI] [PubMed] [Google Scholar]


