Abstract
The mouse mpkCCD cell line is a continuous cultured epithelial cell line with characteristics of renal collecting duct principal cells. This line is widely used to study epithelial transport and its regulation. To provide a data resource useful for experimental design and interpretation in studies using mpkCCD cells, we have carried out “deep” proteomic profiling of these cells using three levels of fractionation (differential centrifugation, SDS-PAGE, and HPLC) followed by tandem mass spectrometry to identify and quantify proteins. The analysis of all resulting samples generated 34.6 gigabytes of spectral data. As a result, we identified 6,766 proteins in mpkCCD cells at a high level of stringency. These proteins are expressed over eight orders of magnitude of protein abundance. The data are provided to users as a public data base (https://helixweb.nih.gov/ESBL/Database/mpkFractions/). The mass spectrometry data were mapped back to their gel slices to generate “virtual Western blots” for each protein. For most of the 6,766 proteins, the apparent molecular weight from SDS-PAGE agreed closely with the calculated molecular weight. However, a substantial fraction (>15%) of proteins was found to run aberrantly, with much higher or much lower mobilities than predicted. These proteins were analyzed to identify mechanisms responsible for altered mobility on SDS-PAGE, including high or low isoelectric point, high or low hydrophobicity, physiological cleavage, residence in the lysosome, posttranslational modifications, and expression of alternative isoforms due to alternative exon usage. Additionally, this analysis identified a previously unrecognized isoform of aquaporin-2 with apparent molecular mass <20 kDa.
Keywords: aquaporin-2, liquid chromatography-tandem mass spectrometry, mass spectrometry, differential centrifugation, mpkCCD
the collecting duct cell line mpkCCD, a mainstay of research on vasopressin-mediated regulation of the water channel aquaporin-2 (AQP2) (10, 15), is an immortalized cultured cell line derived from microdissected cortical collecting ducts from a male SV-PK/Tag transgenic mouse (3). Recently, we recloned these cells to obtain a subline (clone 11) that expresses AQP2 at a high level only when grown in the presence of vasopressin and shows trafficking of AQP2-containing vesicles to the plasma membrane in response to short-term exposure to vasopressin (25). These cells, therefore, mimic the long- and short-term effects of vasopressin in native collecting duct cells (16). Here, to provide an information resource, we have carried out “deep” quantitative liquid chromatography-tandem mass spectrometry (LC-MS/MS) analysis of subcellular fractions from differential centrifugation (DC) of mpkCCD cell homogenates. The comprehensive nature of the study was promoted by use of sequential fractionation steps: DC of mpkCCD homogenates followed by SDS-PAGE of each subcellular fraction with LC-MS/MS analysis of tryptic peptides from gel slices. These fractionation steps produced 215 samples, the analysis of which provided 34.6 gigabytes of spectral data. To make the data publically available, we have set up an online web page showing the distributions of individual proteins among the fractions in the presence and absence of vasopressin. In addition, we have mapped the identified peptides to the gel slices from which they were obtained and used this mapping to create virtual Western blots for each identified protein, itself a useful resource. This mapping yields apparent molecular weights for each protein, allowing a comparison of actual vs. theoretical molecular weights. This comparison is informative with regard to identification of protein modifications of each protein in the mpkCCD cell, e.g., by covalent modification of amino acid side chains or physiological proteolytic cleavage.1
METHODS
Cell culture.
All studies were done in an AQP2-expressing mpkCCD clonal cell line (clone 11) grown on permeable membrane supports (75 mm; Transwell, catalog no. 3419, Corning Costar). Clone 11 mpkCCD cells were maintained in Dulbecco's modified Eagle's medium-Ham's F12 medium (1:1; catalog no. 11330-032) plus supplements (5 μg/ml insulin, 50 nM dexamethasone, 1 nM triiodothyronine, 10 ng/ml epidermal growth factor, 60 nM sodium selenite, and 5 μg/ml transferrin) and 2% heat-inactivated fetal bovine serum (catalog no. 100-106, BenchMark, Gemini Bio Products). Cells were maintained in an incubator at 37°C with 5% CO2-95% air. Cells were screened for Mycoplasma infection using a Mycoplasma detection kit (MycoAlert, Allendale, NJ). In general, ∼1 × 10⁶ cells per 75-mm well were seeded, and transepithelial resistance (EVOM, World Precision Instruments) was monitored daily. Once transepithelial resistance reached 0.7–0.8 kΩ, indicating that the cells were confluent and differentiated, the vasopressin V2 receptor-selective agonist 1-desamino-8-d-arginine-vasopressin (dDAVP, 0.1 nM) or vehicle was added to the basolateral medium for 3 days to stimulate expression of AQP2 and other vasopressin-responsive proteins. Apical and basolateral media were changed daily. On the day before harvest, the cells were put into minimal medium (deprived of serum, hormones, and growth factors except transferrin and selenium) without dDAVP on apical and the basolateral aspects of the cells. On the day of cell harvest, the basolateral medium was replaced by fresh minimal medium with dDAVP or vehicle for 30 min, and cells were collected for DC as described below.
The original mpkCCD line was derived by microdissection of cortical collecting ducts from a male SV-PK/Tag transgenic mouse (3). We recloned these cells to obtain a subclone (clone 11) that expresses AQP2 at a high level and displays regulation of trafficking and AQP2 abundance by vasopressin (25). The global proteomic analysis reported in this study confirms that these are indeed AQP2-expressing mouse cells.
Stable isotopic labeling by amino acids in cell culture.
The mpkCCD cells were cultured in Dulbecco's modified Eagle's medium-F12 medium modified with light or heavy amino acids, according to the stable isotopic labeling by amino acids in cell culture (SILAC) approach. All chemicals and media for SILAC experiments were purchased from Thermo Scientific (SILAC protein quantitation kit, catalog no. 88215, Life Technologies) with 2% dialyzed fetal bovine serum (catalog no. 26400, Life Technologies) plus light or heavy lysine and arginine, respectively. Light amino acids were [12C6]lysine (50 mg/500 ml; catalog no. 89987) and [12C614N4]arginine (50 mg/500 ml; catalog no. 89989). Heavy amino acids were [13C6]lysine (50 mg/500 ml; catalog no. 89988) and [13C615N4]arginine (50 mg/500 ml, catalog no. 89990). Cells were grown in light or heavy medium for 28 days (>5 passages). Previous studies had established in these cells that 12 days is sufficient for >99% isotope labeling for almost all proteins (13). Peptides labeled with heavy amino acids obtain an extra mass of 6.02 Da for lysine or 10.01 Da for arginine, which allows the sample of origin to be distinguished by the mass spectrometer and relative abundances to be assigned to vasopressin-treated (heavy isotopes) vs. vehicle-treated (light isotopes) cells on the basis of MS1 peak intensity.
DC and sample preparation.
At 30 min, cells grown in light (vehicle-treated) and heavy (dDAVP-treated) media were collected by scraping into sucrose solution (250 mM sucrose and 10 mM triethanolamine, pH 7.6) with Halt protease and phosphatase inhibitor cocktail (catalog no. 78440, Thermo Scientific). The scraped cells were combined in a 1:1 ratio and homogenized with 30 slow strokes on ice using a motor-driven Potter-Elvehjem homogenizer (catalog no. 358003, Wheaton). The homogenates were subjected to a series of centrifugations (catalog no. 5417R, Eppendorf): 1,000 g for 10 min at 4°C, 4,000 g for 20 min at 4°C, and 17,000 g for 20 min at 4°C, with the pellet saved each time and the supernatant passed to the next step. The 17,000-g supernatant was centrifuged in an ultracentrifuge (model L8-70M, Beckman) at 200,000 g for 1 h at 4°C, and both the supernatant and the pellet were retained. The pellets obtained from the 1,000-, 4,000-, 17,000-, and 200,000-g centrifugations were solubilized in 1× Laemmli buffer (2% SDS, 63 mM Tris, and 10% glycerol, pH 6.8) and labeled “1K,” “4K,” “17K,” and “200Kp,” respectively. The remaining supernatant from the 200,000-g centrifugation was labeled “200Ks” and solubilized using the components of Laemmli buffer to achieve the same final concentrations in the pellet fractions. The protein concentrations were measured by bicinchoninic acid (BCA) assay according to the manufacturer's instructions (catalog no. 23225, Thermo Scientific).
Preparation for mass spectrometry: SDS-PAGE and in-gel trypsin digestion.
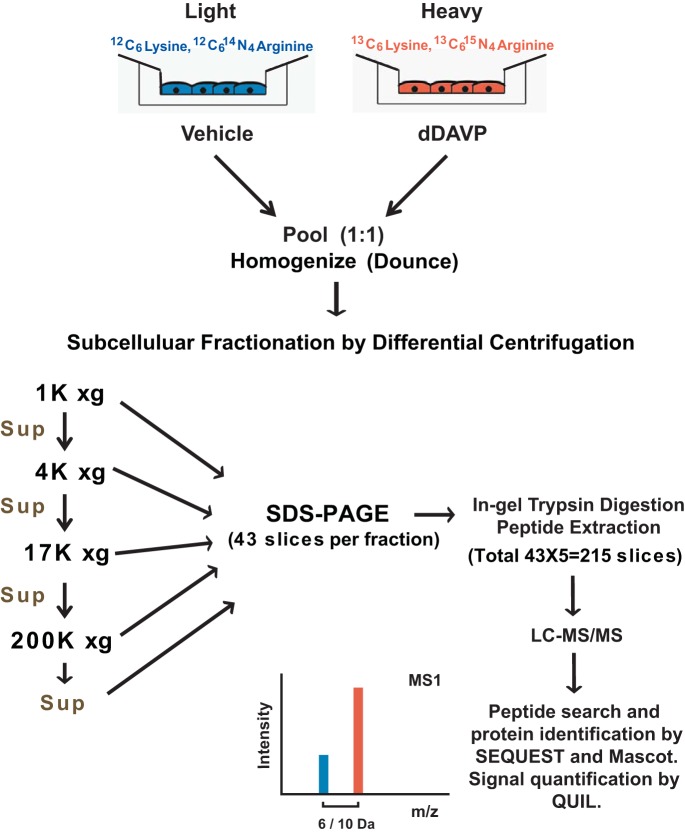
After DC and solubilization, proteins were reduced with 20 mM dithiothreitol (catalog no. 20291, Thermo Scientific) for 1 h at 56°C, and then reduced cysteines were alkylated using 100 mM iodoacetamide (catalog no. 90034, Thermo Scientific) for 1 h at room temperature in darkness. SDS-PAGE was performed (Any kD Criterion TGX precast gel, catalog no. 567-1123, Bio-Rad) according to the manufacturer's instructions. Precision Plus protein standards (Kaleidoscope, catalog no. 161-0375, Bio-Rad) were used for the marker lane. Proteins in the gel were visualized with Imperial protein stain (catalog no. 24615, Thermo Scientific) for 5 min and then destained in deionized H2O for 1 h. Thereafter, a GridCutter (catalog no. MEE2-7-25) was used to slice the gel into small, equal-sized blocks (2 mm × 7 mm × 25 bands) for a total of 43 blocks per lane. The corresponding gel slice numbers of all protein standards were recorded and fitted with a power curve to infer molecular weight from gel slice number. Gel pieces from each block were further destained and dehydrated by incubation and vortexing with 25 mM NH4HCO3 in 50% acetonitrile (ACN) solution three times for 30 min each and then vacuum-dried. The dried gel pieces were immersed in 40 μl of a solution containing 25 mM NH4HCO3 and 12.5 ng/μl trypsin (Trypsin Gold, catalog no. V5280, Promega) and then incubated at 37°C overnight. The tryptic peptides were extracted from the gel pieces by vortexing three times in 100 μl of 50% ACN-0.5% formic acid for 30 min each. The pooled extracts were vacuum-dried and then reconstituted to 20 μl with 0.1% formic acid. The resulting mixture of tryptic peptides was desalted with C18 ZipTip (catalog no. ZTC18S096, Millipore) according to the manufacturer's instructions, vacuum-dried, and stored at −80°C. Immediately prior to mass spectrometry analysis, the samples were reconstituted to 20 μl with 0.1% formic acid in LC/MS-grade water. A total of 215 gel slices (43 slices × 5 DC fractions) were analyzed by LC-MS/MS (Fig. 1).
Fig. 1.
Multilevel fractionation approach used to enable “deep” proteomic profiling of mouse mpkCCD cells. Differential centrifugation was used to prepare 5 fractions from homogenized renal mpkCCD cells: 1,000-, 4,000-, 17,000-, and 200,000-g pellets and a 200,000-g supernatant. Each fraction was further separated by SDS-PAGE, and each lane was divided into 43 slices, each of which was subjected to in-gel trypsinization and liquid chromatography-tandem mass spectrometry (LC-MS/MS) analysis. dDAVP, 1-desamino-8-d-arginine-vasopressin; Sup, supernatant; m/z, mass-to-charge ratio.
LC-MS/MS.
Tryptic peptides were analyzed on an Eksigent nanoLC system connected to an Orbitrap Elite mass spectrometer (Thermo Scientific) equipped with a nano-electrospray ion source. Peptides were loaded onto a peptide trap cartridge (Agilent Technologies) at a flow rate of 6 μl/min. The trapped peptides were fractionated with a reverse-phase PicoFrit column (New Objective, Woburn, MA) using a linear gradient of 5–35% ACN in 0.1% formic acid. The gradient time was 45 min at a flow rate of 0.25 μl/min. Precursor mass spectra (MS1) were acquired in the orbitrap at 60,000 resolution, and product mass spectra (MS2) were acquired with the ion trap.
Matching spectra to peptides.
Proteome Discoverer 1.4 software (Thermo Scientific) was used to conduct the peptide-spectra-match search. To maximize the number of peptide identifications, two different search algorithms, Mascot (17) and SEQUEST (7), were used. The search criteria were as follows: 25-ppm precursor mass tolerance, 0.8-Da fragment mass tolerance, and two missed tryptic cleavages allowed per peptide. In addition, certain amino acid modifications, including isotope labeling of lysine (K+6.020 Da) and arginine (R+10.008 Da), carbamidomethylation of cysteine (C+57.021 Da), oxidation of methionine (M+15.995 Da), and deamination on glutamine and asparagine (N, Q+0.984 Da), were allowed. The protein data base was the mouse RefSeq [release 57, January 14, 2013, 29,701 entries, National Center for Biotechnology Information, National Institutes of Health, amended with Common Repository of Adventitious Proteins (http://www.thegpm.org/crap/)]. The false discovery rate was 0.01 and was set using the target-decoy algorithm (6). The results from SEQUEST and Mascot searches were merged in Proteome Discoverer, and peptides with false discovery rate <0.01 and peptide rank = 1 were retained for further analyses. Raw files, search results, and all spectra have been uploaded to PRIDE (http://www.ebi.ac.uk/pride/archive/; accession no. PXD002434). Because of the comprehensive nature of this study, the data include both multipeptide identifications and proteins identified and quantified on the basis of a single peptide. To stringently vet these peptides, three different criteria were applied: target-decoy analysis (see above), quality filtering based on reconstructed chromatograms (see Quantification), and manual inspection of fragmentation spectra to ensure that the major peaks match expected mass-to-charge ratio values.
Quantification.
Quantification of peptides was performed using QUIL, an in-house software program for SILAC data (22). This program calculates light-to-heavy peptide abundance ratios from the reconstructed ion chromatograms for MS1 peak intensities corresponding to each peptide. The abundance for the identified light and heavy versions of the same peptide can be separately measured on the basis of the area under the curve (AUC) via numerical integration using the trapezoidal rule or on the basis of the maximum MS1 peak height over the duration of the reconstructed chromatogram.
To filter the data based on quality, we compared the SILAC light-to-heavy ratios (R) obtained using different integration methods and integration time intervals (see example in Supplemental Fig. S1 in Supplemental Material for this article, available online at the Journal website). Briefly, R was evaluated with three QUIL parameter settings: 1) AUC method and 0.2-min integration interval (Rarea/0.2), 2) AUC method and 0.3-min integration interval (Rarea/0.3), and 3) MS1 peak height method and 0.3-min integration interval (Rheight/0.2).
For high-quality reconstructed chromatograms, we expect the same value to be obtained with all three methods for calculation of R. Therefore, using these calculated values, we employed the following acceptance criteria for a given peptide: 0.5 ≤ Rheight/0.2/Rarea/0.2 ≤ 1.5 and 0.5 ≤ Rarea/0.3/Rarea/0.2 ≤ 1.5.
Peptides that satisfied both of these criteria were retained for further analyses using the Rarea/0.2 values. In addition, we retained the corresponding values for the AUC for both heavy and light channels. The AUC values for all peptides mapping to a given protein were summed to obtain the total.
Because the accuracy of combining two samples (i.e., dDAVP vs. vehicle) may not be perfect and may not yield a precise 1:1 ratio, it was necessary to renormalize the values. We compared the median values and the sum of the integrated abundance values for all peptides in heavy and light channels and found that both yielded the same heavy-to-light ratio (overall ratio = 1.120). The median values were then used to normalize all AUC values and to calculate revised heavy-to-light ratios.
Calculation of relative protein abundances in each fraction.
Because different amounts of total protein were obtained for the various DC fractions and because the entire sample was not loaded on the gel, it was necessary to correct the protein abundances reported to take into account the whole sample. Practically, that means that the normalized AUC value for each protein in a given DC fraction was multiplied by the total protein amount (measured in that fraction by BCA assay) and divided by the amount of protein loaded on the gel. The total protein amounts for the five fractions were as follows: 1,000 μg for 1K, 200 μg for 4K, 100 μg for 17K, 300 μg for 200Kp, and 1,500 μg for 200Ks. The amounts of protein loaded were as follows: 110 μg for 1K, 110 μg for 4K, 100 μg for 17K, 110 μg for 200Kp, and 58.5 μg for 200Ks.
Mass spectrometry data visualization by virtual Western blotting.
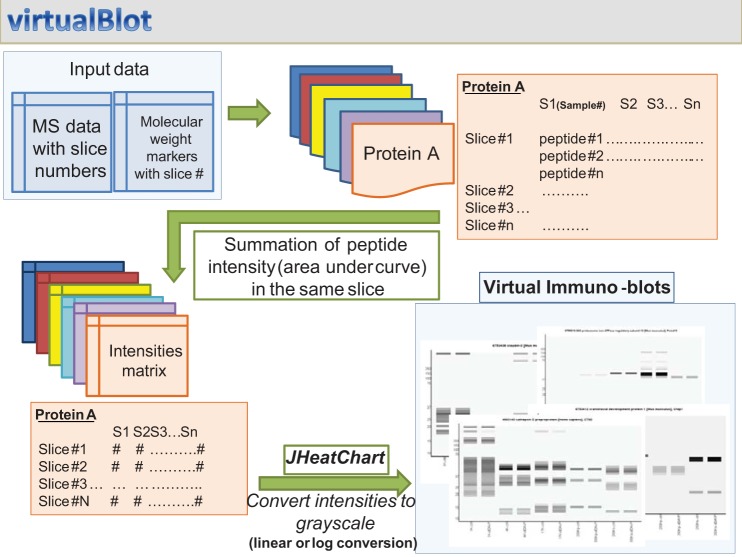
We wrote a Java-based stand-alone command line program, virtualBlot, to generate virtual Western blots from mass spectrometry data (Fig. 2). This program sums intensities of all peptides that map to a particular protein from each gel slice. The summed intensities from each gel slice and its corresponding location on the gel are used to generate an intensity matrix for this protein. In this study, a 43 × 10 (slices × lanes) matrix was generated for each identified protein. We show 10 lanes, rather than the original 5, on the gel, because each original lane contains both light and heavy labels. JHeatChart (http://www.tc33.org/projects/jheatchart), a Java application program interface, was used to generate an eight-bit gray-scale image from the intensity matrix. To set the image background so that it is distinguishable from the image canvas, the image background and all zero values were reset to 5% of the lowest nonzero band intensity for a particular protein. Two scaling functions (linear and logarithmic) were chosen to convert raw input values to gray scale. The gel slice numbers for molecular weight standards were used to indicate their positions on the images. For the virtual Western blots, the input values were set to simulate an “equal-loading” condition for all lanes, i.e., 100 μg per lane.
Fig. 2.
A computer program, virtualBlot, was devised for visualization of quantitative mass spectrometry data. A summary of the step-by-step algorithm used to construct jpeg images representing mass spectrometry data in the form of Western blots is shown. Flow is indicated by green arrows. See methods for details.
Immunoblot analysis.
Immunoblotting was performed as previously described (13). Images were developed and quantified using a near-infrared fluorescence scanner (Odyssey, LI-COR). Protein concentrations were measured using BCA protein assay (catalog no. 23225, Thermo Scientific). Equal protein loading was confirmed using parallel Coomassie blue-stained SDS-polyacrylamide gels. A commercial antibody to A-Raf (catalog no. 4432, Cell Signaling Technology) was used with a goat anti-rabbit secondary antibody (IRDye 680RD, catalog no. 926-8071, LI-COR).
Bioinformatics.
Gene Ontology (GO) terms were extracted using in-house software, the Automated Bioinformatics Extractor (ABE; http://helixweb.nih.gov/ESBL/ABE/). We recoded ABE (using Java) for special searches described in results. Statistical significance of enrichment of descriptors was assessed using Fisher's exact test. Protein abundance histograms were generated in R 3.1 (R Graphics Package, http://cran.r-project.org/web/packages/RGraphics/index.html.) Venn diagrams were generated using Genomics Suite (Partek, St. Louis, MO).
Determination of apparent vs. calculated molecular weights of all proteins.
The calculated molecular weight for each protein was extracted from RefSeq protein records using a modification of ABE. The program was modified to identify and download the complement to the “/calculated_mol_wt=” field in individual RefSeq protein records. The apparent molecular weight for each protein was identified using the maximum gray-scale value from the virtualBlot input to identify a slice number from the original gel. This slice number was mapped to a molecular weight on the basis of the virtual Western blot molecular weight calibration data (see MS data visualization by virtual Western blotting).
Determination of isoelectric point and Kyte-Doolittle hydropathy for all identified proteins.
The isoelectric point (pI) values were obtained for each protein using the ExPASy utility “Compute pI/Mw” (http://web.expasy.org/compute_pi/). Kyte-Doolittle hydropathy was calculated using a specially written Java program employing amino acid sequences for each protein downloaded from the National Center for Biotechnology Information using ABE. The calculation used the parameters from the original study of Kyte and Doolittle (14).
Web page construction.
Public web pages are presented as .html files. They were initially formatted in Microsoft Excel, saved as .html files, and then edited using NotePad++ (https://notepad-plus-plus.org/). The web pages are hosted by HelixWeb (Helix Biowulf System, Division of Computer System Services, Center for Information Technology, National Institutes of Health, Bethesda, MD).
The main web page is at https://helixweb.nih.gov/ESBL/Database/mpkFractions/. The relative abundance levels for each protein in each fraction are shown in heat-map format. The response to dDAVP is represented by log2(dDAVP/ctrl) values for each fraction, shown in heat-map format. The virtual Western blots are accessible via the web page by “mousing-over” or clicking on the individual GenInfo (GI) identifier numbers.
RESULTS
General results.
Previous studies have shown that the combination of multilevel fractionation techniques and state-of-the art LC-MS/MS instrumentation allows nearly complete proteomic profiling, in which the number of proteins identified approaches the number of detectable transcripts using expression microarrays or RNA-sequencing techniques (2). In our own prior studies, we found that isolation of nuclear fractions alone led to a near doubling of the number of high-confidence identifications that could be made in renal mpkCCD cells (21). Here, we have used a widely employed DC protocol to prepare five fractions from homogenized mpkCCD cells: the 1,000-g pellet (1K), the 4,000-g pellet (4K), the 17,000-g pellet (17K), the 200,000-g pellet (200Kp), and the 200,000-g supernatant (200Ks). Each fraction was further separated by SDS-PAGE, and each lane was divided into 43 slices, each of which was subjected to in-gel trypsinization and LC-MS/MS analysis (Fig. 1). Analysis of the resulting 215 samples generated 34.6 gigabytes of spectral data. In all, proteins mapping to 8,608 distinct GI numbers were identified, corresponding to 6,766 unique gene symbols. The largest number of proteins was identified in the 17K fraction (Fig. 3A). In comparison, 7,919 transcripts were identified above the noise level in the mpkCCD cells by Affymetrix microarray profiling (25). At the level of official gene symbols, 4,304 of 6,766 proteins identified in this study (64%) could be mapped to previously identified mpkCCD transcripts (Fig. 3B; see Supplemental Table S1). Of the remaining 2,462 proteins, 49% (1,209) were identified in prior proteomic studies of mouse mpkCCD cells (4, 13, 19–21). Thus the present study added the protein products of 1,253 genes to the known mpkCCD cell proteome (see Supplemental Table S1). This list of newly identified mpkCCD proteins includes 624 proteins identified by the presence of multiple peptides and 629 proteins identified by a single peptide. The single-peptide identifications were subjected to stringent quality criteria, including manual inspection of the spectra (see methods). Analysis of GO terms enriched in the 1,253 newly identified proteins compared with the full list is shown in Table 1. Consistent with the use of DC to fractionate the cells into different membrane components, it is not surprising that the top two terms on this list are “intrinsic to membrane” and “integral to membrane.”
Fig. 3.
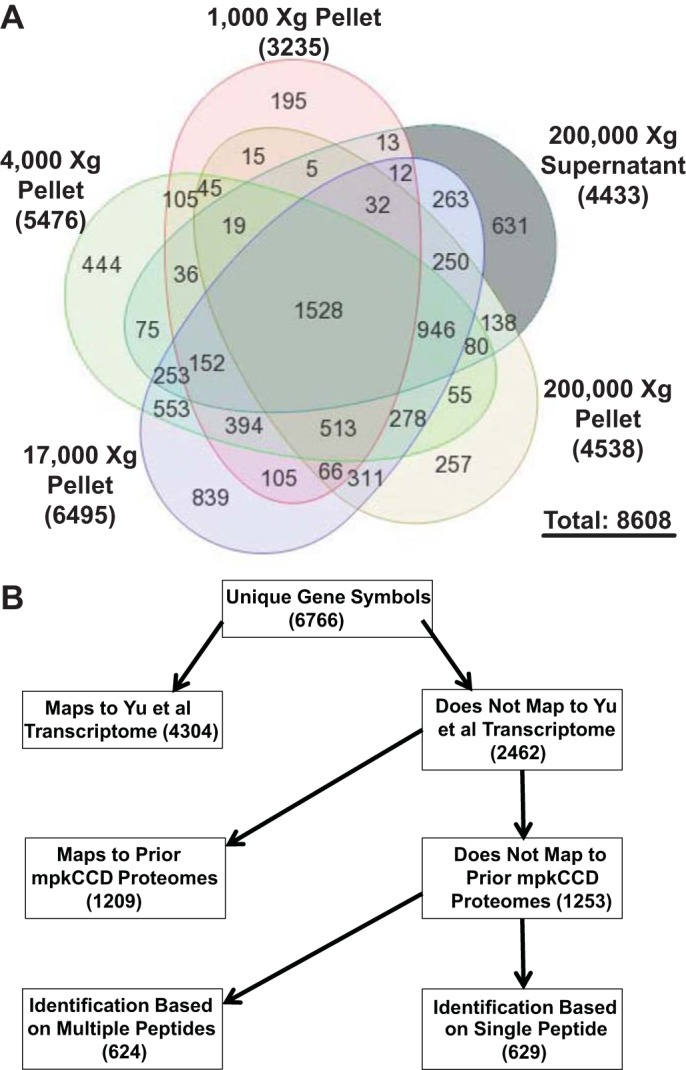
Large numbers of proteins were identified in each differential-centrifugation fraction. A: Venn diagram showing number of proteins [GenInfo (GI) numbers] identified in each fraction. B: proteins mapping to 6,766 unique official gene symbols were identified. Chart shows a breakdown of identified proteins with regard to previous identification at a transcript level (25) or in prior proteomic studies (4, 13, 19–21). In this study, 1,253 proteins, including many integral membrane proteins, were newly identified.
Table 1.
Enriched Gene Ontology Cellular Component terms in the set of newly identified proteins
| Term | % of Total | Fold Enrichment | FDR, % | P Value (Fisher's exact test) |
|---|---|---|---|---|
| Intrinsic to membrane | 20.2 | 1.4 | 0.000 | 8.6 × 10⁻⁸ |
| Integral to membrane | 19 | 1.4 | 0.001 | 4.8 × 10⁻⁷ |
| Ribosome | 4.1 | 2.1 | 0.120 | 4.0 × 10⁻⁵ |
| Nucleosome | 1.5 | 3.5 | 0.460 | 7.6 × 10⁻⁵ |
| Heterotrimeric G protein complex | 1 | 4.4 | 1.600 | 1.9 × 10⁻⁴ |
| Plasma membrane part | 9.3 | 1.4 | 1.700 | 8.8 × 10⁻⁴ |
| Integral to plasma membrane | 2.2 | 2.1 | 8.200 | 2.7 × 10⁻³ |
| Secretory granule | 1.2 | 2.8 | 13.000 | 3.0 × 10⁻³ |
| Extrinsic to plasma membrane | 1 | 3 | 17.000 | 3.7 × 10⁻³ |
The online analysis tool DAVID (Database for Annotation, Visualization, and Integrated Discovery version 6.7) was used to compare the set of newly identified proteins with the set of all proteins found.
Online data base of mpkCCD proteins.
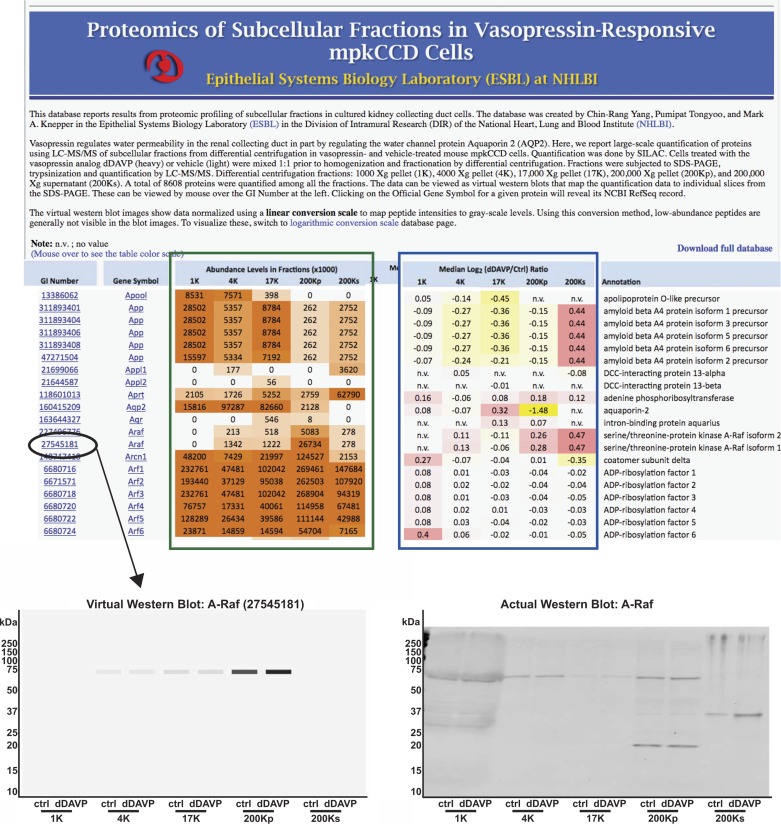
To provide a resource for future studies, we have created a publically accessible web page listing all identified proteins, along with their relative abundances among the individual fractions (https://helixweb.nih.gov/ESBL/Database/mpkFractions). The full data set can be downloaded from the web page at the “Download full database” link. A “screen-shot” image of this web page is shown in Fig. 4. The relative protein abundances among the fractions are shown in a heat-map format (green box). This quantification was done by integration under the reconstructed chromatogram curves of the SILAC light-labeled form of each peptide (control condition, lacking vasopressin). The effects of vasopressin on the amounts of each protein in each fraction are also shown in a heat-map format (blue box). This relative quantification was done using the SILAC heavy-labeled (vasopressin-treated) and light-labeled (vehicle-treated) forms of each peptide. In the accompanying article (24), we have mapped common subcellular marker proteins to each of the fractions.
Fig. 4.
A publically available web page was created to provide users with a comprehensive listing of proteins expressed in mpkCCD cells with virtual Western blots for each protein. Top: general appearance of the web page accessible at https://helixweb.nih.gov/ESBL/Database/mpkFractions/. Green box: relative abundances in each fraction in heat-map format; blue box: changes with dDAVP in each fraction from stable isotopic labeling by amino acids in cell culture (SILAC) quantification in heat-map format (increase, red; decrease, yellow; no change, white). To display a virtual Western blot, mapping mass spectrometry-identified peptides back to the original SDS-polyacylamide gel position, the user can mouse-over or click on a particular GI number (illustrated for A-Raf at bottom left). Virtual Western blot is shown for all fractions, with vehicle (“ctrl”) vs. vasopressin (“dDAVP”) treatment. Virtual Western blot for A-Raf can be compared with an actual Western blot (bottom right).
Online virtual Western blots for all identified proteins.
On the web page, the user can reveal a “virtual Western blot” for each protein by mousing-over or clicking on the GI number (Fig. 4, ellipse). An example of a virtual Western blot of the serine/threonine kinase A-Raf is illustrated in Fig. 4, bottom left. The virtual Western blot is a mapping of all quantified peptides from a given protein to the gel fractions in which they were detected, using all 43 fractions from each gel lane. (We have made the software virtualBlot, used to generate these images, available for download at https://helixweb.nih.gov/ESBL/virtualBlot/.) Two mappings of aggregate signal intensities to gray-scale values were used: linear mapping (Fig. 4, bottom left) and logarithmic mapping (not shown). The logarithmic mapping allows display of proteins over several orders of magnitude of abundance. The linear-scaling option can be elected to show only the most abundant forms of a given protein, more nearly resembling a true Western blot. Figure 4, bottom right, shows an actual Western blot of A-Raf carried out with independent samples. An A-Raf band was identified at the same molecular mass (∼67 kDa) as in the virtual Western blot in the same fractions. Note that the actual Western blot displays additional bands of molecular mass 20 kDa in the 200Kp fraction and molecular mass 36 kDa in the 200Ks fraction. These were presumably nonspecific bands, since they were not identified by mass spectrometry. Also, the actual Western blot showed smearing in the 1,000-g lanes because of the presence of DNA.
Distribution of protein abundances.
Figure 5 describes the distribution of relative protein abundances for all proteins, determined by label-free quantification from mpkCCD cells not treated with vasopressin (SILAC, light label). These values represent the base 10 logarithm of the sum of individual AUC values for reconstructed chromatograms over all fractions, normalized by the calculated molecular weight. Overall, proteins were detected and quantified over approximately eight orders of magnitude of relative abundance. To relate this abundance distribution to the physiology of the collecting duct cell, the relative abundances of several physiologically important proteins in the collecting duct are shown in Fig. 5. The data are useful in assessing the ease with which a given protein would be detectable by antibody-based techniques (Western blotting or immunocytochemistry). Many of the proteins labeled in Fig. 5 have been reported to be detectable in mpkCCD cells with antibodies, including β-actin (Actb) (18), Na-K-ATPase (Atp1a1) (10), AQP2 (Aqp2) (10), NF-κB p50 (Nfkb1) (9), purineric receptor P2X5 (P2rx5) (23), the proapoptotic protein Bcl2-associated agonist of cell death (Bad) (19), and the transcriptional coregulator Yes-associated protein 1 (Yap1) (19). The relative abundances of all proteins are reported as a web page (https://helixweb.nih.gov/ESBL/Database/mpkCCD_Protein_Abundances/) and as Supplemental Table S2, providing a resource to help investigators customize the experimental approaches needed to study specific proteins in mpkCCD cells. For example, the relative abundance data may be useful with regard to how much protein should be loaded to run Western blots or whether enrichment steps may be needed to detect a given protein.
Fig. 5.
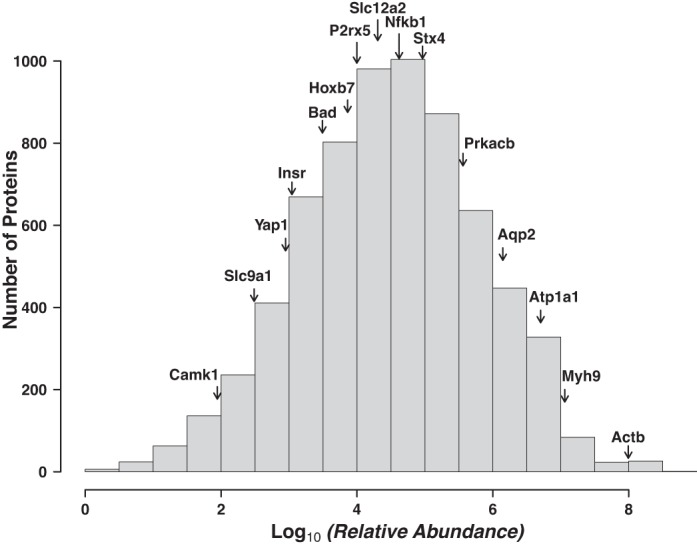
Proteins were detected over ∼7 orders of magnitude of relative abundance. Histogram displays distribution of proteins as a function of relative abundance. Values in the histogram are those from the web page of abundances rescaled to set the lowest log10(relative abundance) value to 0. Some physiologically important proteins are displayed to provide a frame of reference (see text for details): Ca2+/calmodulin-dependent protein kinase type 1 (Camk1), Na+/H+ exchanger 1 (Slc9a1), Yes-associated protein (Yap1), insulin receptor (Insr), bcl2 antagonist of cell death (Bad), homeobox protein Hox-B7 (Hoxb7), purinergic receptor P2X5 (P2rx5), solute carrier family 12 member 2 [Na+-K+-2Cl− cotransporter 1 (NKCC1), Slc12a2], nuclear factor NF-κB p105 subunit (Nfkb1), syntaxin-4 (Stx4), cAMP-dependent protein kinase catalytic subunit-β (Prkacb), aquaporin-2 (Aqp2), Na-K-transporting ATPase subunit-α1 (Atp1a1), nonmuscle myosin II-A (Myh9), and β-actin (Actb).
Distributions of apparent-to-calculated molecular weight ratios.
Because each DC fraction was resolved by SDS-PAGE and 43 consecutive gel slices were analyzed by protein mass spectrometry, the derived data set contains information about the apparent molecular weights of all proteins identified. Such data can be examined individually for each protein by viewing the virtual Western blots (https://helixweb.nih.gov/ESBL/Database/mpkFractions/). Here, we analyze apparent molecular weights in the entire population of proteins identified. Figure 6 shows the distribution of ratios of apparent molecular weights to the calculated molecular weights (ρ) obtained from the “/calculated_mol_wt=” field in individual RefSeq protein records. The distribution for the 200Ks, 200Kp, 17K, and 4K fractions appears to be trimodal. The dominant mode falls very close to ρ = 1.0 (black vertical line). The low-molecular-weight mode falls at ρ < 0.65 (red vertical line). (A list of proteins with ρ < 0.65 in the 17K fraction is shown in Supplemental Table S3.) The high-molecular-weight mode falls between 1.45 and 2.0 (blue vertical lines). (A list of proteins with 1.45 < ρ < 2.00 in the 17K fraction is shown in Supplemental Table S3.) The distribution for the 1K fraction shows a predominant mode that is shifted to the right (see below). Overall, ∼15% of proteins had ρ < 0.65 or ρ > 1.45 among all fractions. A web page listing the ρ values for each protein in each fraction is provided at https://helixweb.nih.gov/ESBL/Database/MWRatios. A previous study, based on a less comprehensive proteomic profiling approach in a human lymphoblastoid cell line, reported that ∼20% of proteins identified in SDS-polyacrylamide slices ran at other than the calculated molecular weight (1). Thus proteins with aberrant mobilities on SDS-PAGE are not rare. In the following, we analyze the apparent molecular weight data further to identify explanations for ρ < 0.65 and ρ > 1.45.
Fig. 6.
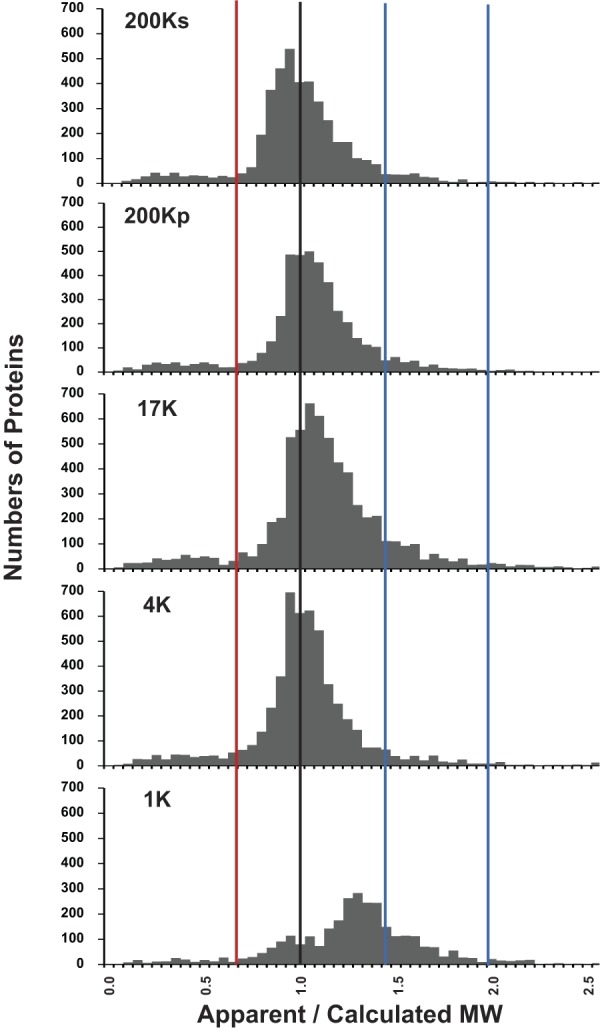
Ratios of apparent to calculated molecular weights (ρ) of proteins vary over a wide range, and distribution appears to be trimodal. Histograms for 4 differential-centrifugation fractions (200Ks, 200Kp, 17K, and 4K) show similar patterns, and distributions appear to be trimodal. The 3 modes provide 3 populations for further analysis: 1) proteins below ρ = 0.65 (left of red line), 2) proteins with ρ = 0.65–1.45, and 3) proteins with ρ = 1.45–2.00 (between blue lines). Distribution for the 1K fraction was markedly different from distribution for the other 4 fractions, showing a predominant mode at ρ ∼ 1.3. MW, molecular weight.
Relationship between ρ and Kyte-Doolittle hydropathy.
Because the presence of strongly hydrophobic regions in proteins may be predicted to affect their mobility on SDS-PAGE, we examined the relationship between the aggregate hydropathy of proteins (calculated using the Kyte-Doolittle algorithm) and ρ. The prediction is that more hydrophobic proteins, by binding more SDS, will, on average, show greater mobility than relatively hydrophilic proteins. This prediction appears to be borne out by Fig. 7, which shows the mean Kyte-Doolittle hydropathy values calculated for three groups of proteins (segregated by ρ in each DC fraction). (Lowest values correspond with most-hydrophilic proteins.) All fractions show the same general pattern, with the highest group of ρ values corresponding to the most-hydrophilic proteins.
Fig. 7.
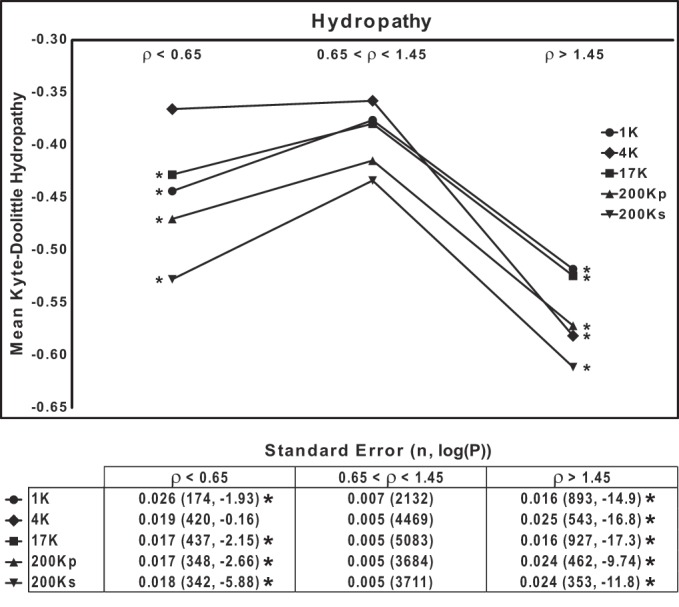
Mobilities of proteins on SDS-PAGE are in part dependent on hydrophobicity. Mean Kyte-Doolittle hydropathy index is plotted for 3 groups of proteins segregated on the basis of ρ range for each of 5 differential-centrifugation fractions. *P < 0.025, low-ρ or high-ρ group vs. intermediate group (ρ = 0.65–1.45), by ANOVA with Bonferroni's contrasts. Bottom: standard errors, total number of proteins, and P values.
Relationship between ρ and pI.
Since the net charge of a protein may be predicted to affect its mobility on SDS-PAGE, we examined the relationship between the calculated pI of proteins and ρ. The prediction is that proteins with low pI should, on average, show greater mobility than proteins with high pI. Figure 8 shows the mean pI calculated for three groups of proteins (segregated by ρ) in each DC fraction. In the 1K, 4K, 17K, and 200Kp fractions, the results are consistent with the prediction above. In contrast, in the 200Ks fraction, containing mainly globular, cytosolic proteins, the relationship between pI and ρ was reversed. We suggest that factors other than pI and hydropathy, such as protein shape, are relatively important in determining the mobility of globular, cytosolic proteins.
Fig. 8.
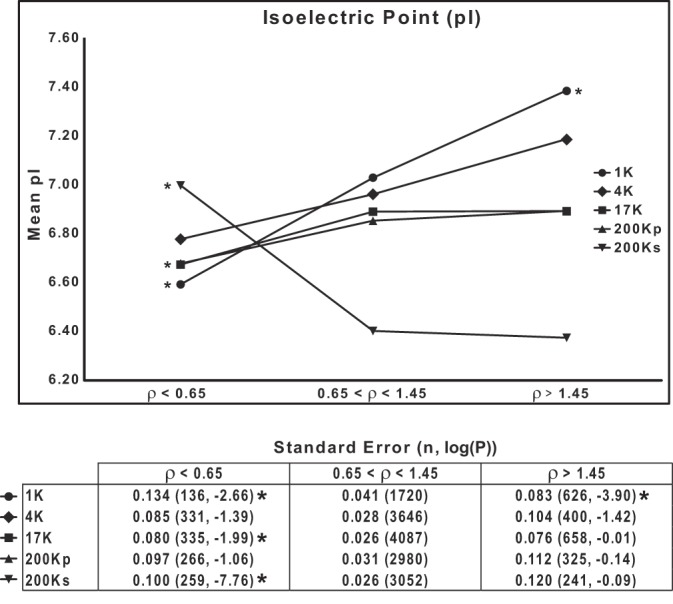
Mobilities of proteins on SDS-PAGE are in part dependent on protein isoelectric point (pI). pI, calculated for the whole protein, is plotted for 3 groups of proteins segregated on the basis of ρ range for each of 5 differential-centrifugation fractions. *P < 0.025, low-ρ or high-ρ group vs. intermediate group (ρ = 0.65–1.45), by ANOVA with Bonferroni's contrasts. Bottom: standard errors, total number of proteins, and P values.
Physiological cleavage of proteins.
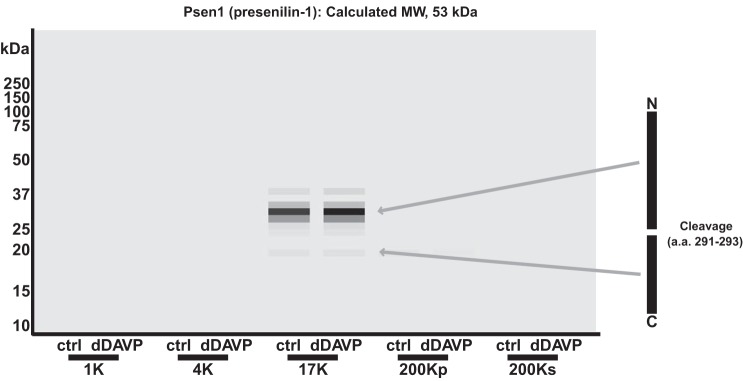
One possible explanation for ρ < 0.65 is physiological cleavage of proteins. In fact, inspection of the list of these proteins in the 17K fraction revealed several known to be cleaved physiologically, such as presenilin-1 (Psen1), sonic hedgehog (Shh), syndecan-1 (Sdc1), and mucin-1 (Muc1). The virtual Western blot for presenilin-1, a polytopic membrane protein, is shown in Fig. 9. The calculated molecular mass is 53 kDa. However, recognizable bands in the 17K fraction were centered at ∼32 and 19 kDa. The 32-kDa band mapped to peptides only from the NH2 terminus of presensilin-1, while the 19-kDa band mapped to peptides only from the COOH terminus. These fragments are consistent with the known cleavage sites at amino acids 291–293 (Swiss-Prot: P49769).
Fig. 9.
In mpkCCD cells, presenilin (Psen1) is cleaved into 2 fragments of 32 and 19 kDa, residing in the 17-kDa fraction. In the virtual Western blot, Psen1, a 53-kDa protein, appears as 2 bands of 32 and 19 kDa. NH2- and COOH-terminal fragments identified on the basis of mapping mass spectrometry-identified peptides are indicated with arrows. A cleavage site, between amino acids 291 and 293 (UniProt no. P49769), is shown at right.
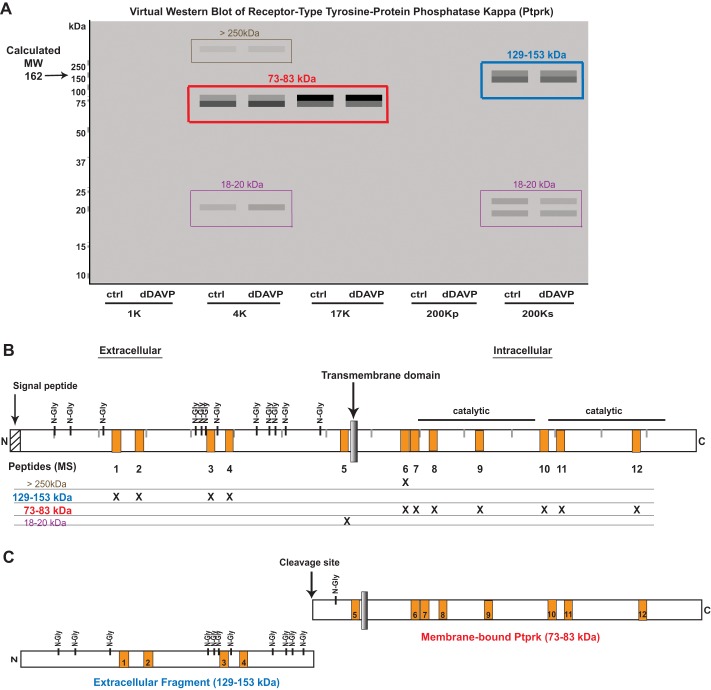
We searched RefSeq protein records for the string ‘/site_type=“cleavage”’ to identify proteins with annotated physiological cleavage sites. Analysis of the 17K fraction showed that these sites were 3.4 times more frequent (14 of 323) in proteins with ρ < 0.65 than in the full 17K data set of proteins (65 of 5,120; P < 0.001, by Fisher's exact test). In the other fractions, there was similar enrichment of proteins that are annotated as ‘/site_type=“cleavage.”’ It is likely that many proteins that are cleaved physiologically are not so annotated in RefSeq. Thus we speculate that many additional proteins with ρ < 0.65 may undergo physiological proteolytic cleavage. One example of such a protein is receptor-type tyrosine-protein phosphatase-κ (Ptprk) with ρ = 0.51 in the 17K fraction. Mapping of the peptides that were identified by mass spectrometry for this protein appears to indicate that this protein is cleaved (Fig. 10). In the virtual Western blot (Fig. 10A), the major bands fall below the calculated molecular mass (162 kDa). Figure 10B shows the mapped locations of the 12 peptides that we identified by mass spectrometry. In the 4K and 17K fractions, a band is seen at 73–83 kDa, made up of peptides 6–12 that map to the COOH terminus of the protein (red box and labels, Fig. 10). In the 200Ks fraction, a band is seen at 129–153 kDa, made up of peptides 1–4, which map to the NH2 terminus of the protein (blue box and labels, Fig. 10). An additional peptide (peptide 5) maps to the region around the single membrane-spanning region corresponding to 18–20 kDa on the virtual Western blot (purple boxes and labels, Fig. 10). A faint band is also seen at >250 kDa, which may be the full-length protein, considering the extra mass due to N-linked glycosylation (olive box and labels, Fig. 10). This implies that, in mpkCCD cells, this protein exists as two fragments that presumably are generated as a result of a cleavage event (Fig. 10C). The molecular weight of the NH2-terminal fragment is higher than predicted, presumably due to glycosylation. The COOH-terminal fragment is found in the 4K and 17K fractions (containing membrane-bound structures), because it contains a membrane-spanning region (Fig. 10C). A search of the literature showed that cleavage of the extracellular portion of the protein has indeed been seen when the protein was overexpressed in COS cells (11), although this finding has not been annotated on the RefSeq data base.
Fig. 10.
In mpkCCD cells, receptor-type tyrosine-protein phosphatase-κ (Ptprk) is cleaved into 2 fragments. A: virtual Western blot of Ptprk. Colored boxes indicate distinct bands that contain MS-identified peptides. B: map of Ptprk protein showing locations of mass spectrometry-identified peptides as orange boxes (1–12). MW regions in the gel in which these peptides were found are indicated by “X.” C: deduced cleavage products of Ptprk and the cleavage site identified by Jiang et al. (11). N-Gly, N-glycosylated.
Lysosomal and proteasomal processing.
Another possible explanation for ρ < 0.65 is that some proteins may undergo partial proteolysis as part of the lysosome or the proteasome. Inspection of the list of proteins with ρ < 0.65 in all fractions revealed several lysosomal proteins, including cathepsins A, C, and D (Ctsa, Ctsc, and Ctsd), mannosidase 2 (Man2b2), hexosaminidase B (Hexb), and galactosylceramidase (Galc). In contrast, there is only one proteasomal protein (Psmd8) with ρ < 0.65. We searched all genes for the GO Cellular Component term “lysosome.” Analysis of all fractions revealed that the term lysosome was significantly more frequent in proteins with ρ < 0.65 (34 of 581) than in the entire data set of proteins (153 of 6,766; P < 0.00001, by Fisher's exact test). A similar analysis for the term “proteasome” did not find such a relationship.
Proteolytic fragments may be seen in proteins with short half-lives, because, at any given time point, a greater fraction of a short half-life protein is in the process of being degraded in the lysosome or proteasome than a long half-life protein. Figure 11 addresses the following question: “Is the half-life of proteins with ρ < 0.65 shorter than that of proteins with ρ > 0.65?” We downloaded comprehensive protein half-life data for mpkCCD cells (20) and mapped values to the two ρ groups. As shown in Fig. 11, among all fractions, protein half-life was consistently lower in proteins with ρ < 0.65 than proteins with ρ > 0.65 (P < 0.001).
Fig. 11.
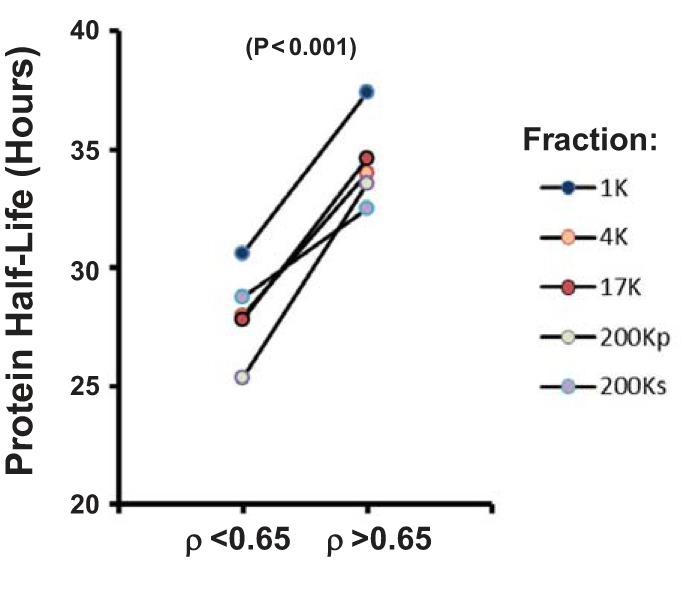
In mpkCCD cells, proteins that have low ρ values have relatively low protein half-lives. P value was calculated from paired t-test of mean half-life values over the 5 differential-centrifugation fractions.
A low-molecular-weight form of AQP2.
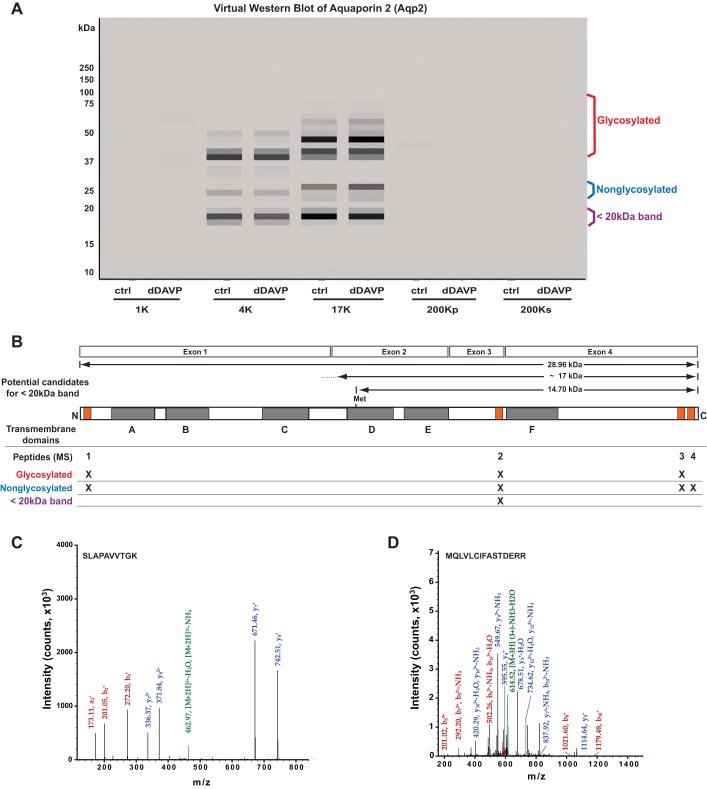
One of the proteins with ρ < 0.65 is the vasopressin-regulated water channel AQP2. A virtual Western blot of AQP2 is shown in Fig. 12A. AQP2 peptides were mapped to three broad bands. The upper two bands were previously identified as the glycosylated form (red) and the nonglycosylated form (blue). In addition to these two well-recognized bands, there is a broad band below 20 kDa. Several AQP2 antibodies have identified a band in this region, and there has been uncertainty whether this is due to the presence of an AQP2 isoform or the spurious recognition of some other protein (12). The unequivocal identification of the AQP2 peptide SLAPAVVTGK in this region of the gel supports the former possibility. Figure 12B shows the mapping of the four AQP2 peptides initially identified in this study to the AQP2 primary structure. The transmembrane regions are shown in gray and labeled A–F. The mapped peptides are highlighted in orange. The second peptide (SLAPAVVTGK) maps to the third extracellular loop coded by exon 3. This peptide was identified numerous times. One of the spectra of this peptide is shown in Fig. 12C. What are possible explanations for a <20-kDa protein that contains this peptide and is recognized by antibodies targeting the COOH-terminal tail? The two most likely explanations are 1) a selective cleavage of the protein somewhere in the second extracellular loop (between membrane-spanning domains C and D) or 2) the presence of a short isoform coded by exons 2, 3, and 4 but lacking exon 1. The first possibility would yield a ∼17-kDa protein. The second possibility could be the result of an occult promotor in intron 1 or alternative splicing. The predicted protein, based on the location of the first in-frame AUG sequence (initiator methionine) in exon 2, would be 14.7 kDa. To address these possibilities, we conducted a directed search of the original data for AQP2 peptides corresponding to the possible cleavage sites in the second extracellular loop or corresponding to the first peptide that would be produced through use of the indicated AUG translational start site (M139 of RefSeq record NP_033829). This directed search identified a low-intensity spectrum that maps to an AQP2 peptide starting with M139 (MQLVLCIFASTDERR) in the 17K fraction and in gel slice 32 corresponding to a molecular mass of 18.5 kDa, tentatively supporting the latter mechanism (Fig. 12D). This peptide was not found in any other slice or any other fraction. However, the two mechanisms are not mutually exclusive, and the former mechanism is not ruled out.
Fig. 12.
In mpkCCD cells, AQP2 (Aqp2) peptides map to 3 broad bands. A: in a virtual Western blot of AQP2, peptides map to bands known to be associated with the nonglycosylated and glycosylated forms (labeled in blue and red, respectively). An additional band was identified at <20 kDa (purple label). B: AQP2 structure showing transmembrane domains (shaded, A–F) and the corresponding 4 exons that code for the full-length protein. Orange boxes indicate the map of 4 mass spectrometry-identified peptides to the Aqp2 protein. MW regions in the gel in which these peptides were found are indicated by “X.” C: one of the spectra for peptide 2 (SLAPAVVTGK). Green, precursor peak; blue, y-series peaks; red, b-series peaks. D: one of the spectra corresponding to a new peptide (MQLVLCIFASTDERR), identified multiple times by targeted search of original mass spectrometry data. Green, precursor peak; blue, y-series peaks; red, b-series peaks. This peptide corresponds to the NH2-terminal peptide in hypothetical AQP2 protein coded by exons 2, 3, and 4. It was found only in the gel slice corresponding to 18.5 kDa.
N-linked glycosylation as an explanation for high values of ρ.
A likely explanation for proteins with ρ > 1.45 (Fig. 6) is the presence of posttranslational modifications of these proteins. A common posttranslational modification is N-linked glycosylation, which occurs in most proteins that are produced in the rough endoplasmic reticulum and processed in the Golgi apparatus. These are mostly integral membrane proteins and secreted proteins. Analysis of all fractions revealed that proteins with the annotation ‘/note=“N-linked (GlcNAc . . .)”’ in the corresponding UniProt record were significantly more frequent (162 of 1,161) in proteins with 1.45 < ρ < 2.5 than in the entire data set of proteins (562 of 6,739; P < 10−6, by Fisher's exact test). It is possible that additional proteins with 1.45 < ρ < 2.5 are glycosylated but lack the appropriate annotation indicating this.
Ubiquitylation as an explanation for high values of ρ.
Another posttranslational modification that can potentially explain ρ > 1.45 is ubiquitylation. Most proteins are thought to undergo ubiquitylation as part of protein turnover processes; therefore, there is no consistent annotation of these proteins. Once ubiquitylated, however, proteins can be expected to have a short half-life and to be relatively difficult to detect. An examination of the virtual Western blot (Fig. 13) for the polyubiquitin proteins Ubb and Ubc shows a broad smear across all molecular weights for all fractions, consistent with the idea that a very large fraction of the ubiquitin in mpkCCD cells is conjugated to other proteins.
Fig. 13.
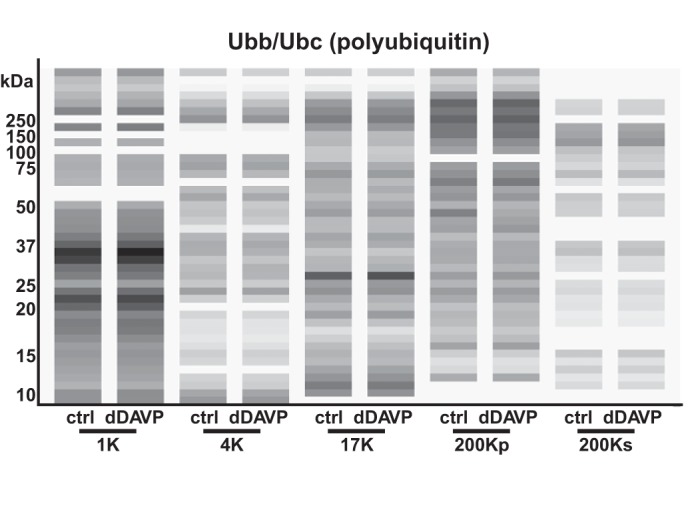
In mpkCCD cells, ubiquitin peptides are found over a broad range of molecular weights, consistent with widespread protein ubiquitylation. A virtual Western blot is shown for all fractions, with vehicle (“ctrl”) vs. vasopressin (“dDAVP”) treatment. Ubb and Ubc code for identical ubiquitin polypeptides. Logarithmic mapping of values to gray-scale levels was used.
RNA- and DNA-binding proteins with high values of ρ.
Many of the high-ρ proteins that are not annotated as N-glycosylated appear to be DNA- or RNA-binding proteins. Examination of the amino acid sequences of these proteins reveals that a large fraction has multiple “low-complexity” stretches that are rich in one or two specific amino acids. This includes sequences rich in basic amino acids (arginine and lysine), as expected for nucleic acid-binding proteins, but also regions rich in acidic amino acids or prolines. We speculate that the presence of both strongly basic and strongly acidic regions in this subgroup of proteins may result in SDS-resistant intra- or intermolecular interactions that retard protein mobility on SDS-PAGE.
DISCUSSION
The main goal of this work is to provide a set of data resources for the study of regulatory mechanisms in mouse mpkCCD cells, a model of the renal collecting duct. The data may be useful in understanding the function of other types of epithelial cells as well. The accompanying article (24) uses the quantitative data reported in the present study to address certain questions regarding the regulatory actions of vasopressin in the renal collecting duct. In this discussion, we address the utility of the data resources described in this study.
Using the mpkCCD proteome data base.
The proteomic analysis performed in this study provided what we believe is a nearly comprehensive listing of proteins expressed in cultured mouse mpkCCD cells. The depth of the analysis was a result of multistage fractionation of mpkCCD cells using DC of mpkCCD homogenates (stage 1) followed by SDS-PAGE stratification of each of the DC fractions (stage 2). Stage 3 of the fractionation was the standard HPLC element of the LC-MS/MS. This separation scheme, coupled with the use of state-of-the-art mass spectrometry, identified proteins corresponding to 6,766 distinct gene symbols. Most of the proteins identified in this study were seen in previous proteomics studies (4, 13, 19–21) or were previously seen at the transcript level (25). Nevertheless, the analysis identified 1,253 additional proteins not previously known to be expressed in mpkCCD cells. Many of these newly identified proteins were integral membrane proteins (Table 1), consistent with the use of DC to obtain membrane-enriched (4K and 17K) fractions. We make these data available as a publically accessible web page (https://helixweb.nih.gov/ESBL/Database/mpkFractions/) that can be interrogated to find a particular protein. Investigators contemplating a role for a particular protein in vasopressin signaling or regulation of AQP2 can use the data base to confirm its expression in mpkCCD cells and identify a priori whether it is enriched in any particular subcellular fraction. In addition, they can identify whether any homologs are expressed that could obscure results of experiments in which particular proteins are targeted for knockdown by RNA interference or knockout by genome editing strategies.
Using virtual Western blots of proteins expressed in mouse mpkCCD cells.
In previous studies involving proteomic analysis of slices from SDS-polyacrylamide gels, we pooled the data from all slices, thus losing the molecular weight information implicit in the data sets. We mapped the quantification of each peptide and the aggregate quantification for corresponding proteins to specific gel slices to create virtual Western blots. Molecular weight standards allowed assignment of molecular weights to each slice. The quantitative data were converted to gray-scale values, which create the appearance of a true Western blot when plotted slice-by-slice in a heat-map representation. This approach to visualization of protein mass spectrometry data from analysis of gel slices has been previously reported (5, 8). Here we introduce a software application for generating virtual Western blots, written in Java, to allow users to generate their own set of virtual Western blots. Users can access the virtual Western blots for all the proteins detected in this study on the main web page (Fig. 4) by mousing-over or clicking on individual GI identifiers. We anticipate that these virtual Western blots will be of value to investigators in the evaluation of newly produced or newly obtained antibodies. As illustrated in Fig. 4 with regard to the protein A-Raf, antibodies frequently label bands that deviate from the calculated or predicted molecular weight; a comparison with the corresponding virtual Western blot will help the investigator recognize whether these bands are spurious or overlap true modifications of the annotated protein. Indeed, for many proteins (Fig. 6), the dominant band on the virtual Western blot occurs at an apparent molecular weight substantially different from the molecular weight calculated from the residue masses of its component amino acids. In the present study we provide several examples of these proteins. In several cases illustrated here, mapping of individual peptides to alternative bands on the virtual Western blot provided explanations for higher- or lower-than-expected apparent molecular weights.
Using the data base of relative protein abundances in mpkCCD cells.
The comprehensive proteomic data derived in the present study allowed us to calculate relative abundances for all proteins (Fig. 5) and rank the proteins according to abundance. Calculated relative abundances varied over about eight orders of magnitude. Because we did not include standards in the present study, absolute abundances could not be estimated. The abundance ranking for all proteins is reported in a second data base (https://helixweb.nih.gov/ESBL/Database/mpkCCD_Protein_Abundances/). This data base is projected to be useful in predicting the ease with which a given protein will be detected using antibody-based methods. (Ease of detection is likely to be strongly related to abundance.) Successful detection of proteins expressed at relatively low levels may require enrichment steps (e.g., immunoprecipitation or subcellular fractionation).
Identification of a low-molecular-weight form of AQP2.
AQP2 is a molecular water channel that is the main target for the action of the peptide hormone vasopressin to regulate osmotic water transport in renal collecting duct cells (16). The virtual Western blot for AQP2 identified three distinct bands: 1) an AQP2 protein at an apparent molecular mass of ∼25 kDa, corresponding to the nonglycosylated form of the protein, 2) an AQP2 protein at 37–50 kDa, corresponding to the expected size for glycosylated AQP2, and 3) an AQP2 protein with an apparent molecular mass between 15 and 20 kDa. As reported by Jo et al. (12), multiple antibodies targeting the COOH terminus of AQP2 have detected a band in this region, but the identity of this low-molecular-weight protein as AQP2 has been in doubt. Our mass spectrometry results identify an AQP2 peptide (SLAPAVVTGK) based on multiple high-quality spectra from <20-kDa gel slices and appear to establish the presence of an AQP2 isoform in this molecular weight range (Fig. 12). The evidence available is consistent with two alternative explanations for this low-molecular-weight form of AQP2: 1) cleavage of the protein somewhere in the extracellular middle loop of the protein, yielding a 146- to and 163-amino acid protein, and/or 2) an alternative promotor located in the first intron of the AQP2 gene, which is predicted to produce a 133-amino acid protein, based on the location of the first methionine coded by exon 2. A targeted search identified an AQP2 peptide corresponding to the latter explanation. However, both mechanisms are plausible, and they are not mutually exclusive.
GRANTS
The study was carried out in NHLBI Intramural Program (Projects HL-006129 and HL-001285, M. A. Knepper). P. Tongyoo was supported by the Thailand Research Fund under the Royal Golden Jubilee Ph.D. Program and Chulalongkorn University (PHD/0200/2552). Authors are affiliated with the NHLBI Division of Intramural Research and receive funding support through the intramural budget (Projects HL-006129 “Computational Tools for Proteomics” and HL-001285 “Solute and Water Transport in Renal Epithelia”).
DISCLOSURES
No conflicts of interest, financial or otherwise, are declared by the authors.
AUTHOR CONTRIBUTIONS
C.-R.Y. and M.A.K. developed the concept and designed the research; C.-R.Y. performed the experiments; C.-R.Y., P.T., M.E., P.C.S., V.R., and M.A.K. analyzed the data; C.-R.Y., M.E., P.C.S., V.R., and M.A.K. interpreted the results of the experiments; C.-R.Y., P.T., M.E., V.R., and M.A.K. prepared the figures; C.-R.Y., M.E., V.R., and M.A.K. drafted the manuscript; C.-R.Y., P.T., M.E., P.C.S., V.R., and M.A.K. edited and revised the manuscript; C.-R.Y., P.T., M.E., P.C.S., V.R., and M.A.K. approved the final version of the manuscript.
Supplementary Material
ACKNOWLEDGMENTS
The authors thank the National Heart, Lung, and Blood Institute (NHLBI) Proteomics Core Facility and its personnel (Marjan Gucek and Guanhui Wang) for assistance with protein mass spectrometry. The authors are grateful to Dr. Jason D. Hoffert and Dr. Fahad Saeed for advice.
Footnotes
This article is the topic of an Editorial Focus by M. M. Rinschen (18a).
REFERENCES
- 1.Ahmad QR, Nguyen DH, Wingerd MA, Church GM, Steffen MA. Molecular weight assessment of proteins in total proteome profiles using 1D-PAGE and LC/MS/MS. Proteome Sci 3: 6, 2005. [DOI] [PMC free article] [PubMed] [Google Scholar]
- 2.Beck M, Claassen M, Aebersold R. Comprehensive proteomics. Curr Opin Biotechnol 22: 3–8, 2011. [DOI] [PubMed] [Google Scholar]
- 3.Bens M, Vallet V, Cluzeaud F, Pascual-Letallec L, Kahn A, Rafestin-Oblin ME, Rossier BC, Vandewalle A. Corticosteroid-dependent sodium transport in a novel immortalized mouse collecting duct principal cell line. J Am Soc Nephrol 10: 923–934, 1999. [DOI] [PubMed] [Google Scholar]
- 4.Bolger SJ, Hurtado PA, Hoffert JD, Saeed F, Pisitkun T, Knepper MA. Quantitative phosphoproteomics in nuclei of vasopressin-sensitive renal collecting duct cells. Am J Physiol Cell Physiol 303: C1006–C1020, 2012. [DOI] [PMC free article] [PubMed] [Google Scholar]
- 5.Claxton JS, Sandoval PC, Liu G, Chou CL, Hoffert JD, Knepper MA. Endogenous carbamylation of renal medullary proteins. PLos One 8: e82655, 2013. [DOI] [PMC free article] [PubMed] [Google Scholar]
- 6.Elias JE, Gygi SP. Target-decoy search strategy for increased confidence in large-scale protein identifications by mass spectrometry. Nat Methods 4: 207–214, 2007. [DOI] [PubMed] [Google Scholar]
- 7.Eng JK, McCormack AL, Yates JR 3rd. An approach to correlate tandem mass spectral data of peptides with amino acid sequences in a protein database. J Am Soc Mass Spectrom 5: 976–989, 1994. [DOI] [PubMed] [Google Scholar]
- 8.Gao BB, Stuart L, Feener EP. Label-free quantitative analysis of one-dimensional PAGE LC/MS/MS proteome: application on angiotensin II-stimulated smooth muscle cells secretome. Mol Cell Proteomics 7: 2399–2409, 2008. [DOI] [PMC free article] [PubMed] [Google Scholar]
- 9.Hasler U, Leroy V, Jeon US, Bouley R, Dimitrov M, Kim JA, Brown D, Kwon HM, Martin PY, Feraille E. NF-κB modulates aquaporin-2 transcription in renal collecting duct principal cells. J Biol Chem 283: 28095–28105, 2008. [DOI] [PMC free article] [PubMed] [Google Scholar]
- 10.Hasler U, Vinciguerra M, Vandewalle A, Martin PY, Feraille E. Dual effects of hypertonicity on aquaporin-2 expression in cultured renal collecting duct principal cells. J Am Soc Nephrol 16: 1571–1582, 2005. [DOI] [PubMed] [Google Scholar]
- 11.Jiang YP, Wang H, D'Eustachio P, Musacchio JM, Schlessinger J, Sap J. Cloning and characterization of R-PTP-κ, a new member of the receptor protein tyrosine phosphatase family with a proteolytically cleaved cellular adhesion molecule-like extracellular region. Mol Cell Biol 13: 2942–2951, 1993. [DOI] [PMC free article] [PubMed] [Google Scholar]
- 12.Jo I, Nielsen S, Harris HW. The 17 kDa band identified by multiple anti-aquaporin 2 antisera in rat kidney medulla is a histone. Biochim Biophys Acta 1324: 91–101, 1997. [DOI] [PubMed] [Google Scholar]
- 13.Khositseth S, Pisitkun T, Slentz DH, Wang G, Hoffert JD, Knepper MA, Yu MJ. Quantitative protein and mRNA profiling shows selective post-transcriptional control of protein expression by vasopressin in kidney cells. Mol Cell Proteomics 10: M110, 2011. [DOI] [PMC free article] [PubMed] [Google Scholar]
- 14.Kyte J, Doolittle RF. A simple method for displaying the hydropathic character of a protein. J Mol Biol 157: 105–132, 1982. [DOI] [PubMed] [Google Scholar]
- 15.Li Y, Shaw S, Kamsteeg EJ, Vandewalle A, Deen PM. Development of lithium-induced nephrogenic diabetes insipidus is dissociated from adenylyl cyclase activity. J Am Soc Nephrol 17: 1063–1072, 2006. [DOI] [PubMed] [Google Scholar]
- 16.Nielsen S, Frokiaer J, Marples D, Kwon TH, Agre P, Knepper MA. Aquaporins in the kidney: from molecules to medicine. Physiol Rev 82: 205–244, 2002. [DOI] [PubMed] [Google Scholar]
- 17.Perkins DN, Pappin DJ, Creasy DM, Cottrell JS. Probability-based protein identification by searching sequence databases using mass spectrometry data. Electrophoresis 20: 3551–3567, 1999. [DOI] [PubMed] [Google Scholar]
- 18.Rao R. Glycogen synthase kinase-3 regulation of urinary concentrating ability. Curr Opin Nephrol Hypertens 21: 541–546, 2012. [DOI] [PMC free article] [PubMed] [Google Scholar]
- 18a.Rinschen MM. Water transport running deep. Focus on “Deep proteomic profiling of vasopressin-sensitive collecting duct cells.” Am J Physiol Cell Physiol (September 30, 2015). doi: 10.1152/ajpcell.00280.2015. [DOI] [PubMed] [Google Scholar]
- 19.Rinschen MM, Yu MJ, Wang G, Boja ES, Hoffert JD, Pisitkun T, Knepper MA. Quantitative phosphoproteomic analysis reveals vasopressin V2-receptor-dependent signaling pathways in renal collecting duct cells. Proc Natl Acad Sci USA 107: 3887, 2010. [DOI] [PMC free article] [PubMed] [Google Scholar]
- 20.Sandoval PC, Slentz DH, Pisitkun T, Saeed F, Hoffert JD, Knepper MA. Proteome-wide measurement of protein half-lives and translation rates in vasopressin-sensitive collecting duct cells. J Am Soc Nephrol 24: 1793–1805, 2013. [DOI] [PMC free article] [PubMed] [Google Scholar]
- 21.Schenk LK, Bolger SJ, Luginbuhl K, Gonzales PA, Rinschen MM, Yu MJ, Hoffert JD, Pisitkun T, Knepper MA. Quantitative proteomics identifies vasopressin-responsive nuclear proteins in collecting duct cells. J Am Soc Nephrol 23: 1008–1018, 2012. [DOI] [PMC free article] [PubMed] [Google Scholar]
- 22.Wang G, Wu WW, Pisitkun T, Hoffert JD, Knepper MA, Shen RF. Automated quantification tool for high-throughput proteomics using stable isotope labeling and LC-MSn. Anal Chem 78: 5752–5761, 2006. [DOI] [PubMed] [Google Scholar]
- 23.Wildman SS, Boone M, Peppiatt-Wildman CM, Contreras-Sanz A, King BF, Shirley DG, Deen PM, Unwin RJ. Nucleotides downregulate aquaporin 2 via activation of apical P2 receptors. J Am Soc Nephrol 20: 1480–1490, 2009. [DOI] [PMC free article] [PubMed] [Google Scholar]
- 24.Yang CR, Raghuram V, Emamian M, Sandoval PC, Knepper MA. Deep proteomic profiling of vasopressin-sensitive collecting duct cells. II. Bioinformatic analysis of vasopressin signaling. Am J Physiol Cell Physiol (August 26, 2015). doi: 10.1152/ajpcell.00214.2015. [DOI] [PMC free article] [PubMed] [Google Scholar]
- 25.Yu MJ, Miller RL, Uawithya P, Rinschen MM, Khositseth S, Braucht DW, Chou CL, Pisitkun T, Nelson RD, Knepper MA. Systems-level analysis of cell-specific AQP2 gene expression in renal collecting duct. Proc Natl Acad Sci USA 106: 2441–2446, 2009. [DOI] [PMC free article] [PubMed] [Google Scholar]
Associated Data
This section collects any data citations, data availability statements, or supplementary materials included in this article.


