

Abstract
Horizontal gene transfer threatens the therapeutic success of antibiotics by facilitating the rapid dissemination of resistance alleles among bacterial species. The conjugative mobile element Tn916 provides an excellent context for examining the role of adaptive parasexuality as it carries the tetracycline-resistance allele tetM and has been identified in a wide range of pathogens. We have used a combination of experimental evolution and allelic frequency measurements to gain insights into the adaptive trajectories leading to tigecycline resistance in a hospital strain of Enterococcus faecalis and predict what mechanisms of resistance are most likely to appear in the clinical setting. Here, we show that antibiotic selection led to the near fixation of adaptive alleles that simultaneously altered TetM expression and produced remarkably increased levels of Tn916 horizontal gene transfer. In the absence of drug, approximately 1 in 120,000 of the nonadapted E. faecalis S613 cells had an excised copy of Tn916, whereas nearly 1 in 50 cells had an excised copy of Tn916 upon selection for resistance resulting in a more than 1,000-fold increase in conjugation rates. We also show that tigecycline, a translation inhibitor, selected for a mutation in the ribosomal S10 protein. Our results show the first example of mutations that concurrently confer resistance to an antibiotic and lead to constitutive conjugal-transfer of the resistance allele. Selection created a highly parasexual phenotype and high frequency of Tn916 jumping demonstrating how the use of antibiotics can lead directly to the proliferation of resistance in, and potentially among, pathogens.
Keywords: horizontal gene transfer, antibiotic resistance, experimental evolution, tigecycline, pathogen, Enterococcus faecalis
Introduction
The prevalence of multidrug-resistant pathogens has been on the rise and poses a serious threat to public health by causing at least two million infections and 23,000 deaths annually in the United States (CDC 2013). Parasexuality, or the ability of prokaryotes to exchange genetic material, has been known to contribute to the rapid dissemination of antibiotic resistance among pathogens (Barton and Charlesworth 1998; Levin and Cornejo 2009). Frequently, parasexual events are facilitated by conjugative elements, such as conjugative plasmids and conjugative transposons. The association of tetracycline-resistance determinants with conjugative elements has significantly reduced the efficacy and therapeutic usefulness of this class of antibiotics (Roberts 2005). Specifically, the conjugative Tn916 transposon and related Tn916-like elements frequently carry the gene encoding the ribosomal protection protein TetM and have been a major contributor to the spread of tetracycline resistance among pathogens including Enterococcus, Staphylococcus, Streptococcus, Clostridium, Bacillus, Escherichia, Neisseria, and Pseudomonas (Rice 1998; Roberts and Mullany 2009). Ribosomal protection proteins, such as TetM, dislodge tetracycline from the ribosome by occupying the binding site of EF-G on the ribosome (Connell et al. 2003). However, the third-generation tetracycline-derivative tigecycline (TGC) still maintains high efficacy against many pathogens due to its high affinity for the ribosome, which is approximately 100-fold greater than tetracycline, and because the most common tetracycline-resistance mechanisms, including TetM-mediated ribosomal protection, do not work efficiently against TGC (Bauer et al. 2004; Olson et al. 2006; Jenner et al. 2013).
One important pathogen for which TGC therapy remains effective is vancomycin-resistant enterococci (VRE). Although TGC currently maintains high efficacy against enterococci, nonsusceptible and resistant strains have already been identified in limited numbers (Werner et al. 2008; Freitas et al. 2011; Cordina et al. 2012). Because mutations impacting tetM are likely associated with Tn916, we reasoned that studying TGC resistance in VRE would provide a clinically relevant system to evaluate the role of parasexuality and other potential changes within the genome during adaptation to antibiotics. In previous studies, we used a combination of experimental evolution and allelic frequency measurements to identify mechanisms of resistance in a pathogen (Miller et al. 2013). Importantly, the predominating mutations identified from this approach matched those identified in the genome of a clinical strain that developed resistance in a patient during therapy (Arias et al. 2011; Miller et al. 2013). Therefore, we applied these methods to study TGC resistance in VRE. By identifying the mechanisms of TGC resistance while the antibiotic still has high therapeutic efficacy, we can provide insights that can be used to deter the rise and spread of resistance. For example, drugs that inhibit a specific mechanism of resistance could be developed in anticipation of its rise in the clinical population and used with current antibiotics to extend their effectiveness. As multidrug-resistant pathogens spread, a broader understanding for how antibiotic use shapes evolutionary trajectories would inform both utilization of antibiotics and open opportunities for the development of new therapies that would anticipate future resistance mechanisms and preempt them. A successful preemption strategy to limit the spread of multidrug resistance requires two fundamental insights: 1) How will a pathogen become resistant to a specific class of antibiotics? and 2) what are the target proteins or biochemical pathways for intervention? As a first step toward this greater ambition, we examined how a multidrug-resistant pathogen, VREs, will become resistant to an effective frontline antibiotic (TGC) and, to our surprise, identified not only a biochemical mechanism for resistance but also a unique evolutionary strategy that portends how resistance might spread rapidly across many clinically important species. Here, we show that mutations at two loci are essential for Enterococcus faecalis to adapt to growth in TGC: The upstream regulatory region of tetM and the gene that encodes the ribosomal S10 protein. Importantly, mutations leading to overexpression of tetM also resulted in a highly parasexual phenotype leading to enhanced transmissibility within enterococci and, most importantly, to other pathogens.
Results and Discussion
Adaptation of E. faecalis S613 to TGC Is Rapid and Consistent despite the Clinical Efficacy of TGC
Following our previous studies on clinically relevant mechanisms of antibiotic resistance (Arias et al. 2011; Miller et al. 2013), we used experimental evolution to study TGC resistance in E. faecalis strain S613, a vancomycin-resistant hospital strain. We performed two replicate adaptation experiments lasting for 24 or 19 days. Adaptation was facilitated using a unique bioreactor setup that maintains a continuous culture in exponential growth phase. Although experimental evolution in specialized bioreactors is challenging, they can provide advantages over using more traditional techniques, such as serial transfers or chemostats (supplementary text S1, Supplementary Material online). Unlike batch cultures, the bioreactor maintains a continuous culture at its fastest growth rate (turbidostat) so that more generations are achieved and a more consistent environment is maintained during adaptation. In addition, our bioreactors facilitate the formation of complex long-term biofilms that recapitulate some of the ecological structures associated with clinical infections such as catheter colonization (Guiton et al. 2010; Miller et al. 2013). Although biofilms are advantageous, they coat optical density probes and all surfaces leading to interference. Instead, to maintain the population at a constant cell density we monitored the metabolism of the population by measuring the outflow of %CO2 and conducted manual optical density measurements of samples collected from the population to confirm the culture was at the desired cell density. Although the technical challenges of this setup limit experimental replication, we performed two replicate runs. Additionally, by using large culture volumes and subinhibitory antibiotic concentrations, we were able to maintain genetically polymorphic populations allowing us to follow multiple adaptive trajectories within an individual population (Miller et al. 2013). Thus, by maintaining genetically diverse populations and by comparing the evolutionary outcomes between two replicate experiments, we are able to make robust predictions about what mechanisms might be observed in the clinical setting. During the experimental runs the TGC concentrations were increased in stepwise intervals and the populations were adapted from 0.05 μg/ml to a final concentration of 1 μg/ml TGC, which well surpassed the USA Food and Drug Administration (FDA) nonsusceptibility (0.25 μg/ml) and the European Committee on Antimicrobial Susceptibility Testing (EUCAST)-resistance cutoffs (0.5 μg/ml) (Brink et al. 2010).
To understand the evolutionary dynamics of the populations, we performed deep sequencing on samples of the entire population isolated daily over the course of the selection experiments and determined the allelic frequencies of all mutations that reached at least 5% frequency on one or more days of adaptation (supplementary table S1, Supplementary Material online, and fig. 1A). In addition to the daily metagenomic analysis at the population level, we also isolated single colonies from the end of both adaptation experiments (referred to as Bioreactor-adapted TGC resistant [BTR]) and assessed the underlying genetic diversity of the population using phenotypic screens (see Materials and Methods). Whole-genome sequencing was performed on 14 of these phenotypically distinct isolates to survey adaptive alleles within the population in more detail and to provide information on genomic linkages between different alleles. Overall, we identified 24 mutations from our metagenomic population and isolate sequencing (supplementary table S1, Supplementary Material online). However, only two candidate loci appeared to be tightly linked to resistance, based on their evolutionary dynamics and repeated evolution.
Deletion of Regulatory Elements Upstream of the Ribosomal Protection Protein TetM
An essential step in adaptation to TGC resistance under these selection conditions is the acquisition of a deletion in the 5’ untranslated region (5′-UTR) of tetM. Expression of tetM is regulated by a transcriptional attenuation mechanism involving a terminator stem-loop located 36-bp upstream of the tetM start codon (Su et al. 1992). In the presence of tetracycline, the terminator stem-loop, which prevents expression of tetM in the absence of tetracycline, is overcome by a poorly characterized mechanism that may involve ribosomal-mediated transcriptional attenuation (Su et al. 1992; Celli and Trieu-Cuot 1998). An 87-bp deletion located 51-bp upstream of the tetM start codon exceeded 90% frequency by the end of the first experimental run (fig. 1). Additionally, a 125-bp deletion located 36-bp upstream of the tetM start codon exceeded 94% frequency by the end of the second experimental run (fig. 1). Both the 87- and 125-bp deletions eliminate the terminator stem-loop sequence located in the 5′-UTR of tetM showing that deleting this region plays an important role in adapting to TGC (fig. 1B). Interestingly, McAleese et al. (2005) identified an 87-bp deletion located 54-bp upstream of the tetM start codon in a methicillin-resistant Staphylococcus aureus strain that was adapted to TGC. This demonstrates that eliminating the terminator stem-loop in the 5′-UTR of tetM plays a role in TGC resistance for species other than enterococci. We also identified deletions in the 5′-UTR of tetM that do not eliminate the terminator stem-loop. Although these deletions did not surpass 5% frequency during adaptation, they were identified in strains at the end of adaptation and included a 22- and 37-bp deletion located 231- and 98-bp upstream of the tetM start codon, respectively (fig. 1B and supplementary fig. S1 and table S2, Supplementary Material online). Thus, although the deletions observed in enterococci and S. aureus are of varying sizes and remove different portions of the tetM regulatory sequence, there is a consistent observation across species of deletions in the 5′-UTR of tetM among the successful evolutionary trajectories leading to TGC resistance.
Fig. 1.
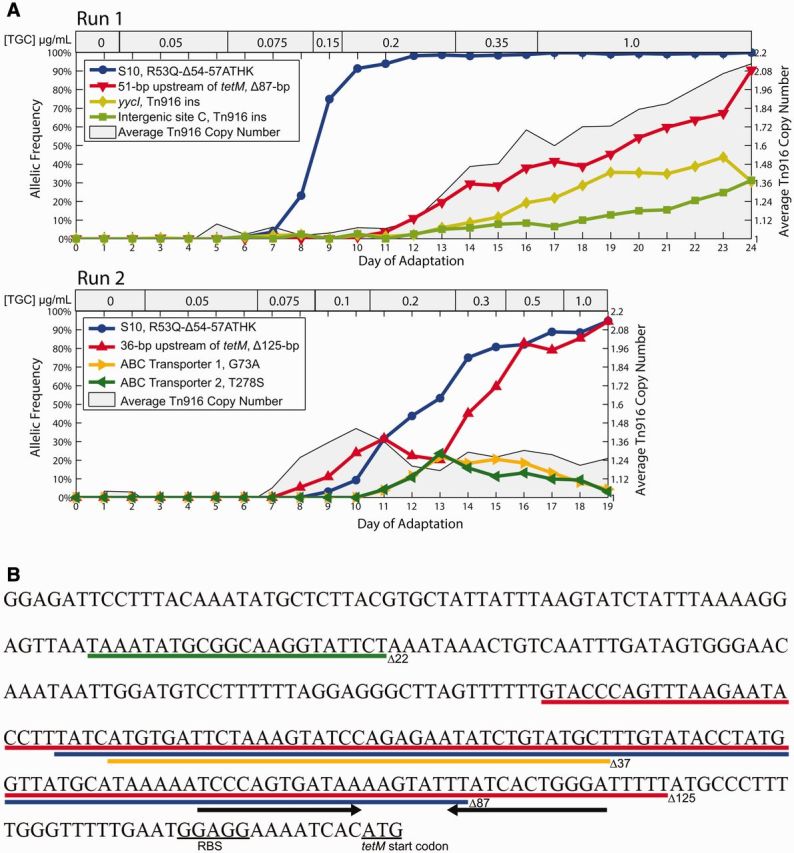
Experimental evolution of pathogenic Enterococcus faecalis to TGC shows that deletion of tetM regulatory elements and mutation of the ribosomal protein S10 provide the successful evolutionary trajectories to TGC resistance. (A) Deep sequencing was performed on samples of the polymorphic populations collected on each day of adaptation. These population metagenomic data were then used to determine daily allelic frequencies during each bioreactor experiment. This method detects alleles that reached at least 5% during adaption; however for clarity, only alleles that reached at least 20% were plotted. Mutations at two loci were successful in both experimental runs; deletions that eliminate a regulatory element in the 5′-UTR of tetM (red) and a 12-bp deletion in the ribosomal S10 protein (S10R53Q-Δ54-57ATHK) (blue). Additionally, during the first experimental run there were two specific insertions of Tn916 that exceeded 20% by the end of adaptation (of 44 insertions that exceeded 1%). The new insertions of Tn916 occurred within the yycI gene (light green) and an intergenic site (green). These two sites were not successful during the second run and thus may have hitchhiked with the 87-bp deletion in the 5′-UTR of tetM. The average Tn916 copy number of the population was determined by sequencing coverage. S613 has one chromosomal copy of Tn916, but after undergoing TGC selection the average cell within the population had 2.13 and 1.25 copies by the end of the first and second runs, respectively. (B) Diagram showing the sequence of the 5′-UTR of tetM and the deletions identified in this region during adaptation to TGC. Deletions are shown as colored lines and the terminator stem-loop is indicated with black arrows beneath the sequence. An 87-bp (blue) and 125-bp (red) deletions remove the terminator stem loop and were highly successful during adaptation, whereas a 37-bp (orange) and 22-bp (green) deletions leave the stem-loop intact and were only detected at low frequencies during adaptation but still conferred increased resistance presumably by removal of as yet uncharacterized regulatory sequences.
Constitutive Overexpression of TetM Leads to TGC Resistance
As the deletions upstream of tetM are located in a region involved in transcriptional regulation of tetM, we hypothesized that they caused an increase in tetM expression (figs. 1B and 2A). We used quantitative real-time polymerase chain reaction (qPCR) to measure the relative expression of tetM for BTR87b (an isolate that has the 87-bp deletion that exceeded 90% in the first experiment) and BTR22 (an isolate that has the much less common 22-bp deletion in the first experiment) compared with the ancestral S613 strain in both the absence and presence of TGC (supplementary table S2, Supplementary Material online). Both BTR87b and BTR22 strains had a greater than 10-fold increase in tetM expression in the presence of TGC regardless of which underlying deletion was present (fig. 2B). The two BTR strains also had a greater than 18-fold increase in tetM expression relative to S613 in the absence of antibiotic, showing that tetM overexpression is now constitutive in these strains (fig. 2B). These results demonstrate that deletions upstream of tetM, including the 22-bp deletion, which does not eliminate the terminator stem-loop, lead to a constitutive overexpression of tetM. The subsequent increase in TetM concentration in vivo likely allows the protein to outcompete the high binding affinity of TGC to the ribosome demonstrating that a simple change in tetM expression can lead to resistance in the future.
Fig. 2.

Deletions upstream of tetM increase tetM expression and Tn916 conjugation. (A) A diagram outlining the mechanism of Tn916 movement and conjugation. In S613, tetM expression is repressed in the absence of antibiotic by a transcription termination mechanism (indicated as the red hairpin) that is relieved when antibiotic is present. In the presence of antibiotic, leaky transcription through tetM leads to expression of the downstream excisionase (xis) and integrase (int) genes. Upon excision from the genome, Tn916 forms a circular intermediate that coordinates excision events with expression of the genes required for conjugation. (B) Using qPCR, we measured the expression of tetM in S613 and two end-point strains, BTR87b (87-bp deletion in the 5′-UTR of tetM) and BTR22 (22-bp deletion in the 5′-UTR of tetM). The relative expression of tetM in both BTR strains was increased by more than 10-fold over S613 in both the presence (red) and absence (blue) of TGC. (C) As transcriptional read-through of tetM is leaky, we also measured the relative expression of the downstream int gene. The expression of int in the absence of TGC was elevated for both BTR87b (3-fold) and BTR22 (1.5-fold) compared with S613. The expression of int was also elevated in the presence of TGC for BTR87b (11-fold) and BTR22 (1.6-fold). (D) Using qPCR and primers that amplify the new junction associated with excised and circularized Tn916. The number of cells with excised Tn916 increases from approximately 1 in 120,000 cells for S613 to about 1 in 150 cells for BTR22 and over 1 in 4 cells for BTR87b cultured with TGC. Error bars for all qPCR data show the 95% confidence interval between three biological replicates. (E) Conjugation assays were performed in triplicate using E. faecalis OG1RF as a recipient and S613, BTR87a, and BTR22 as donors. No conjugation was detected when S613 was used as a donor, whereas BTR87a and BTR22 produced conjugation frequencies of 1.5 × 10⁻³ and 7.0 × 10⁻⁵ transconjugants per donor cells, respectively.
Constitutive Overexpression of TetM Leads to Hyperconjugation of Tn916
Canonically, the mobilization and conjugal-transfer of Tn916 occurs infrequently, ranging from approximately 10−8 to approximately 10−5 transconjugants per donor cell, and is increased in the presence of tetracycline (Jaworski and Clewell 1994; Celli and Trieu-Cuot 1998). Leaky transcription of tetM allows read-through expression of the downstream excisionase (xis) and integrase (int) genes (Storrs et al. 1991; Celli and Trieu-Cuot 1998) (fig. 2A). When xis and int are expressed, Tn916 is excised from the chromosome at an increased frequency and forms a covalently closed circular intermediate (Roberts and Mullany 2009). Circularization of excised Tn916 allows for transcription initiated upstream of tetM to continue around the circularized element leading to expression of the Tn916 conjugation factors (fig. 2A). Expression of the conjugation elements then leads to increased conjugal-transfer of Tn916.
As BTR87b and BTR22 constitutively overexpress tetM (fig. 2B), we hypothesized that the expression of the downstream xis and int genes would also be elevated in these strains through leaky tetM expression. We used qPCR to show that the evolved BTR strains had increased int expression relative to S613 (fig. 2C). When grown without TGC, BTR87b and BTR22 had an approximately 3- and 1.5-fold increase in int expression compared with S613, respectively (fig. 2C). When cultured with TGC, the expression of int for BTR87b was elevated to an 11-fold increase over S613 (fig. 2C). In contrast, int expression in BTR22 was insensitive to TGC suggesting that the position of this more rare deletion event outside the well-conserved regulatory stem-loop structure may be mechanistically distinct from the much more common deletion of the regions containing the stem-loop (fig. 2C). Although their expression patterns varied, both BTR87b and BTR22 had elevated int expression over S613, which is consistent with increased transcriptional read-through of tetM.
As the expression of int is increased in the BTR strains, we reasoned that the excision rate of Tn916 was likely also increased. To determine whether Tn916 is excising at a higher rate in the BTR strains than in S613, we performed qPCR on total DNA using primers that amplified the new junction of circularized Tn916. In the absence of antibiotic, the number of cells with excised Tn916 was highly increased among the BTR strains when compared with S613 (fig. 2D). In the absence of drug, approximately 1 in 120,000 S613 cells had an excised copy of Tn916, whereas nearly 1 in 50 cells and 1 in 150 cells had an excised copy of Tn916 for BTR87b and BTR22, respectively (fig. 2D). These data show that Tn916 excised at an 800- to 2,400-fold higher frequency than S613 even in the absence of antibiotic. Interestingly, when S613 and BTR87b were cultured in the presence of TGC, the frequency of cells with an excised copy of Tn916 increased for both strains with approximately 1 in 16,000 cells for S613 to an astonishingly high 1 in 4 cells for BTR87b (fig. 2D). In contrast, the addition of TGC had no measureable impact on the excised Tn916 copy number of BTR22 (fig. 2D). This pattern is consistent with the expression of int in BTR22, where the addition of TGC did not further elevate expression (fig. 2C). Our data show that the excision of Tn916 is responsive to TGC in S613 and BTR87b, but not in BTR22. Despite the differences, both BTR strains had a highly elevated copy number for excised Tn916 when compared with S613 (fig. 2D). Additionally, the excised circular transposons were so frequent within the adapting populations that they could be detected readily in the media outflow of the bioreactors using PCR.
As the rate of Tn916 excision was elevated in the BTR strains, we hypothesized that the conjugation frequency of Tn916 might also be increased. To test this hypothesis, we conducted conjugation assays in the absence of antibiotic using the E. faecalis lab strain OG1RF as a recipient. Transconjugants were not recovered when S613 was the donor; however, conjugation occurred at high frequencies when BTR strains were used as donors, with a rate of 1.5 × 10⁻³ and 7.0 × 10⁻⁵ transconjugants per donor cell for BTR87a and BTR22, respectively (fig. 2E). Our data show that the mutations in the 5′-UTR of tetM result in a hyperconjugative phenotype leading to increased transfer of Tn916.
Increased Chromosomal Copy Number of Tn916 in Response to Antibiotic Selection
Many cells acquired additional copies of the Tn916 element that carries tetM. The increase in Tn916 copy number is consistent with the high conjugation frequencies of the BTR strains. Initially, S613 has a single copy of Tn916, but by the end of adaptation the average cell within the population had 2.13 and 1.25 copies of Tn916 as determined by sequencing coverage in the first and second experimental runs, respectively (fig. 1A). Although the population at the end of the first experimental run had an average of 2.1 copies of Tn916, one clonal isolate from the end-point population, BTR37, had seven copies of Tn916 and provides a striking example of the potential for expansion of the Tn916 copy number during selection (supplementary table S2, Supplementary Material online). Additionally, several clonal isolates from the end of both runs had two copies of Tn916 (BTR87a, BTR87b, and BTR125a) (supplementary table S2, Supplementary Material online). New Tn916 insertion sites appeared frequently in the population in the first and second runs, with 28 and 22 different distinct insertion sites, respectively (fig. 3 and supplementary table S3, Supplementary Material online). Although most of the new insertion sites did not reach a high frequency within the bioreactor populations, there were two insertions during the first experimental run that achieved a greater than 20% frequency: An insertion into the yycI gene and an intergenic site (referred to as intergenic site C) (fig. 1A and supplementary table S3, Supplementary Material online). Interestingly, the combined frequencies of the yycI and intergenic site C insertions are approximately equal to the frequency of the 87-bp deletion throughout adaptation (fig. 1A). This indicates that the two most frequent insertion sites could account for the majority of the cells with the 87-bp deletion during Run 1. Although the specific insertion sites could have polar effects that provide the cells with a fitness advantage, we did not detect an insertion into intergenic site C during Run 2, even at very low frequencies (1%). Also, although an insertion into yycI was detected during Run 2, it did not surpass 5% and dropped below the detectable range by end of the experiment. It is likely that acquisition of a second copy of Tn916 with the 87-bp deletion was more important than the specific location of the insertion. We observed that specific insertion sites did not achieve reproducible success across replicate populations, and the identification of 44 distinct sites is more consistent with a model in which acquiring additional copies of Tn916 is more advantageous than a specific insertion site.
Fig. 3.

New Tn916 insertions emerged frequently in response to TGC selection. Every new Tn916 insertion site that appeared during adaptation in both populations above 1% frequency was mapped to the closed E. faecalis V583 genome. Twenty-eight new insertion sites were identified from experimental Run 1 (green) and 22 (red) from experimental Run 2. Several insertion sites occurred in regions of S613 absent from V583, including three sites during Run 1 and two during Run 2 (supplementary table S3, Supplementary Material online). Blue shows the original position of Tn916, which remained at 100% during both adaptation experiments. Only five insertion sites occurred in identical locations between the two experimental runs for a total of 44 unique sites. The identification of many unique insertion sites is consistent with a model where the conjugal-transfer of Tn916 facilitated the rapid spread of TGC resistance among the adapting populations.
Hyperconjugation of Tn916 Contributed to a Rapid Spread of Resistance within Adapting Populations
As deletions leading to tetM overexpression also lead to Tn916 hyperconjugation, we wanted to know whether horizontal gene transfer contributed to the spread of resistance within the populations during adaptation. At the end of the first bioreactor experiment strains with different Tn916 insertions, but with the same 87-bp deletion in the 5′-UTR of tetM (BTR87a and BTR87b) could be isolated readily (supplementary table S2, Supplementary Material online). Likewise in the second bioreactor experiment strains with different Tn916 insertions, but with the same 125-bp deletion in the 5′-UTR of tetM (BTR125a and BTR125b) were also observed (supplementary table S2, Supplementary Material online). If the deletions were passed to the different strains through clonal inheritance, then the adaptive Tn916 allele would most likely be at the same insertion site. Alternatively, if the deletions were acquired through conjugation, then the unique Tn916 alleles would likely be in copies of Tn916 at different chromosomal sites. To determine the linkages between the deletions in the 5′-UTR of tetM and the specific Tn916 insertion site, we used a long range PCR kit (Qiagen) to amplify the approximately 8 kb of DNA that spans from upstream of tetM to the chromosome surrounding a particular insertion site (supplementary table S4, Supplementary Material online). We then used Sanger sequencing of the region upstream of tetM to determine whether a deletion was present at that specific site. We found that all clones with multiple insertion sites had the wildtype sequence present at the ancestral site and new and distinct sites of integration for the additional copies of Tn916 (supplementary table S2, Supplementary Material online). For three strains (BTR87a, BTR87b, and BTR125a), their secondary insertion sites were confirmed to carry their respective deletions. Thus, BTR87a and BTR87b from Run 1 carry the 87-bp deletion at different chromosomal locations: An insertion into yycI for BTR87a and an insertion into intergenic site J for BTR87b (supplementary table S2, Supplementary Material online). BTR125a and BTR125b from Run 2 carry the 125-bp deletion at different chromosomal locations: An insertion into a hypothetical O-antigen ligase for BTR125a and the copy of Tn916 at the ancestral site for BTR125b (supplementary table S2, Supplementary Material online). The observation that the same deletions occur in copies of Tn916 at divergent chromosomal locations between strains is consistent with the role of conjugation in contributing to the rapid spread of tetM overexpressing alleles during TGC selection.
It is also possible that different strains acquired the same deletions as de novo mutations to copies of Tn916 at different insertion sites, rather than through conjugal-transfer of a copy of Tn916 carrying the deletion. To determine whether conjugation or de novo mutations were more likely to have resulted in the observed genotypes, we measured the spontaneous mutation rate of S613 to daptomycin resistance (5.1 × 10⁻⁹ mutations per cell per generation) and found that it was almost 300,000-fold lower than the newly observed conjugation frequency for BTR87a (fig. 2E). Daptomycin resistance can be achieved by a single point mutation or by small insertions and deletions of three nucleotides (Arias et al. 2011; Miller et al. 2013). Larger deletions, such as the 87- and 125-bp deletions that eliminate the terminator stem-loop upstream of tetM, usually occur at a lower frequency than small deletions (Lee et al. 2012). Thus, the measured mutation rate likely overestimates the frequency at which deletions of the terminator stem-loop occur and suggests that these alleles most likely reached high frequencies by conjugation, rather than through multiple spontaneous and identical mutation events leading to deletions of the upstream regulatory regions. Furthermore, since replicate experiments consistently identified uniquely sized deletions (22, 37, 87, and 125 bp), the finding of identical deletions in copies of Tn916 at distinct chromosomal locations is more consistent with conjugal-transfer than the occurrence of de novo mutations (fig. 1B). Additionally, during the first experimental run the 87-bp deletion surpassed 90% frequency, whereas the 22-bp deletion never surpassed 1% frequency within the population (fig. 1A and supplementary table S1, Supplementary Material online). The conjugation frequency of BTR87a is 21-fold higher than BTR22, which likely facilitated the rapid spread of the 87-bp deletion over the 22-bp deletion (fig. 2E). Again, this is consistent with conjugation-mediated horizontal gene transfer. Therefore, conjugation contributing to the spread of alleles overexpressing tetM is the most parsimonious model consistent with the observed evolutionary trajectories.
Mutation of the S10 Protein May Remodel the Ribosome Rendering TGC Less Effective
Another important allele was a 12-bp deletion in the ribosomal S10 gene (rpsJ) that reached fixation or near fixation by the end of both adaptation experiments (fig. 1A). This deletion was out of frame, which resulted in the complete deletion of three codons (A54, T55, and H56) and the fusion of two codons (R53 and K57) to make a glutamine at position 53 (S10R53Q-Δ54-57ATHK) and thereby restore the reading frame necessary for production of this essential protein. The altered amino acids are located on an extended loop of S10 that interacts with the sequences of 16S rRNA that make up the TGC-binding pocket (fig. 4). We speculate that changes to S10 may simply decrease TGC affinity for the ribosome by subtle alterations of the RNA structure near to the binding site. Similar mutations have been identified in other species, which suggests that S10 may be a target of selection across species (Cattoir et al. 2014; Villa et al. 2014). This is further supported by our finding that TGC-resistant strains with only the S10 allele were isolated independently from the end of both experiments and had an intermediate minimal inhibitory concentration (MIC) of 0.5 μg/ml (supplementary table S2, Supplementary Material online).
Fig. 4.

Deletion in S10 may decrease the binding affinity of TGC by remodeling the ribosome. The position of the S10 mutations (S10R53Q-Δ54-57ATHK) within the context of the ribosome suggests that it may indirectly alter TGC binding. The costructure of the Thermus thermophiles 70S ribosome with TGC (yellow sticks) is shown (PDB 4G5T). For clarity, only S10 and the structures proximal to the TGC-binding pocket are shown. The mutated residues are located at the tip of a loop (residues 53–61) and are highlighted by red spheres at the carbon alpha position. The S10 loop does not directly contact TGC but instead interacts with several portions of the 16S rRNA (gray) that comprise the TGC-binding pocket (Jenner et al. 2013).
Fitness Cost of Deletions Upstream of tetM and Increased Tn916 Copy Number
TetM has significant homology with elongation factor EF-G and dislodges tetracycline from the ribosome by occupying the binding site of EF-G on the ribosome (Connell et al. 2003). While freeing the ribosome of antibiotic, TetM also stalls translation until TetM hydrolyzes GTP and dissociates from the ribosome, which might subsequently reduce the fitness of the cell by slowing the production of proteins. In the absence of antibiotics, production of tetM is thus likely to be disadvantageous. In addition, the hyperconjugative phenotype and increased Tn916 copy number that is associated with tetM overexpression could also impose an additional fitness cost to the cells. Therefore, we hypothesized that BTR strains with deletions in the 5′-UTR of tetM have a higher fitness cost in the absence of antibiotic than the S10R53Q-Δ54-57ATHK allele alone. This is consistent with our observation that the S10R53Q-Δ54-57ATHK allele reached fixation first in both experiments despite appearing after the 125-bp deletion in the second experiment (fig. 1A). To test this hypothesis, we performed competitive fitness assays between the BTR strains and the ancestral strain S613 in the absence of antibiotics (fig. 5). As shown in figure 5, the deregulation of tetM, increased Tn916 copy number, and highly parasexual Tn916 phenotype can impose a 14–44% fitness cost in the absence of antibiotic, whereas the fitness of the adaptive mutation to S10 alone was indistinguishable from S613 based on the 95% confidence interval. The low cost of the S10 mutation is consistent with its early appearance and evolutionary success in both trials. Like many costly resistance mechanisms, regulation of tetM provides the best fitness benefit to the cell by allowing selective expression of these costly gene products only in the presence of antibiotic challenge (Nguyen et al. 1989; Lenski et al. 1994). To become resistant to TGC, a much higher concentration of TetM is required and this leads to deregulation, which consequently also imposes an additional fitness cost to the cell in the absence of antibiotic selection. Thus like many multidrug-resistant pathogens, the TGC adapted strains are likely to be poorly adapted in the absence of antibiotic, but have success in environments of strong and continuing antibiotic selection such as hospital environments.
Fig. 5.

Fitness cost associated with TetM overexpression and increased Tn916 copy number. Competitive fitness assays were performed between BTR strains with a deletion in the 5′-UTR of tetM and the ancestral S613 strain in the absence of antibiotic. Error bars show the 95% confidence interval between at least four replicate assays. The fitness cost of the S10R53Q-Δ54-57ATHK allele alone (BTR0) is indistinguishable from zero, whereas a fitness cost of BTR strains with deletions upstream of tetM was readily detected and was as high as 44% in BTR87a.
Alleles in Hypothetical ATP-Binding Cassette Transporters May Contribute Minor Role to Resistance
During the second run two different nonsynonymous point mutations occurred in separate hypothetical ATP-binding cassette (ABC) transporters, referred to as ABC transporters 1 and 2, and surpassed 20% frequency on Day 13 of Run 2 (fig. 1A and supplementary table S1, Supplementary Material online). ABC transporter 1 has 29.9% sequence identity with the Gram-negative lipid A export protein MsbA. Interestingly, the msbA gene has been implicated in multidrug resistance and was mutated in an Acinetobacter baumannii strain that was adapted to TGC using serial transfers (King and Sharom 2012; Chen et al. 2014). ABC transporter 2 has 19.6% sequence identity with CcmA, a component of the cytochrome c assembly CcmAB (Cook and Poole 2000). CcmA has never been identified to play a role in drug resistance; however, related types of ABC transporters have been implicated in resistance (Cook and Poole 2000). While interesting alleles, the mutations in ABC transporters 1 and 2 began to decline at 0.3 μg/ml TGC (Day 14) and dropped to a low frequency by the end of adaptation, suggesting that these mutations are not successful at higher concentrations of TGC (fig. 1A). In addition, we did not isolate a clone from the end of adaption with a mutation in either ABC transporter 1 or 2, which is consistent with the low frequencies of these alleles on the last day of the second run (fig. 1A). We were able to isolate a clone that carries both ABC transporter mutations by randomly selecting colonies from Day 13 of the second run and using Sanger sequencing of the two transporter genes. It is interesting to note that as the frequencies of the two alleles rise and fall together in the population they may be linked (fig. 1A). This is supported by the identification of both alleles in the same clone and suggests that together they could have an epistatic advantage.
Conclusion
Using experimental evolution to adapt pathogenic E. faecalis to TGC resistance, we have identified mechanisms of resistance that are likely to occur in the clinic. We showed that the adaptive alleles arising in response to antibiotic selection occur in the 5′-UTR of tetM and result in increased expression of tetM. In addition, mutations impacting the regulation of tetM also resulted in an increase in the excision of Tn916 through leaky transcriptional read-through of tetM to the downstream xis and int genes. The high rate of excision leads to the constitutive conjugation of Tn916, which likely contributed to rapid spread of the resistance allele throughout the population during adaptation. This represents the first example of mutations that simultaneously confer resistance to an antibiotic and lead to constitutive conjugal-transfer of the resistance allele. In our bioreactors, the rampant parasexual population dynamics allowed for Tn916 to increase in copy number and jump into the genomes of the entire population (fig. 6). While an interesting observation, the constitutive conjugal-transfer of Tn916 is worrisome as it suggests that TGC resistance could spread rapidly among not just enterococci, but other pathogens as well. Tn916 and related Tn916-like elements have been identified in a wide-range of species and have been shown to undergo conjugal-transfer between different species (Hespell and Whitehead 1991; Haack et al. 1996; Boguslawska et al. 2009; Wasels et al. 2014). In addition, some Tn916-like elements carry alleles that confer resistance to nontetracycline antibiotics, including macrolides, lincosamide, streptogramin, and kanamycin, indicating that this hyperconjugation mechanism could potentially play a role in spreading resistance to other antibiotics (Haack et al. 1996). Furthermore, the Tn916 conjugation machinery can mobilize other elements, such as nonconjugal plasmids, which suggests that constitutive Tn916 conjugal-transfer could potentially facilitate the spread of resistance and pathogenicity markers located on elements outside of the transposon (Naglich and Andrews 1988). The emergence of a highly parasexual phenotype during TGC selection presents an example of how resistance alleles can disseminate rapidly among pathogens. These findings show how the rapid spread of resistance among enterococci, and likely other pathogens, can be achieved readily by the introduction of antibiotics into an environment.
Fig. 6.

TGC selection converts the population to a rampant parasexual phenotype. Fisher–Muller diagrams outlining models for the role of conjugation during adaptation to TGC resistance. These plots show the simplest adaptive trajectories consistent with the deep sequencing of the populations as a function of time and the genome sequencing of isolates from the end of adaptation. Dashed lines indicate the hypothesized conjugation incidences when a copy of Tn916 with a deletion was likely transferred to a genome carrying the S10R53Q-Δ54-57ATHK allele, thus creating successful genotypes.
Materials and Methods
Bioreactor-Facilitated Adaptation to Resistance
We used a bioreactor setup (turbidostat) to perform two independent replicate experiments where a population of E. faecalis strain S613 was adapted to grow in media supplemented with 1 μg/ml TGC following previously described protocols (Counago et al. 2006; Miller et al. 2013) with a few modifications. The selected ancestor E. faecalis S613 was a vancomycin-resistant strain isolated from a patient suffering from bacteremia (Munoz-Price et al. 2005). A Sartorius Stedim Biostat Bplus controller and bioreactor (1 l volume) customized for continuous experimental evolution was used for all experiments. Culture conditions within the bioreactor consisted of 300 ml of 80% lysogeny broth and 20% brain heart infusion (LBHI) media at 37 °C with an air-flow rate of 0.16–0.2 l/min. The population cell density was maintained at a constant optical density of OD600 = 0.6 (∼6 × 10⁸ cells/ml). We were unable to directly monitor the optical density within the bioreactor, because biofilm production by E. faecalis produced flocculent particulate and coated the optical density probes and all surfaces leading to interference. Instead, we monitored the metabolism of the population by measuring the outflow of %CO2 using a Tandem Pro Gas Analyzer (Magellan Instruments, Hägersten, Sweden). When the exhaust %CO2 of the culture rose, a control loop activated the inflow of fresh media to dilute the culture and maintain a constant population size. Manual optical density measurements of samples collected from the population were also taken periodically to confirm the culture was at the desired cell density. To initiate a run, we inoculated the bioreactor with a single colony of E. faecalis S613. For both runs, we cultured the population in the bioreactor in the absence of TGC for approximately 48 h before adding 0.05 μg/ml TGC (approximately half the TGC MIC against S613). During the experiment, we increased the concentration of TGC in stepwise intervals based upon the next increment of drug concentration that could be tolerated without a marked reduction in growth rate to the new condition. Broth dilution MIC tests were used to determine what concentration of TGC to use for each step in drug concentration. Thus, the entire selection experiment takes place well below the MIC of the population. The advantage of using subinhibitory TGC concentrations during adaptation is that it reduces the selective pressure, which allows for polymorphism to emerge within the population so that more adaptive alleles can be identified. We collected 50 ml samples of the population each day and stored the samples at −80 °C with 20% glycerol (v/v). We screened the population daily for contamination by streaking a sample of the culture onto LBHI agar.
Phenotypic Screening of End-Point Adapted Isolates
At the end of each adaptation experiment, samples of the end-point planktonic and biofilm populations were spread onto LBHI agar (although we could not identify a clear correlation between genotype and whether they were selected from the planktonic or biofilm population). We then randomly selected 93 colonies from each experimental run and stored the colonies in 20% glycerol (v/v) at −80 °C. To assess the phenotypic variation in the populations and to ensure that isolates selected for whole-genome sequencing were diverse, we performed phenotypic assays to identify the underlying genomic diversity within the adapted population. Three phenotypic assays were performed on the isolates: 1) The TGC MIC of each isolate was determined using standard agar dilution assays in triplicate (Wiegand et al. 2008). 2) Some adapted isolates displayed a strong tendency to form floc. To quantify the flocculation phenotype, we selected several of the isolates and grew them overnight in 10 ml of LBHI broth with agitation. The next day, we removed the cultures from the shaker and let them settle for 5 min. The OD600 of a sample of broth taken from the top of each culture was then measured. Next, the cultures were vortexed to break up any floc that was present, after which the OD600 of the broth off the top of the cultures was measured again. A ratio of the OD measurements taken before and after vortexing was plotted to compare the differences in flocculation. 3) The colony sizes of some end-point isolates grown in the presence of chloramphenicol were qualitatively compared with the colony sizes of S613 grown in the presence of chloramphenicol. For this assay, isolates were characterized as having either a similar colony size to S613 or a distinctively smaller colony size. Isolates were then clustered based on differences between the three phenotypes and one isolate was selected from each group for whole-genome sequencing. A total of 14 phenotypically distinct isolates were selected for whole-genome sequencing, 9 from Run 1 and 5 from Run 2 (supplementary table S2, Supplementary Material online).
Sample Preparation for Whole-Genome Sequencing
A sampling of phenotypically diverse individual colonies was selected and grown in 10 ml of LBHI overnight and then pelleted for DNA isolation. Alternatively, frozen samples of the polymorphic population from each day of adaptation were thawed and immediately pelleted for DNA isolation to avoid any outgrowth. To isolate genomic DNA, we used the UltraClean Microbial DNA Isolation Kit (MoBio), but with an additional lysis step where we added 5 μl of 5 U/ml mutanolysin and 12.5 μl of 200 mg/ml lysozyme to 300 μl of pelleted cells and incubated the cells at 37 °C for 30 min. Next, we used the Nextera XT DNA sample preparation kit from Illumina to generate paired-end libraries. The prepared libraries were sequenced on an Illumina Hi-Seq platform at the Medical College of Wisconsin Human and Molecular Genetics Center and the US Army Edgewood Chemical Biological Center. Clones were sequenced with at least 100-fold coverage (average of 254.5-fold coverage) and the population samples were sequenced with at least 500-fold coverage (average of 818.4-fold coverage).
Analysis of Whole-Genome Sequencing Data
Analysis of Clonal Samples
The Illumina reads were aligned to the S613 reference sequence using the open source computational pipeline breseq-0.24rc6 (Deatherage and Barrick 2014). Identified mutations were confirmed using Sanger sequencing. New Tn916 insertions were called in the breseq html output under “Unassigned new junction evidence” and were annotated as junctions between either the 5′ side of the ancestral Tn916 site (NZ_GG739778, position ∼132325) or the 3′ side of the ancestral Tn916 site (NZ_GG739778, position ∼150450) and the position of the new insertion site. To confirm insertions of Tn916, we used primer pairs where one primer complimented either the 5′- or 3′-end of Tn916 and the other primer complimented genomic DNA surrounding the predicted insertion site.
Analysis of Polymorphic Population Samples
Population samples were also analyzed using breseq, but with the addition of a polymorphism command (-p). The read pile-ups for all mutations within the population that reached at least 5% frequency during adaptation were manually investigated to exclude predicted mutations that were the result of misalignments. Several clonal samples were run with the polymorphism command to serve as a control: If an allele was called at the same frequency in the population samples and the clonal samples, the allele was excluded, as it was likely an alignment artifact (Saxer et al. 2014). To visualize the distribution of the different Tn916 insertion sites, all insertion sites were mapped to E. faecalis V583 (accession number NC_004668.1) using the BLAST (Basic Local Alignment Search Tool) Ring Image Generator (Alikhan et al. 2011) (fig. 2B). When sequencing mixed populations that contain individuals with varying Tn916 copy number, the measured frequency of any mutation located in Tn916 was an underrepresentation of the frequency of cells with the mutation, because the total number of Tn916 copies exceeded the population size. To correct this issue, these mutations were multiplied by the average Tn916 copy number of the population at each time point (fig. 1A).
Estimate of Average Tn916 Copy Number in Population Samples
To determine the average Tn916 copy number of the population, we used the assembly visualization software Tablet (Milne et al. 2010) and compared the average sequencing coverage across the ancestral position of the transposon (NZ_GG739778, positions 130400–155400) to the average sequencing coverage across a region of the chromosome outside of the transposon (NZ_GG739778, positions 52500–77500). This method was validated using sequencing data from individual clones with known Tn916 copy number. For example, one new junction corresponding to a new Tn916 insertion was identified in strain BTR87a. The described method indicated that BTR87a had two copies of Tn916, which is consistent with the strain having the original copy of Tn916 and an additional new copy.
Competitive Fitness Assay
We measured the fitness cost of the evolved strains relative to the ancestor by growing them in direct competition (Lenski et al. 1991). The two competitors were initially grown in LBHI broth separately overnight. The following day, equal volumes of S613 and a BTR strain were diluted together into broth and cultured overnight. In the mixed culture, the initial (time = 0) and final (time = 1 day) cell densities of S613 and the BTR strain were determined by measuring colony-forming units (CFU). The plates were replicated onto agar supplemented with TGC to determine the cell density of the BTR strain. The relative fitness (Wij) was then calculated following Lenski (Lenski et al. 1991). Data were plotted as Wij − 1 and the error bars display the 95% confidence interval (fig. 3). To determine whether deletions upstream of tetM confer a significant fitness cost, we performed a contrast analysis using JMP Pro, which indicated a significant difference in fitness between BTR0 and the four strains with deletions upstream of tetM (BTR22, BTR125, BTR87a, and BTR87b: Planned comparison between F1,27 = 31.2, P < 0.0001). At least four replicate assays were preformed with each strain.
Preparation of cDNA for Quantification of Gene Expression
The E. faecalis strains (S613, BTR87b, and BTR22) were streaked onto agar plates with LBHI media and placed at 37 °C for overnight growth. The following day we selected a single colony off of each plate and inoculated tubes containing 10 ml of LBHI broth. After 24 h of growth at 37 °C we diluted the cultures 100-fold into media supplemented with or without TGC (1 μg/ml TGC for the resistant strains, and 0.0625 μg/ml TGC for the susceptible S613 strain). The diluted cultures were then placed at 37 °C until they reached exponential phase (OD600 = 0.3). Once the cultures reached the correct OD, we spun the cells down at 3,000 rpm for 15 min and discarded the supernatant. Three independent cultures for each strain and each test condition were prepared. We resuspended cell pellets in 300 μl of TE buffer. To lyse the cells, they were incubated with 5 μl of 5 U/ml mutanolysin and 12.5 μl of 200 mg/ml lysozyme at 37 °C for 30 min. To extract total RNA from the lysed cells, we used the RNeasy Kit (Qiagen), and quantified the RNA concentration using a BioTek Synergy microplate reader. For overnight storage, we kept the total RNA in 2 mM ethylenediaminetetraacetic acid at −80 °C. DNA was eliminated from the total RNA using the DNA-free kit (Ambion) and RNA integrity was checked using a standard RNA formaldehyde denaturing gel. We identified intact ribosomal bands (23S and 16S) on the RNA gel. To synthesize cDNA from the total RNA, we used the Reverse Transcriptase Superscript III kit (Invitrogen). Next, a standard Taq PCR reaction was used to check cDNA integrity, and an RNAse treatment was used to eliminate RNA.
Preparation of Total DNA for Quantification of Circular Tn916 Copy Number
The E. faecalis strains (S613, BTR87b, and BTR22) were grown on LBHI agar plates overnight and a single colony was picked to inoculated tubes containing 10 ml of LBHI broth media supplemented with or without TGC (1 μg/ml TGC for the resistant strains, and 0.0625 μg/ml TGC for the susceptible S613 strain). After overnight growth we used the UltraClean Microbial DNA Isolation Kit (MoBio) with an additional lysis step (as described above) to isolate DNA. Primers were designed to amplify the product spanning the new junction created when Tn916 is excised from the chromosome and forms a covalently closed circle. This primer design prevents chromosomal Tn916 from being amplified, so that only excised Tn916 is amplified.
Quantitative Real-Time PCR
We setup 25 μl reactions using BR SYBR Green SuperMix (Quanta Biosciences), 200 ng of cDNA or 100 ng of total DNA, and a final primer concentration of 0.4 μM (supplementary table S4, Supplementary Material online). Reactions were run on a Bio-Rad C1000 Thermal Cycler CFX96 Real-Time System. Reaction protocol was run with an initial denaturation step of 3 min at 95 °C, followed by 40 cycles at 95 °C for 10 s and 55 °C for 30 s. For quality control, we determined the melting curve for the product of every reaction on each plate. To identify the reaction efficiency of each primer set, S613 genomic DNA was serially diluted five times by a factor of 10 and used with each primer set to generate calibration curves. We used the housekeeping gene glutamate dehydrogenase (gdh) as a reference gene. Relative gene expression was determined using the Pfaffl method (Pfaffl 2001). Circularized Tn916 copy number was calculated using methods established by Skulj et al. (2008). Error bars represent the 95% confidence interval between three biological samples.
Conjugation Assay
Overnight cultures of E. faecalis donor strains (S613, BTR87a, and BTR22) and the OG1RF recipient strain were diluted 1:10 in BHI and grown for 1 h at 37 °C. Subsequently, the donor and recipient strains were mixed in a ratio of 1:10 and 10 μl of this mating mixture was spotted on nitrocellulose filters placed on BHI plates for overnight mating at 37 °C. Filters were resuspended in 1 ml BHI and the mating mix was serially diluted on BHI plates selective for donors (tetracycline, 10 μg/ml) or transconjugants (rifampicin, 200 μg/ml; fusidic acid, 25 μg/ml; tetracycline, 10 μg/ml). The plasmid transfer frequencies were calculated as the number of transconjugants per donor cell (Chen et al. 2008). The experiments were done in triplicate. The TGC MICs of the transconjugants were elevated (0.5 μg/ml) compared with the MIC of OG1RF (0.125 μg/ml).
Mutation Rate Experiments
We determined the rate at which S613 spontaneously becomes resistant to the antibiotic daptomycin. First, a single colony was used to inoculate 5 ml of LBHI broth. After 24 h of growth, the OD at 600 nm of the culture was measured and 108 cells were plated onto 2.0 μg/ml daptomycin (S613 daptomycin MIC = 0.25 μg/ml). Also, dilutions of the culture were plated onto nonselective media. After 48 h of incubation at 37 °C, the CFUs were determined for the cells plated onto nonselective media and the cells plated onto media supplemented with 2.0 μg/ml daptomycin. The number of generations was calculated as binary divisions: Generations = log2(CFUs on nonselective media). Then, the per genome per generation mutation rates were estimated: Mutation rate = (CFUs on daptomycin media)/([CFUs on nonselective media] × [Generations]). Six replicate assays were performed.
Supplementary Material
Supplementary text S1 and tables S1–S4 are available at Molecular Biology and Evolution online (http://www.mbe.oxfordjournals.org/).
Acknowledgments
The authors thank the US Army Edgewood Chemical Biological Center for assistance with genome sequencing. They also thank Sally Otto, Katya Kosheleva, Vaughn Cooper, and Mike McCarthy for their assistance and advice while preparing the manuscript. This work was supported by the National Institute of Allergy and Infectious Diseases (grant number R01 A1080714) and the Defense Threat Reduction Agency (grant number HDTRA1010-0069).
References
- Alikhan NF, Petty NK, Ben Zakour NL, Beatson SA. 2011. BLAST Ring Image Generator (BRIG): simple prokaryote genome comparisons. BMC Genomics 12:402. [DOI] [PMC free article] [PubMed] [Google Scholar]
- Arias CA, Panesso D, McGrath DM, Qin X, Mojica MF, Miller C, Diaz L, Tran TT, Rincon S, Barbu EM, et al. 2011. Genetic basis for in vivo daptomycin resistance in enterococci. N Engl J Med. 365:892-900. [DOI] [PMC free article] [PubMed] [Google Scholar]
- Barton NH, Charlesworth B. 1998. Why sex and recombination? Science 281:1986-1990. [PubMed] [Google Scholar]
- Bauer G, Berens C, Projan SJ, Hillen W. 2004. Comparison of tetracycline and tigecycline binding to ribosomes mapped by dimethylsulphate and drug-directed Fe2+ cleavage of 16S rRNA. J Antimicrob Chemother. 53:592-599. [DOI] [PubMed] [Google Scholar]
- Boguslawska J, Zycka-Krzesinska J, Wilcks A, Bardowski J. 2009. Intra- and interspecies conjugal transfer of Tn916-like elements from Lactococcus lactis in vitro and in vivo. Appl Environ Microbiol. 75:6352-6360. [DOI] [PMC free article] [PubMed] [Google Scholar]
- Brink AJ, Bizos D, Boffard KD, Feldman C, Grolman DC, Pretorius J, Richards GA, Senekal M, Steyn E, Welkovic N. 2010. Guideline: appropriate use of tigecycline. S Afr Med J. 100:388-394. [DOI] [PubMed] [Google Scholar]
- Cattoir V, Isnard C, Cosquer T, Odhiambo A, Bucquet F, Guerin F, Giard JC. 2014. Genomic analysis of reduced susceptibility to tigecycline in Enterococcus faecium. Antimicrob Agents Chemother. 59:239–244. [DOI] [PMC free article] [PubMed] [Google Scholar]
- CDC. 2013. Antibiotic resistance threat report. Atlanta (GA): CDC; Available from: http://www.cdc.gov/drugresistance/threat-report-2013/. [Google Scholar]
- Celli J, Trieu-Cuot P. 1998. Circularization of Tn916 is required for expression of the transposon-encoded transfer functions: characterization of long tetracycline-inducible transcripts reading through the attachment site. Mol Microbiol. 28:103-117. [DOI] [PubMed] [Google Scholar]
- Chen Q, Li X, Zhou H, Jiang Y, Chen Y, Hua X, Yu Y. 2014. Decreased susceptibility to tigecycline in Acinetobacter baumannii mediated by a mutation in trm encoding SAM-dependent methyltransferase. J Antimicrob Chemother. 69:72-76. [DOI] [PubMed] [Google Scholar]
- Chen Y, Zhang X, Manias D, Yeo HJ, Dunny GM, Christie PJ. 2008. Enterococcus faecalis PcfC, a spatially localized substrate receptor for type IV secretion of the pCF10 transfer intermediate. J Bacteriol. 190:3632-3645. [DOI] [PMC free article] [PubMed] [Google Scholar]
- Connell SR, Tracz DM, Nierhaus KH, Taylor DE. 2003. Ribosomal protection proteins and their mechanism of tetracycline resistance. Antimicrob Agents Chemother. 47:3675-3681. [DOI] [PMC free article] [PubMed] [Google Scholar]
- Cook GM, Poole RK. 2000. Oxidase and periplasmic cytochrome assembly in Escherichia coli K-12: CydDC and CcmAB are not required for haem-membrane association. Microbiology 146:527-536. [DOI] [PubMed] [Google Scholar]
- Cordina C, Hill R, Deshpande A, Hood J, Inkster T. 2012. Tigecycline-resistant Enterococcus faecalis associated with omeprazole use in a surgical patient. J Antimicrob Chemother. 67:1806-1807. [DOI] [PubMed] [Google Scholar]
- Counago R, Chen S, Shamoo Y. 2006. In vivo molecular evolution reveals biophysical origins of organismal fitness. Mol Cell. 22:441-449. [DOI] [PubMed] [Google Scholar]
- Deatherage D, Barrick J. 2014. Identification of mutations in laboratory-evolved microbes from next-generation sequencing data using breseq. In: Sun L, Shou W, editors. Engineering and analyzing multicellular systems. New York: Springer; p. 165-188. [DOI] [PMC free article] [PubMed] [Google Scholar]
- Freitas AR, Novais C, Correia R, Monteiro M, Coque TM, Peixe L. 2011. Non-susceptibility to tigecycline in enterococci from hospitalised patients, food products and community sources. Int J Antimicrob Agents. 38:174-176. [DOI] [PubMed] [Google Scholar]
- Guiton PS, Hung CS, Hancock LE, Caparon MG, Hultgren SJ. 2010. Enterococcal biofilm formation and virulence in an optimized murine model of foreign body-associated urinary tract infections. Infect Immun. 78:4166-4175. [DOI] [PMC free article] [PubMed] [Google Scholar]
- Haack BJ, Andrews RE, Loynachan TE. 1996. Tn916-mediated genetic exchange in soil. Soil Biol Biochem. 28:765-771. [Google Scholar]
- Hespell RB, Whitehead TR. 1991. Conjugal transfer of Tn916, Tn916 delta E, and pAM beta 1 from Enterococcus faecalis to Butyrivibrio fibrisolvens strains. Appl Environ Microbiol. 57:2703-2709. [DOI] [PMC free article] [PubMed] [Google Scholar]
- Jaworski DD, Clewell DB. 1994. Evidence that coupling sequences play a frequency-determining role in conjugative transposition of Tn916 in Enterococcus faecalis. J Bacteriol. 176:3328-3335. [DOI] [PMC free article] [PubMed] [Google Scholar]
- Jenner L, Starosta AL, Terry DS, Mikolajka A, Filonava L, Yusupov M, Blanchard SC, Wilson DN, Yusupova G. 2013. Structural basis for potent inhibitory activity of the antibiotic tigecycline during protein synthesis. Proc Natl Acad Sci U S A. 110:3812-3816. [DOI] [PMC free article] [PubMed] [Google Scholar]
- King G, Sharom FJ. 2012. Proteins that bind and move lipids: MsbA and NPC1. Crit Rev Biochem Mol Biol. 47:75-95. [DOI] [PubMed] [Google Scholar]
- Lee H, Popodi E, Tang H, Foster PL. 2012. Rate and molecular spectrum of spontaneous mutations in the bacterium Escherichia coli as determined by whole-genome sequencing. Proc Natl Acad Sci U S A. 109:E2774–E2783. [DOI] [PMC free article] [PubMed] [Google Scholar]
- Lenski RE, Rose MR, Simpson SC, Tadler SC. 1991. Long-term experimental evolution in Escherichia coli. I. Adaptation and divergence after 2000 generations. Am Nat. 138:1315-1341. [Google Scholar]
- Lenski RE, Souza V, Duong LP, Phan QG, Nguyen TNM, Bertrand KP. 1994. Epistatic effects of promoter and repressor functions of the Tn10 tetracycline-resistance operon on the fitness of Escherichia coli. Mol Ecol. 3:127-135. [DOI] [PubMed] [Google Scholar]
- Levin BR, Cornejo OE. 2009. The population and evolutionary dynamics of homologous gene recombination in bacteria. PLoS Genet. 5:e1000601. [DOI] [PMC free article] [PubMed] [Google Scholar]
- McAleese F, Petersen P, Ruzin A, Dunman PM, Murphy E, Projan SJ, Bradford PA. 2005. A novel MATE family efflux pump contributes to the reduced susceptibility of laboratory-derived Staphylococcus aureus mutants to tigecycline. Antimicrob Agents Chemother. 49:1865-1871. [DOI] [PMC free article] [PubMed] [Google Scholar]
- Miller C, Kong J, Tran TT, Arias CA, Saxer G, Shamoo Y. 2013. Adaptation of Enterococcus faecalis to daptomycin reveals an ordered progression to resistance. Antimicrob Agents Chemother. 57:5373-5383. [DOI] [PMC free article] [PubMed] [Google Scholar]
- Milne I, Bayer M, Cardle L, Shaw P, Stephen G, Wright F, Marshall D. 2010. Tablet—next generation sequence assembly visualization. Bioinformatics 26:401-402. [DOI] [PMC free article] [PubMed] [Google Scholar]
- Munoz-Price LS, Lolans K, Quinn JP. 2005. Emergence of resistance to daptomycin during treatment of vancomycin-resistant Enterococcus faecalis infection. Clin Infect Dis. 41:565-566. [DOI] [PubMed] [Google Scholar]
- Naglich JG, Andrews RE., Jr 1988. Tn916-dependent conjugal transfer of PC194 and PUB110 from Bacillus subtilis into Bacillus thuringiensis subsp. israelensis. Plasmid 20:113-126. [DOI] [PubMed] [Google Scholar]
- Nguyen TN, Phan QG, Duong LP, Bertrand KP, Lenski RE. 1989. Effects of carriage and expression of the Tn10 tetracycline-resistance operon on the fitness of Escherichia coli K12. Mol Biol Evol. 6:213-225. [DOI] [PubMed] [Google Scholar]
- Olson MW, Ruzin A, Feyfant E, Rush TS, 3rd, O’Connell J, Bradford PA. 2006. Functional, biophysical, and structural bases for antibacterial activity of tigecycline. Antimicrob Agents Chemother. 50:2156-2166. [DOI] [PMC free article] [PubMed] [Google Scholar]
- Pfaffl MW. 2001. A new mathematical model for relative quantification in real-time RT-PCR. Nucleic Acids Res. 29:e45. [DOI] [PMC free article] [PubMed] [Google Scholar]
- Rice LB. 1998. Tn916 family conjugative transposons and dissemination of antimicrobial resistance determinants. Antimicrob Agents Chemother. 42:1871-1877. [DOI] [PMC free article] [PubMed] [Google Scholar]
- Roberts AP, Mullany P. 2009. A modular master on the move: the Tn916 family of mobile genetic elements. Trends Microbiol. 17:251-258. [DOI] [PubMed] [Google Scholar]
- Roberts MC. 2005. Update on acquired tetracycline resistance genes. FEMS Microbiol Lett. 245:195-203. [DOI] [PubMed] [Google Scholar]
- Saxer G, Krepps MD, Merkley ED, Ansong C, Deatherage Kaiser BL, Valovska M-T, Ristic N, Yeh PT, Prakash VP, Leiser OP, et al. 2014. Mutations in global regulators lead to metabolic selection during adaptation to complex environments. PLoS Genet. 10:e1004872. [DOI] [PMC free article] [PubMed] [Google Scholar]
- Skulj M, Okrslar V, Jalen S, Jevsevar S, Slanc P, Strukelj B, Menart V. 2008. Improved determination of plasmid copy number using quantitative real-time PCR for monitoring fermentation processes. Microb Cell Fact. 7:6. [DOI] [PMC free article] [PubMed] [Google Scholar]
- Storrs MJ, Poyart-Salmeron C, Trieu-Cuot P, Courvalin P. 1991. Conjugative transposition of Tn916 requires the excisive and integrative activities of the transposon-encoded integrase. J Bacteriol. 173:4347-4352. [DOI] [PMC free article] [PubMed] [Google Scholar]
- Su YA, He P, Clewell DB. 1992. Characterization of the tet(M) determinant of Tn916: evidence for regulation by transcription attenuation. Antimicrob Agents Chemother. 36:769-778. [DOI] [PMC free article] [PubMed] [Google Scholar]
- Villa L, Feudi C, Fortini D, Garcia-Fernandez A, Carattoli A. 2014. Genomics of KPC-producing Klebsiella pneumoniae sequence type 512 clone highlights the role of RamR and ribosomal S10 protein mutations in conferring tigecycline resistance. Antimicrob Agents Chemother. 58:1707-1712. [DOI] [PMC free article] [PubMed] [Google Scholar]
- Wasels F, Monot M, Spigaglia P, Barbanti F, Ma L, Bouchier C, Dupuy B, Mastrantonio P. 2014. Inter- and intraspecies transfer of a clostridium difficile conjugative transposon conferring resistance to MLSB. Microb Drug Resist. 20:555-560. [DOI] [PubMed] [Google Scholar]
- Werner G, Gfrorer S, Fleige C, Witte W, Klare I. 2008. Tigecycline-resistant Enterococcus faecalis strain isolated from a German intensive care unit patient. J Antimicrob Chemother. 61:1182-1183. [DOI] [PubMed] [Google Scholar]
- Wiegand I, Hilpert K, Hancock REW. 2008. Agar and broth dilution methods to determine the minimal inhibitory concentration (MIC) of antimicrobial substances. Nat Protoc. 3:163-175 [DOI] [PubMed] [Google Scholar]
Associated Data
This section collects any data citations, data availability statements, or supplementary materials included in this article.