

Abstract
We previously reported that INS-1 cells expressing the intracellular II-III loop of the L-type Ca2+ channel Cav1.2 (Cav1.2/II-III cells) are deficient in Ca2+-induced Ca2+ release (CICR). Here we show that glucose-stimulated ERK 1/2 phosphorylation (GSEP) is slowed and reduced in Cav1.2/II-III cells compared to INS-1 cells. This parallels a decrease in glucose-stimulated cAMP accumulation (GS-cAMP) in Cav1.2/II-III cells. Influx of Ca2+ via L-type Ca2+ channels and CICR play roles in both GSEP and GS-cAMP in INS-1 cells since both are inhibited by nicardipine or ryanodine. Further, the Epac1-selective inhibitor CE3F4 abolishes glucose-stimulated ERK activation in INS-1 cells, as measured using the FRET-based sensor EKAR. The non-selective Epac antagonist ESI-09 but not the Epac2-selective antagonist ESI-05 nor the PKA antagonist Rp-cAMPs inhibits GSEP in both INS-1 and Cav1.2/II-III cells. We conclude that L-type Ca2+ channel-dependent cAMP accumulation, that’s amplified by CICR, activates Epac1 and drives GSEP in INS-1 cells.
Keywords: Pancreatic beta-cell, Ca2+-induced Ca2+ release, cAMP, Extracellular signal Regulated Kinase 1/2, Exchange protein directly activated by cAMP, L-type Ca2+ channel, Cav1.2
1. Introduction
Glucose-stimulated insulin secretion is an essential function of pancreatic β-cells that permits glucose utilization in insulin-sensitive tissues and counteracts hyperglycemia that occurs after a carbohydrate-rich meal. A complementary role of elevated glucose concentrations is to maintain β-cell mass and promote insulin production in the face of increased demand via stimulation of the extracellular signal regulated Kinase 1 and 2 (ERK) in β-cells (Khoo et al., 2003). Glucose-stimulated ERK phosphorylation (GSEP) leads to the activation of transcription factors that support β-cell survival and proliferation, and to activation of insulin gene transcription (Lawrence et al., 2008). However, prolonged hyperglycemia is reported to cause constitutive ERK phosphorylation, which may contribute to impaired insulin secretion and glucotoxicity (Yeo et al., 2012). Aberrant ERK activation is also associated with obesity, insulin resistance, and type 2 diabetes (Bashan et al., 2007) (Bouzakri et al., 2003) (Carlson et al., 2003). Evidence that dysregulation of ERK signaling plays a role in diabetes and metabolic disease underscores the importance of understanding the mechanisms whereby glucose and other stimuli activate ERK in pancreatic β-cells.
In β-cells, glucose metabolism, ATP-dependent membrane depolarization, and influx of extracellular Ca2+can lead to activation of ERK (Khoo and Cobb, 1997). This pathway is mimicked by direct depolarization of the β-cell membrane potential by elevated extracellular KCl concentration (Arnette et al., 2003) or sulfonylureas (Khoo and Cobb, 1997). Indeed, β-cell apoptosis stimulated by prolonged hyperglycemia via activation of ERK is inhibited by KATP channel openers (Maedler et al., 2004). The key role of Ca2+ in the activation of ERK is, at least in part, mediated by the Ca2+-activated phosphatase calcineurin, which modulates the activity of B-Raf, the kinase that phosphorylates mitogen activated protein kinase kinase (MEK), and a key point of feedback inhibition by ERK (Duan and Cobb, 2010). In addition, activation of protein kinase A by Ca2+-dependent cAMP production is proposed as a key link between glucose-induced β-cell membrane depolarization and activation of ERK (Briaud et al., 2003). Drugs that specifically block Ca2+ flux through L-type voltage-gated Ca2+ channels are efficacious inhibitors of GSEP (Arnette et al., 2003). Besides mediating Ca2+ flux across the plasma membrane in response to glucose-stimulated membrane depolarization, L-type Ca2+ channels are also coupled to Ca2+-induced Ca2+release (CICR) from internal stores in β-cells (Kang and Holz, 2003) (Wang et al., 2014). The relative contribution of Ca2+ flux across the membrane versus CICR to ERK activation in β-cells appears to depend upon the model system. For example, pharmacological inhibitors of CICR disrupt GSEP in the rat-derived insulinoma cell line INS-1 (Arnette et al., 2003), but not in the mouse-derived insulinoma cell line MIN6 (Selway et al., 2012), though Ca2+ influx through L-type Ca2+ channels is clearly involved in both cell lines.
Pancreatic β-cells express two distinct L-type Ca2+ channels, Cav1.2 and Cav1.3 (Seino et al., 1992), which are both sensitive to commonly used Ca2+ channel blockers (Hockerman et al., 1997) (Xu and Lipscombe, 2001). We previously reported that Cav1.3 channels play a key role glucose-stimulated insulin secretion (Liu et al., 2003), and that insulin secretion mediated by Cav1.2 and Cav1.3 is differentially regulated by cAMP (Liu et al., 2006). Expression of the intracellular II-III loop domain of these channels in INS-1 cells disrupts localization of the corresponding endogenous channels from lipid rafts (Jacobo et al., 2009), and in INS-1 cells expressing the Cav1.2 II-III loop (Cav1.2/II-III cells) CICR is disrupted (Wang et al., 2014). Therefore, we used control INS-1 cells and the Cav1.2/II-III cell line to study the role of CICR in GSEP and glucose-stimulated cAMP accumulation (GS-cAMP). Here we show that CICR amplifies L-type channel activation of ERK and cAMP accumulation, and that cAMP activates ERK via an Epac1-mediated mechanism.
2. Materials and Methods
2.1 Chemicals and Reagents
D-glucose was purchased from Mallinckrodt Chemicals (Dublin, Ireland). Ryanodine was purchased from EMD Millipore (Billerica, MA). 4-methylphenyl-2,4,6,-trimethylphenylsulfone (ESI-05) and 8-(4-chlorophenylthio)-2′-O-methyladenosine-3′-5′-cyclic monophosphate acetoxymethylester (ESCA-AM) were purchased from BIOLOG (Bremen, Germany). Rp-cyclic 3′,5′-hydrogen phosphorothioate adenosine (Rp-cAMPS) was purchased from Santa Cruz Biotechnology (Dallas, TX). U0126 was purchased from Life Technologies (Foster City, CA). Phorbol 12-myristate 13-acetate (PMA) and forskolin were purchased from Tocris Bioscience (Bristol, UK). Unless otherwise indicated, all other reagents were purchased from Sigma-Aldrich (St. Louis, MO).
2.2 Cell Culture
INS-1 cells (Asfari et al., 1992), INS-1 cells expressing EGFP, INS-1 cell expressing the intracellular loop of Cav1.2 fused to EGFP (Cav1.2/II-III cells) or the intracellular II-III loop of Cav1.3 fused to EGFP (Cav1.3/II-III cells) (Liu et al., 2003), were cultured in RPMI-1640 media containing 11.1 mM glucose supplemented with 10 mM HEPES, 10% fetal bovine serum (Defined FBS, Hyclone, Logan, UT), 11 mg/ml sodium pyruvate, 10,000 units/ml penicillin, 10,000 μg/ml streptomycin, and 50 μM β-mercaptoethanol at 37°C and 5% CO2. Cav1.2/II-III cells and Cav1.3/II-III cells were maintained in 200 μg/ml G-418.
2.3 Detection of pERK and total ERK by Western Blot
Cells were cultured in 12-well plates to 50–70% confluency and incubated overnight at 37°C and 5% CO2, then washed twice with phosphate-buffered saline and pre-incubated for two hours at 37°C and 5% CO2 in glucose-free modified Krebs-Ringer buffer (134 mM NaCl, 3.5 mM KCl, 0.5 mM MgSO4, 1.5 mM CaCl2, 5 mM NaHCO3, 10 mM HEPES, pH 7.4) supplemented with 0.05% fatty acid-free BSA (KRBH) (Osm 290–295). Pre-incubation buffer was removed and indicated treatments were added in KRBH, and incubated with cells for the indicated times at 37°C and 5% CO2. To terminate the reaction, the treatments were decanted, and the cells were placed on ice, and lysed in 50 mM HEPES, pH 7.5, 0.15 M NaCl, 1% Triton X-100 (lysis buffer) supplemented with 0.1 M NaF, 2 mM Na3VO4, 800 nM aprotinin, 50 μM leupeptin, 1 μg/ml pepstatin, 1 mM benzamidine, 1 mM 4-(2-aminoethyl)benzenesulfonyl fluoride, 10 μg/ml calpain inhibitors I and II, chilled to 4°C. The protein concentration of each lysate was determined using the BCA assay (Pierce, Rockford, IL), and 40 μg of each sample was separated by SDS-PAGE on a 10% polyacrylamide gel, and transferred to a PVDF membrane (BioRad, Hercules, CA). Membranes were blocked in 5% non-fat dry milk in phosphate buffered saline, and first probed with a pERK-specific antibody (1:1000) (Cell Signaling Technology, Danvers, MA) and a alkaline phosphatase-conjugated secondary antibody (1:10,000) (Promega, Madison, WI). Proteins were detected using Enhanced Chemifluorescence (Amersham Biosciences, Piscataway, NJ) and a Typhoon Digital Imager (Amersham Biosciences). The membranes were then stripped in 62.5 mM Tris, pH 6.7, 100 mM β-mercaptoethanol, 2% SDS, and reprobed with a primary antibody against total ERK (1:1000)(Cell Signaling Technology).
2.4 Detection of pERK and total ERK by cell-based ELISA
Cells were cultured overnight in 96-well black-walled plates (Corning Life Sciences, Corning, NY) at 37°C and 5% CO2, then washed twice in phosphate buffered saline. Cells were pre-incubated for two hours in glucose-free, modified KRBH supplemented with 0.05% fatty acid-free BSA at 37°C and 5% CO2. The pre-incubation buffer was decanted, and cells were stimulated with 18 mM glucose in KRBH. Cells were incubated with or without inhibitors in modified KRBH for 30 min at 37°C and 5 % CO2 before glucose stimulation. The reactions were terminated at the indicated time points by decanting the treatments and fixing the cells with 4% formaldehyde. In experiments using pharmacological inhibitors, reactions were terminated 10 min after glucose stimulation was initiated. Total ERK and pERK was measured using the Phospho-ERK1 (T202/Y204) / ERK2 (T185/Y187) Cell-Based ELISA, according to the manufacture’s protocol (R&D Systems, Minneapolis, MN). Total ERK1/ERK2 was measured at 450nm with excitation at 360nm, and phosphorylated ERK1/ERK2 was measured at 600nm with excitation at 540nm, using a Synergy 4 Microplate Reader (BioTek Instruments, Winooski, VT). The data were expressed as the ratio of pERK to total ERK then normalized and expressed as either fold over basal or % glucose response.
2.5 FRET Sensor Measurements
Control INS-1/EGFP or Cav1.2/II-III cells were plated in six-well plates and incubated at 37°C, 5% CO2 for at least 24 hours. To measure ERK activation or cAMP accumulation, cells were transiently transfected with 1 μg of plasmid encoding EKAR (Harvey et al., 2008) or mTurq2Δ_Epac(CD, Δ DEP,Q270E)_tdcp173Ven (H187) (Klarenbeek et al., 2015), respectively, using Lipofectamine 2000 (Life Technologies, Grand Island, NY). To measure local cAMP accumulation at the plasma membrane, Cav1.2/II-III cells were infected with an adenovirus encoding Epac2-MyrPalm (Agarwal et al., 2014) using a multiplicity of infection (MOI) of 1. Cells were split 24 hours post-transfection into 4 Chamber Glass Bottom Dishes (Cellvis, Mountain View, CA) and imaged 48 hours post-transfection. Cell culture media was replaced with glucose-free, modified KRBH supplemented with 0.05% fatty acid-free BSA, with or without the presence of pharmacological inhibitors, at least 30 min prior to imaging. Transfected cells were imaged at 20x magnification using a Nikon A1 Confocal equipped with a Perfect Focus Ti-E Inverted Microscope. Transfected cells were identified using a 405 nm laser diode and 450/50 nm band pass filter. Cells expressing the FRET sensors were excited using the 457 nm laser line of a Multi-Argon laser (457/488/514 nm). Donor and acceptor (FRET) emission signal was collected sequentially using a 482/35nm band pass filter and 525/50 nm band pass filter, respectively. 512 × 512 pixel images of the selected field were collected every 4 sec for a total of 15 min. A baseline signal was collected for one minute prior to stimulation. Cells were stimulated with either glucose (18 mM) or the combination of forskolin (25 μM) and IBMX (100 μM), and the donor and FRET signal was collected for an additional 14 minutes. Time-lapse measurements of donor and FRET were analyzed using NIS Elements 4.0 software. To assess changes in ERK activation, the ratio of FRET to donor signal was calculated on a cell-by-cell basis over the entire time-lapse. To measure cAMP accumulation, the ratio of donor to FRET was alternatively determined. The resulting ratiometric traces were averaged among the sensor-expressing cells to yield a single trace for each experiment. Each data point on the population trace was normalized to the average ratio during the first min prior to stimulation. Normalized traces were averaged among all experiments with the same pre-treatment and stimulation conditions.
2.6 Data Analysis
Data are shown as means ± standard error. Statistical analysis was performed using One-Way ANOVA with the Holm-Sidak post-hoc test when comparing more than 2 groups of data, and Student’s unpaired t-test when comparing 2 groups of data. P <0.05 was considered significant.
3. Results
3.1 GSEP is delayed and diminished in Cav1.2/II-III cells
Ca2+ flux through L-type Ca2+ channels is required for GSEP; however, the role of CICR is not clear (Gomez et al., 2002). We previously reported that endogenous Cav1.2 channels are shifted outside of lipid rafts in Cav1.2/II-III cells (Jacobo et al., 2009) and CICR is disrupted in these cells (Wang et al., 2014). To determine the role of CICR in GSEP, we measured ERK phosphorylation at several time points following stimulation with 18 mM glucose in Cav1.2/II-III cells and control INS-1 cells. In addition, we examined the time course of GSEP in INS-1 cells expressing the II-III loop of closely-related L-type channel Cav1.3 (Cav1.3/II-III cells). Representative western blots showing induction of pERK in response to glucose (18 mM) in control INS-1, Cav1.2/II-III, and Cav1.3/II-III cells are shown in Figure 1A. While a strong pERK signal is detected by western blot after 5 min of glucose stimulation in control INS-1 cells and Cav1.3/II-III cells, only a very small amount of pERK is detected at this time point in Cav1.2/II-III cells. To better quantify the differences in pERK between these cell lines at each time point, we utilized a cell-based ELISA, and expressed the ratio of pERK to total ERK as fold over basal. This approach confirmed the results obtained via western blot indicating that the pERK/ERK ratio at each time point during glucose stimulation in control INS-1 cells and Cav1.3/II-III cells was not different, while the pERK/ERK ratio in Cav1.2/II-III cells was significantly reduced compared to INS-1 cells at 5, 10, and 30 min of glucose stimulation (Figure 1B). Thus, GSEP is significantly delayed and the maximum amplitude is significantly decreased in Cav1.2/II-III cells compared with control INS-1 and Cav1.3/II-III cells.
Figure 1. Time course of GSEP in control INS-1 cells and Cav1.2/II-III cells.

A) INS- cells, Ca1.2/II-III cells or Cav1.3/II-III cells were stimulated with 18 mM glucose for the indicated times. The far right lane shows the basal (B) level of pERK the absence of glucose stimulation. Total ERK and phosphorylated ERK (pERK) were detected by western blotting. Western blots shown are representative of at least three separate experiments. B) INS-1 cells, Cav1.2/II-III cells, and Cav1.3/II-III cells were stimulated with glucose (18 mM) for the indicated times shown on the x-axis. Total ERK and pERK were detected and quantified using a cell-based ELISA. The ratio of pERK to total ERK was determined at each time point and normalized to pERK/total ERK prior to glucose stimulation (0 min). GSEP was significantly reduced in Cav1.2/II-III cells compared to control INS-1 cells at the 5, 10, and 30 min time points (***, P < 0.001 One Way ANOVA, Holm-Sidak post-hoc test). In contrast, GSEP was not different between INS-1 cells and Cav1.3/II-III cells at any time point. Data shown are the mean ± SE of at least three independent experiments.
The incretin glucagon-like peptide-1 (GLP-1) can potentiate GSEP in β-cells, and GSEP in response to glucose + GLP-1 is dependent on Ca2+ influx through voltage-gated Ca2+ channels (Selway 2012). Therefore, we examined GSEP in control INS-1, Cav1.2/II-III, and Cav1.3/II-III cells. When stimulated with 18 mM glucose in the presence of 50 nM GLP-1, ERK phosphorylation was accelerated, compared to glucose alone, in all three cell lines. However, while there was no difference at any time point during 30 min of stimulation between control INS-1 cells and Cav1.3/II-III cells, the fold increase in pERK/ERK ratio was significantly lower in Cav1.2/II-III cells at the 2 min time point compared to control INS-1 cells (Supplemental Figure 1). This difference was not the result of a decreased response to GLP-1, since pERK stimulated by 50 nM GLP-1 in the absence of glucose was not deficient in Cav1.2/II-III cells compared to either control INS-1 cells or Cav1.3/II-III cells (Supplemental Figure 2).
3.2 GSEP is dependent upon CICR
To examine whether diminished GSEP observed in Cav1.2/II-III cells is upstream or downstream of Raf-mediated activation of ERK, we compared the amplitude of ERK phosphorylation in response to either the phorbol ester PMA or glucose in control INS-1 and Cav1.2/II-III cells using a cell-based ELISA. PMA is an activator of Protein Kinase C that stimulates ERK phosphorylation through Raf-MEK-ERK signaling (Ueda et al., 1996). As shown in Figure 2A and Figure 2B, PMA (1 μM) stimulated ERK phosphorylation to levels two-fold above basal in both control INS-1 and Cav1.2/II-III cells. Levels of ERK phosphorylation stimulated with glucose (18 mM) were not different from those stimulated by PMA in control INS-1 cells; however, in Cav1.2/II-III cells, glucose stimulated significantly less pERK compared to PMA stimulation. This result suggests that the deficit in GSEP in Cav1.2/II- III cells is upstream of Raf-MEK-ERK signaling, and not a reduced capacity of Raf or MEK to activate ERK.
Figure 2. Role of Ca2+ in GSEP in INS-1 and Cav1.2/II-III cells.
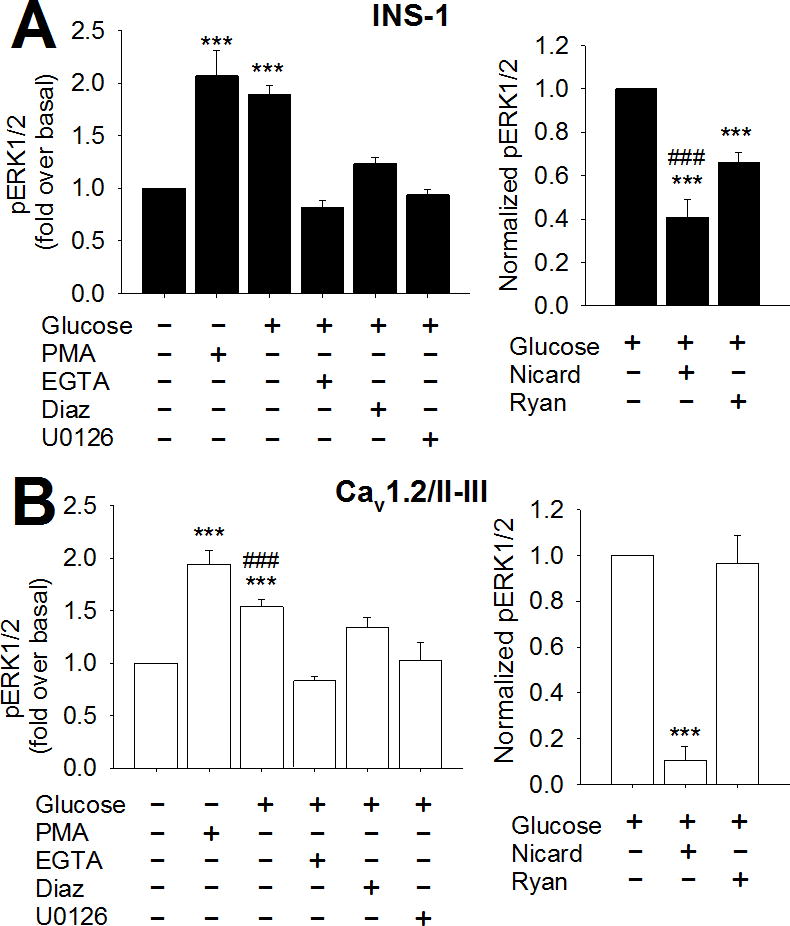
ERK phosphorylation was measured using a cell-based ELISA as described in Materials and Methods. A) Left panel- INS-1 cells were stimulated with 18 mM glucose for 10 min in the presence or absence of the indicated agents. pERK/total ERK was determined for each treatment condition and normalized to the basal ratio. GSEP was not different compared to ERK phosphorylation stimulated by 1 μM PMA. Glucose did not significantly stimulate ERK phosphorylation above basal levels in the absence of extracellular Ca2+ (10 mM EGTA), in the absence of membrane depolarization (300 μM diazoxide), or in the presence of the MEK inhibitor U-0126 (10 μM) (***, P < 0.001 compared to basal; One-Way ANOVA, Holm-Sidak post-hoc test). Right panel- INS-1 cells were stimulated with 18 mM glucose alone for 10 min or in the presence of nicardipine (2 μM) or ryanodine (20 μM). pERK/total ERK was determined for each treatment condition and normalized to the ratio in the presence of glucose alone. GSEP was significantly inhibited by 2 μM nicardipine (L-type channel blocker) and 20 μM ryanodine (inhibitor of CICR). Nicardipine inhibited a significantly greater fraction of GSEP than ryanodine (***, P < 0.001 compared to glucose alone; ###, P < 0.001 compared to ryanodine; One-Way ANOVA, Holm- Sidak post-hoc test). B) Left panel- Cav1.2/II-III cells were stimulated as in A, in the absence or presence of the indicated agents, and pERK/total ERK was determined for each condition and normalized to basal. GSEP was significantly less than that stimulated by PMA in Cav1.2/II-III cells. Glucose did not significantly stimulate ERK phosphorylation above basal levels in the presence of 10 mM EGTA, 300 μM diazoxide, or 10 μM U0126 in Cav1.2/II-III cells (***, P < 0.001 compared to basal; ###, P < 0.001 compared to PMA; One-Way ANOVA, Holm-Sidak post-hoc test). Right panel- Cav1.2/II-III cells were stimulated with 18 mM glucose alone for 10 min or in the presence of nicardipine (2 μM) or ryanodine (20 μM). pERK/total ERK was determined for each treatment condition and normalized to the ratio in the presence of glucose alone. GSEP was significantly inhibited by 2 μM nicardipine but not 20 μM ryanodine in Cav1.2/II-III cells (***, P < 0.001 compared to glucose alone; One-Way ANOVA, Holm-Sidak post-hoc test). All data are shown as mean ± SE from at least three independent experiments.
Since Ca2+ signaling is aberrant in Cav1.2/II-III cells, we further evaluated the role of Ca2+ in GSEP in these cells using a cell-based ELISA. Exclusion of Ca2+ from the extracellular buffer or pre-treatment with the KATP channel opener diazoxide completely abolished GSEP in both control INS-1 and Cav1.2/II-III cells, suggesting that voltage-gated Ca2+ channels are required in both (Figure 2A and Figure 2B). However, as we reported previously, there are clear differences in Ca2+ signaling between control INS-1 and Cav1.2/II-III cells, including CICR disruption and a doubling of VGCCs in Cav1.2/II-III cells (Wang et al., 2014). Therefore, we examined the role of L-type Ca2+ channel-mediated Ca2+ influx and CICR in GSEP using the L-type Ca2+ channel blocker nicardipine and the ryanodine receptor inhibitor ryanodine, respectively. Pre-treatment of control INS-1 cells with nicardipine significantly but incompletely inhibited GSEP at the 10 min time point. Ryanodine also inhibited GSEP in control INS-1 cells, albeit to a lesser extent (Figure 2A). This result suggests that GSEP is partially dependent on CICR, but a portion is solely mediated by L-type Ca2+ channel-mediated Ca2+ influx. In contrast, GSEP in Cav1.2/II-III cells was insensitive to ryanodine and completely abolished by nicardipine (Figure 2B). Thus, in Cav1.2/II-III cells, GSEP is exclusively dependent upon Ca2+ influx via L-type Ca2+ channels rather than CICR. Given the prominent role of CICR in GSEP observed in control INS-1 cells, disruption of CICR in Cav1.2/II-III cells likely accounts for the reduced capacity of glucose to stimulate ERK phosphorylation in these cells.
3.3 Glucose-stimulated ERK activation is dependent on CICR
To assess whether or not the differences in the rate and extent of ERK phosphorylation observed in Cav1.2/II-III cells result in a measurable difference in ERK activity, we utilized the fluorescence resonance energy transfer (FRET)-based sensor EKAR (Harvey et al., 2008). Activated ERK directly phosphorylates a substrate peptide on EKAR triggering an increase in FRET between Venus and Cerulean. Thus, an increase in the ratio of Venus to Cerulean emission signal is indicative of ERK activation. In these studies, the Venus (FRET) to Cerulean ratio was normalized to the baseline ratio obtained prior to stimulation with glucose (18 mM). As shown in Figure 3A, we observed an increase in ERK activity in response to glucose in both control INS-1 and Cav1.2/II-III cells. Quantification of the time courses revealed that glucose-stimulated ERK activation is significantly reduced in Cav1.2/II-III cells at 350 to 600 sec (5–9 min post-stimulation), compared with control INS-1 cells (Figure 3A, right panel). This delay in glucose- stimulated ERK activity in Cav1.2/II-III cells compared to control INS-1 cells is in good agreement with the kinetics of GSEP detected by western blot and cell-based ELISA in which we observed significant differences at 5 and 10 min after stimulation (Figure 1A and Figure 1B).
Figure 3. Glucose-stimulated ERK activation is delayed and independent of CICR in Cav1.2/II-III cells.

A) Left panel- Averaged ratiometric (FRET/Cerulean) traces of EKAR expressed in INS-1 cells (blue circles) and Cav1.2/II-III cells (green circles). Cells were stimulated with glucose (18 mM) at 60 sec. Right panel- The change in FRET/Cerulean ratio from baseline in control INS-1 cells (blue bars) is significantly greater than in Cav1.2/II-III cells (green bars) at several time points (***, P < 0.001, **,P < 0.01,*, P < 0.05, Student’s unpaired t-test). The INS-1 cell trace is the average of 24 independent experiments (535 total cells), and the Cav1.2/II-III is the average of 13 independent experiments (338 total cells). B) Left panel- Averaged ratiometric (FRET/Cerulean) traces of EKAR expressed in INS-1 cells stimulated with glucose (18 mM) at 60 sec in the presence (red circles) or absence (blue circles) of ryanodine (20 μM). Right panel- The change in FRET/Cerulean ratio from baseline after glucose stimulation is significantly less in the ryanodine-treated group (red bars) compared to untreated (blue bars) at several time points (*, P < 0.05, Student’s unpaired t-test). Both traces are the average of 5 independent experiments (control: 120 total cells, ryanodine: 97 total cells). C) Left panel- Averaged ratiometric (FRET/Cerulean) traces of EKAR expressed in Cav1.2/II-III cells stimulated with glucose (18 mM) at 60 sec in the presence (red circles) or absence (blue circles) of ryanodine (20 μM). Right panel- The change in FRET/Cerulean ratio from baseline in Cav1.2/II-III cells is not different between ryanodine-treated (red bars) and untreated (blue bars). Significance was determined using Student’s unpaired t-test, with P < 0.05 considered significant. Both traces are the average of 3 independent experiments (control: 68 total cells, ryanodine: 76 total cells).
To examine the role of CICR in glucose-stimulated ERK activation, INS-1 cells were treated with ryanodine (20 μM) prior to stimulation (Figure 3B). Pre-treatment with ryanodine markedly inhibited the late phase of ERK activation in response to glucose. The difference in ERK activation between control INS-1 ryanodine-treated cells was significant between 550 and 850 sec (8 to 13 min post-stimulation) (Figure 3B right panel). This result is strikingly similar to the period in which we observed diminished glucose-stimulated ERK activity in Cav1.2/II-III cells (Figure 3A). This observation suggests that disruption of CICR, either by ryanodine treatment or Cav1.2/II-III cells, selectively effects the late-phase of glucose-stimulated ERK activation. Thus, ERK activation in response to glucose can persist in the absence of CICR; however, CICR is required to reach maximum amplitude. In contrast, ryanodine had no effect on glucose-stimulated ERK activation in Cav1.2/II-III cells at any time point (Figure 3C). Taken together, our data suggest that CICR is required for efficient ERK phosphorylation and activation in response to glucose.
3.4 GS-cAMP is reduced in Cav1.2/II-III cells
GSEP is reported to be dependent on cAMP signaling (Briaud et al., 2003). Further, it is clear that L-type Ca2+ channel-mediated Ca2+ influx is required for GS-cAMP; however, the role of CICR in this process is less clear (Landa et al., 2005). Thus, it’s possible that CICR is required for efficient cAMP production in response to glucose, and disruption of CICR in Cav1.2/II-III cells indirectly impacts GSEP via aberrant cAMP signaling. To test this hypothesis, we utilized the high-affinity, fourth-generation Epac1-based FRET cAMP sensor H187 (Klarenbeek et al., 2015). The binding of cAMP to H187 results in a loss of FRET between the Venus dimer acceptor and the donor mTurquoise2, and a corresponding increase in the fluorescent signal of mTurquoise2. When cAMP production was stimulated with 25 μM forskolin + 100 μM IBMX after 60 sec of baseline measurements, a robust response was detected in both control INS-1 and Cav1.2/II-III cells, and no difference in mTurquoise/FRET ratio between cell lines was detected at any time point up to 14 min post-stimulation (Figure 4A). Using glucose (18 mM) as a stimulus, we also detected cAMP accumulation above baseline in control INS-1 cells. In contrast, glucose failed to elicit a detectable increase in [cAMP] in Cav1.2/II-III cells (Figure 4B). Quantification of the change in mTurquoise/FRET ratio revealed that cAMP accumulation is significantly greater in control INS-1 cells compared to Cav1.2/II-III cells between the 250 and 400 sec time points (3 to 6 min post-stimulation). This time frame corresponds with a single cAMP oscillation, similar to those previously reported in β-cells in response to glucose (Idevall-Hagren et al., 2010). Since forskolin + IBMX stimulation of cAMP accumulation was not different between INS-1 cells and Cav1.2/II-III cells, the reduced capacity of glucose to stimulate cAMP accumulation in Cav1.2/II-III cells is upstream of adenylyl cyclase activation.
Figure 4. GS-cAMP is absent in Cav1.2/II-III cells.

A) Left panel- Ratiometric (mTurquoise2/FRET) traces of H187 expressed in INS-1 (blue circles) and Cav1.2/II-III cells (green circles) stimulated with forskolin (25 μM) + IBMX (100 μM) at the 60 sec time point. Right Panel- The change in mTurquoise2/FRET ratio from baseline is not different between control INS-1 cells (blue bars) and Cav1.2/II-III cells (green bars). Significance was determined using Student’s unpaired t-test, with P < 0.05 considered significant. The INS-1 trace is the average of 5 independent experiments (83 total cells), and the Cav1.2/II-III is the average of 6 independent experiments (113 total cells). B) Left Panel- Ratiometric (mTurquoise2/FRET) traces of H187 expressed in INS-1 (blue circles) and Cav1.2/II-III cells (green circles) stimulated with glucose (18 mM) at the 60 sec time point. Right Panel- The change in mTurquoise2/FRET ratio from baseline after glucose stimulation is significantly greater in control INS-1 cells (blue bars) than Cav1.2/II-III cells (green bars) at several time points (*, P < 0.05, Student’s unpaired t-test) The INS-1 cell trace is the average of 13 independent experiments (240 total cells), and the Cav1.2/II-III is the average of 8 independent experiments (156 total cells).
Nicardipine and ryanodine were used to further examine the role of Ca2+ influx mediated by L-type Ca2+ channels and CICR, respectively, in GS-cAMP in control INS-1 cells. Pre-treatment with either nicardipine (Figure 5A) or ryanodine (Figure 5B) completely abolished the glucose-stimulated rise in the ratio of mTurquoise to FRET. This result suggests that, although L-type Ca2+ channel-mediated Ca2+ influx is required for glucose-stimulated GS-cAMP, CICR downstream of Ca2+ influx greatly amplifies Ca2+-dependent cAMP accumulation. Quantification of the time courses shows that nicardipine significantly inhibited cAMP accumulation between the 200 to 500 sec time points (2 to 7 min post-stimulation), as well at 900 sec (14 min post-stimulation). In contrast, ryanodine significantly inhibited cAMP accumulation between the 250 and 450 sec time points (3 to 7 min post-stimulation). These time frames during which nicardipine and ryanodine significantly inhibit GS-cAMP are in good agreement with the time frame in which Cav1.2/II-III cells display reduced cAMP accumulation compared with control INS-1 cells (Figure 4B). Therefore, we conclude that CICR is required for maximal cAMP accumulation in response to glucose.
Figure 5. GS-cAMP is regulated by CICR in INS-1 cells.
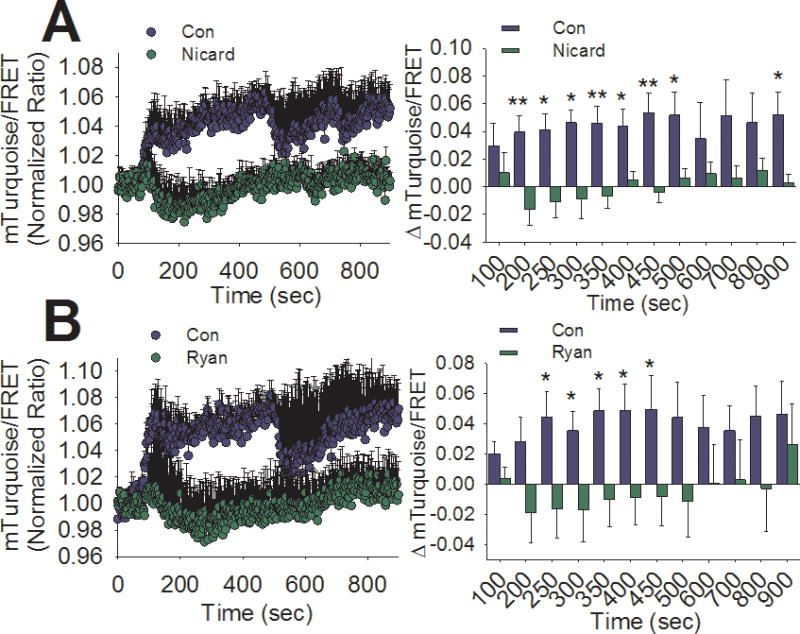
A) Left panel- Averaged ratiometric (mTurquoise2/FRET) traces of H187 expressed in INS-1 cells stimulated with glucose (18 mM) at 60 sec in the presence (green circles) or absence (blue circles) of nicardipine (2 μM). Right panel- The change in FRET/Cerulean ratio from baseline after glucose stimulation is significantly less in the nicardipine-treated (green bars) compared to untreated (blue bars) at several time points (**,P < 0.01,*, P < 0.05, Student’s unpaired t-test). Both traces are the average of 5 independent experiments (control: 86 total cells, nicardipine: 117 total cells). B) Left panel- Averaged ratiometric (mTurquoise2/FRET) traces of H187 expressed in INS-1 cells stimulated with glucose (18 mM) at 60 sec in the presence (green circles) or absence (blue circles) of ryanodine (20 μM). Right panel- The change in FRET/Cerulean ratio from baseline after glucose stimulation is significantly less in the ryanodine-treated group (green bars) compared to untreated (blue bars) at several time points (*,P < 0.05, Student’s unpaired t-test). Both traces are the average of 4 independent experiments (control: 73 total cells, ryanodine: 78 total cells).
3.5 GSEP is dependent upon Epac1 in control INS-1 cells and Cav1.2/II-III cells
Glucose stimulates both cAMP accumulation and ERK phosphorylation and activation in INS-1 cells; therefore, we examined which cAMP effector might be responsible for initiating ERK activation. Using a cell-based ELISA, we determined the effect of inhibitors of the cAMP effectors Epac1, Epac2 and PKA on ERK phosphorylation during 10 min of glucose stimulation. We found that neither the Epac2-selective inhibitor ESI-05 (10 μM) nor the PKA inhibitor Rp-cAMPS (100 μM) significantly inhibited GSEP in control INS-1 cells (Figure 6A). Surprisingly, pre-incubation of control INS-1 cells with Rp-cAMPS slightly, but significantly, potentiated GSEP. In contrast, pretreatment with the non-selective Epac inhibitor ESI-09 (10 μM) (Zhu et al., 2015) significantly inhibited GSEP in control INS-1 cells. Remarkably, this suggests that Epac1, but not PKA or Epac2, is required for GSEP in INS-1 cells. ESI-09 and nicardipine inhibit GSEP to the same degree, and the combination of ESI-09 and nicardipine doesn’t inhibit GSEP to a greater extent than either agent alone. To further support the notion that activation of Epac1 is required for GSEP, INS-1 cells were stimulated with the Epac1-selective activator 8- (Chlorophenylthio)-2′-O-methyl cAMP-acetoxymethyl ester (ESCA; 10 μM) (Schwede et al., 2015) in the absence of glucose (Figure 6B). We found that ESCA significantly stimulates ERK phosphorylation above baseline levels, suggesting that activation of Epac1 is sufficient to drive ERK phosphorylation. The stimulation of ERK phosphorylation by ESCA was significantly less than that stimulated by 50 nM GLP-1 in the absence of glucose (Figure 6B).
Figure 6. Role of cAMP in GSEP in INS-1 cells.

ERK phosphorylation was measured using a cell-based ELISA as described in Materials and Methods. A) Control INS-1 cells were stimulated with 18 mM glucose for 10 min in the presence or absence of the indicated agents. pERK/total ERK was determined for each treatment condition and normalized to pERK/total ERK in the presence of glucose alone. Nicardipine (2 μM) significantly inhibited GSEP. The PKA inhibitor Rp-cAMPS (100 μM) significantly enhanced GSEP, but the combination of nicardipine and Rp-cAMPS inhibited GSEP to a significantly greater extent than nicardipine alone. The Epac2-selective inhibitor ESI-05 (10 μM) didn’t significantly inhibit GSEP. The non-selective Epac inhibitor ESI-09 (10 μM) significantly inhibited GSEP. Combination of ESI-09 with either nicardipine or Rp-cAMPS didn’t inhibit GSEP to a significantly greater extent than ESI-09 alone (***, P < 0.001, **, P < 0.01 compared to glucose alone; ###, P < 0.001 compared to glucose + nicardipine; One-Way ANOVA, Holm-Sidak post-hoc test). Data shown are means ± SE of at least 3 independent experiments. B) INS-1 cells were stimulated with ESCA (10 μM) or GLP-1 (50 nM) for 2 min. pERK/total ERK was determined and normalized to the basal ratio. ERK phosphorylation was significantly stimulated by ESCA or GLP-1 in the absence of glucose. The ERK phosphorylation stimulated by GLP-1 was significantly greater than that stimulated by ESCA (***, P < 0.001;**, P < 0.01 compared to basal; ##, P < 0.01 compared to GLP-1, One-Way ANOVA, Holm-Sidak post-hoc test). Data shown are means ± SE of at least 3 independent experiments.
To directly assess the role of Epac1 in glucose-stimulated ERK activation, we measured ERK activation in control INS-1 cells using the FRET-based sensor EKAR in the presence and absence of subtype-selective Epac inhibitors (Figure 7A). We found that pre-treatment with the Epac1-selective inhibitor CE3F4 (20 μM) (Courilleau et al., 2012) significantly inhibited the late phase of ERK activation stimulated by glucose (9 to 13 min post-stimulation). In contrast, pre-treatment with the Epac2-selective inhibitor ESI-05 (10 μM) had no significant effect on the magnitude of the glucose-stimulated ERK activation at any time point during the experiment (Figure 7B). Taken together, our data strongly suggests that Epac1 is the link between cAMP accumulation and ERK activation stimulated with glucose in INS-1 cells.
Figure 7. Inhibition of Epac1 but not Epac2 diminishes glucose-stimulated ERK activation in INS-1 cells.

A) Left panel- Averaged ratiometric (FRET/Cerulean) traces of EKAR expressed in INS-1 cells stimulated with glucose (18 mM) at 60 sec in the presence (green circles) or absence (blue circles) of the Epac1-selective inhibitor CE3F4 (20 μM). Right panel- The change in FRET/Cerulean ratio from baseline after glucose stimulation is significantly less in the CE3F4-treated group (green bars) compared to untreated (blue bars) at several time points (*, P < 0.05, Student’s unpaired t-test). Both traces are the average of 3 independent experiments (control: 63 total cells, CE3F4: 44 total cells). B) Left panel- Averaged ratiometric (FRET/Cerulean) traces of EKAR expressed in INS-1 cells stimulated with glucose (18 mM) at 60 sec in the presence (green circles) or absence (blue circles) of the Epac2-selective inhibitor ESI-05 (10 μM). Right panel- The change in FRET/Cerulean ratio from baseline after glucose stimulation is not different between ESI-05-treated (green bars) and untreated (blue bars). Significance was determined using Student’s unpaired t-test, with P < 0.05 considered significant. Both traces are the average of 3 independent experiments (control: 111 total cells, ESI-05: 111 total cells).
3.6 GS-cAMP near the plasma membrane drives GSEP in Cav1.2/II-III cells
Since GS-cAMP was sharply reduced in Cav1.2/II-III cells compared to control INS-1 cells (Figure 4B), we expected that inhibitors of cAMP signaling wouldn’t affect GSEP in Cav1.2/II-III cells. As in control INS-1 cells, 2 μM nicardipine significantly inhibited GSEP, and the PKA inhibitor Rp-cAMPS didn’t inhibit GSEP in Cav1.2/II-III cells as assessed with the cell based ELISA (Figure 8A). However, the non-selective Epac inhibitor ESI-09 significantly inhibited GSEP in Cav1.2./II-III cells (Figure 8A). Combining ESI-09 with Rp-cAMPS did not inhibit GSEP to a greater extent than ESI-09 alone (Figure 8A). Thus, despite the lack of CICR-driven cAMP accumulation in Cav1.2/II-III cells in response to glucose, cAMP apparently plays a role in GSEP in these cells. It’s possible that local Ca2+ influx via L-type Ca2+ channels is sufficient to trigger cAMP accumulation at the plasma membrane and drive some level of ERK activation through Epac1. To examine whether membrane-localized cAMP accumulation is stimulated by glucose, an Epac2-based FRET sensor containing a Myristoylation/Palmitoylation sequence was expressed in Cav1.2/II-III cells (Agarwal et al., 2014) (Figure 8B). Using this membrane-targeted sensor of cAMP, we detected sustained cAMP accumulation in response to forskolin + IBMX or 18 mM glucose in Cav1.2/II-III cells (Figure 8C&D). Further, GS-cAMP at the plasma membrane was inhibited by the L-type Ca2+ channel blocker isradipine (2 μM) (Figure 8C&D). Taken together, our results suggest that CICR is required for maximum cAMP production and ERK activation in response to glucose in INS-1 cells. However, Ca2+ influx mediated by L-type Ca2+ channels is sufficient to drive local cAMP signaling and maintain a decreased level of glucose-stimulated ERK activity in the absence of CICR (Figure 9).
Figure 8. Plasma membrane-localized accumulation of cAMP in response to glucose in Cav1.2/II-III cells.
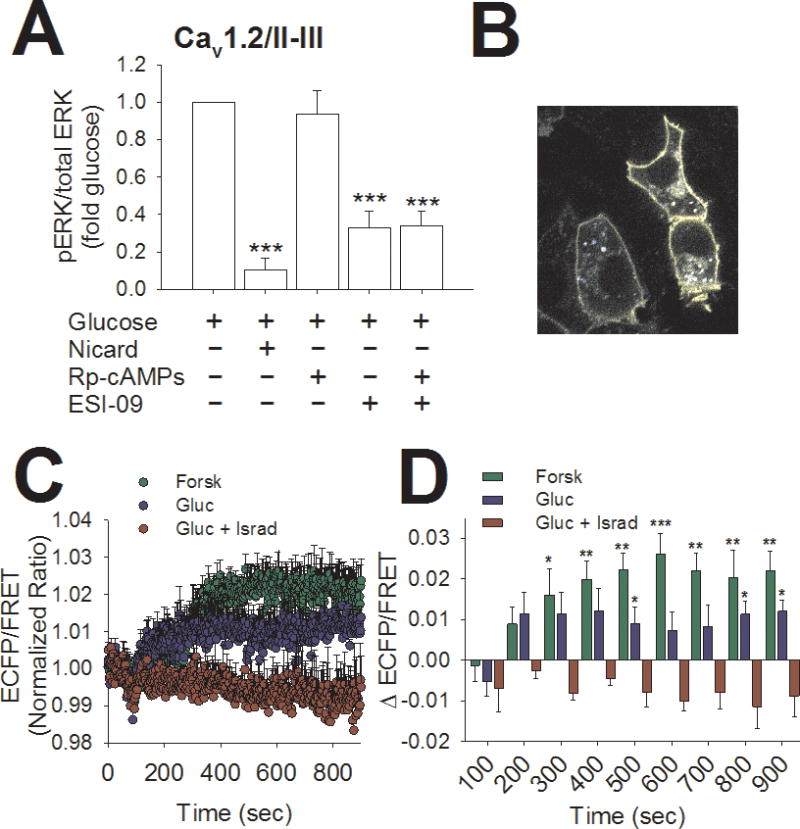
A) Cav1.2/II-III cells were stimulated with 18 mM glucose for 10 min in the presence or absence of the indicated agents. Using cell-based ELISA, pERK/total ERK was determined for each treatment condition and normalized to pERK/total ERK in the presence of glucose alone. The L-type Ca2+ channel blocker nicardipine (2 μM) and the non-selective Epac inhibitor ESI-09 (10 μM) both significantly inhibited GSEP. The combination of nicardipine and ESI-09 didn’t inhibit GSEP to a significantly greater extent than either agent alone. In contrast, the PKA inhibitor Rp-cAMPS (100 μM) did not significantly inhibit GSEP in Cav1.2/II-III cells (***, P < 0.001, **, P < 0.01 compared to glucose alone, One-Way ANOVA, Holm-Sidak post-hoc test). Data shown are means ± SE of at least 3 independent experiments. B) 60x magnification image of the Epac-MyrPalm sensor expressed in INS-1 cells. Note the specific localization of the probe to the plasma membrane. C) Averaged ratiometric (ECFP/FRET) traces of Epac-MyrPalm expressed in Cav1.2/II-III cells. Cells were stimulated at 60 sec with 25 μM forskolin + 100 μM IBMX (green circles) or 18 mM glucose in the presence (red circles) or absence (blue circles) of the L-type Ca2+ channel blocker isradipine (2 μM). D) The change in the ECFP/ FRET ratio from baseline after stimulation with forskolin + IBMX or glucose is significantly greater than glucose + isradipine at several time points (***,P < 0.001, **, P < 0.01,*, P < 0.05 compared to glucose + isradipine; One-Way ANOVA, Holm-Sidak post-hoc test). The traces showing stimulation with forskolin + IBMX or glucose alone are the average of 5 independent experiments (forskolin: 124 total cells, glucose: 137 total cells), and the trace showing glucose + isradipine is the average of 4 independent experiments (95 total cells).
Figure 9. Model for the activation of ERK by glucose in INS-1 cells.

In control INS-1 cells, glucose stimulates membrane depolarization and activation of Cav1.2. Ca2+ influx via Cav1.2 can directly stimulate adenylyl cyclase activity (presumably AC8; (Delmeire et al., 2003), but cAMP accumulation is amplified by CICR from the ER. Epac1 is subsequently activated by cAMP accumulation, leading to the activation of the Rap1/B-Raf/MEK pathway, and phosphorylation of ERK. In Cav1.2/II-III cells, Cav1.2 is no longer efficiently coupled to CICR, and cAMP accumulation is mediated solely by Ca2+ influx across the plasma membrane via Cav1.2. In the face of reduced cAMP accumulation, ERK activation is delayed and reduced compared to control INS-1 cells.
4. Discussion
Role of Ca2+in ERK Activation
Consistent with previous reports, we found that GSEP in β-cells is driven by Ca2+ influx through L-type Ca2+ channels (Figure 2A). Whether Ca2+ influx is directly involved in GSEP, or if CICR is required to amplify the response, has been less clear. Depletion of ER Ca2+ using the SERCA inhibitor thapsigargin or inhibition of the ryanodine receptor hinders GSEP in INS-1 cells (Arnette et al., 2003); however, in MIN6 cells, pharmacological manipulation of CICR does not inhibit ERK phosphorylation stimulated with glucose and GLP-1 (Selway et al., 2012). Thus, the contribution of CICR to ERK phosphorylation may depend on the model system or stimulus. In our studies, we found that INS-1 cells that are deficient in CICR (Cav1.2/II-III cells) have a reduced capacity to stimulate ERK phosphorylation and activation in response to glucose (Figure 1 and Figure 3A). Further, ryanodine significantly diminishes glucose-stimulated ERK phosphorylation and activation in control INS-1 cells but has no effect in Cav1.2/II-III cells (Figure 2B and Figure 3B). This suggests that CICR is required to efficiently activate ERK in response to glucose. We also observed a significantly greater inhibitory effect of nicardipine on GSEP in comparison with ryanodine (Figure 2A). Taken together, Ca2+ influx through L-type Ca2+ channels is sufficient to drive glucose-stimulated ERK activation; however, CICR is required to achieve the maximal response.
Role of CICR in GS-cAMP
We found that glucose stimulates cAMP accumulation in INS-1 cells, and this is completely inhibited by the L-type Ca2+ channel blocker nicardipine (Figure 4B and Figure 5A). This is consistent with previous reports that revealed GS-cAMP in pancreatic β-cells is dependent on Ca2+ influx through L-type Ca2+ channels (Kitaguchi et al., 2013) (Landa et al., 2005). To examine the role of CICR in this process, we measured cAMP accumulation in Cav1.2/II-III cells using the cytoplasmic cAMP sensor H187 and found that glucose did not stimulate a detectable increase in cAMP, suggesting that CICR is also required for maximal GS-cAMP (Figure 4A). In further support of this notion, ryanodine completely inhibited cAMP accumulation in response to glucose in control INS-1 cells (Figure 5B). In contrast to our results, release of Ca2+ from the ER with the muscarinic agonist carbachol or the sarco-endoplasmic reticulum Ca2+-ATPase inhibitor thapsigargin did not provoke cAMP accumulation in MIN6 cells (Kitaguchi et al., 2013); however, the role of CICR in glucose stimulated L-type channel-dependent cAMP accumulation was not specifically assessed in that study. Nevertheless, it’s possible that the role of Ca2+ release from the ER in β-cell cAMP accumulation may be species-specific since MIN6 cells are of mouse origin (Ohgawara et al., 1995), and INS-1 cells are derived from a rat insulinoma (Asfari et al., 1992). Even though experiments with H187 failed to detect GS-cAMP in Cav1.2/II-III cells, we found that glucose stimulated local cAMP accumulation at the plasma membrane in these cells that was sensitive to inhibition of L-type Ca2+ channels (Figure 8C&D). The observation that GSEP was completely inhibited by nicardipine and markedly inhibited by ESI-09 cells argues that, in Cav1.2/II-III cells, GSEP is driven by activation of adenylyl cyclase by Ca2+ influx across the plasma membrane via L-type Ca2+ channels.
It has been reported previously that Ca2+ influx via L-type channels stimulates ERK phosphorylation in INS-1 cells via activation of the Ca2+-dependent phosphatase calcineurin (Arnette et al., 2003). ERK exerts feedback inhibition on the kinase B-Raf by phosphorylating it, and calcineurin relieves this inhibition by dephosphorylating B-Raf (Duan and Cobb, 2010). We propose that our findings complement those of Duon and Cobb, such that Ca2+-dependent activation of adenylyl cyclase mediated by L-type channels initiates GSEP, while Ca2+ activation of calcineurin maintains ERK activity by maintaining B-Raf activity. Interestingly, both GS-cAMP (present study) and glucose-stimulated activation of calcineurin (Arnette et al., 2003) utilize Ca2+ released from the ER. Thus, disruption of CICR in pancreatic β-cells could be detrimental to β cell function and survival.
Role of PKA in GSEP
Given our observations that CICR regulates both ERK activity and cAMP accumulation stimulated by glucose, we examined the role of several cAMP effectors in GSEP. It has been reported previously that PKA is required for GSEP in INS-1 cells (Briaud et al., 2003); however, this conclusion was based upon results with the PKA inhibitor H89, which has since been shown to be far from selective (Murray, 2008). Further, another group reported that neither H89 nor the PKA-selective inhibitor Rp-cAMPS had any effect on GSEP in INS-1 cells (Gibson et al., 2006). Surprisingly, we found that Rp-cAMPS significantly potentiates ERK phosphorylation in control INS-1 but not Cav1.2/II-III cells, suggesting that PKA has an inhibitory effect on ERK activation which may be dependent on CICR (Figure 6A and Figure 8A). PKA phosphorylates and inhibits Raf-1 activation (Dhillon et al., 2002), and Raf-1 can contribute to ERK activation in pancreatic β cells (Wang et al., 2010). Therefore, we speculate that in INS-1 cells, CICR-induced cAMP accumulation activates PKA, which subsequently inhibits Raf-1 activity. Thus, inhibition of PKA with Rp-cAMPS could allow Raf1 to contribute to ERK activation.
Role of Epac1 in GSEP
The role of Epac1 and Epac2 in GSEP has not been previously demonstrated; therefore, we utilized the Epac2-selective inhibitor ESI-05 and the non-selective inhibitor ESI-09. It has been previously reported that ESI-09 acts as a nonspecific protein denaturant, rather than an inhibitor of Epac (Rehmann, 2013). However, a subsequent study reaffirmed the specificity of ESI-09 activity at Epac1 and Epac2 at concentrations less than 20 μM (Zhu et al., 2015). Using cell-based ELISA to measure ERK phosphorylation, we found that 10 μM ESI-05 had no effect on GSEP in control INS-1 cells; however, 10 μM ESI-09 significantly inhibited GSEP in both the INS-1 and Cav1.2/II-III cell lines (Figure 6A and Figure 8A). Further, ESCA, which was recently shown to be an Epac1-selecive activator (Schwede et al., 2015), can stimulate ERK phosphorylation in INS-1 cells in the absence of glucose (Figure 6B). To corroborate our findings from the cell-based ELISA, we examined the effect of pre-treatment with the Epac1-selective antagonist CE3F4 on ERK activation using EKAR. Figure 7A shows that CE3F4 significantly inhibited glucose-stimulated ERK activation at several late time points, indicating that Epac1 is indeed required for ERK activity in response to glucose in INS-1 cells. In contrast, consistent with the results with the cell based ELISA, the Epac2-selective inhibitor ESI-05 didn’t inhibit ERK activation as detected with the EKAR sensor in control INS-1 cells (Figure 7B).
The role of the more highly expressed isoform Epac2 is well-documented in β-cells, but the importance of Epac1 to β-cell function is less clear (Leech et al., 2000). However, Epac1−/− mice showed glucose intolerance and Epac−/− β cells demonstrated reduced proliferation in response to the GLP-1 receptor agonist exendin-4 (Kai et al., 2013). Thus, Epac1 may serve an underappreciated role in maintaining β-cell mass through regulation of ERK activation. Both Epac1 and Epac2 serve as guanine nucleotide exchange factors for the G-protein Rap1, and it has been reported that PKA-independent activation of ERK is mediated by a mechanism dependent on an interaction between Rap1 and B-Raf (Dugan et al., 1999) (Vossler et al., 1997). Interestingly, calcitonin stimulation of cAMP accumulation caused ERK phosphorylation which was dependent on Epac1, Rap1 and B-Raf in renal ductal cells (Laroche-Joubert et al., 2002). We propose that a similar mechanism is active in INS-1 cells where GS-cAMP causes activation of Epac1 and subsequent activation of Rap1/B-Raf/MEK/ERK signaling.
5. Conclusions
This study provides strong evidence that Ca2+ influx through L-type Ca2+ channels drives GS- cAMP and GSEP, which is amplified by CICR, in INS-1 cells. Derangements of Ca2+ signaling, including dispersion of Ca2+ entry sites, and diminished cAMP production have been reported in β-cells under diabetic conditions (Collins et al., 2010) (Hoppa et al., 2009) (Kong et al., 2015). It’s conceivable that CICR is also disrupted in diabetic β-cells, and CICR-driven cAMP accumulation is consequently reduced. cAMP is strongly linked to β-cell proliferation and survival, and it was recently suggested that cAMP-sparing phosphodiesterase inhibitors should be repurposed as medications to enhance β-cell replication in diabetics (Zhao et al., 2014). Remarkably, our studies suggest that Epac1 links GS-cAMP with GSEP; thus, increasing Epac1 activity may also result in increased β-cell replication. Finally, activation of cAMP response element binding protein (CREB) is also linked to β-cell proliferation (Jhala et al., 2003). It will be of interest to explore the role of GS-cAMP and CICR in the activation of CREB, since its activity is regulated by cAMP and Ca2+.
Supplementary Material
A) INS- cells, Ca1.2/II-III cells or Cav1.3/II-III cells were stimulated with 18 mM glucose + 50 nM GLP-1 for the indicated times. The far right lane shows the basal (B) level of pERK the absence of glucose stimulation. Western blots shown are representative of at least three separate experiments. B) INS-1 cells, Cav1.2/II-III cells, and Cav1.3/II-III cells were stimulated with 18 mM glucose + GLP-1 for the indicated times shown on the x-axis. Total ERK and pERK were detected and quantified using a cell-based ELISA. The ratio of pERK to total ERK was determined at each time point and normalized to pERK/total ERK prior to glucose stimulation (0 min). Glucose + GLP-1-stimulated ERK phosphorylation was significantly reduced in Cav1.2/II-III cells compared to control INS-1 cells at the 2 min time point (***, P < 0.001 One Way ANOVA, Holm-Sidak post-hoc test). In contrast, glucose+GLP-1-stimulated ERK phosphorylation was not different between INS-1 cells and Cav1.3/II-III cells at any time point. Data shown are the mean ± SE of at least three independent experiments.
A) INS- cells, Ca1.2/II-III cells or Cav1.3/II-III cells were stimulated with 50 nM GLP-1 in KRBH for the indicated times. The far right lane shows the basal (B) level of pERK the absence of glucose stimulation. Western blots shown are representative of at least three separate experiments. B) INS-1 cells, Cav1.2/II-III cells, and Cav1.3/II-III cells were stimulated with 50 nM GLP-1 for the indicated times shown on the x- axis. Total ERK and pERK were detected and quantified using a cell-based ELISA. The ratio of pERK to total ERK was determined at each time point and normalized to pERK/total ERK prior to glucose stimulation (0 min). GLP-1-stimulated ERK phosphorylation was significantly increased in Cav1.2/II-III cells compared to control INS-1 cells at the 10 and 30 min time points (*, P < 0.05 One Way ANOVA, Holm-Sidak post-hoc test). In contrast, glucose+GLP-1-stimulated ERK phosphorylation was not different between INS-1 cells and Cav1.3/II-III cells at any time point. Data shown are the mean ± SE of at least three independent experiments.
Ca2+-dependent, glucose-stimulated cAMP accumulation initiates ERK activation in INS-1 cells.
Both CICR and Ca2+ flux across the membrane contribute to this process.
Disruption of CICR has a strong inhibitory effect on the kinetics of glucose-stimulated ERK activation.
EPAC1 is the crucial cAMP effector that transduces a rise in cAMP concentration into activation of the B-Raf/MEK/ERK pathway.
Acknowledgments
This work was supported by a grant from the National Institute of Diabetes and Digestive and Kidney Disease (R01 DK064736) (to G.H.H.) and a Purdue Research Foundation Grant (to M.L.G. and G.H.H.). We thank Dr. Robert D. Harvey, University of Nevada School of Medicine, for the gift of the Epac2-MyrPalm cAMP sensor, and Dr. Kees Jalink, The Netherlands Cancer Institute, for the gift of the H187 cAMP sensor. The ERK activity sensor EKAR was obtained from Addgene.
Footnotes
Publisher's Disclaimer: This is a PDF file of an unedited manuscript that has been accepted for publication. As a service to our customers we are providing this early version of the manuscript. The manuscript will undergo copyediting, typesetting, and review of the resulting proof before it is published in its final citable form. Please note that during the production process errors may be discovered which could affect the content, and all legal disclaimers that apply to the journal pertain.
References
- Agarwal SR, Yang PC, Rice M, Singer CA, Nikolaev VO, Lohse MJ, Clancy CE, Harvey RD. Role of membrane microdomains in compartmentation of cAMP signaling. PloS one. 2014;9(4):e95835. doi: 10.1371/journal.pone.0095835. [DOI] [PMC free article] [PubMed] [Google Scholar]
- Arnette D, Gibson TB, Lawrence MC, January B, Khoo S, McGlynn K, Vanderbilt CA, Cobb MH. Regulation of ERK1 and ERK2 by glucose and peptide hormones in pancreatic beta cells. J Biol Chem. 2003;278(35):32517–32525. doi: 10.1074/jbc.M301174200. [DOI] [PubMed] [Google Scholar]
- Asfari M, Janjic D, Meda P, Li G, Halban PA, Wollheim CB. Establishment of 2-mercaptoethanol-dependent differentiated insulin-secreting cell lines. Endocrinology. 1992;130(1):167–178. doi: 10.1210/endo.130.1.1370150. [DOI] [PubMed] [Google Scholar]
- Bashan N, Dorfman K, Tarnovscki T, Harman-Boehm I, Liberty IF, Bluher M, Ovadia S, Maymon-Zilberstein T, Potashnik R, Stumvoll M, Avinoach E, Rudich A. Mitogen-activated protein kinases, inhibitory-kappaB kinase, and insulin signaling in human omental versus subcutaneous adipose tissue in obesity. Endocrinology. 2007;148(6):2955–2962. doi: 10.1210/en.2006-1369. [DOI] [PubMed] [Google Scholar]
- Bouzakri K, Roques M, Gual P, Espinosa S, Guebre-Egziabher F, Riou JP, Laville M, Le Marchand-Brustel Y, Tanti JF, Vidal H. Reduced activation of phosphatidylinositol-3 kinase and increased serine 636 phosphorylation of insulin receptor substrate-1 in primary culture of skeletal muscle cells from patients with type 2 diabetes. Diabetes. 2003;52(6):1319–1325. doi: 10.2337/diabetes.52.6.1319. [DOI] [PubMed] [Google Scholar]
- Briaud I, Lingohr MK, Dickson LM, Wrede CE, Rhodes CJ. Differential activation mechanisms of Erk-1/2 and p70(S6K) by glucose in pancreatic beta-cells. Diabetes. 2003;52(4):974–983. doi: 10.2337/diabetes.52.4.974. [DOI] [PubMed] [Google Scholar]
- Carlson CJ, Koterski S, Sciotti RJ, Poccard GB, Rondinone CM. Enhanced basal activation of mitogen-activated protein kinases in adipocytes from type 2 diabetes: potential role of p38 in the downregulation of GLUT4 expression. Diabetes. 2003;52(3):634–641. doi: 10.2337/diabetes.52.3.634. [DOI] [PubMed] [Google Scholar]
- Collins SC, Hoppa MB, Walker JN, Amisten S, Abdulkader F, Bengtsson M, Fearnside J, Ramracheya R, Toye AA, Zhang Q, Clark A, Gauguier D, Rorsman P. Progression of diet-induced diabetes in C57BL6J mice involves functional dissociation of Ca2(+) channels from secretory vesicles. Diabetes. 2010;59(5):1192–1201. doi: 10.2337/db09-0791. [DOI] [PMC free article] [PubMed] [Google Scholar]
- Corilleau D, Bissener M, Jullian JC, Lucas A, Bouyssou P, Fischmeister R, Blondeau JP, Lezoualc’h F. Identifaction of a tetrhydroquinoline analog as a pharmacological inhibitor of the cAMP-binding protein Epac. J Biol Chem. 2012;287(53):44192–44202. doi: 10.1074/jbc.M112.422956. [DOI] [PMC free article] [PubMed] [Google Scholar]
- Delmeire D, Flamez D, Hinke SA, Cali JJ, Pipeleers D, Schuit F. Type VIII adenylyl cyclase in rat beta cells: coincidence signal detector/generator for glucose and GLP-1. Diabetologia. 2003;46(10):1383–1393. doi: 10.1007/s00125-003-1203-8. [DOI] [PubMed] [Google Scholar]
- Dhillon AS, Meikle S, Yazici Z, Eulitz M, Kolch W. Regulation of Raf-1 activation and signalling by dephosphorylation. EMBO J. 2002;21(1–2):64–71. doi: 10.1093/emboj/21.1.64. [DOI] [PMC free article] [PubMed] [Google Scholar]
- Duan L, Cobb MH. Calcineurin increases glucose activation of ERK by reversing negative feedback. Proceedings of the National Academy of Sciences of the United States of America. 2010;107(51):22314–22319. doi: 10.1073/pnas.1016630108. [DOI] [PMC free article] [PubMed] [Google Scholar]
- Dugan LL, Kim JS, Zhang Y, Bart RD, Sun Y, Holtzman DM, Gutmann DH. Differential effects of cAMP in neurons and astrocytes. Role of B-raf J Biol Chem. 1999;274(36):25842–25848. doi: 10.1074/jbc.274.36.25842. [DOI] [PubMed] [Google Scholar]
- Gibson TB, Lawrence MC, Gibson CJ, Vanderbilt CA, McGlynn K, Arnette D, Chen W, Collins J, Naziruddin B, Levy MF, Ehrlich BE, Cobb MH. Inhibition of glucose-stimulated activation of extracellular signal-regulated protein kinases 1 and 2 by epinephrine in pancreatic beta-cells. Diabetes. 2006;55(4):1066–1073. doi: 10.2337/diabetes.55.04.06.db05-1266. [DOI] [PubMed] [Google Scholar]
- Gomez E, Pritchard C, Herbert TP. cAMP-dependent protein kinase and Ca2+ influx through L-type voltage-gated calcium channels mediate Raf-independent activation of extracellular regulated kinase in response to glucagon-like peptide-1 in pancreatic beta-cells. J Biol Chem. 2002;277(50):48146–48151. doi: 10.1074/jbc.M209165200. [DOI] [PubMed] [Google Scholar]
- Harvey CD, Ehrhardt AG, Cellurale C, Zhong H, Yasuda R, Davis RJ, Svoboda K. A genetically encoded fluorescent sensor of ERK activity. Proc Nat’l Acad Sci USA. 2008;105(49):19264–19269. doi: 10.1073/pnas.0804598105. [DOI] [PMC free article] [PubMed] [Google Scholar]
- Hockerman GH, Peterson BZ, Johnson BD, Catterall WA. Molecular determinants of drug binding and action on L-type calcium channels. Ann Rev Pharmacol Toxicol. 1997;37:361–396. doi: 10.1146/annurev.pharmtox.37.1.361. [DOI] [PubMed] [Google Scholar]
- Hoppa MB, Collins S, Ramracheya R, Hodson L, Amisten S, Zhang Q, Johnson P, Ashcroft FM, Rorsman P. Chronic palmitate exposure inhibits insulin secretion by dissociation of Ca(2+) channels from secretory granules. Cell Metab. 2009;10(6):455–465. doi: 10.1016/j.cmet.2009.09.011. [DOI] [PMC free article] [PubMed] [Google Scholar]
- Idevall-Hagren O, Barg S, Gylfe E, Tengholm A. cAMP mediators of pulsatile insulin secretion from glucose-stimulated single beta-cells. J Biol Chem. 2010;285(30):23007–23018. doi: 10.1074/jbc.M109.095992. [DOI] [PMC free article] [PubMed] [Google Scholar]
- Jacobo SM, Guerra ML, Jarrard RE, Przybyla JA, Liu G, Watts VJ, Hockerman GH. The intracellular II-III loops of Cav1.2 and Cav1.3 uncouple L-type voltage-gated Ca2+ channels from glucagon-like peptide-1 potentiation of insulin secretion in INS-1 cells via displacement from lipid rafts. J Pharmacol Exp Ther. 2009;330(1):283–293. doi: 10.1124/jpet.109.150672. [DOI] [PMC free article] [PubMed] [Google Scholar]
- Jhala US, Canettieri G, Screaton RA, Kulkarni RN, Krajewski S, Reed J, Walker J, Lin X, White M, Montminy M. cAMP promotes pancreatic beta-cell survival via CREB-mediated induction of IRS2. Gene Dev. 2003;17(13):1575–1580. doi: 10.1101/gad.1097103. [DOI] [PMC free article] [PubMed] [Google Scholar]
- Kai AK, Lam AK, Chen Y, Tai AC, Zhang X, Lai AK, Yeung PK, Tam S, Wang J, Lam KS, Vanhoutte PM, Bos JL, Chung SS, Xu A, Chung SK. Exchange protein activated by cAMP 1 (Epac1)-deficient mice develop beta-cell dysfunction and metabolic syndrome. FASEB J. 2013;27(10):4122–4135. doi: 10.1096/fj.13-230433. [DOI] [PubMed] [Google Scholar]
- Kang G, Holz GG. Amplification of exocytosis by Ca2+-induced Ca2+ release in INS-1 pancreatic beta cells. J Physiol. 2003;546(Pt 1):175–189. doi: 10.1113/jphysiol.2002.029959. [DOI] [PMC free article] [PubMed] [Google Scholar]
- Khoo S, Cobb MH. Activation of mitogen-activating protein kinase by glucose is not required for insulin secretion. Proc Nat’l Acad Sci USA. 1997;94(11):5599–5604. doi: 10.1073/pnas.94.11.5599. [DOI] [PMC free article] [PubMed] [Google Scholar]
- Khoo S, Griffen SC, Xia Y, Baer RJ, German MS, Cobb MH. Regulation of insulin gene transcription by ERK1 and ERK2 in pancreatic beta cells. J Biol Chem. 2003;278(35):32969–32977. doi: 10.1074/jbc.M301198200. [DOI] [PubMed] [Google Scholar]
- Kitaguchi T, Oya M, Wada Y, Tsuboi T, Miyawaki A. Extracellular calcium influx activates adenylate cyclase 1 and potentiates insulin secretion in MIN6 cells. Biochem J. 2013;450(2):365–373. doi: 10.1042/BJ20121022. [DOI] [PubMed] [Google Scholar]
- Klarenbeek J, Goedhart J, van Batenburg A, Groenewald D, Jalink K. Fourth-Generation Epac-Based FRET Sensors for cAMP Feature Exceptional Brightness, Photostability and Dynamic Range: Characterization of Dedicated Sensors for FLIM, for Ratiometry and with High Affinity. PloS one. 2015;10(4):e0122513. doi: 10.1371/journal.pone.0122513. [DOI] [PMC free article] [PubMed] [Google Scholar]
- Kong X, Yan D, Wu X, Guan Y, Ma X. Glucotoxicity inhibits cAMP-protein kinase A-potentiated glucose-stimulated insulin secretion in pancreatic beta-cellscAMP-PKAbeta. J Diabetes. 2015;7(3):378–385. doi: 10.1111/1753-0407.12185. [DOI] [PubMed] [Google Scholar]
- Landa LR, Jr, Harbeck M, Kaihara K, Chepurny O, Kitiphongspattana K, Graf O, Nikolaev VO, Lohse MJ, Holz GG, Roe MW. Interplay of Ca2+ and cAMP signaling in the insulin-secreting MIN6 beta-cell line. J Biol Chem. 2005;280(35):31294–31302. doi: 10.1074/jbc.M505657200. [DOI] [PMC free article] [PubMed] [Google Scholar]
- Laroche-Joubert N, Marsy S, Michelet S, Imbert-Teboul M, Doucet A. Protein kinase A-independent activation of ERK and H,K-ATPase by cAMP in native kidney cells: role of Epac I. J Biol Chem. 2002;277(21):18598–18604. doi: 10.1074/jbc.M201868200. [DOI] [PubMed] [Google Scholar]
- Lawrence M, Shao C, Duan L, McGlynn K, Cobb MH. The protein kinases ERK and their roles in pancreatic beta cells. Acta physiol. 2008;192(1):11–17. doi: 10.1111/j.1748-1716.2007.01785.x. [DOI] [PubMed] [Google Scholar]
- Leech CA, Holz GG, Chepurny O, Habener JF. Expression of cAMP-regulated guanine nucleotide exchange factors in pancreatic beta-cells. Biochem Biophys Res Comm. 2000;278(1):44–47. doi: 10.1006/bbrc.2000.3763. [DOI] [PMC free article] [PubMed] [Google Scholar]
- Liu G, Dilmac N, Hilliard N, Hockerman GH. Ca v 1.3 is preferentially coupled to glucose-stimulated insulin secretion in the pancreatic beta-cell line INS-1. J Pharmacol Exp Ther. 2003;305(1):271–278. doi: 10.1124/jpet.102.046334. [DOI] [PubMed] [Google Scholar]
- Liu G, Jacobo SM, Hilliard N, Hockerman GH. Differential modulation of Cav1.2 and Cav1.3-mediated glucose-stimulated insulin secretion by cAMP in INS-1 cells: distinct roles for exchange protein directly activated by cAMP 2 (Epac2) and protein kinase A. J Pharmacol Exp Ther. 2006;318(1):152–160. doi: 10.1124/jpet.105.097477. [DOI] [PubMed] [Google Scholar]
- Maedler K, Storling J, Sturis J, Zuellig RA, Spinas GA, Arkhammar PO, Mandrup-Poulsen T, Donath MY. Glucose- and interleukin-1beta-induced beta-cell apoptosis requires Ca2+ influx and extracellular signal-regulated kinase (ERK) 1/2 activation and is prevented by a sulfonylurea receptor 1/inwardly rectifying K+ channel 6.2 (SUR/Kir6.2) selective potassium channel opener in human islets. Diabetes. 2004;53(7):1706–1713. doi: 10.2337/diabetes.53.7.1706. [DOI] [PubMed] [Google Scholar]
- Murray AJ. Pharmacological PKA inhibition: all may not be what it seems. Sci Signal. 2008;1(22):re4. doi: 10.1126/scisignal.122re4. [DOI] [PubMed] [Google Scholar]
- Ohgawara H, Miyazaki J, Karibe S, Tashiro F, Akaike T, Hashimoto Y. Embedded-culture of pancreatic beta-cells derived from transgenic mouse insulinoma as a potential source for xenotransplantation using a diffusion chamber. Cell Transplant. 1995;4(3):307–313. doi: 10.1177/096368979500400309. [DOI] [PubMed] [Google Scholar]
- Rehmann H. Epac-inhibitors: facts and artefacts. Scientific reports. 2013;3:3032. doi: 10.1038/srep03032. [DOI] [PMC free article] [PubMed] [Google Scholar]
- Schwede F, Bertinetti D, Langerijs CN, Hadders MA, Wienk H, Ellenbroek JH, de Koning EJ, Bos JL, Herberg FW, Genieser HG, Janssen RA, Rehmann H. Structure-guided design of selective Epac1 and Epac2 agonists. PLoS biology. 2015;13(1):e1002038. doi: 10.1371/journal.pbio.1002038. [DOI] [PMC free article] [PubMed] [Google Scholar]
- Seino S, Chen L, Seino M, Blondel O, Takeda J, Johnson JH, Bell GI. Cloning of the alpha 1 subunit of a voltage-dependent calcium channel expressed in pancreatic beta cells. Proc Nat’l Acad Sci USA. 1992;89(2):584–588. doi: 10.1073/pnas.89.2.584. [DOI] [PMC free article] [PubMed] [Google Scholar]
- Selway J, Rigatti R, Storey N, Lu J, Willars GB, Herbert TP. Evidence that Ca2+ within the microdomain of the L-type voltage gated Ca2+ channel activates ERK in MIN6 cells in response to glucagon-like peptide-1. PloS one. 2012;7(3):e33004. doi: 10.1371/journal.pone.0033004. [DOI] [PMC free article] [PubMed] [Google Scholar]
- Ueda Y, Hirai S, Osada S, Suzuki A, Mizuno K, Ohno S. Protein kinase C activates the MEK-ERK pathway in a manner independent of Ras and dependent on Raf. J Biol Chem. 1996;271(38):23512–23519. doi: 10.1074/jbc.271.38.23512. [DOI] [PubMed] [Google Scholar]
- Vossler MR, Yao H, York RD, Pan MG, Rim CS, Stork PJ. cAMP activates MAP kinase and Elk-1 through a B-Raf- and Rap1-dependent pathway. Cell. 1997;89(1):73–82. doi: 10.1016/s0092-8674(00)80184-1. [DOI] [PubMed] [Google Scholar]
- Wang H, Gambosova K, Cooper ZA, Holloway MP, Kassai A, Izquierdo D, Cleveland K, Boney CM, Altura RA. EGF regulates survivin stability through the Raf-1/ERK pathway in insulin-secreting pancreatic beta-cells. BMC Mol Biol. 2010;11:66. doi: 10.1186/1471-2199-11-66. [DOI] [PMC free article] [PubMed] [Google Scholar]
- Wang Y, Jarrard RE, Pratt EP, Guerra ML, Salyer AE, Lange AM, Soderling IM, Hockerman GH. Uncoupling of Ca1.2 from Ca-induced Ca release and SK channel regulation in pancreatic beta-cells. Mol Endocrinol. 2014;28:458–476. doi: 10.1210/me.2013-1094. [DOI] [PMC free article] [PubMed] [Google Scholar]
- Xu W, Lipscombe D. Neuronal Ca(V)1.3alpha(1) L-type channels activate at relatively hyperpolarized membrane potentials and are incompletely inhibited by dihydropyridines. J Neurosci. 2001;21(16):5944–5951. doi: 10.1523/JNEUROSCI.21-16-05944.2001. [DOI] [PMC free article] [PubMed] [Google Scholar]
- Yeo RW, Yang K, Li G, Lim SK. High glucose predisposes gene expression and ERK phosphorylation to apoptosis and impaired glucose-stimulated insulin secretion via the cytoskeleton. PloS one. 2012;7(9):e44988. doi: 10.1371/journal.pone.0044988. [DOI] [PMC free article] [PubMed] [Google Scholar]
- Zhao Z, Low YS, Armstrong NA, Ryu JH, Sun SA, Arvanites AC, Hollister-Lock J, Shah NH, Weir GC, Annes JP. Repurposing cAMP-modulating medications to promote beta-cell replication. Mol Endocrinol. 2014;28(10):1682–1697. doi: 10.1210/me.2014-1120. [DOI] [PMC free article] [PubMed] [Google Scholar]
- Zhu Y, Chen H, Boulton S, Mei F, Ye N, Melacini G, Zhou J, Cheng X. Biochemical and pharmacological characterizations of ESI-09 based EPAC inhibitors: defining the ESI-09 “therapeutic window”. Sci Rep. 2015;5:9344. doi: 10.1038/srep09344. [DOI] [PMC free article] [PubMed] [Google Scholar]
Associated Data
This section collects any data citations, data availability statements, or supplementary materials included in this article.
Supplementary Materials
A) INS- cells, Ca1.2/II-III cells or Cav1.3/II-III cells were stimulated with 18 mM glucose + 50 nM GLP-1 for the indicated times. The far right lane shows the basal (B) level of pERK the absence of glucose stimulation. Western blots shown are representative of at least three separate experiments. B) INS-1 cells, Cav1.2/II-III cells, and Cav1.3/II-III cells were stimulated with 18 mM glucose + GLP-1 for the indicated times shown on the x-axis. Total ERK and pERK were detected and quantified using a cell-based ELISA. The ratio of pERK to total ERK was determined at each time point and normalized to pERK/total ERK prior to glucose stimulation (0 min). Glucose + GLP-1-stimulated ERK phosphorylation was significantly reduced in Cav1.2/II-III cells compared to control INS-1 cells at the 2 min time point (***, P < 0.001 One Way ANOVA, Holm-Sidak post-hoc test). In contrast, glucose+GLP-1-stimulated ERK phosphorylation was not different between INS-1 cells and Cav1.3/II-III cells at any time point. Data shown are the mean ± SE of at least three independent experiments.
A) INS- cells, Ca1.2/II-III cells or Cav1.3/II-III cells were stimulated with 50 nM GLP-1 in KRBH for the indicated times. The far right lane shows the basal (B) level of pERK the absence of glucose stimulation. Western blots shown are representative of at least three separate experiments. B) INS-1 cells, Cav1.2/II-III cells, and Cav1.3/II-III cells were stimulated with 50 nM GLP-1 for the indicated times shown on the x- axis. Total ERK and pERK were detected and quantified using a cell-based ELISA. The ratio of pERK to total ERK was determined at each time point and normalized to pERK/total ERK prior to glucose stimulation (0 min). GLP-1-stimulated ERK phosphorylation was significantly increased in Cav1.2/II-III cells compared to control INS-1 cells at the 10 and 30 min time points (*, P < 0.05 One Way ANOVA, Holm-Sidak post-hoc test). In contrast, glucose+GLP-1-stimulated ERK phosphorylation was not different between INS-1 cells and Cav1.3/II-III cells at any time point. Data shown are the mean ± SE of at least three independent experiments.