

Abstract
Associations linking a fearful experience to a member of a social group other than one's own (out-group) are more resistant to change than corresponding associations to a member of one's own (in-group) (Olsson et al., 2005; Kubota et al., 2012), providing a possible link to discriminative behavior. Using a fear conditioning paradigm, we investigated the neural activity underlying aversive learning biases towards in-group (White) and out-group (Black) members, and their predictive value for discriminatory interactive behavior towards novel virtual members of the racial out-group (n = 20). Our results indicate that activity in brain regions previously linked to conditioned fear and perception of individuals belonging to the racial out-groups, or otherwise stigmatized groups, jointly contribute to the expression of race-based biases in learning and behavior. In particular, we found that the amygdala and anterior insula (AI) played key roles in differentiating between in-group and out-group faces both when the faces were paired with an aversive event (acquisition) and when no more shocks were administered (extinction). In addition, functional connectivity between the amygdala and the fusiform gyrus increased during perception of conditioned out-group faces. Moreover, we showed that brain activity in the fear-learning-bias network was related to participants' discriminatory interactions with novel out-group members on a later day. Our findings are the first to identify the neural mechanism of fear learning biases towards out-group members, and its relationship to interactive behavior. Our findings provide important clues towards understanding the mechanisms underlying biases between social groups.
Highlights
-
•
We examined the neural basis of learning to fear racial out-group vs. in-group faces.
-
•
We investigated how biases in learning influenced subsequent virtual social interactive behavior.
-
•
Activity in amygdala and AI differentially tracked fear learning of in-group and out-group faces.
-
•
Learned fear of out vs. in-group faces increased connectivity between amygdala and fusiform gyrus.
-
•
Increased activity in AI and amygdala predicted later anti-Black biases in social interactions.
Introduction
With progressive globalization in recent decades, our interaction with individuals belonging to social groups other than our own (i.e., “out-groups”) has dramatically increased. Despite this development, research has found that people are predisposed to develop stronger associations between threatening events and members of racial out-groups, as compared to their racial in-group, and that these biased aversions tend to persist even when circumstances change and the threat is no longer present (Olsson et al., 2005, Kubota et al., 2012). These learning biases have also been extended to be minimally defined out-groups (Navarrete et al., 2012). Group based learning biases may have grave, real-life consequences manifested in out-group avoidance and aggression. Yet, nothing is known about the neural systems underlying racial learning biases, and how such biases are related to behavioral interactions in intergroup contexts. Here, we addressed these questions by using functional brain imaging (fMRI) and psychophysiology during aversive conditioning and virtual interaction with racial in-group and out-group individuals.
Previous research has identified the amygdala as a key brain region involved in the acquisition and expression of conditioned fear (LaBar and LeDoux, 1996, Phelps and LeDoux, 2005). The amygdala is also involved in the detection and evaluation of potentially threatening facial stimuli (Adolphs, 2013, Davis and Whalen, 2001), and during passive viewing of unfamiliar Black vs. White faces among White Americans (Kubota et al., 2012). Some studies have failed to report overall effect for Black versus White in White American participants (Phelps et al., 2000; Richeson et al., 2003) and other studies have found that Black American participants show either greater amygdala activity to in-group (Lieberman et al., 2005) or out-group faces (Hart et al., 2000). These findings suggest that cultural and social learning, and stereotypes of race may play a role in these types of biases (Caprariello et al., 2009, Cuddy et al., 2009, Fiske et al., 2009). Other studies have reported heightened activity in the FFA to faces of arbitrarily assigned in-group members compared with out-group members, regardless of race (Van Bavel and Cunningham, 2009, Van Bavel et al., 2008). These results may suggest that expertise with in-group race category in itself may not be the sole explanation behind the altered FFA responses. Also the situational saliency of a group may be important through its influence on attention to the out-group.
In fear conditioning, the conditioned stimulus (CS) acquires its aversive value through pairings with a naturally aversive event; the unconditioned stimulus (US) (Pavlov, 1927). Previous research has found that some CS–US associations are more resistant to change than others. For example, learned fear of snakes is more persistent than that of birds, an effect that has been argued to be “prepared” by biological evolution (Öhman and Mineka, 2001). Recently, a similar learning bias was discovered for faces belonging to unfamiliar members of racial out-groups (Mallan et al., 2009; Navarrete et al., 2009, Olsson et al., 2005), suggesting that aversive experiences associated with members of an out-group (vs. in-group) can boost fear memories through the mechanisms of conditioning. Because of its relatively recent emergence as an important dimension in human social interaction, race inherently is unlikely to be the basis of an evolved learning bias. There might, however, be a more evolved general bias against out-group individuals, because such individuals have been likely to pose a threat over evolutionary time (Hamilton, 1964, Manson and Wrangham, 1991).
Here, we examined the neural mechanisms of the formation (acquisition), extinction, and behavioral generalizability of this racial learning bias. We expected that the expression of the bias would be associated with increased activity in a network of regions; including, the amygdala, fusiform gyrus, which is implicated in facial threat appraisal and categorization (Vuilleumier and Pourtois, 2007), hippocampal complex, involved in aversive memory formation (Phelps, 2004), and anterior insula which has been associated with aversive experiences of threatening or stigmatized others (Harris and Fiske, 2006). In light of previous studies showing rapid habituation of activity (changes over time) in the amygdala in response to racial in-group faces (Hart et al., 2000, Kubota et al., 2012), we predicted that the learning bias would involve changes in activity over time. This observation is also well documented in other neuroimaging studies showing decrease of amygdala responses over time during viewing of emotional faces (Breiter et al., 1996, Whalen et al., 1998) and classical delay conditioning (Büchel et al., 1998, LaBar et al., 1998). Moreover, based on previous research on threatening stimuli (Anderson and Phelps, 2001, Hariri et al., 2003, Morris, 1998), we expected increased connectivity between the amygdala and the visual cortex during perception of conditioned out-group faces. The visual cortex has been shown to increase its activity both in response to arousing events, during negative affect (Sabatinelli et al., 2005, Sabatinelli et al., 2007) and phobic states (Dilger et al., 2003, Fredrikson et al., 1995, Paquette et al., 2003). Other studies have shown an enhanced connectivity between the amygdala and the fusiform gyrus during fear relevant visual stimuli (see Vuilleumier and Driver, 2007 for a review). Interestingly, research on race biases has reported that in-group as compared to out-group faces elicits greater activity in the fusiform region (Kubota et al., 2012). Importantly, these studies have not included the administration of naturally aversive events, such as shocks as in the current fear conditioning paradigm. We therefore predicted that activity in associative visual brain areas would increase as a function of fear together with increased functional connectivity with the amygdala.
Finally, we hypothesized that brain activity in the fear-learning-bias-network during conditioning to Black faces (CR Black) as compared to conditioning to White faces (CR) would predict participants' interactive behavior with unfamiliar racial out-group members. Specifically, we expected to find that an enhanced brain activity to racial out-group members during the conditioning task would predict larger discriminatory ball-passing behavior in a virtual Social Interactive Task (SIT) with novel racial out-group members.
Materials & methods
Participants
Twenty right-handed, healthy participants with no history of psychiatric or neurological disease of European decent (age 22.39 ± 3.82, ten females) were recruited. All participants and data were included in the analyses. All participants gave their written consent before participation and were naive to the purpose of the experiment. The procedures were executed in compliance with relevant laws and institutional guidelines, and were approved by the Regional Ethical Review Board of Stockholm. Participants were paid for their participation.
Conditioning paradigm and physiological assessment
The experiment took part over two days. On Day 1 the fear-conditioning paradigm was implemented during fMRI scans in order to examine the brain-based basis of the acquisition and persistence of learned fear (extinction) of racial out-group and in-group members (see below for details of Day 1). On Day 2, there was a Recall stage followed by an interactive virtual game, and an implicit racial association task (IAT), which were aimed at assessing the behavioral correlates of race biases (see below for details of Day 2).
Day 1
The participants were subjected to a delayed fear conditioning protocol that was directly modeled on a previous study (Olsson et al., 2005). The participants were told that they would watch images on a screen while sometimes receiving shocks, and instructed to pay attention to the screen throughout the experiment. Conditioned stimuli were composed of images of two White and two Black American male faces with neutral expressions that appeared on a computer screen. Following Olsson et al., 2005, the delayed fear conditioning protocol involved three stages; a Habituation stage, an Acquisition stage, and an Extinction stage (see Fig. 1B). During the initial Habituation stage, the participants viewed four non-reinforced presentations of each CS. During the subsequent Acquisition stage, they viewed each CS nine times. Each CS was presented for 6 s and all CS + s were presented with a 200-ms shock delivered after 5.5 s. The presentation of a CS − was never paired with a shock. Finally, the Extinction stage included 12 non-reinforced presentations of each CS. The order of presentation within each stage was pseudorandomized. Before the procedure, the shock electrode was attached to the participants' right wrist. In a standard work-up procedure, shock intensity was gradually increased until participants appraised it as uncomfortable, but not painful.
Fig. 1.
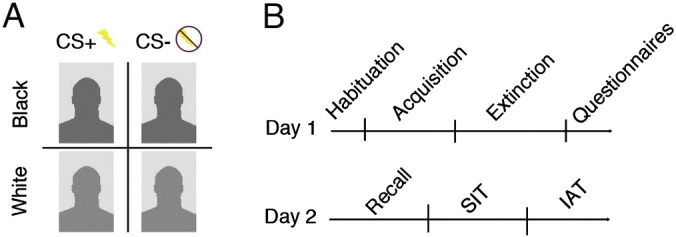
Illustration of task design. (A) One conditioned stimulus (CS +) from each racial category was paired with mild electric shocks. The other stimulus (CS −) was never presented with shocks. (B) Experimental time line for Day 1 and Day 2.
During fear conditioning, each face stimulus served as both CS + and CS −, counterbalanced across participants. All stimuli were presented for 6 s with a mean interstimulus interval (ITI) of 12 s (± 2). Skin conductance was recorded from electrodes that were attached to the participants' second and fourth distal phalanges on their left hand, before the experiment. Electrode cables were grounded through a RF filter panel, and the skin conductance response (SCR) was sampled at 200 Hz and was measured with shielded Ag–AgCl electrodes filled with conductive gel (Signa, Parker). Electrodes were connected to an fMRI compatible cable set and SCR100C amplifier. The SCR was digitized at the electrodes and a 1 Hz filter was applied (Gain 2 μmho/V).
Immediately following the fMRI sessions, participants were asked which CSs they received a shock to and rated the number of shocks they thought they received to each face.
Day 2
On Day 2, the participants returned for a recall task outside the scanner within 48-hours of their scanning on Day 1. The recall task was similar to the Extinction stage on Day 1, except that there were six trials instead of twelve. No shocks were delivered during the Recall stage, but the shock electrodes were attached to the wrist of the participant to ensure that the setup and experience was as similar to Day 1 as possible. Skin conductance was measured throughout the session.
After the Recall stage, participants played a modified version of the computerized interactive ball-tossing game "Cyberball" (Fürth et al., 2009, Williams and Jarvis, 2006), which has been used to simulate real social interactions. Here, we refer to this modified virtual task as the Social Interactive Task (SIT). Participants putatively interacted with a racially mixed group of five other players (2 target faces and 3 distractors). Target faces consisted of one Black (from NimStim facial database, model 39; Tottenham et al., 2009) and one White face (from Radboud Faces Database, model 23; Langner et al., 2010), and three additional faces that were created by morphing the Black and the White faces using a morphing program (Squirlz Morph: www.xiberpix.com). The new faces consisted of 75%, 50%, and 25% similarity to the Black face. These three faces were used as distractors to minimize the possibility of the participants realizing that the purpose of the task was to assess anti-Black interactive biases. Throughout the SIT session, the ball was thrown back and forth among the players, with the participant choosing the recipient of their own throws using the mouse, and the throws of the other players determined by the computer program. Participants played one round of SIT consisting of 241 ball tosses in total, 100 of which were actually determined by the participant. Faces of the virtual ‘co-players’ were presented in randomized position for each participant.
Finally, participants were asked to complete a series of 5 computerized IATs designed to measure the degree to which Black (relative to White) faces were implicitly associated with negative concepts (i.e., Avoid, Bad, Dangerous, Enemy, and Violent), compared to positive concepts (i.e., Approach, Good, Safe, Friend, and Peaceful; Greenwald et al., 1998).
Image acquisition
The participants were scanned with a 3T MR General Electric 750 scanner equipped with an 8-channel head coil. Foam padding placed around the head was used to reduce motion. We acquired T2*-weighted gradient echo-planar images with a repetition time 3000 ms. A total of 509 functional volumes were collected for each participant. Each functional image volume comprised 46 slices, and most of the whole brain was within the field of view (96 × 96 matrix, 1.72 × 1.72 × 2.3 mm in-plane resolution, TE = 34 ms, TR = 3000 ms). A high-resolution structural image (T1) was acquired for each participant at the end of the experiment (3D MPRAGE sequence, voxel size 0.938 × 0.938 × 0.938 mm, FOV 240 × 240 mm, 180 slices, TE = 2.81 ms, TR = 6400 ms, flip angle = 11°). The first 5 volumes (15 s) from each run were discarded to allow the scanner to reach magnetization equilibrium. The total scanning time was 27.8 min (Habituation = 2.4 min and 48 volumes, Acquisition = 10.8 min and 216 volumes, and Extinction = 14.6 min and 292 volumes). The visual display was presented via MR-compatible LCD video goggles [NordicNeuroLab (NNL), Bergen, Norway] connected to a PC running Presentation (Version 14, Neurobehavioral Systems, Inc., www.neurobs.com).
Imaging data analysis
The fMRI data were analyzed using the Statistical Parametric Mapping software package, Version 8 (SPM8; http://www.fil.ion.ucl.ac.uk/spm; Welcome Department of Cognitive Neurology, London, UK). The functional images were realigned to correct for head movements and co-registered to each participant's high-resolution structural image. The anatomical images were then segmented into white matter, gray matter, and cerebrospinal fluid partitions. Each segment was normalized to the Montréal Neurological Institute (MNI) standard brain. The individual normalization parameters obtained were then applied to all functional volumes, which were re-sliced with an isotropic voxel size (2.0 × 2.0 × 2.0 mm). The functional images were then spatially smoothed with an 8-mm full-width-at-half-maximum (FWHM) isotropic Gaussian kernel. A general linear model (GLM, for details see Friston et al., 2006, p. 200) with a total of 16 regressors was defined and estimated for each participant (first-level analysis) with one regressor defined per CS and Race type (Black CS +, White CS +, Black CS − and White CS −) and each onset modeled as an event using a “stick” or delta function. In addition, these categorical regressors were parametrically modulated with a linearly changing function to capture changes in activity over trials (e.g., Lonsdorf et al., 2014, Marschner et al., 2008). Regressors for movement and experimental effects of no interest corresponding to the onset of each ITI and the US (shock) for Black and White faces separately were also included within the GLM. All regressors (except the motion parameters) were convolved with a canonical hemodynamic response function. The Acquisition and Extinction stage were modeled and analyzed separately.
To address our hypotheses, the analysis involved a categorical-parametric design that allowed us to characterize two kinds of responses: (1) categorical conditioned responses (CRs) (i.e., overall activity), and (2) differences in parametric responses linearly changing over time. The parametric modulation allowed us to examine possible interactions between stimulus and time that are absent in categorical analyses of the mean responses. This analysis was motivated by findings from previous studies on fear conditioning (Büchel et al., 1998, LaBar et al., 1998) and race perception (Hart et al., 2000, Kubota et al., 2012) that have observed important time-dependent effects. For example, previous studies have found temporally graded amygdala responsivity in both animal and human populations (Quirk et al., 1997). Both categorical and parametric effects were analyzed separately on group level in a 2 × 2 full factorial design including the parameter estimates of each CS separated on two factors: CS type (CS + and CS −) and race (Black and White). We defined the interaction contrast from the 2 × 2 factorial design as (Black CS + minus Black CS −) > (White CS + minus White CS −), thus significant voxels containing neuronal populations that are specifically involved in learning to fear Black faces as compared to White faces. This controls for the potential confound of conditionability to any individual stimulus.
Visualization of the effect size of each contrast was achieved by generating plots of the extracted contrast estimates (the beta parameters derived from the general linear model) for each condition. We focused all our fMRI analyses on the amygdala, fusiform gyrus (involved in facial threat appraisal and categorization), hippocampus (memory formation), dorsal and ventral anterior insula (AI) (associated with aversive experiences of threatening or stigmatized others) as a priori defined key regions of interest (ROIs), because they have been implicated in both fear learning (Phelps and LeDoux, 2005) and race processing (Kubota et al., 2012). Each ROI was defined by using the anatomic automatic labeling (AAL) implemented in the PickAtlas software [Wake Forest University (WFU); http://www.fmri.wfubmc.edu/download.htm], except for the subregions (ventral and dorsal anterior) of the insula ROIs, which were provided by Deen et al. (2011). The separation of the AI into sub-regions was motivated by their partially distinct patterns of functional connectivity (Deen et al., 2011). For example, dorsal AI is functionally connected to the brain's frontal cognitive control network (Dosenbach et al., 2007) that has been implicated in monitoring and control of conflicts between emotional responses and egalitarian motives (Amodio et al., 2008a, Amodio et al., 2008b). The ventral AI has been linked more directly to emotional processing, related to peripheral physiological responses, such as SCR and heart rate, and co-activity with the amygdala (Mutschler et al., 2009). Both the overall mean activity (i.e., categorical regressors) and activity changes over time (i.e., parametric regressors) were examined for the main effect of task: (CS + > CS −), (CS − > CS +), the main effect of race: (Black > White), (White > Black), as well as our primary contrast of interest: the interaction effect [(Black CS + minus Black CS −) > (White CS + minus White CS −)], hereafter referred to as CR Black > CR White. As a control, we also performed the reversed contrast [(White CS + minus White CS −) > (Black CS + minus Black CS −)], hereafter referred to as CR White > CR Black. We only report significant activity from the analyses within the a priori selected ROIs that were family-wise error (FWE) corrected for multiple comparisons at an α-level of p < .05, using small volume correction (SVC) (Friston et al., 2006) (Table 1). The peak voxel of clusters that were found outside the ROIs are reported for descriptive purposes and correspond to an uncorrected threshold of (p < .001) (Table 2, Table 3).
Table 1.
Region of interest analysis.
| EXPERIMENTAL STAGE | ||||
|---|---|---|---|---|
| Analysis (Contrast) | ||||
| Anatomical region | MNI x, y, z (mm) | Peak t | Peak p (FWE-corr) | K |
| Acquisition | ||||
| Overall activity (CS+ > CS−) | ||||
| Right amygdala | 24, 6, − 15 | 3.23 | 0.021 | 147 |
| Left hippocampus | − 30, − 12, − 12 | 3.54 | 0.026 | 45 |
| Right fusiform gyrus | 46, − 55, − 20 | 3.88 | 0.021 | 1618 |
| Left dorsal AI | − 32, 23, − 5 | 4.66 | 0.001 | 508 |
| Left ventral AI | − 27, 18, − 9 | 5.32 | 0.000 | 316 |
| Right dorsal AI | 32, 26, − 0 | 4.96 | 0.000 | 466 |
| Right ventral AI | 30, 22, − 6 | 4.75 | 0.000 | 328 |
| Overall activity (CR White > CR Black) | ||||
| Left dorsal AI | − 32, 20, − 6 | 3.50 | 0.026 | 37 |
| Left ventral AI | − 30, 18, − 6 | 3.53 | 0.010 | 60 |
| Linear change over time (CR White > CR Black) | ||||
| Left amygdala | − 22, − 4, − 26 | 3.32 | 0.022 | 19 |
| Extinction | ||||
| Overall activity (CS+ > CS−) | ||||
| Right dorsal AI | 42, 9, 4 | 3.54 | 0.019 | 225 |
| Linear change over time (CS+ > CS−) | ||||
| Left dorsal AI | − 40, − 13, 6 | 4.34 | 0.002 | 54 |
| Linear change over time (CS− > CS+) | ||||
| Left hippocampus | − 30, − 40, − 2 | 3.88 | 0.016 | 78 |
| Left hippocampus | − 34, − 13, − 20 | 3.53 | 0.043 | 82 |
| Right hippocampus | 18, − 13, − 18 | 3.91 | 0.015 | 115 |
| Right hippocampus | 22, − 34, 6 | 3.54 | 0.043 | 84 |
| Overall activity (Black > White) | ||||
| Left ventral AI | − 27, 12, − 17 | 3.57 | 0.008 | 42 |
| Linear change over time (Black > White) | ||||
| Left amygdala | − 24, − 9, − 17 | 3.06 | 0.040 | 39 |
| Left fusiform gyrus | − 36, − 51, − 12 | 3.86 | 0.040 | 1105 |
| Right fusiform gyrus | 33, − 63, − 11 | 4.25 | 0.013 | 1211 |
| Right hippocampus | 34, − 6, − 20 | 3.56 | 0.040 | 60 |
| Overall activity (White > Black) | ||||
| Left anterior insula | − 27, 12, − 17 | 3.57 | 0.044 | 94 |
| Overall activity (CR Black > CR White) | ||||
| Right dorsal AI | 34, 15, − 2 | 3.37 | 0.031 | 69 |
Table 2.
Whole brain analysis overall activity.
| EXPERIMENTAL STAGE | ||||
|---|---|---|---|---|
| Analysis (Contrast) | ||||
| Anatomical region | MNI x, y, z (mm) | Peak t | p-Value uncorrected | K |
| Acquisition | ||||
| Overall activity (CS+ > CS −) | ||||
| Right precentral gyrus | 42, − 13, 40 | 6.77 | < .001 | 48,990 |
| Right postcentral gyrus | 46, − 15, 33 | 6.08 | < .001 | |
| Right middle cingulum | 9, 6, 40 | 5.86 | < .001 | |
| Right frontal inferior operculum | 28, 8, 34 | 3.92 | < .001 | |
| Right inferior temporal gyrus | 50, − 54, − 23 | 4.66 | < .001 | 2541 |
| Right inferior temporal gyrus | 44, − 57, − 9 | 4.25 | < .001 | |
| Right inferior occipital gyrus | 39, − 64, − 12 | 4.2 | < .001 | |
| Left middle temporal gyrus | − 56, − 27, − 0 | 4.64 | < .001 | 1390 |
| Left middle temporal gyrus | − 48, − 49, 12 | 4.21 | < .001 | |
| Left middle temporal gyrus | − 50, − 19, − 8 | 4.17 | < .001 | |
| Right middle occipital gyrus | 32, − 87, 25 | 4.47 | < .001 | 2532 |
| Right cuneus | 14, − 76, 34 | 4.37 | < .001 | |
| Right precuneus | 10, − 76, 52 | 4.22 | < .001 | |
| Right inferior parietal | 30, − 52, 48 | 4.25 | < .001 | 299 |
| Right angular | 32, − 51, 39 | 3.69 | < .001 | |
| Right middle temporal gyrus | 68, − 24, − 5 | 4.23 | < .001 | 110 |
| Right middle temporal gyrus | 69, − 37, − 5 | 3.49 | < .001 | |
| Left lingual | − 16, − 66, − 3 | 4.15 | < .001 | 802 |
| Cerebelum_6_L | − 4, − 72, − 11 | 4.03 | < .001 | |
| Left fusiform | − 32, − 67, − 2 | 3.81 | < .001 | |
| Right pallidum | 27, − 15, − 8 | 4.13 | < .001 | 89 |
| Right hippocampus | 34, − 12, − 14 | 3.4 | 0.001 | |
| Left superior occipital gyrus | − 26, − 64, 24 | 4.05 | < .001 | 151 |
| Left superior occipital gyrus | − 21, − 66, 36 | 3.35 | 0.001 | |
| Left hippocampus | − 30, − 12, − 11 | 3.98 | < .001 | 48 |
| Left inferior occipital gyrus | − 27, − 84, − 9 | 3.93 | < .001 | 177 |
| Right lingual | 18, − 58, − 8 | 3.79 | < .001 | 212 |
| Left putamen | − 24, 11, 13 | 3.72 | < .001 | 46 |
| Left precentral | − 15, − 7, 67 | 3.66 | < .001 | 35 |
| Right frontal inferior operculum | 57, 18, 33 | 3.6 | < .001 | 51 |
| Right parahippocampal | 28, 0, − 33 | 3.53 | < .001 | 19 |
| Left middle frontal | − 40, 24, 43 | 3.52 | < .001 | 36 |
| Left superior temporal gyrus | − 50, − 30, 16 | 3.52 | < .001 | 27 |
| Right lingual | 12, − 49, 1 | 3.51 | < .001 | 44 |
| Left inferior parietal | − 28, − 48, 37 | 3.47 | < .001 | 42 |
| Left calcarine | − 12, − 70, 9 | 3.43 | < .001 | 76 |
| Left angular | − 36, − 55, 33 | 3.42 | 0.001 | 20 |
| Left inferior parietal | − 33, − 49, 54 | 3.39 | 0.001 | 15 |
| Left postcentral | − 38, − 33, 52 | 3.38 | 0.001 | 26 |
| Right amygdala | 24, 6, − 15 | 3.35 | 0.001 | 15 |
| Right calcarine | 9, − 70, 13 | 3.27 | 0.001 | 15 |
| Overall activity (CS− > CS+) | ||||
| Left hippocampus | − 24, − 42, 9 | 3.94 | < .001 | |
| Overall activity (Black > White) | ||||
| Left hippocampus | − 27, − 22, − 6 | 3.82 | < .001 | 28 |
| Overall activity (White > Black) | ||||
| Right parahippocampal | 18, − 27, − 20 | 4 | < .001 | 88 |
| Right angular | 42, − 46, 28 | 3.59 | < .001 | 21 |
| Right middle temporal gyrus | 60, − 1, − 17 | 3.47 | < .001 | 13 |
| Left middle cingulum | − 14, − 40, 34 | 3.3 | 0.001 | 12 |
| Overall activity (CR White > CR Black) | ||||
| Right precentral gyrus | 22, − 24, 55 | 3.7 | < .001 | 60 |
| Left insula | − 30, 18, − 6 | 3.53 | < .001 | 22 |
| Extinction | ||||
| Overall activity (CS+ > CS−) | ||||
| Right hippocampus | 33, − 37, 4 | 3.72 | < .001 | 36 |
| Right frontal inferior operculum | 42, 9, 6 | 3.57 | < .001 | 44 |
| Overall activity (CS− > CS+) | ||||
| Right middle temporal gyrus | 62, − 40, − 12 | 4.2 | < .001 | 74 |
| Right superior parietal gyrus | 40, − 60, 56 | 4.15 | < .001 | 104 |
| Left angular | − 39, − 70, 40 | 3.9 | < .001 | 479 |
| Left angular | − 42, − 55, 34 | 3.9 | < .001 | |
| Right middle frontal | 33, 14, 51 | 3.77 | < .001 | 96 |
| Left precentral | − 42, 6, 33 | 3.56 | < .001 | 74 |
| Right superior temporal gyrus | 69, − 30, 10 | 3.55 | < .001 | 35 |
| Left middle frontal | − 30, 12, 49 | 3.54 | < .001 | 89 |
| Left middle frontal | − 39, 12, 54 | 3.49 | < .001 | |
| Left middle frontal | − 38, 6, 60 | 3.3 | 0.001 | |
| Left superior frontal | − 18, 33, 48 | 3.48 | < .001 | 27 |
| Left precuneus | − 6, − 54, 18 | 3.38 | 0.001 | 13 |
| Overall activity (Black > White) | ||||
| SupraMarginal_R | 54, − 37, 31 | 5.2 | < .001 | 727 |
| Left superior frontal | − 16, 3, 48 | 5.06 | < .001 | 179 |
| SupraMarginal_L | − 62, − 33, 42 | 5.01 | < .001 | 305 |
| SupraMarginal_L | − 66, − 39, 31 | 3.51 | < .001 | |
| Left superior frontal | − 18, 0, 63 | 4.12 | < .001 | 98 |
| Right middle frontal | 34, − 3, 60 | 3.98 | < .001 | 118 |
| Left superior parietal gyrus | − 18, − 54, 49 | 3.9 | < .001 | 127 |
| Left inferior parietal | − 51, − 43, 55 | 3.65 | < .001 | 56 |
| Left inferior parietal | − 46, − 49, 58 | 3.54 | < .001 | |
| Right precentral gyrus | 51, 2, 28 | 3.45 | < .001 | 13 |
| Right superior parietal gyrus | 34, − 49, 63 | 3.43 | < .001 | 31 |
| Overall activity (White > Black) | ||||
| Left thalamus | − 4, − 15, 19 | 3.83 | < .001 | 34 |
| Left thalamus | − 20, − 21, 1 | 3.6 | < .001 | 21 |
| Left insula | − 27, 12, − 17 | 3.57 | < .001 | 14 |
| Right thalamus | 14, − 22, 21 | 3.42 | 0.001 | 12 |
| Overall activity (CR Black > CR White) | ||||
| SupraMarginal_R | 64, − 48, 34 | 4.07 | < .001 | 158 |
| SupraMarginal_R | 51, − 46, 33 | 3.5 | < .001 | |
| Left frontal inferior operculum | − 42, 15, 10 | 3.87 | < .001 | 24 |
| Right middle frontal | 40, 44, 12 | 3.71 | < .001 | 68 |
| Right precuneus | 21, − 42, 3 | 3.66 | < .001 | 17 |
| Right putamen | 33, 12, − 2 | 3.56 | < .001 | 25 |
| Left precentral | − 58, 3, 33 | 3.41 | 0.001 | 18 |
p = 0.001 uncorrected, k > 10, and only peaks 3 mm from label area reported.
Table 3.
Whole brain analysis change over time.
| EXPERIMENTAL STAGE | ||||
|---|---|---|---|---|
| Analysis (Contrast) | ||||
| Anatomical region | MNI x, y, z (mm) | Peak t | Peak p (FWE-corr) | K |
| Acquisition | ||||
| Linear change over time (CS+ > CS−) | ||||
| Left superior frontal | − 20, 17, 63 | 5.25 | < .001 | 2124 |
| Left superior frontal medial | − 6, 30, 58 | 4.45 | < .001 | |
| Left precentral | − 30, − 4, 58 | 4.17 | < .001 | |
| Left supplementary motor area | − 4, − 10, 67 | 4.69 | < .001 | 121 |
| Right calcarine | 32, − 51, 3 | 3.92 | < .001 | 71 |
| Left superior parietal gyrus | − 24, − 52, 69 | 3.79 | < .001 | 188 |
| Right supplementary motor area | 16, 3, 66 | 3.63 | < .001 | 53 |
| Cerebelum_Crus1_R | 10, − 82, − 24 | 3.53 | < .001 | 10 |
| Left precentral | − 36, − 13, 66 | 3.5 | < .001 | 30 |
| Left precentral | − 21, − 18, 60 | 3.46 | < .001 | 24 |
| Right middle frontal | 44, 3, 58 | 3.46 | < .001 | 10 |
| Linear change over time (CS− > CS+) | ||||
| Right precentral gyrus | 36, − 16, 49 | 5.04 | < .001 | 3417 |
| Right postcentral gyrus | 62, − 6, 36 | 4.86 | < .001 | |
| Right precentral gyrus | 58, 6, 39 | 4.72 | < .001 | |
| Left postcentral | − 57, − 9, 28 | 4.46 | < .001 | 1031 |
| Left postcentral | − 58, − 1, 40 | 4.11 | < .001 | |
| Left postcentral | − 58, − 16, 46 | 3.91 | < .001 | |
| Left superior parietal gyrus | − 21, − 81, 48 | 4.24 | < .001 | 113 |
| Right superior occipital gyrus | 28, − 79, 43 | 4.02 | < .001 | 113 |
| Right superior temporal gyrus | 58, − 30, 6 | 3.92 | < .001 | 85 |
| Left rolandic operculum | − 51, − 18, 13 | 3.58 | < .001 | 48 |
| Right inferior parietal | 34, − 40, 51 | 3.58 | < .001 | 49 |
| Right middle cingulum | 9, − 21, 28 | 3.56 | < .001 | 41 |
| Right precuneus | 12, − 55, 21 | 3.56 | < .001 | 31 |
| Left superior temporal gyrus | − 40, − 30, 9 | 3.51 | < .001 | 20 |
| Right middle cingulum | 12, − 39, 36 | 3.43 | < .001 | 32 |
| Right superior temporal gyrus | 63, − 18, − 2 | 3.42 | 0.001 | 17 |
| Right middle frontal | 26, 30, 36 | 3.4 | 0.001 | 13 |
| Left rolandic operculum | − 30, − 28, 16 | 3.38 | 0.001 | 10 |
| Linear change over time (Black > White) | ||||
| Left insula | − 27, 18, 18 | 3.77 | < .001 | 57 |
| Left caudate | − 14, − 1, 24 | 3.48 | < .001 | 20 |
| < .001 | ||||
| Linear change over time (White > Black) | < .001 | |||
| Cerebelum_Crus1_R | 10, − 81, − 26 | 3.53 | < .001 | 14 |
| < .001 | ||||
| (CR White > CR Black) | < .001 | |||
| Cerebelum_6_L | − 6, − 70, − 9 | 3.91 | < .001 | 61 |
| Cerebelum_6_L | − 14, − 60, − 29 | 3.82 | < .001 | 104 |
| Left middle temporal gyrus | − 50, − 48, 12 | 3.78 | < .001 | 48 |
| Right lingual | 18, − 70, 1 | 3.6 | < .001 | 37 |
| Right postcentral gyrus | 16, − 42, 58 | 3.53 | < .001 | 14 |
| Left parahippocampal | − 22, − 6, − 27 | 3.41 | 0.001 | 14 |
| Right rolandic operculum | 45, − 22, 16 | 3.39 | 0.001 | 13 |
| Right middle cingulum | 9, − 9, 45 | 3.39 | 0.001 | 10 |
| Extinction | ||||
| Linear change over time (CS+ > CS−) | ||||
| Left insula | − 42, − 13, 6 | 4.35 | < .001 | 129 |
| Left Insula | − 34, − 7, 6 | 3.28 | 0.001 | |
| Left frontal inferior operculum | − 58, 15, 10 | 4.11 | < .001 | 132 |
| Right pallidum | 22, − 3, − 3 | 3.77 | < .001 | 30 |
| Right frontal inferior operculum | 60, 15, 10 | 3.65 | < .001 | 65 |
| Left superior temporal gyrus | − 66, − 46, 13 | 3.6 | < .001 | 54 |
| Left middle frontal | − 33, 53, 19 | 3.41 | 0.001 | 19 |
| Left postcentral | − 64, − 3, 27 | 3.36 | 0.001 | 18 |
| Right precentral gyrus | 62, 3, 28 | 3.3 | 0.001 | 15 |
| Linear change over time (CS− > CS+) | ||||
| Left superior parietal gyrus | − 20, − 67, 42 | 4.47 | < .001 | 614 |
| Left middle occipital gyrus | − 22, − 64, 31 | 3.67 | < .001 | |
| Left superior parietal gyrus | − 20, − 76, 51 | 3.55 | < .001 | |
| Left inferior temporal gyrus | − 42, − 43, − 9 | 4.43 | < .001 | 205 |
| Left parahippocampal | − 30, − 40, − 3 | 3.95 | < .001 | |
| Left inferior temporal gyrus | − 51, − 51, − 9 | 3.87 | < .001 | |
| Right superior occipital gyrus | 22, − 67, 42 | 4.41 | < .001 | 417 |
| Right superior parietal gyrus | 26, − 67, 52 | 4.07 | < .001 | |
| Right superior parietal gyrus | 27, − 57, 60 | 3.45 | < .001 | |
| Right hippocampus | 18, − 13, − 18 | 3.91 | < .001 | 44 |
| Right hippocampus | 22, − 33, 6 | 3.78 | < .001 | 42 |
| Left hippocampus | − 36, − 13, − 20 | 3.59 | < .001 | 24 |
| Right superior temporal gyrus | 46, − 12, − 8 | 3.54 | < .001 | 12 |
| Left inferior orbitofrontal | − 27, 35, − 9 | 3.53 | < .001 | 24 |
| Linear change over time (Black > White) | ||||
| Right superior temporal gyrus | 45, − 6, − 14 | 4.83 | < .001 | 481 |
| Right middle temporal gyrus | 58, − 4, − 20 | 3.99 | < .001 | |
| Right hippocampus | 36, − 4, − 18 | 3.75 | < .001 | |
| Right inferior temporal gyrus | 52, − 39, − 17 | 4.74 | < .001 | 135 |
| Right fusiform | 33, − 63, − 11 | 4.25 | < .001 | 354 |
| Right fusiform | 32, − 52, − 5 | 4.1 | < .001 | |
| Right fusiform | 27, − 48, − 12 | 3.85 | < .001 | |
| Right parahippocampal | 14, − 4, − 20 | 3.98 | < .001 | 21 |
| Right superior orbitofrontal | 22, 28, − 12 | 3.97 | < .001 | 32 |
| Left fusiform | − 36, − 51, − 12 | 3.86 | < .001 | 207 |
| Left lingual | − 28, − 58, − 2 | 3.8 | < .001 | |
| Left fusiform | − 30, − 58, − 11 | 3.48 | < .001 | |
| Left fusiform | − 22, − 42, − 12 | 3.85 | < .001 | 155 |
| Left superior frontal | − 16, 36, 54 | 3.85 | < .001 | 46 |
| Right precentral gyrus | 45, − 3, 30 | 3.77 | < .001 | 42 |
| Left fusiform | − 34, − 82, − 17 | 3.75 | < .001 | 124 |
| Left middle occipital gyrus | − 33, − 85, 7 | 3.73 | < .001 | 454 |
| Left middle occipital gyrus | − 38, − 82, 19 | 3.68 | < .001 | |
| Left middle occipital gyrus | − 32, − 76, 12 | 3.57 | < .001 | |
| Left medial orbitofrontal | − 9, 42, − 12 | 3.71 | < .001 | 36 |
| Left inferior temporal gyrus | − 45, 5, − 39 | 3.69 | < .001 | 90 |
| Left inferior temporal gyrus | − 52, 0, − 38 | 3.67 | < .001 | |
| Left superior temporal pole | − 38, 17, − 23 | 3.69 | < .001 | 80 |
| Right middle temporal gyrus | 48, − 54, − 0 | 3.67 | < .001 | 85 |
| Left inferior orbitofrontal | − 34, 35, − 17 | 3.63 | < .001 | 72 |
| Left superior occipital gyrus | − 22, − 75, 24 | 3.6 | < .001 | 39 |
| Right postcentral gyrus | 24, − 42, 49 | 3.58 | < .001 | 22 |
| Right middle temporal gyrus | 52, 3, − 32 | 3.58 | < .001 | 47 |
| Right calcarine | 30, − 75, 6 | 3.48 | < .001 | 27 |
| Right middle cingulum | 15, − 15, 46 | 3.46 | < .001 | 30 |
| Left middle temporal gyrus | − 52, − 66, − 5 | 3.46 | < .001 | 52 |
| Right fusiform | 33, − 37, − 24 | 3.45 | < .001 | 23 |
| Right inferior orbitofrontal | 39, 24, − 21 | 3.41 | 0.001 | 11 |
| Left superior frontal | − 15, 38, 34 | 3.4 | 0.001 | 10 |
| Left middle occipital gyrus | − 33, − 67, 16 | 3.3 | 0.001 | 12 |
p = 0.001 uncorrected, k > 10, and only peaks 3 mm from label area reported.
Conjunction analysis
As a complementary analysis, a conjunction analysis of the two activation maps CRs to Black and CRs to White faces was performed to identify regions of convergence, i.e., all the voxels activated by both (Black CS + > Black CS −) and (White CS + > White CS −) (Nichols et al., 2005). The peak voxel of clusters that are found in the conjunction analysis are reported for descriptive purposes and correspond to an uncorrected threshold of (p < .001) (Table 4).
Table 4.
Conjunction analysis.
| EXPERIMENTAL PHASE | ||||
|---|---|---|---|---|
| Analysis (Contrast) | ||||
| Anatomical region | MNI x, y, z (mm) | Peak t | p-Value uncorrected | K |
| Acquisition | ||||
| (Black CS+ > Black CS−) and (White CS+ > White CS−) | ||||
| Right postcentral | 45, − 13, 31 | 4.9 | < .001 | 1416 |
| Left precentral | − 46, − 1, 40 | 4.88 | < .001 | 1136 |
| Right frontal inferior triangularis | 45, 24, 9 | 4.71 | < .001 | 192 |
| Right middle cingulum | 6, 3, 40 | 4.22 | < .001 | 1241 |
| Right frontal inferior operculum | 44, 11, 28 | 4.22 | < .001 | 140 |
| Left caudate | − 9, 9, − 0 | 4.2 | < .001 | 454 |
| Left superior temporal pole | − 60, 8, − 2 | 4.18 | < .001 | 51 |
| Right superior frontal | 24, 51, 16 | 3.96 | < .001 | 183 |
| Right superior orbitofrontal | 24, 33, − 15 | 3.76 | < .001 | 19 |
| Right inferior temporal gyrus | 50, − 52, − 23 | 3.73 | < .001 | 19 |
| Right medial orbitofrontal | 6, 44, − 12 | 3.69 | < .001 | 63 |
| Left superior frontal | − 18, 50, 18 | 3.66 | < .001 | 16 |
| Left middle cingulum | − 9, 3, 33 | 3.65 | < .001 | 12 |
| Left middle cingulum | − 6, − 24, 48 | 3.65 | < .001 | 45 |
| Right supplementary motor area | 2, − 4, 67 | 3.64 | < .001 | 20 |
| Left paracentral lobule | − 10, − 34, 52 | 3.58 | < .001 | 26 |
| Right caudate | 10, 12, 1 | 3.58 | < .001 | 6 |
| Left middle frontal | − 30, 36, 31 | 3.51 | 0.001 | 12 |
| Right frontal inferior operculum | 45, 20, 16 | 3.5 | 0.001 | 15 |
| Right rolandic operculum | 60, 3, 7 | 3.49 | 0.001 | 13 |
| Right precentral | 58, 2, 19 | 3.45 | 0.001 | 14 |
| Right inferior orbitofrontal | 40, 28, − 5 | 3.44 | 0.001 | 12 |
| Right middle temporal gyrus | 52, − 67, − 2 | 3.43 | 0.001 | 8 |
Connectivity analysis
To explore regional changes in connectivity between amygdala and other brain regions during Acquisition and Extinction stage, we carried out a psychophysiological interaction (PPI) analysis (Friston et al., 1997). This analysis models condition-dependent changes in connectivity from a chosen seed region (here: the amygdala) to each voxel in the whole-brain. The amygdala was selected as the seed region in light of previous findings suggesting that the amygdala serves as a hub in a closely interconnected neural network that is partially overlapping during fear conditioning (LaBar et al., 1998, Maren and Fanselow, 1996, Phelps et al., 2004b) and the perception of potentially threatening stimuli, such as unfamiliar racial out-group members (Wheeler and Fiske, 2005). Research shows that this connectivity serves to recruit other brain regions to facilitate adaptive behavioral responses and emotional memory formation (Cahill and McGaugh, 1998, Phelps et al., 2004a, Phelps et al., 2004b, Phelps and LeDoux, 2005).
We carried out the PPI analysis using the generalized PPI toolbox (gPPI; http://www.nitrc.org/projects/gppi). Compared with standard PPIs implementation in SPM, gPPIs allows for interaction of more than two task conditions in the same PPI model and improves model fit, specificity to true-negative findings, and sensitivity to true-positive findings (McLaren et al., 2012). Here, we investigated the gPPI during our main contrast of interest CR Black > CR White, i.e., the interaction effect. Thus, we extracted the mean time series for each participant from the bilateral amygdala ROI.
For each participant, the gPPI analysis was performed on the first level and included the categorical regressors for Black CS +, Black CS −, White CS +, and White CS −. The de-convolved time series from the amygdala was extracted for each participant to create the physiological variable. The condition onset times for the CSs were separately convolved with the canonical hemodynamic response function for each condition, creating the psychological regressors. The interaction terms (PPIs) were computed by multiplying the time series from the psychological regressors with the physiological variable. To examine the effect of the interaction terms, activity within the amygdala was regressed on a voxel-wise basis against the interaction, with the physiological and psychological variables serving as regressors of interest. The individual CR Black > CR White contrast images were entered into separate second-level 2 (CS) × 2 (Race) ANOVAs for the left and right amygdala to determine whether there were any CS × Race interactions on functional connectivity. Thus, the resulting activation maps from this analysis correspond to the functional connectivity between amygdala and other brain regions that were significant of a race based learning bias. The peak voxel of clusters that are found in the gPPI analysis are reported with family-wise error (FWE) corrected for multiple comparisons at a threshold of (p < .05, see Table S1), or if stated, results are also reported for descriptive purposes at an uncorrected threshold of (p < .001).
Psychophysiology and behavioral data analysis
For both Day 1 and Day 2, SCRs were recorded during the presentation of each stimulus (0.5–4.5 s after onset). Only the largest SCRs were used (responses below 0.02 ms were recorded as zero). Raw SCRs were square root transformed to normalize the distributions, and scaled according to each participants' mean square-root-transformed US response. All trials were included in a repeated-measures analysis of variance (RM ANOVA) with CS (CS +, CS −) and Race (Black, White) as a within-subject factor. For the behavioral data obtained from the interactive game (SIT) on Day 2, a difference score (d score) in passing to the two target faces (i.e., number of passes to the 100% White face subtracted from number of passes to the 100% Black face) was calculated for each participant to acquire an index of social interaction bias. In this way, a positive d score indicated an anti-Black SIT bias (i.e., less number of passes to the Black face) and a negative d score indicates the opposite.
Relationships between behavior and brain measures
The behavioral measures of racial bias included (a) interactive behavior during the SIT, (b) the number of perceived shocks to the facial images of White and Black targets, and (c) IAT d scores. In order to examine individual differences in the relationship with brain activity during fear conditioning, these measures were entered into a multiple linear regression model with the whole brain contrast estimates of the interaction effect as the dependent variable. Based on a-priori hypothesis, we also examined the number of perceived shocks to in-out group faces in a separate regression-model with the same dependent variable.
Results
Psychophysiological results
Skin conductance response day 1
A repeated-measures ANOVA during Acquisition stage revealed significantly larger SCRs to CS + versus CS − (F19 = 10.35, p = .005) (Figs. 2 and S3), confirming the expected differentiation between CS + and CS − stimuli, but there was no effect of Race (F19 = .051, p = .823), or interaction (F19 = .347, p = .563). During Extinction stage the signal quality of the SCR was dramatically diminished, thereby preventing analysis and any conclusions that could be drawn (see Discussion below for elaboration of this point). During Habituation SCR amplitudes to all CS's decreased (F(1,19) = 27.70, p < .001) from Trial 1 to Trial 2 to the same level before the Acquisition stage (see Fig. S2). All participants were included in the SCR analysis. The IAT (d score range, − 0.25 to 0.47) could not significantly explain the variance in the SCR data.
Fig. 2.

Skin conductance results. The amplitude of SCRs is shown in microsiemens. Fear elicited enhanced SCRs to CS + relative to CS − during Acquisition and again recovery during Recall. Error bars indicate standard deviation (SEM). Asterisks indicate a statistically significant difference p < .05.
Skin conductance response day 2 recall
SCRs were larger to CS + versus CS − (F19 = 7.624, p = .012), (Figs. 2 and S4), showing that learned fear was recovered, but there was no effect of Race (F19 = .359, p = .556) or interaction (F19 = .001, p = .971).
Neuroimaging results
Acquisition: learning to fear Black and White faces
In examining the contrast for the main effect of task (i.e., CS + > CS −), we found that stimuli predicting a shock (CS +) elicited greater overall activity than the non-threatening CS − in the right amygdala, bilateral ventral and dorsal AI, left hippocampus and left fusiform gyrus (peaks reported in Table 1); results which are consistent with previous studies on fear learning (Kapp et al., 1992, LaBar et al., 1998, Maren and Fanselow, 1996, Phelps and LeDoux, 2005). There were no main effects of race (Black > White) or (White > Black) in any of the a priori regions (see Table 2, Table 3 for clusters of activation observed outside the ROIs). Next, examining the interaction effect, we found an effect of CS and Race (CR White > CR Black) in the left amygdala, extending into the anterior parts of the hippocampus that increased over time. Interestingly, this time-dependent effect resulted from an increasing discrimination of White CSs (increase to White CS + as compared to White CS −), while there was no change in CS discrimination over time for Black CSs (see Figs. 3B, S1 & Table 1). Furthermore, examining overall activity, the interaction effect (CR White > CR Black) revealed activity in an overlapping cluster in the left dorsal and ventral AI, with the peak in the ventral AI. Again, these effects resulted from a more pronounced perceptual discrimination of White CSs (an increase for White CS + as compared to the White CS −) in contrast to the Black CSs (see Fig. 3C; Table 1).
Fig. 3.

Brain activations to CR Black vs. CR White faces during Acquisition. (A) Overview of the brain regions during Acquisition stage that are significant for CR to Black faces (in red), and CR White faces (in blue), and conjunction for both CR Black and CR White faces (in green). Left panel shows left view of the brain and right panel shows right view of the brain. For display purposes only, activations were displayed at a threshold of p < 0.001 (uncorrected for multiple comparisons) and overlaid onto a group representative inflated cortical surface. (B) Bar plot shows the contrast estimates from the significant peak of activation in the left amygdala for the contrast (CR White > CR Black) during Acquisition stage, indicating changes in activity over time. (C) Bar plot shows the contrast estimates from the significant peak of overall activation in the left ventral AI for the contrast (CR White > CR Black) during Acquisition. The reported coordinates are in the MNI space. Error bars denote ± SEM, and activation maps are displayed at puncorrected < .01 for display purposes only. For further details, see Table 1.
Extinction: diminishing learned fear towards Black and White faces
Next, we examined the neural correlates underlying the change of the learned fear (CRs) to Black and White faces during Extinction stage. The main effect of task (i.e., CS + > CS −) revealed overall activity in right dorsal anterior insula corroborating the role of this region in the processing of the anticipation and experience of aversive treatment (Craig, 2009). The main effect of race (Black > White) revealed activity increases over time in the left amygdala, bilateral fusiform gyrus, and right hippocampus (see Table 1 and Fig. 4B). For the reversed contrast (White > Black), we found larger overall deactivation (i.e., less activation compared to resting baseline) to Black CSs as compared to White CSs in left ventral AI (see Fig. 4C).
Fig. 4.

Brain activations to CR Black vs. CR White faces during Extinction. (A) Overview of the brain regions during Extinction stage that are significant for CR to Black faces (in red), and CR to White faces (in blue), and conjunction for both CR Black and CR White faces (in green), there was no overlap for CR Black and CR White during Extinction. Left panel shows left view of the brain and right panel shows right view of the brain. For display purposes only, the activation map was displayed at a threshold of p < 0.001 (uncorrected for multiple comparisons) and overlaid onto a representative inflated cortical surface. (B) Bar plots shows the contrast estimates from the significant peak of activation in the left amygdala, right hippocampus, and right and left fusiform gyrus for the contrast (Black > White) during Extinction stage indicating changes in activity over time. (C) Bar plot shows the contrast estimates from the significant peak of overall activation in the left ventral AI for the contrast (Black > White) during Extinction stage. (D) Bar plots shows the contrast estimates from the significant peak of overall activation in the right dorsal AI for the contrast (CR Black > CR White) during Extinction stage. The reported coordinates are in the MNI space. Error bars denote ± SEM, and activation maps are displayed at puncorrected < .01 for display purposes only. For further details, see Table 1.
Finally, in the key contrast directly examining the interaction effect, we found that CR Black > CR White faces was associated with increased overall activity in the right dorsal AI. This interaction effect was caused by enhanced responses to the Black CS + face in contrast to White CS +, White CS − and Black CS − (see Fig. 4D). This finding parallels the commonly observed persistence of CR to Black faces during Extinction stage (e.g., Olsson et al., 2005).
Overlapping brain activations for learning to fear Black and White faces
To investigate brain regions involved in fear learning, regardless of race, we tested for regions showing a common response for both CR to Black and CR to White faces in a conjunction analysis between the contrasts Black CS + > Black CS − and White CS + > White CS −. This analysis revealed several overlapping regions during Acquisition stage, including the parahippocampus, ACC, smaller portions of the prefrontal cortex, dorsal MPFC and ACC (see Fig. 3A), which is consistent with previous research on conditioned fear (Kapp et al., 1992, LaBar et al., 1998, Maren and Fanselow, 1996;. Phelps and LeDoux, 2005). Interestingly, there were no corresponding clusters of overlapping activity during the Extinction stage (see Fig. 4A), implicating unique activity for safety learning to Black as compared to White individuals when no shocks were administered.
Connectivity with the amygdala
Consistent with our expectations of a persistent threat response to out-group faces during Extinction stage, CR Black > CR White faces were associated with increased functional connectivity between the amygdala and right fusiform gyrus during Extinction [(34, − 9, − 39; t19 = 5.39, pFWE < .05)] (Fig. 5; Table S1). Although at an uncorrected threshold, the same pattern of a stronger functional connectivity between the amygdala and left fusiform gyrus (− 34, − 12, − 30; t19 = 3.96, puncorrected < .0001) for Black versus White CR was displayed during the Acquisition stage (Fig. 5; Table S1).
Fig. 5.

gPPI: connectivity between amygdala and fusiform gyrus. Top Bar graph illustrating extracted BOLD responses from the anatomical left fusiform gyrus ROI (34, − 12, − 30; t19 = 3.96, puncorrected < .0001) during Acquisition for CR Black > CR White faces. Bar graph below illustrating extracted BOLD responses from the anatomical right fusiform gyrus ROI (34, − 9, − 39; t19 = 5.39, pFWE < .05) during Extinction for CR Black > CR White faces. Seed region defined using the mean time series for each participant from right and left amygdala ROIs. Error bars indicate the SEM. For illustration purposes, results are displayed at uncorrected significance (P < .01) thresholds.
Brain activity correlates of behavior
Brain activity predictive of recalled number of shocks
After the end of the conditioning experiment, participants reported how many shocks they recalled having received to each CS. Participants reported receiving an equal number of shocks to Black (M = 7.2, SEM = .42) and White faces (M = 7.5, SEM = .39). A regression analysis evaluating the relationship between the perceived number of shocks and the brain activity revealed that the level of activity in the right amygdala (34, 0, − 26; t = 3.91, pFWE-corrected = .024) for the interaction effect (i.e., CR Black > CR White) during Acquisition stage predicted the number of shocks that the participants reported to have received to Black faces (see Fig. 6C). As a control, we examined the reversed contrast CR White > CR Black faces, and found no activity in amygdala for reported number of shocks to White faces. Moreover, we found that the CR Black > CR White faces in bilateral dorsal and ventral AI (right dorsal: 40 − 3, 0; t = 4.75, pFWE-corrected = .015, right ventral: 44 − 6, − 2; t = 5.17, pFWE-corrected = .005) predicted the number of shocks that the participants reported to have received to Black faces. Similar to the effect in the amygdala, the reversed contrast did not reveal any activation. Taken together, these results suggest that activity in the brain associated with a racial learning bias predicted the level of racial bias in the reported number of shocks.
Fig. 6.

Brain activity predicts behavior. (A) Illustration of the interactive environment during the SIT. Participants were presented with one Black and one White face and three distractor (racially-morphed) faces (faces are blurred here to protect the identity of the models). Participants were asked to pass the ball to each one of the other players. (B) Significant relationship between activity in left dorsal AI for CR Black > CR White during the Extinction stage, and the strength of anti-Black SIT bias (i.e., passing less often to the Black faces). (C) Significant relationship between activity in right amygdala in response to shock to Black faces, and the strength of anti-Black SIT bias. This relationship was not observed for shock to White faces. (D) Significant relationship between activity in right amygdala for CR Black > CR White during Acquisition and the number of estimated passes to Black faces. For illustration purposes, results are displayed at uncorrected significance (P < .001) thresholds.
Brain activity predicts behavior in social interactive task, SIT
During the SIT, participants passed the ball to each one of the virtual co-players approximately equal number of times, 100% Black: M = 18.4; 75% Black: M = 20.45; 50% Black: M = 18.5; 75% White: M = 18.8; and 100% White: M = 19.4, p = .35. To test the prediction that individual differences in brain activity associated with the interaction of CS and race was related to biased interactive behavior, we created an index of interactive bias by subtracting the mean number of passes to the White target face from the mean number of passes to the Black target face [ranging from − 10 (maximum pro-Black) to 14 (maximum anti-Black), mean anti-Black interactive bias = 1] during the SIT. We found that CR Black > CR White in the left dorsal AI (− 44, 8, − 3; t = 4.82, pFWE-corrected = .013) during Extinction stage predicted an anti-Black bias in interactive behavior (see Fig. 6B). In other words, the stronger the activity in participants' dorsal AI during the expression of interaction effect (i.e., CR to Black vs. White faces), the less likely the participants were to pass the ball to new, unfamiliar, Black vs. White co-players. No other brain regions were related to the virtual social interaction. These results indicate that subsequent behavior towards new Black individuals could be predicted by the extent that the AI was active when viewing Black and White faces associated with aversive treatments. We did not find any significant relationships between individual IAT scores and brain activity. Interestingly, examining shock responses to Black CS + vs. White CS + faces reveled increased right amygdala activity (33, 4, − 26; t = 3.63, pFWE-corrected = .034) to Black faces, but not to White faces, which also predicted an anti-Black bias in interactive behavior. In other words, the stronger the activity in participants' right amygdala during receiving shocks to Black faces, the less likely the participants were to pass the ball to new, unfamiliar, Black vs. White co-players in the SIT.
Discussion
A central aim of the current study was to examine the neural mechanisms of the formation, extinction, and generalizability to behavior of learning biases in a racial group context. Our results demonstrate that activity in brain regions previously linked to conditioned fear, and perception of individuals belonging to racial or stigmatized out-groups, jointly contribute to differential brain activity and biased behavior based on race. Specifically, we found that amygdala and AI were key contributors in differentiating between White and Black faces both when acquiring and extinguishing fears. Although we did not find significant amygdala activity during the Extinction for our main contrast of interest (CR Black > CR White), we did find significant anterior insula activity in line with our predictions. Importantly, both amygdala and AI predicted interactive behavior.
Whereas previous studies have demonstrated a persistence of conditioned fear towards racial out-group members during extinction in terms of SCR (Mallan et al., 2013, Navarrete et al., 2009, Olsson et al., 2005), our study is the first to identify the underlying brain activity. Consistent with previous findings, our results indicated strong fear conditioning to both Black and White faces. These CRs were paralleled by activity in a network of brain regions previously implicated in the acquisition and expression of conditioned fear, including the amygdala, AI and ACC (Phelps and LeDoux, 2005). Activity in these regions greatly overlapped during the acquisition of CRs to both Black and White faces (Fig. 3A), consistent with the finding that mean CRs do not differentiate between White and Black faces during the acquisition of conditioned fear (e.g., Olsson et al., 2005). However, findings from the Acquisition stage revealed a greater time-dependent CR effect in the amygdala for White vs. Black faces. This was explained by increased amygdala activity over time to the Black CS − and White CS + faces, whereas responses to the Black CS + and White CS − remained largely unchanged over time (see Fig. 3B). Similarly, we found greater activity in the left dorsal and left ventral anterior insula for CRs to White vs. Black faces, again resulting from a more pronounced differentiation of White CSs (see interaction in Fig. 3C). We speculate that the relatively stronger differentiation of White faces during the acquisition might reflect a general in-group advantage in individuating and recognizing faces (Golby et al., 2001, Malpass and Kravitz, 1969), which could have strengthened differential conditioning. Along the same reasoning, a weaker individuation between the two Black out-group faces might have contributed to a greater generalization of fear response to the unsafe Black CS + and the safe Black CS − (Dunsmoor et al., 2011, Vervliet et al., 2010). An alternative explanation of these results is that the safe Black (CS −) and the unsafe White (CS +) stimuli both triggered a larger response because they violated the race stereotype (Blair et al., 2001). Indeed, previous research has demonstrated that the P300 is sensitive to stereotype violations, arguably through eliciting larger amplitudes than stereotypic associations (Bartholow et al., 2006). Other research has linked the P300 to amygdala activity (Davis and Whalen, 2001). In the present paradigm, this explanation seems, however, less likely in light of the demonstration that counter-stereotypic (publically known and well regarded) vs. unknown exemplars of Black faces have been shown to elicit less activity in the amygdala (Phelps et al., 2000). It should be noted that our fear conditioning procedure included aversive tactile stimulations to both types of faces, making our design very different from the experimental set-ups commonly used in research on counter-stereotyping. Unlike previous studies on the racial fear learning effect (e.g., Olsson et al., 2005), our results demonstrate for the first time, race dependent differences during the acquisition of conditioned fear.
Furthermore, during Extinction we found enhanced activity in the dorsal AI for CR to Black vs. White faces. In addition to be indicative of aversive subjective experiences (Craig, 2009) and processing of stigmatized individuals (Harris and Fiske, 2006), this activity might be associated with the attempt to control or down-regulate aversive experiences during confrontation with conditioned out-group faces. This conjecture is supported by research showing that the dorsal, in contrast to the ventral, AI is functionally connected to the brain's cognitive control network (Dosenbach et al., 2007) that is implicated in monitoring and control of conflicts between emotional responses and egalitarian motives (Amodio et al., 2008a, Amodio et al., 2008b). This reasoning received further support by the observation that the right supramarginal gyrus (rSMG), which has been linked to the attempt to avoid biased social judgments (Silani et al., 2013), displayed large clusters of activity for both CR Black > CR White, and for Black > White in the whole-brain analysis (see Table 3).
In contrast to the CRs during the Acquisition stage, a conjunction analysis revealed no overlapping neural activities during CRs to Black and CRs to White faces during extinction (Fig. 4A). Instead, and expected, we found activity increasing over time in left amygdala, bilateral fusiform gyrus, and right hippocampus to Black as compared to White faces (i.e., across CS + and CS −). These regions have been implicated in responses to threatening faces (amygdala and fusiform face area, FFA), and the expression of emotional memories (amygdala and hippocampus). The increasing amygdala activity to out-group faces resembles previous imaging studies on passive viewing of out-group vs. in-group faces (Kubota et al., 2012), underscoring the assumption that racial out-group faces can have a greater threat value irrespective of their pairings with aversive events.
Whereas previous studies on passive viewing of racial out-group faces have observed an enhanced activity in the FFA region of the fusiform gyrus to in-group relative to out-group faces (Kubota et al., 2012, Van Bavel et al., 2008), our results displayed the opposite pattern of activity with greater activity to Black faces. This is likely to reflect the greater threat value of the facial stimuli in our study, as compared to previous studies, resulting from the direct aversive learning experiences. This conclusion is consistent with research showing enhanced FFA activity to potentially threatening faces (Vuilleumier, Armony, Driver and Dolan, 2003). Indeed, previous findings support a role of this region in the enhanced processing of visual emotional stimuli, particularly unpleasant, highly salient stimuli (Kober et al., 2008, Sabatinelli et al., 2005, Straube et al., 2006). Interestingly, we demonstrated an enhanced coupling between the amygdala and the fusiform gyrus during the learning and expression of learned fear to Black faces during both Acquisition and Extinction stages. The enhanced connectivity between amygdala and the FFA in our results is consistent with the claim that the amygdala guides the visual system to prioritize encoding of visual information that best predict aversive events or threats (Anderson and Phelps, 2001). It is possible that the enhanced connectivity in our data reflects the fact that, after pairing with an aversive event (shock), the threat value affected the coding of Black and White faces differently. For example, and in support of previous studies showing that out vs. in-group faces are better remembered when they are potentially threatening (Ackerman et al., 2006), our results suggest that the threatening face (CS +) vs. CS − became relatively more salient — in the Black versus the White face pair.
Importantly, we found that the increased activity observed in the AI for CRs to Black vs. White faces predicted subsequent social interactions with unfamiliar Black and White individuals. Specifically, individual variability in preferential passing to the White vs. Black co-player, was predicted by an anti-Black learning bias observed in the dorsal AI. The link between the AI and a discriminatory bias is indicative of research describing the AI as important in the processing of stigmatized individual (Harris and Fiske, 2006), and decision making during uncertainty (Lamm and Singer, 2010, Singer et al., 2009). These results were paralleled by a link between amygdala reactivity to shocks following Black, but not White faces, and a pro-White discriminatory bias. The demonstrated link between biased learning, as well as unlearned aversive responses, in the brain to out-group faces and interactive behavior might indicate that (1) participants, who showed a learning bias towards Black individuals, also tended to display more discriminatory behaviors; (2) the aversive learning experience itself caused the interactive bias; or (3) a combination of (1) and (2). Unfortunately, our current data do not allow us to differentiate between these alternative explanations.
The activity observed in the dorsal AI and amygdala during the acquisition of CR to Black vs. White faces was also predictive of how many shocks participants reported to have received to Black, but not to White, faces. This finding suggests an intriguing link between the strength of the encoding of the aversive memories of receiving punishment paired with Black faces and the recall of the number of these aversive events on. Similar to the social interactive task (SIT) effect, this brain-behavior link might reflect the influence of a third variable, such as a latent personality trait and/or a causal effect of the learning experience on the subsequent verbal recall. Although there was no overall bias in the estimated number of shocks at the group level, the bias in recall of aversive events is reminiscent of findings in the research on ‘illusory correlations’, showing that the number of past aversive events paired with phobic stimuli, such as snakes and spiders, tend to be overestimated (Pauli et al., 1996). Similarly, the biased responses in the AI to out-group faces in our study might have exerted a similar effect on retrospective recall. It should be noted that not only individuals with a pro-White bias contributed to the observed correlations between brain responses during learning and subsequent interaction and memory recall. Also those who displayed a pro-Black bias in terms of brain responses (e.g., greater AI activity to White vs. Black CRs) consistently behaved pro-Black, and remembered more aversive events associated with White vs. Black faces. These findings strengthen the generality of the observed brain-behavior links.
Although we found activity in amygdala and AI indicative of race dependent learning effects, we found no learning bias as measured by the SCR during the Acquisition or Extinction stages; the former is consistent with findings from Olsson et al. (2005). Unfortunately, the low signal quality of the SCR during Extinction made it impossible to analyze or interpret any data. The lack of SCRs in the Extinction was likely to be due to the 1) long Acquisition stage leading to habituation of the signal, 2) an enhanced speed of extinction resulting from the 100% reinforcement rate and the length of the Extinction stage, and 3) an increased signal noise created by electronic inference due to the shifting magnetic gradients. After Extinction training on Day 1, participants returned for a Recall task. As predicted, SCRs during this task yielded larger CS + as compared to CS −. It should be noted that this task was conducted in a different context than Acquisition and Extinction, and consequently may represent a renewal of a conditioned response in this new context (Bouton, 2004). However, SCRs revealed no racial learning bias during this test.
Another caveat is the fact that we only included White participants in our experimental sample, which limits the generalizability of our conclusions to other social out-groups. Although previous behavioral studies have shown similar results for other categories of social out-groups (Van Bavel et al., 2011, Navarrete et al., 2012), further research needs to examine the neural mechanisms of learning biases to other out-groups to better understand the generalizability of the current results. Both male and female participants were included in our experimental sample, whereas only male faces served as CS. Therefore, female participants belonged to an additional out-group, gender, which could have influenced the results. Our SCR and fMRI results did however not reveal any differences based on gender, which is in agreement with previous findings on a race related learning bias (Navarrete et al., 2009, Olsson et al., 2005, Golkar et al., 2015).
Conclusions
Using a standard procedure to induce learned fear, our results describe a pattern of brain responses underlying fear learning towards Black and White faces in White participants. We showed that an enhanced activity in brain regions linked to fear learning and processing of race information, predicted biases in actual social behavior. A number of neuroimaging studies have investigated the neural components of acquisition and extinction of fears, and many others have examined the passive perception of in-group and out-group faces. Our results go beyond these observations by showing that basic learning processes differ depending on whom we are learning to fear or dislike, and that these differences can predict an out-group bias during subsequent memory recall and interactive behavior. Similar to the self-perpetuating vicious circle of phobic learning (Mineka and Zinbarg, 2006), a small initial learning bias based on race might lead to increasingly strong negative evaluations that, in turn, give rise to generalized behavioral biases in real-life social situations. We hope that the use of established models of aversive learning to study the underlying neural learning processes of social biases will help us to understand the mechanisms by which initially small biases might turn into xenophobic responses.
Acknowledgments
We thank Olof Hjorth for practical assistance with collecting data, and Christopher C. Berger for assistance with parts of the fMRI analyses. The authors declare no competing financial interests. This research was supported by Vetenskapsrådet (project 421-201-2084), Riksbankens Jubileumsfond (Grant P11-1017) and an Independent Starting Grant (284366; Emotional Learning in Social Interaction) from the European Research Council to Andreas Olsson.
Footnotes
Supplementary data to this article can be found online at http://dx.doi.org/10.1016/j.neuroimage.2015.07.015.
Appendix A. Supplementary data
Supplementary materials.
References
- Ackerman J.M., Shapiro J.R., Neuberg S.L., Kenrick D.T., Becker D.V., Griskevicius V., Maner J.K., Schaller M. They all look the same to me (unless they're angry): from out-group homogeneity to out-group heterogeneity. Psychol. Sci. 2006;17(10):836–840. doi: 10.1111/j.1467-9280.2006.01790.x. [DOI] [PubMed] [Google Scholar]
- Adolphs R. The biology of fear. Curr. Biol. 2013;23(2):R79–R93. doi: 10.1016/j.cub.2012.11.055. [DOI] [PMC free article] [PubMed] [Google Scholar]
- Amodio D.M., Devine P.G., Harmon-Jones E. 2008. Individual Differences in the Regulation of Intergroup Bias: The Role of Conflict Monitoring and Neural Signals for Control. [DOI] [PubMed] [Google Scholar]
- Amodio D.M., Devine P.G., Harmon-Jones E. Correction to Amodio et al. (2008) J. Pers. Soc. Psychol. 2008 [Google Scholar]
- Anderson A.K., Phelps E.A. Lesions of the human amygdala impair enhanced perception of emotionally salient events. Nature. 2001;411(6835):305–309. doi: 10.1038/35077083. [DOI] [PubMed] [Google Scholar]
- Bartholow B.D., Dickter C.L., Sestir M.A. 2006. Stereotype Activation and Control of Race Bias: Cognitive Control of Inhibition and its Impairment by Alcohol. [DOI] [PubMed] [Google Scholar]
- Blair I.V., Ma J.E., Lenton A.P. Imagining stereotypes away: the moderation of implicit stereotypes through mental imagery. J. Pers. Soc. Psychol. 2001;81(5):828–841. doi: 10.1037//0022-3514.81.5.828. [DOI] [PubMed] [Google Scholar]
- Bouton M. Context and behavioral processes in extinction. Learn. Mem. 2004;11:485–494. doi: 10.1101/lm.78804. [DOI] [PubMed] [Google Scholar]
- Breiter H.C., Etcoff N.L., Whalen P.J., Kennedy W.A., Rauch S.L., Buckner R.L., Rosen B.R. Response and habituation of the human amygdala during visual processing of facial expression. Neuron. 1996;17(5):875–887. doi: 10.1016/s0896-6273(00)80219-6. (Retrieved from http://www.ncbi.nlm.nih.gov/pubmed/8938120) [DOI] [PubMed] [Google Scholar]
- Büchel C., Morris J., Dolan R.J., Friston K.J. Brain systems mediating aversive conditioning: an event-related fMRI study. Neuron. 1998;20(5):947–957. doi: 10.1016/s0896-6273(00)80476-6. [DOI] [PubMed] [Google Scholar]
- Cahill L., McGaugh J.L. Mechanisms of emotional arousal and lasting declarative memory. Trends Neurosci. 1998;21(7):294–299. doi: 10.1016/s0166-2236(97)01214-9. (Retrieved from http://www.sciencedirect.com/science/article/pii/S0166223697012149) [DOI] [PubMed] [Google Scholar]
- Caprariello P.A., Cuddy A.J.C., Fiske S.T. Social structure shapes cultural stereotypes and emotions: a causal test of the stereotype content model. Group Process. Intergroup Relat. 2009;12(2):147–155. doi: 10.1177/1368430208101053. [DOI] [PMC free article] [PubMed] [Google Scholar]
- Craig A.D.B. How do you feel — now? The anterior insula and human awareness. Nat. Rev. Neurosci. 2009;10(1):59–70. doi: 10.1038/nrn2555. [DOI] [PubMed] [Google Scholar]
- Cuddy A.J.C., Fiske S.T., Kwan V.S.Y., Glick P., Demoulin S., Leyens J.-P., Ziegler R. Stereotype content model across cultures: towards universal similarities and some differences. Br. Psychol. Soc.Br. J. Soc. Psychol. 2009;48(Pt 1):1–33. doi: 10.1348/014466608X314935. [DOI] [PMC free article] [PubMed] [Google Scholar]
- Davis M., Whalen P.J. The amygdala: vigilance and emotion. Mol. Psychiatry. 2001;6(1):13–34. doi: 10.1038/sj.mp.4000812. [DOI] [PubMed] [Google Scholar]
- Deen B., Pitskel N.B., Pelphrey K.A. Three systems of insular functional connectivity identified with cluster analysis. Cereb. Cortex (New York, N.Y.: 1991) 2011;21(7):1498–1506. doi: 10.1093/cercor/bhq186. [DOI] [PMC free article] [PubMed] [Google Scholar]
- Dilger S., Straube T., Mentzel H.J., Fitzek C., Reichenbach J.R., Hecht H. Brain activation to phobia-related pictures in spider phobic humans: an event-related functional magnetic resonance imaging study. Neurosci. Lett. 2003;348:29–32. doi: 10.1016/s0304-3940(03)00647-5. [DOI] [PubMed] [Google Scholar]
- Dosenbach N.U.F., Fair D.A., Miezin F.M., Cohen A.L., Wenger K.K., Dosenbach R.A.T. Distinct brain networks for adaptive and stable task control in humans. Proc. Natl. Acad. Sci. U. S. A. 2007;104(26):11073–11078. doi: 10.1073/pnas.0704320104. [DOI] [PMC free article] [PubMed] [Google Scholar]
- Dunsmoor J.E., White A.J., LaBar K.S. Conceptual similarity promotes generalization of higher order fear learning. Learn. Mem. (Cold Spring Harbor, N.Y.) 2011;18(3):156–160. doi: 10.1101/lm.2016411. [DOI] [PMC free article] [PubMed] [Google Scholar]
- Fiske S.T., Bergsieker H.B., Russell A.M., Williams L. Images of black americans: then, “them”, and now, “Obama!”. Du Bois Rev. Soc. Sci. Res. Race. 2009;6(1):83–101. doi: 10.1017/S1742058X0909002X. [DOI] [PMC free article] [PubMed] [Google Scholar]
- Fredrikson M., Wik G., Annas P., Ericson K., Stone-Elander S. Functional neuroanatomy of visually elicited simple phobic fear: additional data and theoretical analysis. Psychophysiology. 1995;32:43–48. doi: 10.1111/j.1469-8986.1995.tb03404.x. [DOI] [PubMed] [Google Scholar]
- Friston K.J., Buechel C., Fink G.R., Morris J., Rolls E., Dolan R.J. Psychophysiological and modulatory interactions in neuroimaging. NeuroImage. 1997;6(3):218–229. doi: 10.1006/nimg.1997.0291. [DOI] [PubMed] [Google Scholar]
- Friston K.J., Ashburner J.T., Kiebel S.J., Nichols T.E., Penny W.D. Academic Press; 2006. Statistical Parametric Mapping: The Analysis of Functional Brain Images. [Google Scholar]
- Fürth D., Derbsch M., Andersson E., Golkar A., Lonsdorf T., Öhman A., Olsson A. 49th Annual Meeting of the Society for Psychophysiological Research. 2009. Learning to fear others through Pavlovian conditioning and social punishment. (52482459) [Google Scholar]
- Golby A.J., Gabrieli J.D., Chiao J.Y., Eberhardt J.L. Differential responses in the fusiform region to same-race and other-race faces. Nat. Neurosci. 2001;4(8):845–850. doi: 10.1038/90565. [DOI] [PubMed] [Google Scholar]
- Golkar A., Björnstjerna M., Olsson A. Learned fear to social outgroup members are determined by ethnicity and prior exposure. Front. Psychol. 2015;6(123) doi: 10.3389/fpsyg.2015.00123. [DOI] [PMC free article] [PubMed] [Google Scholar]
- Greenwald A.G., McGhee D.E., Schwartz J.L.K. Measuring individual differences in implicit cognition: the implicit association test. J. Pers. Soc. Psychol. 1998;74(6):1464–1480. doi: 10.1037//0022-3514.74.6.1464. [DOI] [PubMed] [Google Scholar]
- Hamilton W.D. The genetical evolution of social behaviour. I. J. Theor. Biol. 1964;7(1):1–16. doi: 10.1016/0022-5193(64)90038-4. [DOI] [PubMed] [Google Scholar]
- Hariri A.R., Mattay V.S., Tessitore A., Fera F., Weinberger D.R. Neocortical modulation of the amygdala response to fearful stimuli. Biol. Psychiatry. 2003;53(6):494–501. doi: 10.1016/s0006-3223(02)01786-9. (Retrieved from http://www.ncbi.nlm.nih.gov/pubmed/12644354) [DOI] [PubMed] [Google Scholar]
- Harris L.T., Fiske S.T. Dehumanizing the lowest of the low: neuroimaging responses to extreme out-groups. Psychol. Sci. 2006;17(10):847–853. doi: 10.1111/j.1467-9280.2006.01793.x. [DOI] [PubMed] [Google Scholar]
- Hart A.J., Whalen P.J., Shin L.M., McInerney S.C., Fischer H., Rauch S.L. Differential response in the human amygdala to racial outgroup vs ingroup face stimuli. Neuroreport. 2000;11(11):2351–2355. doi: 10.1097/00001756-200008030-00004. (Retrieved from http://www.ncbi.nlm.nih.gov/pubmed/10943684) [DOI] [PubMed] [Google Scholar]
- Kapp B.S., Whalen P.J., Supple W.F., Pascoe J.P. The amygdala: Neurobiological Aspects of Emotion, Memory, and Mental Dysfunction. 1992. Amygdaloid contributions to conditioned arousal and sensory information processing; pp. 229–254. (Retrieved from http://ezproxy.net.ucf.edu/login?url=http://search.ebscohost.com/login.aspx?direct=true&db=psyh&AN=1992-97763-004&site=ehost-live) [Google Scholar]
- Kober H., Barrett L., Joseph J. Functional grouping and cortical–subcortical interactions in emotion: a meta-analysis of neuroimaging studies. Neuroimage. 2008;42(2):998–1031. doi: 10.1016/j.neuroimage.2008.03.059. [DOI] [PMC free article] [PubMed] [Google Scholar]
- Kubota J.T., Banaji M.R., Phelps E.A. The neuroscience of race. Nat. Neurosci. 2012;15(7):940–948. doi: 10.1038/nn.3136. [DOI] [PMC free article] [PubMed] [Google Scholar]
- LaBar K.S., LeDoux J.E. Partial disruption of fear conditioning in rats with unilateral amygdala damage: correspondence with unilateral temporal lobectomy in humans. Behav. Neurosci. 1996;110:991–997. doi: 10.1037//0735-7044.110.5.991. [DOI] [PubMed] [Google Scholar]
- LaBar K.S., Gatenby J.C., Gore J.C., LeDoux J.E., Phelps E.A. Human amygdala activation during conditioned fear acquisition and extinction: a mixed-trial fMRI study. Neuron. 1998;20(5):937–945. doi: 10.1016/s0896-6273(00)80475-4. [DOI] [PubMed] [Google Scholar]
- Lamm C., Singer T. The role of anterior insular cortex in social emotions. Brain Struct. Funct. 2010;214(5-6):579–591. doi: 10.1007/s00429-010-0251-3. [DOI] [PubMed] [Google Scholar]
- Langner O., Dotsch R., Bijlstra G., Wigboldus D.H.J., Hawk S.T., van Knippenberg A. Presentation and validation of the Radboud Faces Database. Cogn. Emot. 2010;24(8):1377–1388. [Google Scholar]
- Lieberman M.D., Hariri A., Jarcho J.M., Eisenberger N.I., Bookheimer S.Y. An fMRI investigation of race-related amygdala activity in African-American and Caucasian-American individuals. Nat. Neurosci. 2005;8:720–722. doi: 10.1038/nn1465. [DOI] [PubMed] [Google Scholar]
- Lonsdorf T.B., Haaker J., Kalisch R. Long-term expression of human contextual fear and extinction memories involves amygdala, hippocampus and ventromedial prefrontal cortex: a reinstatement study in two independent samples. Soc. Cogn. Affect. Neurosci. 2014 doi: 10.1093/scan/nsu018. (nsu018–) [DOI] [PMC free article] [PubMed] [Google Scholar]
- Mallan K.M., Lipp O.V., Cochrane B. Slithering snakes, angry men and out-group members: what and whom are we evolved to fear? Cogn. Emot. 2013;27(7):1168–1180. doi: 10.1080/02699931.2013.778195. [DOI] [PubMed] [Google Scholar]
- Mallan K.M., Sax J., Lipp O.V. Verbal instruction abolishes fear conditioned to racial out-group faces. J. Exp. Soc. Psychol. 2009;45:1303–1307. [Google Scholar]
- Malpass R.S., Kravitz J. Recognition for faces of own and other race. J. Pers. Soc. Psychol. 1969;13(4):330–334. doi: 10.1037/h0028434. [DOI] [PubMed] [Google Scholar]
- Manson J.H., Wrangham R.W. Intergroup aggression in chimpanzees and humans. Curr. Anthropol. 1991;32:369–377. [Google Scholar]
- Maren S., Fanselow M.S. The amygdala and fear conditioning: has the nut been cracked? Neuron. 1996 doi: 10.1016/s0896-6273(00)80041-0. [DOI] [PubMed] [Google Scholar]
- Marschner A., Kalisch R., Vervliet B., Vansteenwegen D., Büchel C. Dissociable roles for the hippocampus and the amygdala in human cued versus context fear conditioning. J. Neurosci. 2008;28(36):9030–9036. doi: 10.1523/JNEUROSCI.1651-08.2008. [DOI] [PMC free article] [PubMed] [Google Scholar]
- McLaren D.G., Ries M.L., Xu G., Johnson S.C. A generalized form of context-dependent psychophysiological interactions (gPPI): a comparison to standard approaches. NeuroImage. 2012;61:1277–1286. doi: 10.1016/j.neuroimage.2012.03.068. (Retrieved from http://www.sciencedirect.com/science/article/pii/S1053811912003497) [DOI] [PMC free article] [PubMed] [Google Scholar]
- Mineka S., Zinbarg R. A contemporary learning theory perspective on the etiology of anxiety disorders: it's not what you thought it was. Am. Psychol. 2006;61(1):10–26. doi: 10.1037/0003-066X.61.1.10. [DOI] [PubMed] [Google Scholar]
- Morris J. A neuromodulatory role for the human amygdala in processing emotional facial expressions. Brain. 1998;121(1):47–57. doi: 10.1093/brain/121.1.47. [DOI] [PubMed] [Google Scholar]
- Mutschler I., Wieckhorst B., Kowalevski S., Derix J., Wentlandt J., Schulze-Bonhage A., Ball T. Functional organization of the human anterior insular cortex. Neurosci. Lett. 2009;457:66–70. doi: 10.1016/j.neulet.2009.03.101. [DOI] [PubMed] [Google Scholar]
- Navarrete C.D., Olsson A., Ho A.K., Mendes W.B., Thomsen L., Sidanius J. Fear extinction to an out-group face: the role of target gender. Psychol. Sci. 2009;20(2):155–158. doi: 10.1111/j.1467-9280.2009.02273.x. [DOI] [PubMed] [Google Scholar]
- Navarrete C.D., McDonald M.M., Asher B.D., Kerr N.L., Yokota K., Olsson A., Sidanius J. Fear is readily associated with an out-group face in a minimal group context. Evol. Hum. Behav. 2012;33(5):590–593. [Google Scholar]
- Nichols T., Brett M., Andersson J., Wager T., Poline J.-B. Valid conjunction inference with the minimum statistic. NeuroImage. 2005;25(3):653–660. doi: 10.1016/j.neuroimage.2004.12.005. [DOI] [PubMed] [Google Scholar]
- Olsson A., Ebert J.P., Banaji M.R., Phelps E.A. The role of social groups in the persistence of learned fear. Science (New York, N.Y.) 2005;309(5735):785–787. doi: 10.1126/science.1113551. [DOI] [PubMed] [Google Scholar]
- Öhman A., Mineka S. Fears, phobias, and preparedness: toward an evolved module of fear and fear learning. Psychol. Rev. 2001;108:483–522. doi: 10.1037/0033-295x.108.3.483. [DOI] [PubMed] [Google Scholar]
- Paquette V., Lévesque J., Mensour B., Leroux J.-M., Beaudoin G., Bourgouin P., Beauregard M. “Change the mind and you change the brain”: effects of cognitive-behavioral therapy on the neural correlates of spider phobia. NeuroImage. 2003;18(2):401–409. doi: 10.1016/s1053-8119(02)00030-7. (Retrieved from http://www.ncbi.nlm.nih.gov/pubmed/12595193) [DOI] [PubMed] [Google Scholar]
- Pauli P., Montoya P., Martz G.-E. Covariation bias in panic-prone individuals. J. Abnorm. Psychol. 1996;105(4):658–662. doi: 10.1037//0021-843x.105.4.658. [DOI] [PubMed] [Google Scholar]
- Pavlov I. 1927. Conditioned Reflexes. [Google Scholar]
- Phelps E.A. Human emotion and memory: interactions of the amygdala and hippocampal complex. Curr. Opin. Neurobiol. 2004;14(2):198–202. doi: 10.1016/j.conb.2004.03.015. (Retrieved from http://www.sciencedirect.com/science/article/pii/S0959438804000479) [DOI] [PubMed] [Google Scholar]
- Phelps E.A., LeDoux J.E. Contributions of the amygdala to emotion processing: from animal models to human behavior. Neuron. 2005;48(2):175–187. doi: 10.1016/j.neuron.2005.09.025. [DOI] [PubMed] [Google Scholar]
- Phelps E.A., O'Connor K.J., Cunningham W.A., Funayama E.S., Gatenby J.C., Gore J.C., Banaji M.R. Performance on indirect measures of race evaluation predicts amygdala activation. J. Cogn. Neurosci. 2000;12(5):729–738. doi: 10.1162/089892900562552. [DOI] [PubMed] [Google Scholar]
- Phelps E.A., Delgado M.R., Nearing K.I., LeDoux J.E. Extinction learning in humans: role of the amygdala and vmPFC. Neuron. 2004;43(6):897–905. doi: 10.1016/j.neuron.2004.08.042. [DOI] [PubMed] [Google Scholar]
- Phelps E.A., Delgado M.R., Nearing K.I., LeDoux J.E. Extinction learning in humans: role of the amygdala and vmPFC. Neuron. 2004;43(6):897–905. doi: 10.1016/j.neuron.2004.08.042. [DOI] [PubMed] [Google Scholar]
- Quirk G.J., Armony J.L., LeDoux J.E. Fear conditioning enhances different temporal components of tone-evoked spike trains in auditory cortex and lateral amygdala. Neuron. 1997;19(3):613–624. doi: 10.1016/s0896-6273(00)80375-x. (Retrieved from http://www.ncbi.nlm.nih.gov/pubmed/9331352) [DOI] [PubMed] [Google Scholar]
- Richeson J.A., Baird A.A., Gordon H.L., Heatherton T.F., Wyland C.L., Trawalter S., Shelton J.N. An fMRI investigation of the impact of interracial contact on executive function. Nat. Neurosci. 2003;6:1323–1328. doi: 10.1038/nn1156. [DOI] [PubMed] [Google Scholar]
- Sabatinelli D., Bradley M.M., Fitzsimmons J.R., Lang P.J. Parallel amygdala and inferotemporal activation reflect emotional intensity and fear relevance. NeuroImage. 2005;24:1265–1270. doi: 10.1016/j.neuroimage.2004.12.015. [DOI] [PubMed] [Google Scholar]
- Sabatinelli D., Lang P.J., Keil A., Bradley M.M. Emotional perception: correlation of functional MRI and event-related potentials. Cereb. Cortex. 2007;17:1085–1091. doi: 10.1093/cercor/bhl017. [DOI] [PubMed] [Google Scholar]
- Silani G., Lamm C., Ruff C.C., Singer T. Right supramarginal gyrus is crucial to overcome emotional egocentricity bias in social judgments. J. Neurosci. 2013;33(39):15466–15476. doi: 10.1523/JNEUROSCI.1488-13.2013. [DOI] [PMC free article] [PubMed] [Google Scholar]
- Singer T., Critchley H.D., Preuschoff K. A common role of insula in feelings, empathy and uncertainty. Trends Cogn. Sci. 2009;13(8):334–340. doi: 10.1016/j.tics.2009.05.001. [DOI] [PubMed] [Google Scholar]
- Straube T., Mentzel H., Miltner W. Neural mechanisms of automatic and direct processing of phobogenic stimuli in specific phobia. Biol. Psychiatry. 2006;59:162–170. doi: 10.1016/j.biopsych.2005.06.013. (Available at: http://www.ncbi.nlm.nih.gov/pubmed/16139812) [DOI] [PubMed] [Google Scholar]
- Tottenham N., Tanaka J.W., Leon A.C., McCarry T., Nurse M., Hare T.A. The NimStim set of facial expressions: judgments from untrained research participants. Psychiatry Res. 2009;168(3):242–249. doi: 10.1016/j.psychres.2008.05.006. [DOI] [PMC free article] [PubMed] [Google Scholar]
- Van Bavel J.J., Cunningham W.A. Self-categorization with a novel mixed-race group moderates automatic social and racial biases. Personal. Soc. Psychol. Bull. 2009;35:321–335. doi: 10.1177/0146167208327743. [DOI] [PubMed] [Google Scholar]
- Van Bavel J.J., Packer D.J., Cunningham W.A. The neural substrates of in-group bias: a functional magnetic resonance imaging investigation. Psychol. Sci. 2008;19(11):1131–1139. doi: 10.1111/j.1467-9280.2008.02214.x. [DOI] [PubMed] [Google Scholar]
- Van Bavel J.J., Packer D.J., Cunningham W.A. Modulation of the Fusiform Face Area following Minimal Exposure to Motivationally Relevant Faces: Evidence of In-group Enhancement (Not Out-group Disregard) 2011. http://www.mitpressjournals.org/doi/abs/10.1162/jocn_a_00016 Retrieved from. [DOI] [PubMed]
- Vervliet B., Kindt M., Vansteenwegen D., Hermans D. Fear generalization in humans: impact of prior non-fearful experiences. Behav. Res. Ther. 2010;48(11):1078–1084. doi: 10.1016/j.brat.2010.07.002. [DOI] [PubMed] [Google Scholar]
- Vuilleumier P., Armony J.L., Driver J., Dolan R.J. Distinct spatial frequency sensitivities for processing faces and emotional expressions. Nat. Neurosci. 2003;6:624–631. doi: 10.1038/nn1057. [DOI] [PubMed] [Google Scholar]
- Vuilleumier P., Driver J. Modulation of visual processing by attention and emotion: windows on causal interactions between human brain regions. Philos. Trans. R. Soc. Lond. B Biol. Sci. 2007;362:837–855. doi: 10.1098/rstb.2007.2092. [DOI] [PMC free article] [PubMed] [Google Scholar]
- Vuilleumier P., Pourtois G. Distributed and interactive brain mechanisms during emotion face perception: evidence from functional neuroimaging. Neuropsychologia. 2007;45(1):174–194. doi: 10.1016/j.neuropsychologia.2006.06.003. [DOI] [PubMed] [Google Scholar]
- Whalen P.J., Rauch S.L., Etcoff N.L., McInerney S.C., Lee M.B., Jenike M.A. Masked presentations of emotional facial expressions modulate amygdala activity without explicit knowledge. J. Neurosci. 1998;18:411–418. doi: 10.1523/JNEUROSCI.18-01-00411.1998. (9412517) [DOI] [PMC free article] [PubMed] [Google Scholar]
- Wheeler M.E., Fiske S.T. Controlling racial prejudice: social-cognitive goals affect amygdala and stereotype activation. Psychol. Sci. 2005;16:56–63. doi: 10.1111/j.0956-7976.2005.00780.x. [DOI] [PubMed] [Google Scholar]
- Williams K.D., Jarvis B. Cyberball: a program for use in research on interpersonal ostracism and acceptance. Behav. Res. Methods. 2006;38(1):174–180. doi: 10.3758/bf03192765. [DOI] [PubMed] [Google Scholar]
Associated Data
This section collects any data citations, data availability statements, or supplementary materials included in this article.
Supplementary Materials
Supplementary materials.