Abstract
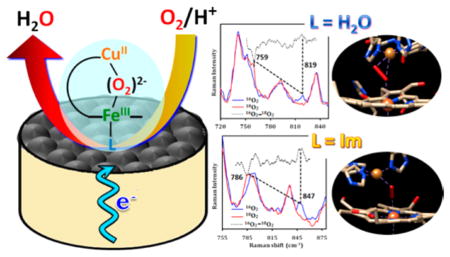
A synthetic heme–Cu CcO model complex shows selective and highly efficient electrocatalytic 4e−/4H+ O2-reduction to H2O with a large catalytic rate (>105 M−1 s−1). While the heme-Cu model (FeCu) shows almost exclusive 4e−/4H+ reduction of O2 to H2O (detected using ring disk electrochemistry and rotating ring disk electrochemistry), when imidazole is bound to the heme (Fe(Im)Cu), this same selective O2-reduction to water occurs only under slow electron fluxes. Surface enhanced resonance Raman spectroscopy coupled to dynamic electrochemistry data suggests the formation of a bridging peroxide intermediate during O2-reduction by both complexes under steady state reaction conditions, indicating that O–O bond heterolysis is likely to be the rate-determining step (RDS) at the mass transfer limited region. The O–O vibrational frequencies at 819 cm−1 in 16O2 (759 cm−1 in 18O2) for the FeCu complex and at 847 cm−1 (786 cm−1) for the Fe(Im)Cu complex, indicate the formation of side-on and end-on bridging Fe-peroxo-Cu intermediates, respectively, during O2-reduction in an aqueous environment. These data suggest that side-on bridging peroxide intermediates are involved in fast and selective O2-reduction in these synthetic complexes. The greater amount of H2O2 production by the imidazole bound complex under fast electron transfer is due to 1e−/1H+ O2-reduction by the distal Cu where O2 binding to the water bound low spin FeII complex is inhibited.
INTRODUCTION
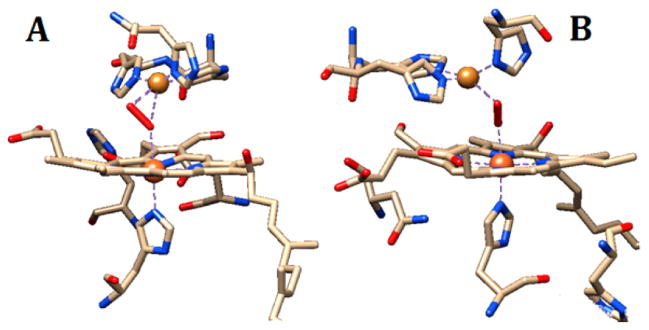
Cytochrome c oxidase (CcO), a heme-copper enzyme, catalyzes the 4e−/4H+ reduction of O2 to H2O in the terminal step of the electron transport chain during respiration.1–4 The investigations of oxygen reduction by synthetic heme-Cu models are also related to fuel cell cathode catalysts as they provide fundamental insight into the factors that lead to efficient O2 reduction materials. CcO has attracted paramount interest of synthetic inorganic and bioinorganic chemists due to its great fundamental and practical importance in understanding dioxygen activation/reduction, and proton translocation, etc.5–10 The X-ray structures of CcO reveal the active site responsible for O2 binding and reduction, to be a binuclear site comprising of heme-a3, with a proximal histidine (His) along with a distal side histidine bound copper (CuB).3,11,12 One of these three ligating His residues is covalently cross-linked to a nearby tyrosine (Tyr) residue which is said to act as a source of electron and proton in the reduction of O2 and proton translocation.13,14 This chemistry stems from the characterization of an intermediate PM (ferryl FeIV=O and CuII–OH/H2O), formed after the O–O bond cleavage in CcO, which suggests the presence of a Tyr radical.15,16 Recent literature suggests that O2 initially binds to CuB (at an overall rate ~108 s−1) which is then readily transferred to heme-a3 (at an overall rate ~105 s−1) forming an initial Fe–O2 adduct analogous to oxy-hemoglobin/myoglobin.2,14,17 A bridging peroxide FeIII-(O2)2−-CuII (either side-on or end-on) intermediate preceding PM has been characterized spectroscopically and structurally in some CcO active sites; their relevance in catalytic O2 reduction, while invoked in a few investigations, is not clear (Figure 1).18–24
Figure 1.
Binuclear active site structures of CcO showing (A) side-on (μ–η1:η2) (η1 at Fe center and η2 at Cu center) (PDB ID: 3ABM)25 and (B) end-on (μ-1, 2) (PDB ID: 3S8F) bridging peroxo complexes.
The investigation of synthetic heme-Cu systems has greatly assisted our understanding of the reaction mechanism of dioxygen reduction and factors that lead to selective 4e−/4H+ reduction of O2 avoiding formation of detrimental partially reduced oxygen species (PROS).19,26–30 While Collman and coworkers have reported the initial formation of an Fe–O2 adduct followed by PM-like intermediate formation with their functional CcO model under rate limiting conditions,27,26 Karlin’s group have stressed on the formation of a bridging peroxide as a possible intermediate during O2-reduction under single turnover conditions.19,31–33 These bridging peroxo intermediates can also be interconverted, in some cases, from a side-on to an end-on product in synthetic myoglobin34,35 or CcO models18,29,32 upon incorporation of an external strong field ligand like imidazole or its analogues. In spite of obtaining significant knowledge and insight into the O2 reduction mechanism under single turnover conditions in organic solvents, the mechanistic details in an aqueous environment remains unresolved due to the lack of direct spectroscopic evidence, which motivates our present study.
Examples of electrocatalytic O2-reduction reactions (ORR) employing synthetic CcO model complexes containing Fe-only and Fe–Cu centers have been reported at physiological pH.29,30,36 Although the presence of Cu ion was initially thought to be essential for selective 4e− reduction of O2, it has now been established that the presence of Cu is only necessary when the electron transfer (ET) from the electrode is slow.26,28 The presence of a strong sixth ligand coordinated to the heme center may influence and alter the ORR reactivity. Recently, an experimental setup has been developed where dynamic electrochemistry (rotating disk electrochemistry; RDE) is coupled to a powerful spectroscopic tool, surface enhanced resonance Raman spectroscopy (SERRS) which allows direct in situ investigations of the reactive intermediates formed under steady state conditions and thus aids the elucidation of the reaction mechanism for electrocatalytic ORR.37
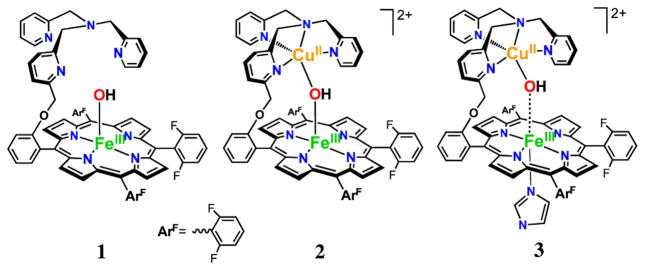
In this study, the electrocatalytic O2-reductions of a heme-copper 6L-FeCu complex (2, Figure 2) and its imidazole adduct 6L-Fe(Im)Cu (3, Figure 2) have been investigated at physiological pH under steady state conditions, in order to (i) evaluate the efficiencies of this group of complexes under aqueous conditions and (ii) detect intermediates formed during O2-reduction. Results from study of the Fe-only complex (1, Figure 2) serve as a control to evaluate the role of the copper. We find that 1 and 2 selectively reduce O2 to H2O under fast electron-transfer (ET) flux, while 3 is less selective in doing so under similar conditions. In fact, the production of PROS decreases with a decrease in ET rate for complex 3 in contrast to complexes 1, 2 and all other reported Fe–Cu systems.6,26,28,38–40 The SERRS and SERRS-RDE techniques employed here not only allow identification of intermediates and probable ORR mechanism, but also help to deduce ratedetermining steps, supplementing the information obtained from electrochemical data alone.
Figure 2.
6L-Fe (1), 6L-FeCu (2), and 6L-Fe(Im)Cu (3) are the synthetic model complexes used for this study.
RESULTS AND ANALYSIS
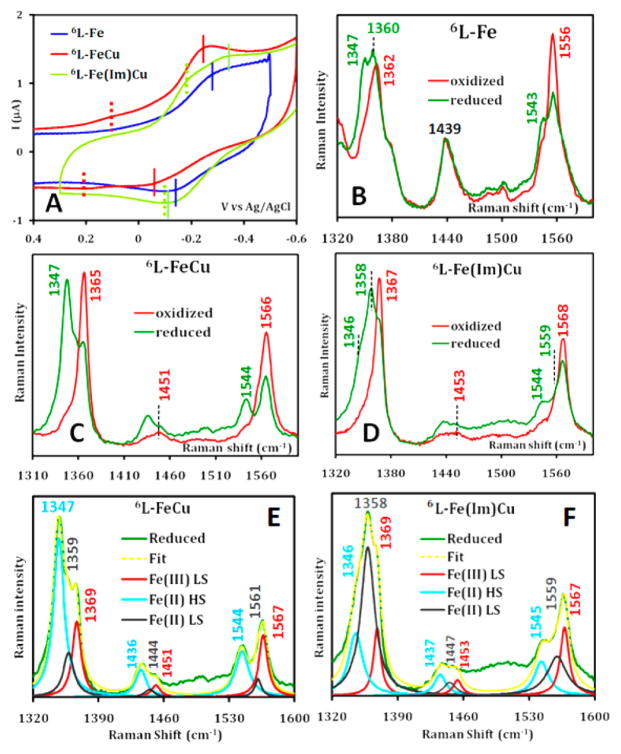
Cyclic voltammetry (CV) of complex 1, which has been physiabsorbed on an edge plane graphite (EPG) electrode in deoxygenated pH 7 phosphate buffer, shows a reversible FeIII/II couple at −210 mV (Figure 3A, blue). Complex 2 shows two reversible CV waves at −155 and 173 mV, which may be ascribed to the E1/2 for the FeIII/II and CuII/I processes, respectively (Figure 3A, red). The E1/2 for the FeIII/II couple of 1, which has an OH− as the axial ligand, appears at a more negative potential than 2. Moreover, the presence of distal Cu site in complex 2 is responsible for slight positive shift in FeIII/II potential compared to complex 1. The CV of 2 obtained here on EPG under aqueous condition is different from that in other CcO models obtained in aqueous or organic media, where both the FeIII/II and CuII/I CV waves appear at same potentials.19,28 The CV of 3 indicates that the E1/2 for the FeIII/II and CuII/I processes, though very close, are somewhat distinguishable in the cathodic process but overlap completely in the anodic reaction (Figure 3A, green). Therefore, it is quite ambiguous to extract the respective E1/2 values from the CV data. The E1/2 values for the two processes appear at more negative potentials compared to complex 2.41 This is likely due to the binding of imidazole as the sixth ligand to the Fe center (when one equivalent of imidazole is added externally to complex 2, it binds to the Fe site only as observed from the distinct resonance Raman signal in homogeneous medium; see Figure S1, Supporting Information and the Experimental Details section) which weakens trans Fe–O bond, strengthening the Cu–O bond in this complex, which lowers the E1/2 values of both the Fe and Cu centers compared to those in complex 2. Note that in CcO as well as in its synthetic mimics (where imidazole is covalently bound to heme center), the heme and Cu ion potentials are almost the same.28,26 Integration of the charge yields the surface coverage, i.e., the number of the electroactive species present on the electrodes. Complexes 1 and 2 show coverages of (2.36 ± 0.33) × 10−11 and (1.3 ± 0.05) × 10−11 mol/cm2 integrating the FeIII/II redox process, respectively. Analogously, the coverage of Cu in the 6L-FeCu is estimated to be (0.97 ± 0.06) × 10−11 mol/cm2 implying that the Fe:Cu ratio in complex 2 is close to 1:1, consistent with the formulations of the complex. Note that the individual coverage of Fe and Cu in complex 3 cannot be determined due to overlapping of the FeIII/II and CuII/I redox processes (Figure 3A, green). However, the total integrated charge of (2.08 ± 0.12) × 10−11 mol/cm2 for complex 3 is two times greater than the individual coverage of Fe and Cu obtained for complex 2 consistent with the presence of two electroactive redox centers in 3.
Figure 3.
(A) CV data of complexes 1 (blue), 2 (red), and 3 (green) physiabsorbed on an EPG electrode in deoxygenated pH 7 buffer under an argon atmosphere at a scan rate of 50 mV/s using Ag/AgCl as reference and Pt wire as counter electrodes. SERRS data of 1 (B), 2 (C), and 3 (D), physiabsorbed on a C8SH modified Ag disk, under oxidizing (red) and reducing (green) conditions in pH 7 buffer under anaerobic conditions at a constant rotation rate of 200 rpm. (E) and (F) are the ν4, ν3, and ν2 bands of the spectra obtained at reducing conditions of complex 2 and 3, respectively, along with their Lorentzian fits showing different components.
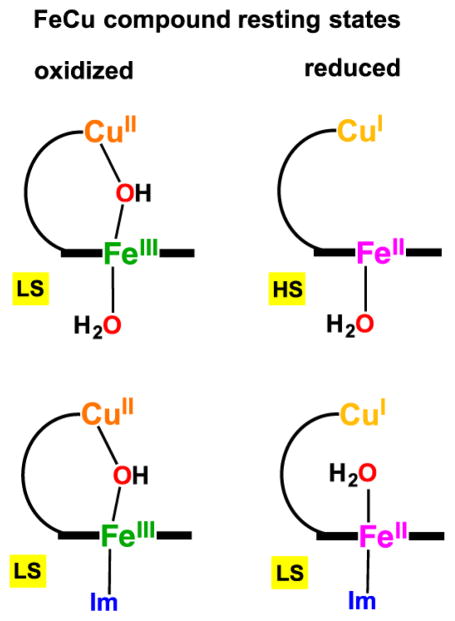
SERRS was performed on the catalysts 1, 2 and 3 immobilized on C8SH self-assembled monolayer (SAM) modified roughened Ag surfaces. SERRS data were obtained, both when the catalysts were in their respective resting oxidized state and also under reducing conditions in aqueous pH 7 buffer. SERRS data for 1 under resting conditions exhibits oxidation state (ν4), coordination number (ν3) and spin state (ν2) marker bands at 1362, 1439, and 1556 cm−1, respectively, indicating the presence of a five-coordinated (5C) FeIII high-spin (HS) species on the surface (Figure 3B, red).42,43 Upon reduction, the formation of a HS FeII species, having the ν4 and ν2 bands at 1347 and 1543 cm−1, respectively, is observed (Figure 3B, green and Figure S2, Supporting Information).40,42,44,45 The SERRS spectrum of 2 at oxidizing potentials (0 V vs Ag/AgCl), i.e., under resting conditions has the ν4, ν3, and ν2 bands at 1365, 1451, and 1566 cm−1, respectively, which correspond to a six-coordinated (6C) low-spin (LS) FeIII species (Chart 1 and Figure 3C, red). Upon reduction, new ν4, ν3, and ν2 bands at 1347, 1436, and 1544 cm−1 are observed which correspond to a HS FeII species (Chart 1, Figure 3C, green, and Figure 3E).46 SERRS data of 3 at oxidizing potential show the ν4, ν3, and ν2 bands at 1367, 1453, and 1568 cm−1, respectively, indicating the presence of a 6C FeIII LS species (Chart 1 and Figure 3D, red). This complex 3, when reduced, mainly leads to the formation of a LS FeII species with the ν4, ν3, and ν2 bands at 1358, 1447, and 1559 cm−1, respectively (Chart 1 and Figure 3D, green). However, a Lorentzian fit of this reduced spectrum shows the presence of some HS FeII component as well (Figure 3F).
Chart 1.
In the case of complex 2, the resting oxidized state is observed to be LS when immobilized on the electrode (Figure 3C) unlike in an organic solvent where it is high spin.33 The change in spin state in 2 is likely due to the fact that complex 2 binds water (from bulk solvent) as an axial ligand (Chart 1). However, for complex 3 the sixth position has already been occupied by the external imidazole ligand before immobilization and it is LS in both organic solvent and aqueous medium (Chart 1, Figure 3D and Figure S1A, Supporting Information). Upon reduction, FeII HS and FeII LS species have been obtained as the major components for complexes 2 and 3, respectively. Hence, it may be proposed that these two complexes exist as 5C water bound FeII HS and Im-water bound 6C FeII LS, respectively (Chart 1, right panel) when reduced. A similar distribution of components along with their assignments has been observed previously in SERRS experiments with similar Fe-porphyrin complexes.38,40 Note that imidazole and water bound LS FeII species, although proposed in some synthetic systems, are yet to be structurally characterized.47,48
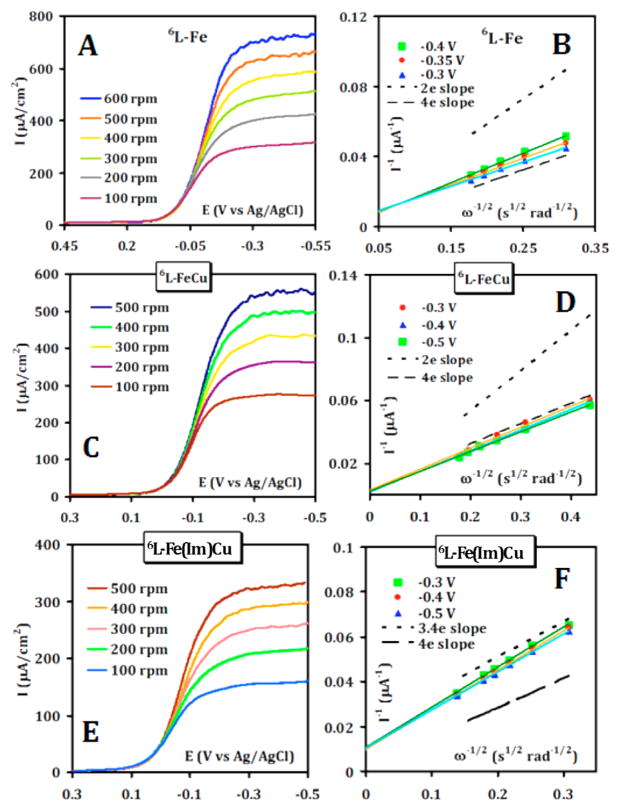
The electrocatalytic O2 reduction using complexes 1, 2 and 3 has been investigated using the rotating disk electrochemistry (RDE) technique in air-saturated pH 7 buffer. Linear sweep voltammetry (LSV) of the complexes at different rotation rates shows a substrate diffusion limited catalytic O2-reduction current below −100 mV vs Ag/AgCl (Figure 4). This current increases with increasing rotation rates following the Koutecky–Levich (K–L) equation, I−1 = iK(E)−1 + iL−1, where iK(E) is the potential dependent kinetic current and iL is the Levich current where iL is expressed by 0.62nFA[O2](DO2)2/3ω1/2v−1/6 and n is the number of electrons transferred to the substrate, A is the macroscopic area of the disk (0.096 cm2), [O2] is the concentration of O2 in an air saturated buffer (0.26 mM) at 25 °C, DO2 is the diffusion coefficient of O2 (1.8 × 10⁻⁵ cm2 s−1) at 25 °C, ω is the angular velocity of the disk and v is the kinematic viscosity of the solution (0.009 cm2 s−1) at 25 °C.49,50 From the slope of a plot of I−1 versus the inverse square root of the angular rotation rate (ω−1/2), the number of electrons delivered to the substrate during electrocatalytic ORR can be evaluated. The slopes obtained from the experimental data for catalysts 1 and 2 are almost identical to the theoretical slope predicted for a 4e− O2 reduction process (Figure 4B, D). However, for complex 3, the slope corresponds to a 3.4e− process (Figure 4F). The values of n obtained indicate that under conditions of very fast electron transfer (as occurs on EPG electrodes), O2 undergoes almost complete 4e− reduction to H2O when catalyzed by 1 and 2 but not by 3 (vide infra). The second order rate of catalysis (kcat) for ORR can also be obtained from the intercept of this K–L plot using the formula: iK = nFAkcatΓcat[O2]. The kcat values are obtained to be (3.65 ± 1.1) × 106, (4.49 ± 0.9) × 106, and (1.28 ± 0.11) × 106 M−1 s−1 for complexes 1, 2, and 3, respectively. These facts indicate that the selectivity and efficiency for 4e−/4H+ O2-reduction are better for the FeCu complex as compared to its imidazole adduct. It should be noted that the second order rate constant of 4e−/4H+ ORR by complex 2 is 1 order of magnitude greater than FeCu complexes reported earlier.6,28 The slower reactivity of those synthetic heme-Cu systems may be due to a slower rate of O2 binding to the 6C LS reduced iron center.28,47,51
Figure 4.
LSV of 1 (A), 2 (C), and 3 (E) physiabsorbed on EPG in air saturated pH 7 buffer at a scan rate of 50 mV/s at multiple rotations using Ag/AgCl as reference and Pt wire as counter electrodes. The K–L plots of the respective catalysts at various potentials are given in (B), (D), and (F). The theoretical plots for 2e−, 3.4e−, and 4e− processes are also indicated in the figures.
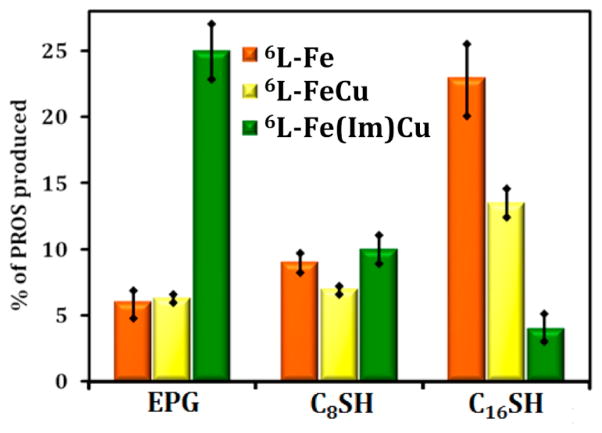
The selectivity of this electrocatalytic O2 reduction by the catalysts 1, 2 and 3 and its dependence on the ET rate from the electrodes has been further evaluated by rotating ring disk electrochemistry (RRDE).26,28,38,52 Physiabsorption of the catalysts on EPG, C8SH modified Au and C16SH modified Au electrodes allows fast (kET > 105 s−1), moderate (kET ~ 103 s−1) and slow (kET ~ 4–6 s−1) electron transfer fluxes, respectively.26,53 RRDE measures the amount of PROS produced (in situ), if any, due to incomplete O2 reduction. The amount of PROS produced at pH 7 by 1 under fast, moderate, and slow electron fluxes are 6 ± 1%, 9 ± 0.5%, and 23 ± 3%, respectively (Figure 5 and Figure S3, Supporting Information). We find that with the “extra” redox center, the copper ion in complex 2, PROS quantities decrease, compared to 1, and the difference in PROS production is more prominent under slow electron flux (Figure 5 and Figure S4, Supporting Information);28 the estimated PROS generated by 2 are 6.3 ± 0.1%, 7 ± 0.1%, and 13.5 ± 1% when physiabsorbed on EPG, C8SH SAM, and C16SH SAM, respectively. As observed for other CcO mimics and porphyrin complexes,26,38–40 1 and 2 also show the same general trend of increasing PROS generation with a decrease in the rate of electron transfer from the electrode. However, complex 3 shows the opposite trend, where on EPG the amount of PROS produced is 25 ± 2%, i.e., only 75% of the O2 was fully reduced by a 4e−/4H+ process to give H2O (Figure 5). In fact, this agrees well with the observed finding of n = 3.4 (n = 3.5 theoretically if 25% PROS is produced), that obtained from the K–L analyses (vide supra). On C8SH modified Au electrode, the magnitude of PROS is 10 ± 1% which further decreased to 4 ± 1% on further slowing down the electron transfer by employing a C16SH SAM modified surface (Figure 5, and Figure S5, Supporting Information). The diminished amount of 2e−/2H+ reduction product (i.e., H2O2) with a decrease in ET rate is unprecedented for synthetic heme-Cu systems. To better understand this, SERRS-RDE experiments under steady state conditions have been performed for these catalysts.
Figure 5.
Percentage of PROS formed by the catalysts 1 (red), 2 (yellow), and 3 (green) in air saturated pH 7 buffer under fast (EPG), slow (C8SH SAM on Au), and very slow (C16SH SAM on Au) electron fluxes measured by a RRDE experiment using Ag/AgCl reference and Pt wire counter electrodes. Rotation speed = 300 rpm, scan rate = 10 mV/s.
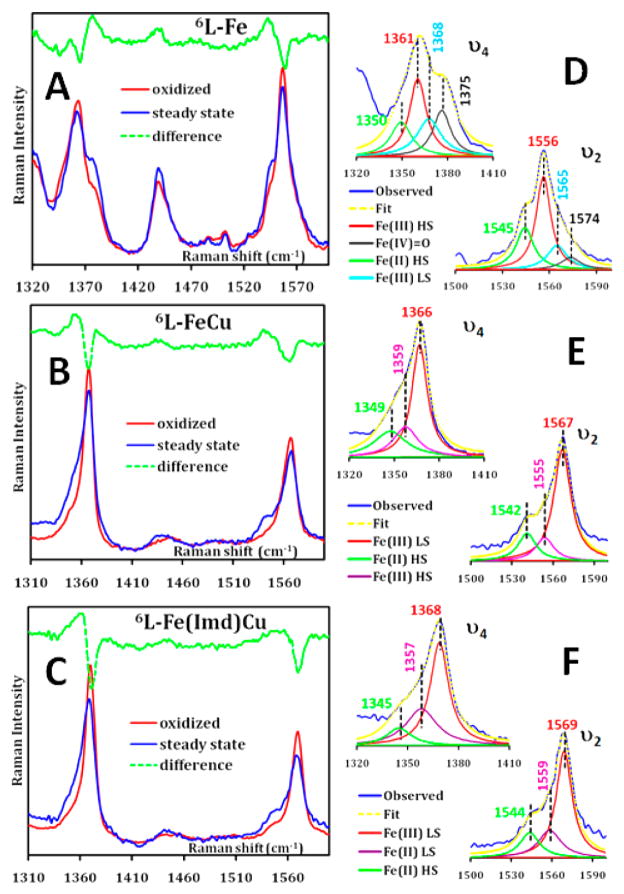
SERRS-RDE data, collected on C8SH SAM modified Ag disks, of the iron only catalyst 1 during steady state O2 reduction, i.e., catalytic turnover (the electrode is held at −0.5 V vs Ag/AgCl) (Figure 6A, blue) shows the presence of four species in the high frequency region. The major species has ν4 and ν2 at 1362 and 1556 cm−1, respectively, corresponding to HS FeIII species (Figure 6D, red). There are two additional minor components having the ν4 and ν2 bands at 1350 and 1545 cm−1 (Figure 6D, green) and at 1375 and 1572 cm−1 (Figure 6D, black), respectively. The first minor species correspond to a HS FeII species and the other may correspond to a FeIV=O species as observed for other Fe–porphyrin complexes.37,42,54 Note that a very weak FeIII LS component in the ν2 band could also be noticed at 1565 cm−1. Under similar steady state turnover, the FeCu catalyst 2 also gives rise to a mixture of species as observed in this high frequency region (Figure 6B). Lorentzian fits of the ν4 and ν2 bands show the presence of three components (Figure 6E). The major species is a LS FeIII complex with ν4 and ν2 bands at 1366 and 1567 cm−1.55,56 The other components correspond to a HS FeII species having ν4 and ν2 bands at 1349 and 1542 cm−1, respectively, and a HS FeIII species (very low population in steady state) with the ν4 and ν2 bands at 1359 and 1555 cm−1, respectively (Figure 6E). SERRS-RDE data for 3 during steady state O2 reduction shows the presence of LS FeIII, LS FeII, and HS FeII species (Figure 6C, blue). The major component is the LS FeIII species with the ν4 and ν2 bands at 1368 and 1569 cm−1 (Figure 6E). Fits to the ν4 and ν2 region clearly show the presence of bands at 1345 and 1544 cm−1 corresponding to a HS FeII species, whereas the bands at 1357 and 1559 cm−1 correspond to a LS FeII species (Figure 6E).42 Note that a larger intensity of the LS FeII species is observed relative to the HS component that can be due to the higher resonance enhancement and/or a greater population, the latter being more likely.
Figure 6.
SERRS-RDE data for complexes 1 (A), 2 (B) and 3 (C) in the high frequency region at oxidized (red) and steady state conditions (blue) in air saturated pH 7 buffer under aerobic conditions at a constant rotation rate of 200 rpm. The difference spectra are shown in green. The ν4 and ν2 bands of the spectra obtained during steady state O2 reduction of complex 1, 2, and 3 along with their Lorentzian fits showing different components are given in (D), (E), and (F), respectively.
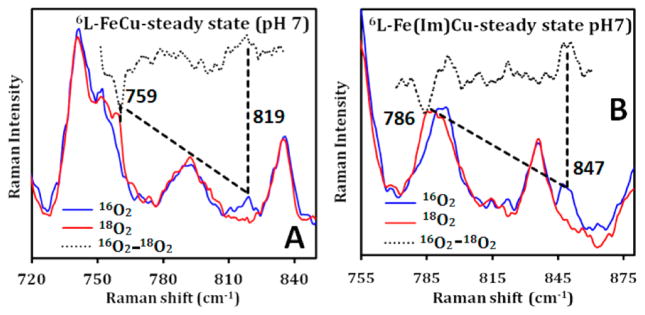
SERRS-RDE data for complex 2 in the low frequency region shows the formation of an iron-peroxo intermediate (either bridged or terminal), which gives rise to an O–O stretching vibration (νO–O) at 819 cm−1 in 16O2, shifting to 759 cm−1 in 18O2 (Figure 7A). Unlike for simple Fe-porphyrin systems, a FeIV=O vibration was not observed. High-valent FeIV=O systems produced during O2 reduction have been shown to be able to oxidize K4[FeII(CN)6] present in solution and the [FeIII(CN)6]−3 produced can be detected in the Pt ring in a RRDE setup as for Fe-porphyrin complexes.52 Here, for 2, the lack of significant current at the Pt ring (held at a negative potential where [FeIII(CN)6]−3 can be reduced to [FeII(CN)6]−4) suggests that no FeIV=O is accumulated during O2 reduction consistent with the lack of Raman signal (Figure S6A, Supporting Information). When the SERRS-RDE experiment is performed in air saturated pD 7 buffer, the O–O peak appears at 819 cm−1 as observed in case of air saturated pH 7 buffer, which further suggests that the Fe-peroxo species formed, is a species with a peroxo bridge (i.e., Fe–O22−–Cu), and not an iron hydroperoxide (FeIII–OOH) complex (Figure S7, Supporting Information). Unfortunately, the low frequency region of the spectrum does not reveal corresponding Fe–O/Cu–O vibrations for the bridged-peroxo complex 2 (Figure S8A, Supporting Information).57 However, the νO–O absolute value and its observed 60 cm−1 16/18O shift (vide supra) are consistent with the O–O bond stretching frequency of Feperoxo species, excluding the possible formation of any high-valent FeIV=O species where a 25–30 cm−1 downshift is generally observed on 18O substitution (FeIV=O is also excluded based on the ferrocyanide experiment discussed above).58
Figure 7.
SERRS-RDE data in the low frequency region under steady state conditions in the presence of air and 18O2 saturated pH 7 buffer for complex 2 (A) and complex 3 (B) on C8SH modified Ag surfaces. The difference spectra are shown in dotted line (black).
For complex 3 with imidazole “base”, a prominent peak at 847 cm−1 appears, under steady state conditions in an air saturated pH 7 buffer, in the SERRS-RDE data which is shown to shift to 786 cm−1 (61 cm−1 16/18O2 downshift) in 18O2 (Figure 7B). Note that the magnitudes of the 16/18O isotope shifts (>60 cm−1) for both the complexes are larger than the calculated values for the harmonic O–O diatomic oscillators which is likely due to the mixing or mode-coupling of the fundamental O–O stretching mode with porphyrin vibrations. A weak 16/18O2 sensitive νFe–O band could be identified for complex 3 at 545 cm−1, which shifts to 524 cm−1 (21 cm−1 downshift) upon 18O-substitution (Figure S8B, Supporting Information). Although another weak signal at 532 cm−1 is observed for the same complex 3 in 16O2, the shift in 18O2 is not detectable. Here too, no high-valent FeIV=O intermediates could be detected when carrying out the same K4[FeII(CN)6] assay (Figure S6B, Supporting Information). This relatively high energy of νO–O in complex 3 compared to complex 2 is likely due to the formation of an end-on (μ-1,2) bridged peroxo complex. This is because of the presence of a stronger σ-donor imidazole ligand in complex 3 which facilitates the formation of an end-on bridging peroxo moiety and not a side-on coordination, resulting in lower νO–O stretching vibrations, as also known from previous studies on similar CcO model complexes in organic media.32,59,60
DISCUSSION
A combination of electrochemical and spectroscopic techniques has been used to investigate the oxygen reactivity of CcO model complexes (i.e., a heme-Cu system with and without imidazole) physiabsorbed on electrode surfaces under physiological conditions. The parent heme-Cu 6L-FeCu complex (2) selectively reduces O2 by a 4e−/4H+ process under fast ET conditions (only 6% PROS) with a high overall kcat for the ORR (4.49 × 10⁶ M−1 s−1), that being 1 order of magnitude higher than any other synthetic heme-Cu system.6,28 The SERRS-RDE data obtained on this complex under steady state conditions reveal the presence of HS FeII, HS FeIII and LS FeIII species. The fact that the FeII center is in its HS state in the reduced complex 2 and was established to be in its LS FeII state in previously reported synthetic mimics of CcO likely explains the faster ORR kinetics observed in the former relative to the latter.49 The additional vibration observed at 819 cm−1 which shifts to 759 cm−1 in 18O2 but does not shift on deuteration indicates that (a) a bridging peroxide is involved in the mechanism and (b) the O–O bond cleavage of this peroxy species is likely to be a slow step in the mass transfer limited region (vide infra).61 By contrast, the imidazole bound analogue of the parent heme-Cu 6L-FeCu complex, 6L-Fe(Im)Cu (imidazole bound trans to the bridging hydroxo ligand in the resting oxidized state), produces significant amounts of PROS (25%) during O2 reduction on an EPG electrode. SERRS-RDE data on this complex shows the presence of a 16/18O sensitive O–O vibration at 847 cm−1 (786 cm−1) and Fe–O vibration at 545 cm−1 (524 cm−1). Thus, a bridging peroxide ligand is an intermediate in the O2 reduction cycle even with an imidazole axial ligand and the heterolytic O–O bond cleavage is a slow step as well. Note that the presence of end-on peroxide species has been demonstrated in X-ray structures of CcO20,21,62 and their involvement in O2 reduction has been proposed for “mixed valence” CcO (i.e., where just the FeCu active site is reduced).13
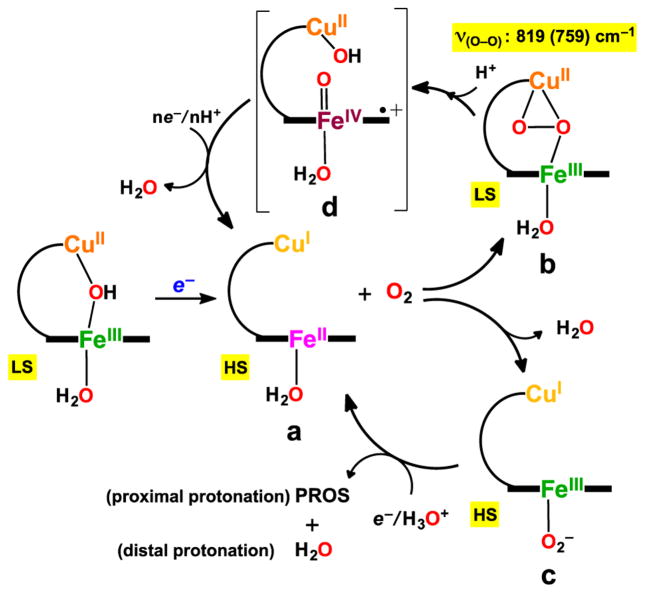
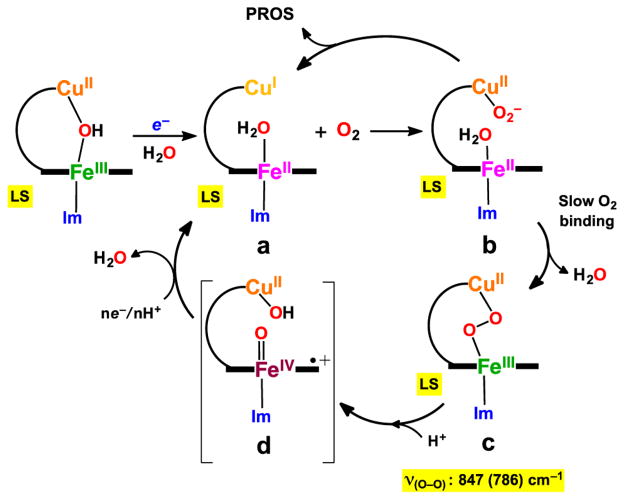
In the SERRS-RDE experiments, species for which the rate of formation is faster than its rate of decay will accumulate and can be detected. Analyses of marker bands indicate the accumulation of FeII HS, FeII LS and FeIII LS in the case of Fe–Cu complexes. SERRS-RDE is performed at a potential where the catalytic current is mass transfer limited, i.e., no change in the catalytic current occurs with an increase in the driving force and the current only depends on the supply of species from the aqueous phase. This implies that no species whose decay involves an electron transfer can be rate determining and accumulate during steady state at these potentials. This automatically excludes the possibility that an electron transfer step is the rate-determining step. The two components of the reaction (reduction of O2 to H2O) that diffuse from bulk solution to electrode surface are oxygen and protons. Consistently, it is observed that FeII species (both HS and LS), which decay by binding oxygen (derived from bulk solvent), accumulate in the SERRS-RDE data. This is because of the formation of FeII (a, Schemes 1 and 2) through reduction of FeIII (via ET from electrode) is faster at these potentials than O2 binding. While O2 binding in the distal pocket (i.e., containing the Cu) will lead to O–O cleavage and subsequent O2 reduction, O2 binding to the proximal site, replacing the axial water ligand, will likely result in the production of PROS (c, Scheme 1). Similarly, we believe the FeIII LS species observed is a bridging peroxide (b, Scheme 1 and c, Scheme 2) (the metal ligand region in the SERRS-RDE spectra also reflects the same) because its decay involves proton (from bulk) with subsequent O–O bond cleavage leading to the formation of high-valent compound I (d, Schemes 1 and 2). However, compound I cannot be isolated as an intermediate during steady state, perhaps because of the immediate reduction of this high valent species by electron transfer from the electrode which is held at −0.5 V vs Ag/AgCl during SERRS-RDE experiments i.e. its decay is faster than its formation precluding its accumulation during steady state. Thus, the data indicate that both O2 binding and heterolytic cleavage of O–O bond are slow. However, from the greater intensity LS FeIII component in the ν4 and ν2 region relative FeII component, we propose that decay of the bridging peroxide species via protonation is slower than decay of FeII resulting from O2 binding.
Scheme 1.
Plausible Mechanistic Pathways during Steady State O2-Reduction by Complex 2
Scheme 2.
Plausible Mechanistic Pathways during Steady State O2-Reduction by Complex 3
The relative values of the νO–O suggest that the peroxo intermediate formed under steady state conditions in the 6L-FeCu complex has a side-on coordination, whereas the one formed in the 6L-Fe(Im)Cu analogue is bound in an end-on geometry. These assignments are in good agreement with the previously reported homogeneous data where similar shifts are observed upon switching a side-on to end-on intermediate.31,32,59 Considering the fact that the peroxo adduct of the 6L-FeCu complex is 6C LS (based on the ν4 and ν2 values), the binding motif of the bridging side-on peroxo to the Fe and Cu centers is likely μ–η1:η2 (η2 at Cu and η1 at Fe; b, Scheme 1) in an aqueous environment and not μ–η2:η1 as observed in organic solvents.31,32,59 The νO–O observed in the SERRS-RDE data, here, in an aqueous environment, is ~30 cm−1 higher than the values observed in structurally characterized high-spin Fe– (μ–η2:η1-peroxo)–Cu model compounds in organic solution.31,33 These differences may arise from differences in polarity of the medium or hydrogen bonding from water, or due to the change from high-spin to low-spin, or of course due to proposed change to being side-on to Cu (Scheme 1).
Complex 3 shows selective 4e−/4H+ O2 reduction under slow ET flux (<4% PROS when physiabsorbed on C16SH modified SAM on Au) whereas under fast ET, where complex 2 and all known heme-Cu complexes show 4e−/4H+ O2 reduction, this complex with an axial imidazole ligand shows significant 2e−/2H+ reduction of O2. SERRS-RDE data on this complex reveals accumulation of LS FeII species; presumably with a water molecule as the sixth axial ligand (a, Scheme 2). Ferrous porphyrins in the LS ground state are known to have sluggish rates of O2 binding.40,47 It is likely that under fast ET on EPG (i.e., when kET > kO2 for the LS FeII center), the distal Cu reduces O2 to produce PROS (b, Scheme 2). As the ET rate is slowed and becomes comparable to or even slower than the O2 binding rate to LS FeII (i.e., kET ≈ kO2 or kET < kO2), the O2 (slowly) binds to iron and the 4e−/4H+ ORR proceeds via a bridging peroxo intermediate (c, Scheme 2). The ferrous center in its LS state may also reduce O2 via outer sphere O2 reduction by 1e− when the ET rate is fast.51,63,64 Thus, the product, i.e., water, can bind the heme iron in its reduced state and act as a competitive inhibitor of the substrate, O2.47,65,66 For facile O2 reduction, it is important that the water formed is released from the active site; this effect may also be operative in the native CcO enzyme active site through proper water channelling.3,65
CONCLUSION
In summary, bridging peroxo intermediates are shown to be involved during electrocatalytic O2-reduction in aqueous media by heme-Cu complexes which are otherwise known to form such Fe–O22−–Cu species in organic solvents. The kinetics of O2-reduction compare fairly well with those of the heme–Cu complexes that are proposed not to involve a bridging peroxide type intermediates. Thus, pathways involving bridging peroxide intermediates can lead to facile and selective 4e−/4H+ O2-reduction.
EXPERIMENTAL DETAILS
Materials
All reagents were of the highest grade commercially available and were used without further purification. Octanethiol (C8SH), hexadecanethiol (C16SH), potassium hexafluorophosphate (KPF6), chloroform (CHCl3) and all buffers were purchased from Sigma-Aldrich. Disodium hydrogen phosphate dihydrate (Na2HPO4· 2H2O), potassium chloride (KCl), imidazole (Im), conc. sulfuric acid (H2SO4), and deuterium oxide (D2O) were purchased from Merck. Au wafers were obtained from Platypus Technologies (1000 Å of Au on 50 Å of Ti adhesion layer on top of a Si(III) surface). Edge Plane Graphite (EPG), Au disks for the RRDE experiments and Ag disks for SERRS experiments were purchased from Pine Instruments.
Instrumentation
UV–vis absorption data were taken in an Agilent technologies spectrophotometer model 8453 fitted with a diode-array detector. All electrochemical experiments were performed using a CH Instruments (model CHI710D Electrochemical Analyzer). A Biopotentiostat, reference electrodes and a Teflon plate material evaluating cell (ALS Japan) were purchased from CH Instruments. The rotating ring disk electrochemical (RRDE) setup from Pine Research Instrumentation (E6 series ChangeDisk tips with AFE6M rotor) was used to obtain the RRDE data. Surface Enhanced Resonance Raman data were collected with a Trivista 555 spectrograph (Princeton Instruments) using 413.1 nm excitation from a Kr+ laser (Coherent, Sabre Innova SBRC-DBW-K). Mass spectra were recorded by a QTOF Micro YA263 instrument.
Synthesis
The heme-(μ-hydroxo)-copper complex 6L-FeCu (2) and its copper free heme analogue 6L-Fe (1) were synthesized as reported in the literature.67,68 The imidazole adduct of 6L-FeCu, 6L-Fe( Im)Cu (3), was prepared by adding imidazole dissolved in CHCl3 to a 1 mM solution of 2 in CHCl3. The formation of the complex was monitored by UV–vis (Figure S1B, Supporting Information) and TOF MS ES+ (Figure S1C) and was also confirmed by rR spectroscopy (Figure S1A). Note that since imidazole has been added to the complex 2 (as synthesized) in a noncoordinating organic medium, it binds to the open face of the heme as a sixth ligand (i.e., trans to the bridging hydroxo moiety, see Figure 2).
Construction of Electrodes
Formation of Self-Assembled Monolayer (SAM)
Au wafers and disks were cleaned electrochemically by sweeping several times between 1.5 V to −0.3 V (vs. Ag/AgCl) in 0.5 M H2SO4. Ag disks were cleaned in alumina (size: 1, 0.3 and 0.05 μm) and then roughened in 0.1 M KCl solution as described in literature. SAM solutions were prepared in ethanol using 0.4 mM concentration of the corresponding alkanethiols. Freshly cleaned Au wafers, disks and freshly roughened Ag disks were initially rinsed with tripled distilled water, ethanol, purged with N2 gas and then immersed in the depositing solution of C8SH or C16SH in ethanol for 4 and 20 h, respectively.
Physiabsorption of Catalysts on to EPG and SAM
EPG disks were cleaned on silicon carbide (SiC) grit paper followed by sonication in ethanol and dried under N2 gas. The disks were then mounted on a platinum ring disk assembly (Pine Instruments). The solutions of the catalysts were prepared in chloroform followed by drop-casting on the EPG electrode for 30 min for complete loading. The surfaces were then thoroughly rinsed with chloroform followed by ethanol and triply distilled deionized water and dried before CV, RDE and RRDE experiments. In case of modified Au and roughened Ag disks, the disks were taken out of the depositing solutions, rinsed with ethanol and chloroform and then mounted on the RRDE setup. The catalysts were loaded as described for EPG. After each respective loading, the surfaces were thoroughly rinsed with chloroform, ethanol and triply distilled water before carrying out electrochemical or SERRS/SERRS-RDE experiments.
Electrochemical Experiments
All electrochemical experiments were carried out in pH 7 buffer (unless otherwise mentioned) containing 100 mM Na2HPO4.2H2O and 100 mM KPF6 (supporting electrolyte) using Pt wire as the counter electrode and Ag/AgCl as the reference electrode.
Cyclic Voltammetry
The CVs of the catalysts were obtained by physiabsorbing the complexes on EPG electrodes under anaerobic conditions in deoxygenated buffer at a scan rate of 50 mV/s.
Coverage Calculation
The coverage for a particular redox couple is estimated by taking the average of the integrated area under the corresponding oxidation and reduction currents of the respective species obtained from their reversible voltammogram. The experiments were repeated three times and an average value with standard deviation has been presented.
Ring Disk Electrochemistry (RDE)
The RDE measurements were performed on a CHI 700D bipotentiostat with a Pine Instruments Modulated speed rotor fitted with an E6 series Changedisk tip. The complexes were physiabsorbed on the disks as described earlier. The Koutecky–Levich (K–L) experiments were performed for all the complexes at the following rotations: 100, 200, 300, 400, 500, and 600 rpm. The second order rate of catalysis (kcat) can be evaluated from the intercept of the K–L plot (see Figure 4) using the equation iK = nFA[O2]kcatΓcatalyst where iK is expressed as the inverse of the intercept obtained upon plotting I−1 at different rotation rates with respect to ω−1/2 and Γcatalyst is the surface coverage of the catalyst obtained from the integrated current of the CV taken under anaerobic conditions.
Rotating Ring Disk Electrochemistry (RRDE): Partially Reduced Oxygen Species (PROS) Detection and Calculation
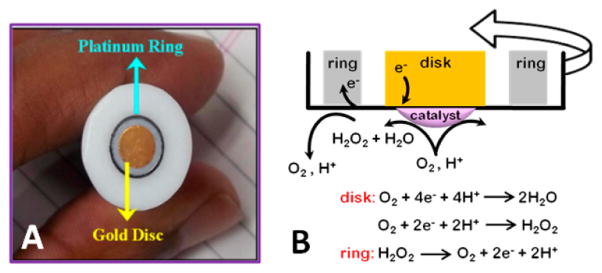
The platinum ring and the Au disk were both polished using alumina powder (grit sizes: 1, 0.5, and 0.03 μm) and electrochemically cleaned and inserted into the RRDE tip which was then mounted on the rotor and immersed into a cylindrical glass cell equipped with Ag/AgCl reference and Pt counter electrodes (Figure 8A). In this technique, the potential of the disk is swept from positive to negative and when O2 is reduced, any H2O2, i.e., a 2e− reduction product of O2, produced in the working disk electrode is radially diffused to the encircling Pt ring, which is held at a constant potential and oxidizes the H2O2 back to O2 (Figure 8B). The ratio of the 2e−/2H+ current (corrected for collection efficiency) at the ring and the catalytic current at the disk is expressed as PROS and it provides an in situ measure of the 2e−/2H+ reduction side reaction. The collection efficiency (CE) of the RRDE setup was measured in a 2 mM K3[FeIII(CN)6] and 0.1 M KNO3 solution at a 10 mV/s scan rate and 300 rpm rotation speed. A 20 ± 2% CE was generally recorded during these experiments. The potential at which the ring was held during the collection efficiency experiments at pH 7 for detecting H2O2 was obtained from literature.69
Figure 8.
(A) RRDE assembly showing the Au disk and Pt ring. (B) Schematic representation of PROS detection mechanism by a RRDE setup.
Surface Enhanced Resonance Raman Spectroscopy Coupled with RDE (SERRS-RDE)
Ag disks were cleaned using Alumina powder (grit sizes 1, 0.3, and 0.05 μm) and then roughened in a 0.1 M KCl solution using reported procedures and then immersed in SAM solutions. The catalysts were loaded as mentioned earlier. The roughened modified Ag disks were then inserted into the RRDE setup for the collection of SERRS-RDE data. The detailed SERRS-RDE set up along with the technique has been recently published.37 The disks were held at 0 V vs Ag/AgCl to obtain the oxidized spectra and at −0.5 V vs Ag/AgCl to obtain the reduced spectra and the spectra under steady state conditions under anaerobic and aerobic conditions, respectively. Experiments were done using an excitation wavelength 413.1 nm and the power used at the electrode surface was 8–10 mW. All the SERRS spectra have been normalized using the characteristic buffer peaks which appear at 742 cm−1 (coming from electrolyte KPF6) and 951 cm−1 (symmetric νP–O), respectively.
Supplementary Material
Acknowledgments
The authors sincerely thank SB/S1/IC-25/2013 (A.D.), Department of Science and Technology, Govt. of India for funding this research. S.C. and K.S. acknowledge CSIR, India, for Senior Research Fellowships. S.H. and K.D.K. acknowledge the National Institutes of Health (USA) for financial support.
Footnotes
Notes
The authors declare no competing financial interest.
The Supporting Information is available free of charge on the ACS Publications website at DOI: 10.1021/jacs.5b06513.
UV–vis, Resonance Raman, SERRS, RRDE and other electrochemical data (PDF)
Contributor Information
Kenneth D. Karlin, Email: karlin@jhu.edu.
Abhishek Dey, Email: icad@iacs.res.in.
References
- 1.Yoshikawa S, Shimada A. Chem Rev. 2015;115:1936. doi: 10.1021/cr500266a. [DOI] [PubMed] [Google Scholar]
- 2.Kim E, Chufán EE, Kamaraj K, Karlin KD. Chem Rev. 2004;104:1077. doi: 10.1021/cr0206162. [DOI] [PubMed] [Google Scholar]
- 3.Ferguson-Miller S, Babcock GT. Chem Rev. 1996;96:2889. doi: 10.1021/cr950051s. [DOI] [PubMed] [Google Scholar]
- 4.Babcock GT, Wikstrom M. Nature. 1992;356:301. doi: 10.1038/356301a0. [DOI] [PubMed] [Google Scholar]
- 5.Collman JP, Ghosh S, Dey A, Decreau RA, Yang Y. J Am Chem Soc. 2009;131:5034. doi: 10.1021/ja9001579. [DOI] [PMC free article] [PubMed] [Google Scholar]
- 6.Collman JP, Decreau RA. Chem Commun. 2008:5065. doi: 10.1039/b808070b. [DOI] [PubMed] [Google Scholar]
- 7.Chufan EE, Puiu SC, Karlin KD. Acc Chem Res. 2007;40:563. doi: 10.1021/ar700031t. [DOI] [PubMed] [Google Scholar]
- 8.Rousseau DL. Nature. 1999;400:412. doi: 10.1038/22664. [DOI] [PubMed] [Google Scholar]
- 9.Anson FC, Shi C, Steiger B. Acc Chem Res. 1997;30:437. [Google Scholar]
- 10.Blomberg MRA, Siegbahn PEM. Biochim Biophys Acta, Bioenerg. 2014;1837:1165. [Google Scholar]
- 11.Svensson-Ek M, Abramson J, Larsson G, Tõrnroth S, Brzezinski P, Iwata S. J Mol Biol. 2002;321:329. doi: 10.1016/s0022-2836(02)00619-8. [DOI] [PubMed] [Google Scholar]
- 12.Tsukihara T, Aoyama H, Yamashita E, Tomizaki T, Yamaguchi H, Shinzawa-Itoh K, Nakashima R, Yaono R, Yoshikawa S. Science. 1996;272:1136. doi: 10.1126/science.272.5265.1136. [DOI] [PubMed] [Google Scholar]
- 13.Proshlyakov DA, Pressler MA, Babcock GT. Proc Natl Acad Sci U S A. 1998;95:8020. doi: 10.1073/pnas.95.14.8020. [DOI] [PMC free article] [PubMed] [Google Scholar]
- 14.Kaila VRI, Verkhovsky MI, Wikström Mr. Chem Rev. 2010;110:7062. doi: 10.1021/cr1002003. [DOI] [PubMed] [Google Scholar]
- 15.Proshlyakov DA, Pressler MA, DeMaso C, Leykam JF, DeWitt DL, Babcock GT. Science. 2000;290:1588. doi: 10.1126/science.290.5496.1588. [DOI] [PubMed] [Google Scholar]
- 16.Karlin KD, Kim E. Chem Lett. 2004;33:1226. [Google Scholar]
- 17.Han S, Takahashi S, Rousseau DL. J Biol Chem. 2000;275:1910. doi: 10.1074/jbc.275.3.1910. [DOI] [PubMed] [Google Scholar]
- 18.Liu JG, Naruta Y, Tani F. Chem Eur J. 2007;13:6365. doi: 10.1002/chem.200601884. [DOI] [PubMed] [Google Scholar]
- 19.Halime Z, Kotani H, Li Y, Fukuzumi S, Karlin KD. Proc Natl Acad Sci U S A. 2011;108:13990. doi: 10.1073/pnas.1104698108. [DOI] [PMC free article] [PubMed] [Google Scholar]
- 20.Aoyama H, Muramoto K, Shinzawa-Itoh K, Hirata K, Yamashita E, Tsukihara T, Ogura T, Yoshikawa S. Proc Natl Acad Sci U S A. 2009;106:2165. doi: 10.1073/pnas.0806391106. [DOI] [PMC free article] [PubMed] [Google Scholar]
- 21.Tiefenbrunn T, Liu W, Chen Y, Katritch V, Stout CD, Fee JA, Cherezov V. PLoS One. 2011;6:e22348. doi: 10.1371/journal.pone.0022348. [DOI] [PMC free article] [PubMed] [Google Scholar]
- 22.Koepke J, Olkhova E, Angerer H, Mãller H, Peng G, Michel H. Biochim Biophys Acta, Bioenerg. 2009;1787:635. doi: 10.1016/j.bbabio.2009.04.003. [DOI] [PubMed] [Google Scholar]
- 23.Kaila VRI, Oksanen E, Goldman A, Bloch DA, Verkhovsky MI, Sundholm D, Wikstrom M. Biochim Biophys Acta, Bioenerg. 2011;1807:769. doi: 10.1016/j.bbabio.2010.12.016. [DOI] [PubMed] [Google Scholar]
- 24.Sakaguchi M, Shinzawa-Itoh K, Yoshikawa S, Ogura T. J Bioenerg Biomembr. 2010;42:241. doi: 10.1007/s10863-010-9282-y. [DOI] [PubMed] [Google Scholar]
- 25.Although the PDB ID: 3ABM does not report the side-on configuration, upon analyzing the crystal structure, the Cu–O distances between the Cu and both oxygen atoms of the bridging peroxides are found to be below 2.6 Å (2.51 and 2.59 Å, respectively). This is why we show Figure 1A depicted with a side-on geometry.
- 26.Collman JP, Devaraj NK, Decréau RA, Yang Y, Yan YL, Ebina W, Eberspacher TA, Chidsey CED. Science. 2007;315:1565. doi: 10.1126/science.1135844. [DOI] [PMC free article] [PubMed] [Google Scholar]
- 27.Collman JP, Boulatov R, Sunderland CJ, Fu L. Chem Rev. 2004;104:561. doi: 10.1021/cr0206059. [DOI] [PubMed] [Google Scholar]
- 28.Boulatov R, Collman JP, Shiryaeva IM, Sunderland CJ. J Am Chem Soc. 2002;124:11923. doi: 10.1021/ja026179q. [DOI] [PubMed] [Google Scholar]
- 29.Ricard D, Andrioletti B, Boitrel B, L’Her M. Chem Commun. 1999;1523 [Google Scholar]
- 30.Collman JP, Fu L, Herrmann PC, Zhang X. Science. 1997;275:949. doi: 10.1126/science.275.5302.949. [DOI] [PubMed] [Google Scholar]
- 31.Garcia-Bosch I, Adam SM, Schaefer AW, Sharma SK, Peterson RL, Solomon EI, Karlin KD. J Am Chem Soc. 2015;137:1032. doi: 10.1021/ja5115198. [DOI] [PMC free article] [PubMed] [Google Scholar]
- 32.Kieber-Emmons MT, Qayyum MF, Li Y, Halime Z, Hodgson KO, Hedman B, Karlin KD, Solomon EI. Angew Chem, Int Ed. 2012;51:168. doi: 10.1002/anie.201104080. [DOI] [PMC free article] [PubMed] [Google Scholar]
- 33.Ghiladi RA, Huang H-w, Moenne-Loccoz P, Stasser J, Blackburn NJ, Woods AS, Cotter RJ, Incarvito CD, Rheingold AL, Karlin KD. J Biol Inorg Chem. 2005;10:63. doi: 10.1007/s00775-004-0609-1. [DOI] [PubMed] [Google Scholar]
- 34.Liu J-G, Ohta T, Yamaguchi S, Ogura T, Sakamoto S, Maeda Y, Naruta Y. Angew Chem, Int Ed. 2009;48:9262. doi: 10.1002/anie.200904572. [DOI] [PubMed] [Google Scholar]
- 35.Ohta T, Liu J-G, Naruta Y. Coord Chem Rev. 2013;257:407. [Google Scholar]
- 36.Collman JP, Rapta M, Bröring M, Raptova L, Schwenninger R, Boitrel B, Fu L, L’Her M. J Am Chem Soc. 1999;121:1387. [Google Scholar]
- 37.Sengupta K, Chatterjee S, Samanta S, Dey A. Proc Natl Acad Sci U S A. 2013;110:8431. doi: 10.1073/pnas.1300808110. [DOI] [PMC free article] [PubMed] [Google Scholar]
- 38.Chatterjee S, Sengupta K, Samanta S, Das PK, Dey A. Inorg Chem. 2015;54:2383. doi: 10.1021/ic5029959. [DOI] [PubMed] [Google Scholar]
- 39.Samanta S, Sengupta K, Mittra K, Bandyopadhyay S, Dey A. Chem Commun. 2012;48:7631. doi: 10.1039/c2cc32832a. [DOI] [PubMed] [Google Scholar]
- 40.Chatterjee S, Sengupta K, Samanta S, Das PK, Dey A. Inorg Chem. 2013;52:9897. doi: 10.1021/ic401022z. [DOI] [PubMed] [Google Scholar]
- 41.The cyclic voltammograms for complexes investigated are broad which may reflect heterogeneous constructs suggesting the presence of multiple species on the electrode as observed from the mixture of marker bands for the adsorbed species in the oxidized and reduced SERRS spectra.
- 42.Burke JM, Kincaid JR, Peters S, Gagne RR, Collman JP, Spiro TG. J Am Chem Soc. 1978;100:6083. [Google Scholar]
- 43.Abe M, Kitagawa T, Kyogoku Y. Chem Lett. 1976;5:249. [Google Scholar]
- 44.Weidinger IM. Biochim Biophys Acta, Bioenerg. 2015;1847:119. doi: 10.1016/j.bbabio.2014.09.002. [DOI] [PubMed] [Google Scholar]
- 45.Upon reduction, new peak in the ν3 region for complex 1 was not observed.
- 46.A Lorentzian fit of the spectrum for reduced complex 2 shows the presence of minor LS FeII component as well having ν4, ν3, and ν2 bands at 1359, 1444, 1561 cm−1, respectively, which is likely due to the formation of a bis-aqua complex (Figure 3E).
- 47.Collman JP, Decreau RA, Dey A, Yang Y. Proc Natl Acad Sci U S A. 2009;106:4101. doi: 10.1073/pnas.0900893106. [DOI] [PMC free article] [PubMed] [Google Scholar]
- 48.Maillard P, Schaeffer C, Tetreau C, Lavalette D, Lhoste JM, Momenteau M. J Chem Soc, Perkin Trans 2. 1989;1437 [Google Scholar]
- 49.Saveant J-M. Elements of Molecular and Biomolecular Electrochemistry. Wiley-Interscience; Hoboken, NJ: 2006. [Google Scholar]
- 50.Bard AJ, Faulkner LR. Electrochemical Methods. J. Wiley; New York: 1980. [Google Scholar]
- 51.Momenteau M, Reed CA. Chem Rev. 1994;94:659. [Google Scholar]
- 52.Sengupta K, Chatterjee S, Samanta S, Bandyopadhyay S, Dey A. Inorg Chem. 2013;52:2000. doi: 10.1021/ic302369v. [DOI] [PubMed] [Google Scholar]
- 53.Chidsey CED. Science. 1991;251:919. doi: 10.1126/science.251.4996.919. [DOI] [PubMed] [Google Scholar]
- 54.Hashimoto S, Mizutani Y, Tatsuno Y, Kitagawa T. J Am Chem Soc. 1991;113:6542. [Google Scholar]
- 55.Rousseau DL, Han S, Song S, Ching Y-C. J Raman Spectrosc. 1992;23:551. [Google Scholar]
- 56.Das TK, Pecoraro C, Tomson FL, Gennis RB, Rousseau DL. Biochemistry. 1998;37:14471. doi: 10.1021/bi981500w. [DOI] [PubMed] [Google Scholar]
- 57.In the low frequency region, no distinct Fe–O/Cu–O vibrations could be observed, which is likely because of strong background from heme in this region.
- 58.However, the use of scrambled isotope would provide a definite assessment for the assignment of peroxo or ferryl complex.
- 59.Kieber-Emmons MT, Li Y, Halime Z, Karlin KD, Solomon EI. Inorg Chem. 2011;50:11777. doi: 10.1021/ic2018727. [DOI] [PMC free article] [PubMed] [Google Scholar]
- 60.Halime Z, Kieber-Emmons MT, Qayyum MF, Mondal B, Gandhi T, Puiu SC, Chufan EE, Sarjeant AAN, Hodgson KO, Hedman B, Solomon EI, Karlin KD. Inorg Chem. 2010;49:3629. doi: 10.1021/ic9020993. [DOI] [PMC free article] [PubMed] [Google Scholar]
- 61.Rate-determining step is defined as the step(s) having higher kinetic barriers than other steps involved in a particular catalytic cycle.
- 62.Du W-GH, Noodleman L. Inorg Chem. 2013;52:14072. doi: 10.1021/ic401858s. [DOI] [PMC free article] [PubMed] [Google Scholar]
- 63.Wallace WJ, Houtchens RA, Maxwell JC, Caughey WS. J Biol Chem. 1982;257:4966. [PubMed] [Google Scholar]
- 64.Stanbury DM, Haas O, Taube H. Inorg Chem. 1980;19:518. [Google Scholar]
- 65.Shimokata K, Katayama Y, Murayama H, Suematsu M, Tsukihara T, Muramoto K, Aoyama H, Yoshikawa S, Shimada H. Proc Natl Acad Sci U S A. 2007;104:4200. doi: 10.1073/pnas.0611627104. [DOI] [PMC free article] [PubMed] [Google Scholar]
- 66.Chang CJ, Chang MCY, Damrauer NH, Nocera DG. Biochim Biophys Acta, Bioenerg. 2004;1655:13. doi: 10.1016/j.bbabio.2003.08.010. [DOI] [PubMed] [Google Scholar]
- 67.Ghiladi RA, Ju TD, Lee D-H, Mönne-Loccoz P, Kaderli S, Neuhold Y-M, Zuberbühler AD, Woods AS, Cotter RJ, Karlin KD. J Am Chem Soc. 1999;121:9885. [Google Scholar]
- 68.Obias HV, van Strijdonck GPF, Lee D-H, Ralle M, Blackburn NJ, Karlin KD. J Am Chem Soc. 1998;120:9696. [Google Scholar]
- 69.Zhang Y, Wilson GS. J Electroanal Chem. 1993;345:253. [Google Scholar]
Associated Data
This section collects any data citations, data availability statements, or supplementary materials included in this article.


