

Abstract
Next-generation RNA-sequencing (RNA-seq) has revolutionized transcriptome profiling, gene expression analysis, and RNA-based diagnostics. Here, we developed a new RNA-seq method that exploits thermostable group II intron reverse transcriptases (TGIRTs) and used it to profile human plasma RNAs. TGIRTs have higher thermostability, processivity, and fidelity than conventional reverse transcriptases, plus a novel template-switching activity that can efficiently attach RNA-seq adapters to target RNA sequences without RNA ligation. The new TGIRT-seq method enabled construction of RNA-seq libraries from <1 ng of plasma RNA in <5 h. TGIRT-seq of RNA in 1-mL plasma samples from a healthy individual revealed RNA fragments mapping to a diverse population of protein-coding gene and long ncRNAs, which are enriched in intron and antisense sequences, as well as nearly all known classes of small ncRNAs, some of which have never before been seen in plasma. Surprisingly, many of the small ncRNA species were present as full-length transcripts, suggesting that they are protected from plasma RNases in ribonucleoprotein (RNP) complexes and/or exosomes. This TGIRT-seq method is readily adaptable for profiling of whole-cell, exosomal, and miRNAs, and for related procedures, such as HITS-CLIP and ribosome profiling.
Keywords: diagnostics, noncoding RNA, tRNA, next-generation sequencing, transcriptome profiling
INTRODUCTION
Next-generation RNA sequencing (RNA-seq) is a supremely powerful method for transcriptome profiling and gene expression analysis, with applications that include the identification of novel biomarkers and new diagnostic methods for disease (Wang et al. 2009; Wilhelm and Landry 2009; Ozsolak and Milos 2011; Chen et al. 2012). A recent exciting application of RNA-seq is the analysis of extracellular RNAs present in plasma and other bodily fluids (Mitchell et al. 2008; Burgos et al. 2013; Huang et al. 2013; Williams et al. 2013; Koh et al. 2014). Such extracellular RNAs are potential biomarkers for human diseases and may be involved in intercellular communication (Valadi et al. 2007; Zernecke et al. 2009; Fabbri et al. 2012; Grasedieck et al. 2013). In plasma, extracellular RNAs, also known as circulating RNAs, are present in vesicles, such as exosomes, microvesicles, and apoptotic bodies, and/or in ribonucleoprotein (RNP) complexes (e.g., miRNAs with Argonaute2 [Ago2] or high-density lipoproteins [HDLs]) (Zernecke et al. 2009; Arroyo et al. 2011; Vickers et al. 2011; Huang et al. 2013). Circulating RNAs found in human plasma include fragments of mRNAs and long noncoding RNAs (lncRNAs), possibly resulting from intracellular RNA turnover and secretion in exosomes, as well as miRNAs and other small noncoding RNAs (small ncRNAs) (Huang et al. 2013; Williams et al. 2013; Koh et al. 2014). Dysregulation of noncoding RNAs and malfunctions in their processing machinery are frequently hallmarks of human disease, including cancer and Alzheimer's disease (Croce 2009; Esteller 2011; Batista and Chang 2013). Further, the expression profiles of miRNAs and lncRNAs are often tissue- and cell-state specific, which may facilitate disease diagnoses (Lu et al. 2005; Rosenfeld et al. 2008; Cabili et al. 2011; Brunner et al. 2012). Multiple reports correlate the presence of specific mRNAs or miRNAs in plasma or serum with different types of cancer and other diseases, suggesting that the analysis of circulating RNAs may provide a noninvasive, cost-effective solution for detecting and monitoring cancer progression (Kopreski et al. 2001; Silva et al. 2007; Keller et al. 2011; Moussay et al. 2011; Koh et al. 2014). Thus far, however, knowledge of different RNA types that circulate in human plasma and their relative abundance remains limited.
All RNA-seq methods rely upon an initial cDNA synthesis step in which a reverse transcriptase (RT) converts RNA sequences into DNA, which can then be sequenced by powerful high-throughput DNA sequencing technologies. Current RNA-seq methods can be divided into two general categories. In one category, used for the analysis of mRNAs and lncRNAs, the initial reverse transcription step typically enriches for cDNAs of polyadenylated (poly(A)+) RNAs, either by priming with oligo(dT) or by priming with random oligomers after depletion of the highly abundant rRNAs (Levin et al. 2010; Ozsolak and Milos 2011). The resulting cDNAs are then converted into suitably sized double-stranded DNAs and ligated to platform-specific sequencing adapters (Ozsolak and Milos 2011). The most widely used of these methods uses RNA fragmentation, random hexamer priming, and addition of dUTP during second-strand synthesis; after adapter ligation, the uridine-containing second strand is either excluded during PCR with a high-fidelity DNA polymerase or degraded enzymatically to achieve strand specificity (Levin et al. 2010; Head et al. 2014). A second category of RNA-seq methods, used for miRNAs and other small ncRNAs, involves ligation of RNA-seq adapters containing primer-binding sites to the 3′ and/or 5′ ends of target RNAs with RNA ligase, followed by reverse transcription and PCR amplification for RNA-seq library construction (Levin et al. 2010; Raabe et al. 2014). Limitations of these methods include (1) the inability to comprehensively profile mRNAs and lncRNAs together with small ncRNAs in the same RNA-seq reaction; (2) the relatively low fidelity and processivity of retroviral RTs used for cDNA synthesis (Hu and Hughes 2012), making it difficult to analyze RNA sequence polymorphisms and highly structured or GC-rich RNAs; and (3) the inefficiency and/or biases introduced by RNA-seq adapter ligation using RNA ligases or by random hexamer priming (Linsen et al. 2009; Hansen et al. 2010; Levin et al. 2010; Lamm et al. 2011; Raabe et al. 2014).
We have been developing new RNA-seq methods using the RTs encoded by another type of retroelement, mobile group II introns (Mohr et al. 2013). Mobile group II introns are bacterial retrotransposons that proliferate within genomes by a mechanism called retrohoming, which requires reverse transcription of a highly structured group II intron RNA with high processivity and fidelity, properties that are potentially useful for applications that require cDNA synthesis, such as RNA-seq and qRT-PCR (Mohr et al. 2013; Enyeart et al. 2014; Lambowitz and Belfort 2015). Recently, we overcame a long-standing impediment by developing general methods for the high-level expression of thermostable group II intron RTs (TGIRTs) from bacterial thermophiles as fusion proteins with a noncleavable solubility tag attached via a rigid linker (Mohr et al. 2013). We found that TGIRT enzymes have higher thermostability, processivity, and fidelity than retroviral RTs, as well as a novel end-to-end template-switching activity, which can directly link RNA-seq or PCR adapters to target RNAs during cDNA synthesis without a separate RNA ligase step (Mohr et al. 2013). We showed that TGIRT-seq enables miRNA profiling with less bias than two commercial RNA-seq kits that rely on RNA ligation for RNA-seq adapter addition (Mohr et al. 2013). Recently, we used TGIRT-seq to profile RNAs associated with the human interferon-induced protein IFIT5 (Katibah et al. 2014); to identify tRNAs associated with a yeast ribosome quality control complex (Shen et al. 2015); and in combination with a demethylase, for quantitative profiling of cellular tRNAs (Zheng et al. 2015). These studies demonstrated that TGIRT-seq yields full-length reads of highly structured RNAs, including precursor and mature tRNAs, enables the quantification of charged and uncharged tRNAs, and facilitates the analysis of post-transcriptional modifications, including base modifications on the Watson–Crick face, many of which can be read through and result in distinctive patterns of misincorporated nucleotides.
In the initial TGIRT-seq method, the cDNAs with an RNA-seq adapter linked by TGIRT during reverse transcription were size-selected on a denaturing polyacrylamide gel and circularized with CircLigaseII ssDNA Ligase (Epicentre) prior to PCR amplification (Mohr et al. 2013; Katibah et al. 2014; Shen et al. 2015; Zheng et al. 2015). Although this procedure remains useful for RNA-seq of specific RNA size classes or homogenously sized RNA fragments in procedures like HITS-CLIP or ribosome profiling, disadvantages include (1) size limitations introduced by CircLigase, whose efficiency decreases for longer cDNAs (Epicentre product literature); (2) a gel-purification step, which is time consuming and results in loss of material; and (3) the use of hazardous chemicals, such as phenol and chloroform.
Here, we describe a new rapid and efficient method for using TGIRT template-switching in RNA-seq library construction from RNA pools without size selection and demonstrate its use for the profiling of circulating RNAs in human plasma. By eliminating gel-purification and phenol-extraction steps, the method enables the construction of RNA-seq libraries from small amounts of RNA in <5 h. The TGIRT-seq method developed here is readily adaptable for a variety of other applications, including sequencing of whole-cell and exosomal RNAs, profiling of miRNAs and other noncoding RNAs, and for streamlining the identification of protein- or ribosome-bound RNA fragments in procedures like HITS-CLIP, RIP-seq, and ribosome profiling. The validation of the method by RNA-seq of well-characterized human reference RNA samples will be presented elsewhere (RM Nottingham, DC Wu, Y Qin, J Yao, S Hunicke-Smith, AM Lambowitz, in prep.).
RESULTS AND DISCUSSION
A new method for construction of RNA-seq libraries via TGIRT template-switching
Figure 1A outlines our method for the construction of RNA-seq libraries via TGIRT template-switching. First, the TGIRT binds to an initial template–primer substrate comprised of an RNA oligonucleotide containing an RNA-seq adapter sequence annealed to a complementary DNA primer. For Illumina sequencing, the RNA oligonucleotide contains an Illumina Read 2 primer-binding site (R2 RNA), and the DNA primer contains the complementary sequence (R2R DNA) (Fig. 1A; Supplemental Fig. S1). After forming a complex with the initial template–primer substrate, the TGIRT initiates reverse transcription by switching directly from the 5′ end of the RNA-seq adapter to the 3′ end of a target RNA, yielding a continuous cDNA linking the two sequences. The RNA-seq adapter has a 3′-blocking group that impedes secondary template-switching to the 3′ end of that RNA.
FIGURE 1.

TGIRT-seq overview. (A) RNA-seq library construction via TGIRT template-switching. TGIRT template-switching reverse transcription reactions use an initial template–primer substrate comprised of an RNA oligonucleotide, which contains an Illumina Read 2 primer-binding site (R2 RNA) and has a 3′-blocking group, annealed to a complementary DNA primer (R2R DNA), which leaves an equimolar mixture of A, C, G, and T (denoted N) single-nucleotide 3′ overhangs. In the protocol used in the present work, the initial R2 RNA-R2R DNA substrate was mixed with target RNA and TGIRT enzyme in the reaction medium, with the enzyme added last, and then pre-incubated for 30 min at room temperature prior to initiating reverse transcription reactions by adding dNTPs. The reactions were incubated for 15 min at 60°C and terminated by alkaline treatment, as described in Materials and Methods. The cDNA products were then purified with a MinElute Reaction Cleanup Kit (QIAGEN) and ligated at their 3′ ends to a 5′-adenylated/3′-blocked DNA oligonucleotide complementary to an Illumina Read 1 primer (R1R) by using a Thermostable 5′ AppDNA/RNA Ligase (New England Biolabs). The ligated cDNAs were repurified and amplified by PCR for 12 cycles to add Illumina flow cell capture sites (P5 and P7) and barcode sequences for sequencing. (B) Mapping pipeline for RNA-seq data sets constructed with TGIRT enzymes. After trimming adapter sequences and reads with low quality base calls by using cutadapt, reads of ≥18 nt were mapped by TopHat and Bowtie2 (default settings) to a human genome reference sequence (Ensembl GRCh38 release 76) supplemented with additional rRNA gene contigs and other sequences (Pass 1) (see Materials and Methods). Unmapped reads from Pass 1 were then remapped to the same human genome reference sequence using Bowtie2 local alignment (default settings) to recover reads from RNAs with post-transcriptionally added nucleotides [e.g., 3′ CCA, poly(U)] or short introns (e.g., tRNA introns; Pass 2). Concordant read pairs that mapped uniquely with MAPQ ≥15 from Passes 1 and 2 were combined and mapped to genomic features. Reads that mapped to tRNA genes were filtered and combined with the reads that remained unmapped after the Bowtie2 local alignment, and remapped to human tRNA reference sequences (UCSC genome browser website) to achieve optimal recovery and mapping of tRNA reads. tRNA reads with MAPQ ≥1 were combined with mapped genome reads from the prior steps for downstream analysis.
To increase the efficiency of template-switching, the DNA primer annealed to the RNA-seq adapter in the initial template–primer substrate has a single-nucleotide 3′ overhang. This 3′-overhang nucleotide base-pairs to the 3′-terminal nucleotide of the target RNA, resulting in a seamless template-switching junction between the RNA-seq adapter and the target RNA (Mohr et al. 2013). In the present work, for the construction of RNA-seq libraries from RNA pools with minimal bias, we used an initial template–primer substrate with an equimolar mixture of A, C, G, or T 3′ overhangs (denoted N; see Mohr et al. 2013). The ability of a single base pair between the 3′-overhang nucleotide and the 3′ end of the target RNA to direct TGIRT template-switching at 60°C, the operational temperature of TGIRT enzymes, indicates a very potent strand annealing activity of group II intron RTs.
Because an RNA-seq adapter is added directly during cDNA synthesis, TGIRT-seq is inherently strand-specific. This strand specificity was confirmed here by the low frequency of antisense reads from a 74-nt RNA synthetic oligonucleotide template (7.2 × 10⁻⁶ and 1.9 × 10⁻⁵ for the TeI4c and GsI-IIC thermostable group II intron RTs, respectively; Materials and Methods) and by the lack of antisense reads for a variety of small ncRNAs in the plasma RNA-seq data sets described below.
For RNA-seq profiling, reverse transcription by TGIRT enzymes is done at 60°C in a reaction medium containing high salt (450 mM NaCl), which limits multiple template-switches. In the primary plasma RNA-seq data sets presented here (Data Sets 1–10 [DS1–10]), the percentage of fusion reads, which include multiple template-switches, was ≤0.14%, comparable with conventional RNA-seq methods using retroviral RTs (Lu and Matera 2014). Multiple template-switches that do occur are sporadic and can be distinguished from novel biologically relevant junctions resulting from DNA translocations or unannotated splice junctions by a combination of technical replicates, alignments to genomic sequences, and qRT-PCR validation. Because TGIRT enzymes have very high processivity, TGIRT template-switching is virtually always end-to-end and does not occur appreciably from internal sites (Mohr et al. 2013). In contrast, retroviral RTs frequently template-switch by dissociating from an internal site and reinitiating at a different site, resulting in artifactual internal deletions (Mader et al. 2001; Cocquet et al. 2006).
In the previous TGIRT-seq method, referred to as the small RNA/CircLigase method, cDNAs were linked by TGIRT template-switching to an RNA-seq adapter containing the complements to both the Illumina Read 2 (R2R) and Read 1 (R1R) primer-binding sites, gel purified and then circularized with CircLigase prior to PCR amplification (Katibah et al. 2014; Shen et al. 2015; Zheng et al. 2015). In contrast, in the new TGIRT-seq method developed here, the cDNAs with an attached R2R adapter sequence are processed into RNA-seq libraries without size selection by ligating a 5′-adenylated (5′ App) DNA oligonucleotide containing the R1R adapter to the cDNA 3′ end with Thermostable 5′ AppDNA/RNA Ligase (New England Biolabs). The 5′ App DNA oligonucleotide has a 3′-blocking group that impedes self-ligation. The ligated cDNAs were then amplified by 12 cycles of PCR with primers that introduce Illumina P5 and P7 flowcell capture sites and barcodes (Supplemental Fig. S1). The elimination of the gel-purification step improves sample recovery and decreases processing time, enabling us to construct RNA-seq libraries from small amounts of starting material in <5 h.
Preparation of human plasma RNAs
To obtain suitable starting material for RNA-seq, we tested several different plasma RNA preparation and DNase treatment methods with the aims of increasing the representation of miRNAs, which comprise only a small proportion of plasma RNAs, and reducing contamination from plasma DNA. Each RNA-seq data set presented below was constructed from RNAs extracted from 1 mL of plasma obtained from a healthy male individual at intervals at least 1 wk apart. For the primary data sets, plasma RNAs were extracted by using TRIzol LS Reagent (Thermo Fisher Scientific) followed by a Direct-zol RNA MiniPrep Kit (Zymo Research), as described in Materials and Methods. This method, which we refer to as the Direct-zol method, typically recovered 2–8 ng of nucleic acids per milliliter plasma, comparable to yields in previous studies (Burgos et al. 2013; Williams et al. 2013; Spornraft et al. 2014). The plasma RNA samples were analyzed by RNA-seq with no further treatment (NT), after enzymatic treatment to remove 3′ phosphates (–3′ P), which block TGIRT template-switching (Mohr et al. 2013), or after on-column DNase I digestion (OCD) under conditions that completely digest 10 ng of a mixture of a 74-nt ssDNA and a 275-nt dsDNA PCR product (Supplemental Fig. S2A).
Bioanalyzer traces of the NT sample showed two broad peaks: Peak 1 at ∼40–60 nt and Peak 2 at ∼160–170 nt (Fig. 2A). After the on-column DNase I treatment, Peak 2 disappeared, leaving only Peak 1 (Fig. 2B), which was sensitive to RNase I, an enzyme that degrades ssRNA, or alkaline hydrolysis, which degrades RNA but not DNA (Fig. 2C,D). The DNase sensitivity of Peak 2 is consistent with previous findings that plasma DNA fragments cluster at ∼160 bp corresponding in size to the length of dsDNA protected by nucleosomes (Fan et al. 2008). We found that total plasma RNA prepared by a mirVana miRNA Isolation Kit (Thermo Fisher Scientific) using a method that combines large and small RNA fractions to increase small RNA recovery (Materials and Methods) also contains a DNase-sensitive peak of size similar to Peak 2 (Supplemental Fig. S2B–D). Thus, plasma RNA prepared by either method cannot be assumed to be free of DNA. Because TGIRT enzymes can template-switch to either RNA or DNA fragments containing a 3′ OH (Mohr et al. 2013), RNA-seq data sets constructed from the NT and –3′ P samples potentially contain both plasma RNA and DNA sequences, whereas those constructed from the DNase-treated samples correspond almost entirely to RNA sequences, as judged by their sensitivity to RNase I and alkali (Fig. 2C,D).
FIGURE 2.

Bioanalyzer traces showing size profiles of plasma RNAs before and after various treatments. Total plasma RNA was prepared by the Direct-zol method, and a 1-µL portion was analyzed with an RNA 6000 Pico Kit (mRNA assay) on a 2100 Bioanalyzer (Agilent) to obtain the traces shown in the figure. (A) Total plasma RNA with no further treatment (NT). (B) Total plasma RNA after on-column DNase I treatment (OCD). (C,D) Total plasma RNA after OCD treatment followed by RNase I or alkaline hydrolysis treatments, respectively.
TGIRT-seq of plasma RNA samples
Table 1 summarizes mapping statistics for RNA-seq data sets constructed from Direct-zol NT, –3′ P, and OCD plasma RNAs by using the thermostable TeI4c group II intron RT. Samples were sequenced on an Illumina HiSeq 2500 (DS1; 69.4 million 100-nt paired-end reads) or NextSeq 500 (DS2–10; 14.6–37.8 million 75- or 150-nt paired-end reads). For each type of RNA preparation, we obtained at least three RNA-seq data sets, each using a different plasma sample taken from the same individual. After trimming and filtering to remove adapter sequences and low quality base calls, transcript lengths determined by the coverage of the paired-end read span were consistent with plasma RNA size profiles in bioanalyzer traces (Supplemental Fig. S3A,B). The processed reads were mapped to a human genome reference sequence (Ensembl GRCh38 Release 76) supplemented with additional rRNA gene contigs (Materials and Methods).
TABLE 1.
Read statistics and mapping for RNA-seq of total plasma RNAs using TeI4c group II intron RT
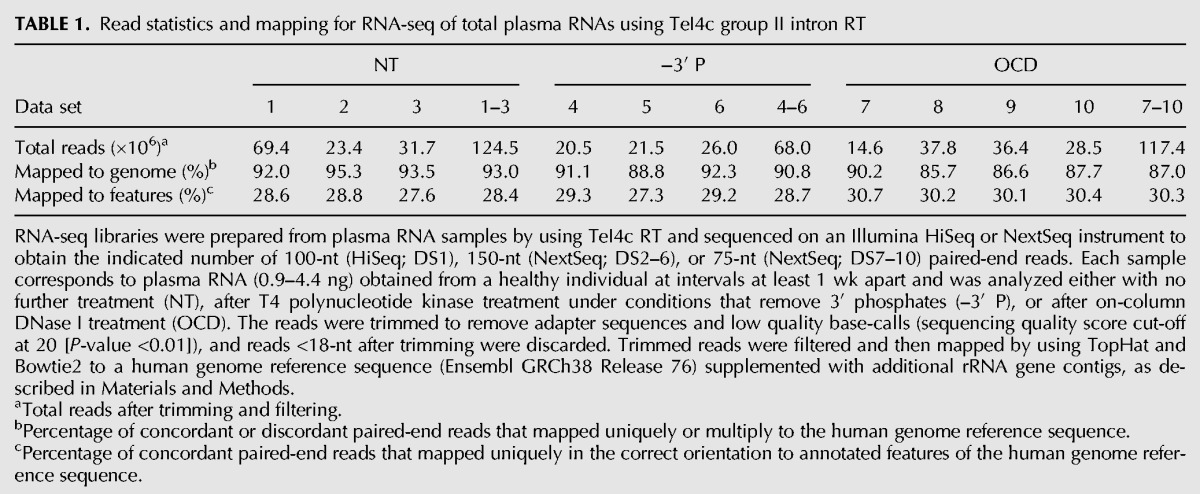
Because TGIRTs give full-length reads of tRNAs and other small ncRNAs, we developed a pipeline for read mapping, which uses TopHat v2.0.10 end-to-end alignment followed by Bowtie2 local alignment (Fig. 1B) to include RNAs with post-transcriptionally added nucleotides, such as the 3′ CCA of tRNAs or poly(U) tails (Malecki et al. 2013; Katibah et al. 2014). Like other RTs and DNA polymerases, TGIRTs can add a small number of extra nontemplated nucleotides to the 3′ ends of cDNAs (referred to as terminal transferase activity) (Clark 1988; Golinelli and Hughes 2002). Such extra nucleotides remain after local alignment, but are readily evaluated by IGV plots as shown below. For the plasma RNA-seq data sets constructed with the TeI4c thermostable group II intron RT, 85.7%–95.3% of the paired-end reads mapped to the human genome, and 27.3%–30.7% were concordant read pairs that mapped uniquely and with high mapping quality (MAPQ ≥15) to genomic features in the annotated orientation (Table 1). For confidence, only features with ≥10 hits were counted in the analysis.
Classes of RNAs detected in human plasma
Figure 3 shows the percentage of reads mapping to different genomic features in the RNA-seq data sets constructed by using TeI4c RT for total plasma RNA treated in various ways, using only uniquely mapped concordant read pairs for the calculation. The number of individual genes to which the reads mapped is shown next to each feature in the stacked bar graphs. The data sets for NT, –3′ P, and OCD-treated plasma RNAs show similar overall profiles of RNA classes with the majority of the reads corresponding to fragmented protein-coding gene and lncRNAs, and a smaller proportion (1.8%–5.8%) mapping to a variety of small ncRNAs (Fig. 3A,B; Supplemental Data File).
FIGURE 3.

Percentage of TGIRT-seq reads from total plasma RNA data sets mapping to different categories of genomic features. RNA-seq data sets were constructed by using TeI4c RT for total plasma RNA prepared by the Direct-zol method and either not treated (NT; combined DS1–3), 3′ dephosphorylated (–3′ P; combined DS4–6), or on-column DNase I-treated (OCD; combined DS7–10). Reads were mapped to genomic features as described in Materials and Methods. (A) Stacked bar graphs showing the percentage of concordant read pairs that mapped uniquely in the correct orientation to the indicated category of genomic features. Protein-coding genes include immunoglobulin and T-cell receptor genes; long ncRNAs include lincRNAs, antisense RNAs and other lncRNAs; and rRNA genes include 5S, 5.8S, 18S, and 28S rRNA genes. (B) Stacked bar graphs showing the percentage of small ncRNA read pairs (1.8%–5.8% of the reads in the total plasma RNA data sets) that mapped to different categories of small ncRNA genes. In A and B, the numbers next to each stacked bar segment indicate the number of different genes for which transcripts were identified in that category. Only features with ten or more mapped reads in the combined data sets were included. (MT) Mitochondrial genes.
While having little effect on the proportion of reads mapping to protein-coding gene and lncRNAs, the removal of 3′ phosphates (–3′ P), which block TGIRT template-switching, reproducibly increased the proportion of reads mapping to 18S and 28S rRNAs (from 0.9% ± 0.2% to 6.3% ± 4.0% of reads mapped to features, P-value = 0.15) and 5′-tRNA halves (from 0.4% to 7.1% of reads mapped to tRNAs, see below). These findings suggest that the protein-coding gene and lncRNA fragments present in plasma were either generated by RNases that leave a 3′ OH or had their 3′ phosphates removed by a phosphatase. Previous findings indicate that most intracellular RNases involved in cellular RNA turnover leave 3′-OH groups (Houseley and Tollervey 2009; Schoenberg and Maquat 2012). In contrast, the rRNA and 5′-tRNA halves present in plasma, whose representation increased after 3′ phosphate removal, were generated by RNases that leave a 2′3′-cyclic phosphate or 3′ phosphate (e.g., RNase A in blood or angiogenin in the case of tRNA haves) (Houseley and Tollervey 2009; Yamasaki et al. 2009).
Despite the differences in plasma collection dates, DNA sequencers, and read lengths, the biological replicates for RNA-seq data sets constructed with the TeI4c RT from each type of plasma RNA preparation (NT, –3′ P, and OCD) were highly reproducible, with pairwise Spearman's correlation coefficients (ρ) ranging from 0.85 to 0.92 (Supplemental Fig. S4A–C).
We obtained additional RNA-seq data sets of NT plasma RNA with the GsI-IIC thermostable group II intron RT, which is sold commercially as TGIRT-III enzyme (see Materials and Methods). The GsI-IIC RT data sets were very similar to TeI4c RT data sets in terms of mapping statistics, reproducibility, and features detected (Supplemental Table S1; Supplemental Figs. S4D, S5). The correlation coefficient between combined NT plasma RNA data sets obtained with the two TGIRT enzymes (DS1–3 versus DS12–14) was 0.92, with most of the differences due to low abundance RNA species (Supplemental Fig. S4E). Analysis of 3′-terminal nucleotides of RNAs in RNA-seq data sets constructed from DNase-treated plasma RNA preparations showed a relatively even distribution of the four possible 3′-terminal nucleotides by both enzymes, with only small differences of unclear significance in the frequencies of some di- or tri-nucleotide sequences (Supplemental Table S2).
Human plasma contains RNA fragments derived from large number of protein-coding gene and lncRNAs and appears enriched in intron and antisense sequences
The TGIRT-seq profiles suggest that human plasma RNA consists largely of RNA fragments derived from a diverse population of protein-coding gene and lncRNAs. From the Bioanalyzer traces of the on-column DNase I-treated (OCD) samples, we infer that the protein-coding gene and lncRNA fragments, which comprise a high proportion of plasma RNA, are heterogeneous in size with a broad peak at ∼40–60 nt (Peak 1; Fig. 2B), and this was supported by separately calculating the length distribution of protein-coding gene reads (excluding embedded small ncRNAs) in the DNase-treated samples (Supplemental Fig. S3C).
Further analysis of the protein-coding gene reads in NT and OCD-treated plasma RNA data sets indicated that they are enriched in intron and antisense sequences compared with human whole-cell RNAs analyzed by the same TGIRT-seq method using TeI4c RT (Jurkat cells) or GsI-IIC RT (K562 cells) (Fig. 4; Supplemental Table S3). RNA-seq data sets constructed from plasma RNA prepared by either the Direct-zol or mirVana combined methods and treated with Baseline-ZERO DNase (Epicentre), which according to the manufacturer digests DNA to mononucleotides, showed similar enrichments of intron and antisense sequences (data sets BZD and M-BZD in Fig. 4), as did limiting the analyzed protein-coding gene reads in the DNase-treated data sets to ≥30 nt to exclude residual small DNA fragments (denoted read span ≥30 nt in Fig. 4). Plots of the proportion of reads mapping to the sense and antisense strands versus gene length in the data sets for DNase-treated plasma RNAs showed wide variations for different genes with convergence toward 50% sense/antisense reads for longer genes in the larger data sets (Supplemental Fig. S6).
FIGURE 4.

Human plasma RNA is enriched in intron and antisense sequences compared with whole-cell RNAs. Reads mapping to protein-coding genes were analyzed to assess coverage across different regions and both DNA strands in RNA-seq data sets constructed with TGIRT enzymes for total plasma or whole-cell RNA prepared and treated in different ways. These include plasma RNA prepared by the Direct-zol method with no further treatment (NT; combined DS1–3), after on-column DNase I treatment (OCD; combined DS7–10), or after Baseline-ZERO DNase treatment (BZD; DS11); plasma RNA prepared by the mirVana combined method after Baseline-ZERO DNase treatment (M-BZD; DS16); and ribo-depleted and fragmented whole-cell RNA from Jurkat cells (TeI4c RT; DS18) or K562 cells (GsI-IIC RT; DS19). (A) Stacked bar graphs showing the percentage of bases in protein-coding gene reads that mapped to coding sequences (CDS), introns, 5′- and 3′-untranslated regions (UTRs), and intergenic regions. (B) Stacked bar graphs showing the proportion of concordant read pairs that mapped to the sense and antisense strands of protein-coding genes. In A and B, reads that mapped to protein-coding genes were filtered to remove those with >50% of the read length overlapping embedded small ncRNAs, and the percentage of bases or reads mapping to different regions or strands was calculated by using picard tools. Reads from the OCD, BZD, and M-BZD data sets were analyzed with or without removal of read pairs with a span of <30 nt to exclude short DNA fragments that may have escaped DNase treatment.
Previous studies have shown that a high proportion of the human genome is transcribed from both strands, with many annotated antisense RNAs overlapping protein-coding sequences on the opposite strand and concordantly regulated with the sense RNAs (Katayama et al. 2005; Werner 2013; Brown et al. 2014; Khorkova et al. 2014; Portal et al. 2015). Our findings raise the possibility that plasma RNA is enriched in extraneous intron and antisense RNAs, which may be preferentially targeted for degradation and cellular secretion, eventually finding their way into plasma.
Classes of small noncoding RNAs detected in plasma by TGIRT-seq
miRNAs
The TGIRT-seq profiles for different types of plasma RNA preparations indicate that miRNA are not abundant in human plasma. Figure 5A shows profiles of miRNAs detected in total plasma RNAs prepared by the Direct-zol method with on-column DNase I treatment (OCD) and by the mirVana combined method with Baseline-ZERO DNase treatment (M-BZD; Materials and Methods). The miRNAs detected by TeI4c RT in both types of RNA preparations showed skewed distributions (Fig. 5A). miRNA species with the highest read counts in both data sets include miR-451a, miR-142, miR-16-2, mir-122 (a liver-specific miRNA), miR-223, miR-19a, let-7a, miR-16-1, let-7b, miR-6087, miR-126, miR-17, and miR-21 (Fig. 5A). The abundant plasma miRNAs identified here include those previously reported to be present in plasma in complex with Ago2 proteins (e.g., miR-451a, miR-16, miR-122, miR-223, miR-19a, let-7b, and miR-21), largely in exosomes (e.g., mirR142 and let-7a), and in both Ago2 complexes and exosomes (miR-126) (Arroyo et al. 2011).
FIGURE 5.

Human plasma contains both mature and pre-miRNAs. (A) Relative abundance of miRNAs identified in RNA-seq data sets constructed with TeI4c RT for total plasma RNAs prepared by the Direct-zol method with on-column DNase I treatment (OCD; combined DS7–10; left) or by the mirVana combined method with Baseline-ZERO DNase treatment (M-BZD; DS16; right). miRNA loci with 10 or more mapped reads were rank-ordered by read count and plotted to display relative abundance. The 20 most abundant miRNAs loci by read count are shown in the bar graph insets. Loci encoding predicted miRNAs (Ensembl GRCh38 Release 76) were not included in the bar graphs unless mature-sized miRNAs mapping to the locus were identified in the data sets. (B,C) IGV screen shots showing coverage plots (CP; above) and alignments (below) of reads for loci in which abundant miRNA transcripts were identified in the OCD and M-BZD data sets, respectively. In B, the miRNA transcripts were ordered based on abundance as shown in the left panel of A. (C) IGV screen shots showing additional miRNA transcripts that were abundant in the M-BZD data set, but less abundant or not present in the OCD data sets. The arrow at the top indicates the boundaries and 5′–3′ orientation of the mature miRNA on the chromosomal DNA sequence. Reads were sorted by the start site on the chromosome, which can be from either the 5′ or 3′ end depending on the orientation of the gene on the chromosome. Nucleotides matching the genome sequence are shown in gray, and mismatches are shown as different colors (A, green; C, blue; G, brown; and T, red), which can either correspond to or be the complement of the RNA sequence depending on the orientation of the gene on the chromosome. Mismatches were checked against NCBI dbSNP, and known SNPs are indicated with the nucleotide change and corresponding SNP ID. Mismatches at the 5′ end of the reads are likely due to nontemplated nucleotide addition by the TGIRT enzyme to the 3′ end of the cDNAs. Some miRNAs (e.g., miR-122) have post-transcriptionally added A or AA residues at their 3′ ends (Norbury 2013).
Tissue expression profiles of the mature miRNAs in the RNA-seq data sets for both types of DNase-treated plasma RNA (Fig. 6; Supplemental Fig. S7) indicate that plasma is enriched in miRNAs that are abundant in endocrine glands and highly vascularized organs, along with a subset of miRNAs that are abundant (top 10 percentile) in red blood cells or platelets (miRNA names indicated in red in Fig. 6) (Landgraf et al. 2007; Wang et al. 2012). Some miRNAs abundant in brain were also detected with relative high read count in the plasma, in agreement with a previous study, which detected brain-specific transcripts in plasma with increased abundance of certain neuronal transcripts correlated with Alzheimer's disease (Koh et al. 2014).
FIGURE 6.

Tissue expression profiles for mature miRNAs in plasma. The figure shows tissue expression profiles of the mature miRNAs identified by TGIRT-Seq in total plasma RNA prepared by the Direct-zol method with on-column DNase I treatment (OCD; combined DS7–10). The profiles are based on the relative RNA-seq expression values of the miRNAs in a published database (Landgraf et al. 2007), and only miRNAs present in that database are shown. Tissue categories: podocytes include both differentiated and undifferentiated podocytes; peripheral leukocytes include T-lymphocytes, NK cells, monocytes, granulocytes, and dendritic cells. miRNAs highlighted in red are also abundant (top 10 percentile) in red blood cells or platelets (Wang et al. 2012), cell types for which relative RNA-seq expression values were not available in the database used to calculate the expression profiles (Landgraf et al. 2007).
Integrative Genomics Viewer (IGV) plots, in which reads are aligned to the genomic sequence, showed that most of the abundant miRNA are present in plasma as full-length, mature species, including some with post-transcriptionally added 3′ A residues (e.g., miR-122) (Fig. 5B; Norbury 2013). For miR-126, both the mature miRNA (miR-126-3p) and passenger strand (miR-126-5p) are present in human plasma, consistent with previous findings (Arroyo et al. 2011). In addition to annotated miRNAs, the M-BZD data set revealed mature-sized miRNAs from several predicted miRNA loci (e.g., AC034205.1, AC023050.1, and AL589669.1) (Fig. 5C). The IGV plots also show that a few miRNA species are present in plasma as full-length pre-miRNAs with both 5′ and 3′ ends corresponding exactly to the annotated mature miRNA arms (Supplemental Fig. S9A). Some of these pre-miRNAs are present together with the mature miRNAs (e.g., let-7f, miR-27a, miR-146a, and miR-30c), whereas others are present almost entirely as the pre-miRNA (e.g., miR-1229 and miR-139) (Fig. 5B,C). Such distinctions would be missed in miRNA quantitation by qRT-PCR or microarray assays. Although GsI-IIC RT used at limiting concentrations (500 nM) appears to under-represent miRNAs in total plasma RNA preparations, RNA-seq data sets constructed with GsI-IIC RT for mirVana small RNA preparations (Materials and Methods) were similar to those for TeI4c RT, with mostly minor differences in profiles for abundant miRNA species detected by the two TGIRT enzymes (Supplemental Fig. S8).
Finally, although the abundant miRNA species in DNase-treated plasma RNA data sets (OCD and M-BZD) correspond well to those detected in the nontreated (NT) plasma RNA data sets, we note the curious case of miR-182 for which we detected abundant reads corresponding to the exact antisense of the annotated mature miRNA in the NT data sets (Supplemental Fig. S9), the only mature miRNA for which antisense sequences were detected. This antisense miR-182 sequence was found reproducibly in multiple data sets of nontreated plasma RNAs obtained with both TGIRT enzymes, but disappeared after DNase treatment, leaving only the annotated sense orientation of the miRNA. These findings suggest that the antisense miR-182 was initially part of an RNA/DNA hybrid with the annotated miRNA, either an in vitro artifact or hinting at a novel DNA-based mode of miRNA-regulated gene expression.
tRNAs and tRNA fragments
tRNAs are the most abundant small ncRNAs detected in the data sets for total plasma RNA (83.0%–93.4% of the small ncRNA reads, mapping to 376–419 different tRNA genes; Fig. 3B). tRNA species grouped by anticodon showed a skewed distribution, with good correspondence between the abundant tRNA species detected by TeI4c in the NT and –3′ P plasma RNA preparations (Fig. 7A). IGV alignments for representative tRNA species to individual loci showed that most are full-length, extending from the processed 5′ end of the mature tRNA, or post-transcriptionally added 5′ G residue in the case of tRNAHis, to the post-transcriptionally added 3′ CCA (Fig. 7B). In contrast to retroviral RTs, which terminate at base modifications that affect Watson–Crick base-pairing interactions (Burnett and McHenry 1997; Ansmant et al. 2001; Jackman et al. 2003), TGIRTs frequently read through a number of such modifications (e.g., m1A58 and m1G9) by misincorporation, with the spectrum of misincorporated nucleotides characteristic of the modification (Katibah et al. 2014; Shen et al. 2015). tRNA-protein complexes have been identified previously in human sera as autoantigens in patients with autoimmune diseases, a well-studied example being HisGUG, which is bound to histidyl-tRNA synthetase in the polymyositis-specific autoantigen Jo-1 (Hardin et al. 1982; Mathews and Bernstein 1983; Rosa et al. 1983). Our findings indicate that HisGUG and other full-length tRNAs are normal, relatively abundant components of human plasma.
FIGURE 7.

TGIRT-seq identifies full-length mature tRNAs and tRNA fragments in human plasma. (A) Relative abundance of tRNAs identified in RNA-seq data sets constructed with TeI4c RT for total plasma RNA prepared by the Direct-zol method without (NT; combined DS1–3) or with treatment to remove 3′ phosphates (–3′ P; combined DS4–6). The plots show tRNAs with 10 or more mapped reads grouped by anticodon and rank-ordered by read count. The 15 most abundant tRNAs based on anticodon are shown in the bar graph insets. (B) IGV screen shots showing coverage plots (CP; above) and alignments (below) of reads for abundant full-length mature tRNAs identified in the NT data sets. The tRNAs were ordered by abundance as in the left panel of A. For cases in which multiple loci encode tRNAs with the same sequence, tRNA reads were distributed equally among different tRNA loci for the IGV alignments. (C) IGV screen shots showing coverage plots and alignments of reads for representative 3′-tRNA halves in the NT data sets (AlaAGC and ThrCGT) and 5′-tRNA halves in the –3′ P data sets (GlyCCC, ArgCCG, and AspGTC). The arrow at the top indicates the boundaries and 5′–3′ orientation of the mature tRNA on the chromosomal DNA sequence. In order to fit the entire alignment in one panel, genes with >1000 mapped reads were down-sampled to 1000 reads in IGV. Reads were sorted by start site on the chromosome. Nucleotides matching the genome sequence are shown in gray, and mismatches are shown as different colors (A, green; C, blue; G, brown; and T, red). Mismatches at the 5′ end of the reads are likely due to nontemplated nucleotide addition by the TGIRT enzyme to the 3′ end of the cDNAs. Mismatches due to misincorporation at known sites of post-transcriptional modifications are highlighted with the name of the modification. Modifications: I, inosine; m1A, 1-methyladenosine; m3C, 3-methylcytidine; m5C, 5-methylcytidine; m1G, 1-methylguanosine; m2G, N2-methylguanosine; m22G, N2,N2-dimethylguanosine.
In addition to abundant full-length tRNAs, we also detected 5′- and 3′-tRNA halves resulting from cleavage within the anticodon loop of several tRNAs (Fig. 7C). As noted previously, the percentage of 5′-tRNA halves reads increased from 0.4% of mapped tRNA reads in NT data sets to 7.1% of mapped tRNA reads in –3′P data sets, consistent with cleavage by an RNase, such as angiogenin, which leaves a 2′,3′-phosphate or 3′ phosphate (Fig. 7C; Fu et al. 2009). 5′-tRNA halves in plasma have been reported to be present in RNP complexes that are destabilized by chelating agents such as EDTA, which was used in our plasma preparation (Dhahbi et al. 2013b), and it is possible that the proportion of 5′-tRNA halves detected by TGIRT-seq would be higher in plasma prepared without EDTA.
Other small ncRNAs
The remaining small ncRNAs detected by TeI4c RT in NT total plasma RNA preparations include Y RNAs (3.8%; 84 species, including three of four known Y RNAs); snoRNAs (1.9%; 220 species); 7SL RNAs (1.8%; 191 species); snRNAs (0.9%; 145 species); Vault RNAs (VT; 0.8%; 5 species, including three of four known Vault RNAs); and 7SK RNAs (0.5%; 71 species) (Fig. 3B). Only fragments of snoRNAs, snRNAs, and Y RNAs were previously reported to be present in plasma or exosomes (Dhahbi et al. 2013a; Huang et al. 2013). We detected longer transcripts mapping to the piRNA cluster but not mature piRNAs, possibly reflecting the 2′-O-methyl group at their 3′ end, which inhibits TGIRT template-switching (Mohr et al. 2013).
Remarkably, many of the small ncRNAs that we identified in plasma are full-length transcripts, including snRNAs, both H/ACA-box and C/D-box snoRNAs, Y RNAs, Vault RNAs, 7SL RNAs (299 nt), and 7SK RNAs (332 nt) (Fig. 8A). All of these RNAs function intracellularly in RNP complexes (Walter and Blobel 1982; Kickhoefer et al. 2002; He et al. 2008; Markert et al. 2008; Esteller 2011; Chen et al. 2013), and their presence as full-length transcripts protected from plasma RNases suggests that they are present as such in plasma. Y RNA and Vault RNA are associated with autoantigens Ro/SSA and La/SSB, respectively, both of which have been implicated in autoimmune diseases, including systemic lupus erythematosus and Sjögren's syndrome (Halse et al. 1999; Xue et al. 2003; Routsias and Tzioufas 2010), while 7SL RNA, an RNA component of the signal recognition particle, has been implicated in the autoimmune disease myositis (Satoh et al. 2005). 7SK RNA, the central scaffold of an RNP complex that regulates nuclear transcription elongation (He et al. 2008; Markert et al. 2008), has not been reported previously in plasma. Notably, the unmapped reads contain 5′-truncated Y RNAs and Vault RNA fragments with poly(U) tails (Fig. 8B), presumably reflecting that they were targeted for degradation before being exported into plasma (Malecki et al. 2013).
FIGURE 8.

Other classes of small noncoding RNAs identified as full-length mature transcripts in human plasma by TGIRT-seq. (A) IGV screen shots showing coverage plots (CP; above) and alignments (below) of reads mapping to small ncRNAs loci in RNA-seq data sets constructed with TeI4c RT for total plasma RNA prepared by the Direct-zol method (NT; combined DS1–3). The RNA biotype is indicated at the top with the gene name and transcript length in parentheses. (B) Examples of small ncRNA fragments with poly(U) tails. IGV screen shots showing coverage plots (CP; above) and alignments (below) of Read 1s for poly(U)-tailed small ncRNAs found among the unmapped reads in NT data sets. In A and B, the arrow at the top indicates the boundaries and 5′ to 3′ orientation of the mature transcript on the chromosomal DNA sequence. In order to fit the entire alignment in one panel, genes with >1000 mapped reads were down-sampled to 1000 reads in IGV. Reads were sorted by start site on the chromosome, which can be from either the 5′ or 3′ end depending on the orientation of the gene on the chromosome. Nucleotides matching the genome sequence are shown in gray, and mismatches are shown as different colors (A, green; C, blue; G, brown; and T, red), which can either correspond to or be the complement of the RNA sequence. Mismatches were checked against NCBI dbSNP, and known SNPs are indicated with the nucleotide change and corresponding SNP ID. Other mismatches were manually checked and were due to lower quality base-calls, nontemplated nucleotide addition to the 3′ end of the cDNA resulting in extra nucleotides at the 5′ end of the read, or misalignment by Bowtie2 local alignment.
CONCLUSIONS
The RNA-seq method described here using a thermostable group II intron reverse transcriptase (TGIRT-seq) enables strand-specific comprehensive RNA profiling of different RNA size classes starting from small amounts of RNA. In addition to simpler library preparation without known biases of RNA ligation or random hexamer priming of reverse transcription (Linsen et al. 2009; Hansen et al. 2010; Levin et al. 2010; Lamm et al. 2011; Hu and Hughes 2012; Raabe et al. 2014), TGIRT-seq distinguishes mature miRNAs from pre-miRNAs and longer miRNA-containing transcripts, and it gives full-length reads including both the 5′- and 3′-RNA termini of a variety of highly structured small ncRNAs. Because gel-purification and phenol-extraction steps in previous versions of the method have been eliminated, RNA-seq libraries can be prepared from a small amount of starting material in <5 h and can potentially be automated to further enhance efficiency and throughput.
In this initial demonstration of the method, we prepared RNA from 1 mL of human plasma and used Illumina sequencing to obtain 14.6–69.4 million paired-end reads for total plasma RNA data sets, enabling profiling of plasma RNAs at relatively low cost. We found that human plasma RNAs consist largely of fragments of protein-coding gene and lncRNAs, together with less abundant small ncRNAs. The RNA fragments of protein-coding gene appear to be enriched in intron and antisense sequences, possibly reflecting preferential turnover of extraneous RNA sequences, which are packaged into exosomes, exported into the intercellular space, and eventually find their way into plasma. Surprisingly, we found that many of the small ncRNAs, including miRNAs, tRNAs, snoRNAs, snRNAs, Y RNAs, Vault RNAs, 7SL RNAs, and 7SK RNAs, are present as full-length transcripts, suggesting that they are protected from plasma RNase in RNP complexes and/or exosomes. Although miRNAs are not abundant in the total plasma RNA preparations, they were amply detected in a way that distinguishes mature miRNAs from pre-miRNAs and their coverage could be improved by greater sequencing depth or by small RNA enrichment.
The TGIRT-seq method developed here should be easily modifiable for different sequencing platforms. By including additional steps for rRNA depletion followed by RNA fragmentation and 3′-phosphate removal (Materials and Methods), TGIRT-seq is readily adaptable for the profiling of whole-cell RNAs, as well as for the analysis of exosomal RNAs and protein-bound RNA fragments in procedures like HITS-CLIP, RIP-Seq, and for ribosome profiling.
MATERIALS AND METHODS
Ethics statement
De-identified excess (discarded) plasma was used from a prior study, which had been declared to not meet the requirements for human subjects research as defined by the Common Rule (45 CFR 46) or FDA Regulations (21 CFR 50 & 56) by the University of Texas Office of Research Support.
Thermostable group II intron RTs
Reverse transcription of plasma RNAs for the construction of RNA-seq libraries was done by using a thermostable TeI4c group II intron RT (TeI4c-ΔEn fusion protein RT for DS1–11 and 16; TeI4c-MRF group II intron RT (Mohr et al. 2013) for DS18; Supplemental Table S4; and thermostable GsI-IIC RT (TGIRT-III; InGex) (DS12–15, 17, and 19; Supplemental Table S4). The TeI4c-ΔEn fusion protein RT was a gift from Enzymatics and is functionally equivalent to the TeI4c-MRF group II intron RTs described and used previously (Mohr et al. 2013).
Preparation of human plasma RNAs
Plasma from a healthy male individual was obtained from the Genome Sequencing and Analysis Facility at the University of Texas at Austin. To prepare plasma, fresh blood was collected in 10-mL K+/EDTA venous blood collection tubes, mixed with an equal volume of phosphate-buffered saline without calcium and magnesium (PBS −/−; Thermo Fisher Scientific), gently layered over 15-mL Ficoll-Paque PLUS (GE Healthcare) in a 50-mL conical tube, and centrifuged at 400g for 35 min at room temperature. After centrifugation, plasma (top layer) was transferred into a clean tube, aliquoted, and stored at −80°C.
To prepare total plasma RNA using the Direct-zol method, plasma (1 mL or four 250-µL aliquots) was mixed with three-volume TRIzol LS Reagent (Thermo Fisher Scientific), shaken vigorously for 10–30 sec to obtain a homogenous mixture, incubated at room temperature for 10 min with occasional mixing, and centrifuged at 12,000g for 10 min at 4°C in a 1.7-mL Eppendorf tube. The resulting supernatant was then mixed with one-volume 100% ethanol and 5 μg of linear acrylamide carrier (Thermo Fisher Scientific), incubated at room temperature for 10 min with occasional mixing, and processed with a Direct-zol RNA Miniprep Kit (Zymo Research) following the manufacturer's protocol. RNA extracted from 1-mL plasma was concentrated into 11 µL of double-distilled water (ddH2O) by ethanol precipitation in the presence of 0.3 M sodium acetate (pH 5.2) or with an RNA Clean & Concentrator Kit (Zymo Research).
To prepare total plasma RNA by using the mirVana combined method, 1 mL of plasma was processed by using a mirVana miRNA Isolation kit (Thermo Fisher Scientific) following the manufacturer's protocol, but combining the large and small RNA fractions to obtain a total plasma RNA preparation. After mixing the plasma lysate with one-third-volume 100% ethanol, the large RNA fraction was bound to the first column and eluted, while the small RNA fraction collected in the filtrate was mixed with an additional two-third-volume 100% ethanol, bound to the second column, eluted, and combined with the large RNA fraction. For mirVana small plasma RNA preparation, the large RNA fraction was discarded. In both methods, the RNA was concentrated and cleaned up as described above for the Direct-zol method.
RNA samples were used for RNA-seq either without further treatment (denoted NT), after 3′-phosphate removal (denoted –3′ P), or after different DNase treatments. For 3′-phosphate removal, the RNA samples were treated with T4 polynucleotide kinase (Epicentre) according to the manufacturer's recommendations, extracted with acid phenol–chloroform–isoamyl alcohol (25:24:1; Thermo Fisher Scientific), ethanol precipitated, and dissolved in 11-µL ddH2O. DNase treatment of RNA samples prepared by the Direct-zol RNA MiniPrep Kit (Zymo Research) was done following the manufacturer's protocol for on-column DNase I digestion with either 5-units DNase I (Zymo Research) as specified in the protocol (DS15) or with 20 units DNase I (DS7–10). Alternatively, DNase treatment was done on the eluted RNA by using Baseline-ZERO DNase (Epicentre) according to the manufacturer's recommendations. For RNase digestion, the on-column DNase I-treated samples were digested with RNase I (Epicentre) following the manufacture's protocol, and for alkaline hydrolysis, they were incubated at 95°C for 15 min in the presence of 0.25 M NaOH and then neutralized with equimolar HCl. After treatments, RNA samples were cleaned up with an RNA Clean & Concentrator Kit (Zymo Research) and eluted with 11-µL ddH2O. To check the efficiency of DNase digestion, we used a 10-ng mixture of a 74-nt synthetic ssDNA oligonucleotide (5′-TTTTGATTGTTTTTCGATGATGTTCGGTGAGCATTGTTCGAGTTTCATTTTATCACAGCCAGCTTTGATGTGC-3′; IDT) and a 275-bp dsDNA PCR product derived from the Lactococcus lactis Ll.LtrB group II intron.
RNA quality and quantity were assessed by running 1 µL of the 11-µL RNA samples on a 2100 Bioanalyzer (Agilent) using the RNA 6000 Pico Kit (mRNA assay) or Small RNA Kit for total or small plasma RNA preparations, respectively.
Construction of RNA-seq libraries
For the construction of plasma RNA-seq libraries, TGIRT template-switching reverse transcription reactions were done by using an initial template–primer substrate consisting of a 34-nt RNA oligonucleotide (R2 RNA), which contains an Illumina Read 2 primer-binding site and a 3′-blocking group (C3 Spacer, 3SpC3; IDT), annealed to a complementary 35-nt DNA primer (R2R DNA) that leaves an equimolar mixture of A, C, G, or T single-nucleotide 3′ overhangs (Supplemental Fig. S1). Reactions were done in 20 µL of reaction medium containing plasma RNA (0.9–4.4 ng for total RNA and 7.2–12 ng for small RNA preparations in 10-µL double-distilled water), 100 nM template–primer substrate, TGIRT enzyme (2 µM TeI4c or 500 nM GsI-IIC RT), and 1 mM dNTPs (an equimolar mix of 1 mM dATP, dCTP, dGTP, and dTTP) in 450 mM NaCl, 5 mM MgCl2, 20 mM Tris–HCl, pH 7.5, and dithiothreitol (DTT; 1 mM for TeI4c RT and 5 mM for GsI-IIC RT). DTT was either prepared freshly or from a frozen concentrated (0.5 or 1 M) stock solution. Reactions were assembled by adding all components, except dNTPs, to a sterile PCR tube containing plasma RNAs with the TGIRT enzyme added last. After pre-incubating at room temperature for 30 min, reactions were initiated by adding dNTPs and incubated for 15 min at 60°C. cDNA synthesis was terminated by adding 5 M NaOH to a final concentration of 0.25 M, incubating at 95°C for 3 min, and then neutralizing with 5 M HCl. The resulting cDNAs were purified with a MinElute Reaction Cleanup Kit (QIAGEN) and ligated at their 3′ end to a 5′-adenylated/3′-blocked (C3 spacer, 3SpC3; IDT) adapter (R1R; Supplemental Fig. S1) by using Thermostable 5′ AppDNA/RNA Ligase (New England Biolabs) according to the manufacturer's recommendations. The ligated cDNA products were repurified with a MinElute column and amplified by PCR by using Phusion High-Fidelity DNA polymerase (Thermo Fisher Scientific) with 200 nM of Illumina multiplex and 200 nM of barcode primers (a 5′ primer that adds a P5 capture site and a 3′ primer that adds a barcode plus P7 capture site; Supplemental Fig. S1). PCR was done with initial denaturation at 98°C for 5 sec followed by 12 cycles of 98°C for 5 sec, 60°C for 10 sec, and 72°C for 10 sec. The PCR products were purified by using the Agencourt AMPure XP beads (Beckman Coulter) and sequenced on a HiSeq 2500 or a NextSeq 500 instrument (Illumina) to obtain 100-nt (HiSeq), 75-nt (NextSeq), or 150-nt (NextSeq) paired-end reads.
RNA-seq libraries of cellular RNAs were constructed similarly from RNAs isolated from K562 cells (ATCC CCL-243, maintained in IMDM supplemented with 10% FBS at 37°C with a 5% CO2 atmosphere) using a mirVana miRNA Isolation Kit (Thermo Fisher Scientific) following the manufacturer's protocol, or commercial T Cell Leukemia (Jurkat cell) Total RNA (Thermo Fisher Scientific). Whole-cell RNAs (5 µg) were ribo-depleted by using a RiboZero Gold Kit (Human/Mouse/Rat) (Epicentre) and then fragmented to a size predominantly between 70 and 100 nt by using an NEBNext Magnesium Fragmentation Module (New England Biolabs). Forty nanograms of fragmented RNAs was treated with T4 Polynucleotide Kinase (Epicentre) to remove 3′ phosphates, cleaned up with an RNA Clean & Concentrator Kit (Zymo Research), and used for RNA-seq library construction with TGIRT enzymes (GsI-IIC for K562 and TeI4c for Jurkat cell RNAs) as described above.
RNA-seq analysis of cDNA recopying by TGIRT enzymes
Control RNA-seq to assess the strand specificity of TGIRT enzymes was done with 50 ng of a 74-nt synthetic RNA oligonucleotide (5′-UUUUGAUUGUUUUUCGAUGAUGUUCGGUGAGCAUUGUUCGAGUUUCAUUUUUAUCACAGCCAGCUUUGAUGUGC; IDT) using 2 μM TeI4c-MRF or 1 μM GsI-IIC RTs under the conditions described above. Libraries were sequenced on an Illumina HiSeq, yielding 6.5–6.9 × 10⁵ 100-nt single-end reads that mapped to the RNA oligonucleotide sequence in the expected orientation. Only a very small number of reads (3 for TeI4c-MRF RT and 12 for GsI-IIC RT) mapped to the RNA oligonucleotide in the antisense orientation, corresponding to recopying frequencies of 7.2 × 10⁻⁶ and 1.9 × 10⁻⁵ for TeI4c-MRF and GsI-IIC RTs, respectively. All of the antisense reads resulted from template-switching to a previously synthesized cDNA from either the 5′ end of the R2 RNA in the template–primer substrate or from the 5′ end of a previously copied RNA, resulting in a product with the R2R DNA sequence on one end and the R2 RNA sequence on the other end. Both types of low frequency recopying are readily identifiable by examining the reads without adapter trimming.
Bioinformatic analysis
The bioinformatic pipeline used for analysis of RNA-seq data is outlined in Figure 1B. First, Illumina TruSeq DNA adapter and primer sequences were trimmed from the reads by using cutadapt (Martin 2011) (sequencing quality score cut-off at 20; P-value <0.01), and reads <18 nt after trimming were discarded. Reads were then mapped by using TopHat v2.0.10 and Bowtie2 v2.1.0 (default settings) to the human genome reference sequence (Ensembl GRCh38 release 76) (Langmead and Salzberg 2012; Kim et al. 2013) supplemented with additional contigs containing 5S rRNA (2.2-kb 5S rRNA repeats from the cluster on chromosome 1 [1q42]; GeneBank: X12811) and 45S rRNA genes (43-kb 45S rRNA repeats containing 5.8S, 18S, and 28S rRNA sequences from clusters on chromosomes 13, 14, 15, 21 and 22; GeneBank: U13369). Other sequences used for mapping included DNA oligonucleotide sequences used in control experiments (see above) to test for sample cross-contamination, and the Escherichia coli genome sequence (Genebank: NC_000913) to remove any reads resulting from E. coli nucleic acids in enzyme preparations. Unmapped reads from this first pass (Pass 1) were remapped to Ensembl GRCh38 release 76 by Bowtie2 with local alignment (default settings) to improve the mapping rate for those reads that contain post-transcriptionally added nucleotides [e.g., CCA and poly(U)], untrimmed adapter sequences, and nontemplated nucleotides added to the 3′ end of the cDNAs by TGIRT enzymes (Pass 2). The mapped reads from Passes 1 and 2 were combined and filtered by mapping quality (MAPQ ≥15; P-value <0.03), and concordant read pairs were collected by using Samtools. The concordant read pairs were then intersected with gene annotations (Ensembl GRCh38 release 76) and piRNA cluster annotations from piRNABank (Sai Lakshmi and Agrawal 2008) to collect reads that mapped uniquely in the annotated orientation to genomic features (genomic coordinates for piRNAs were converted to Ensembl GRCh38 release 76 coordinates using scripts from the UCSC genome browser website). Coverage of each feature was calculated by Bedtools. To improve the mapping rate for tRNAs, mapped reads from Passes 1 and 2 were intersected with tRNA annotations from the Genomic tRNA Database (Lowe and Eddy 1997) to collect both uniquely and multiply mapped tRNAs reads. These were then combined with unmapped reads after Pass 2, and the combined reads were mapped to human tRNA reference sequences (UCSC genome browser website) using Bowtie2 local alignment with default settings. Because similar or identical tRNAs with the same anticodon can be multiply mapped to different tRNA loci by Bowtie2, mapped tRNA reads with MAPQ ≥1 were combined according to their tRNA anticodon prior to calculating the tRNA distributions. Only those features with 10 or more mapped reads were counted.
Coverage plots and alignments of reads were created by using Integrative Genomics Viewer (IGV) (Robinson et al. 2011). Information about single-nucleotide polymorphisms (SNPs) was obtained from NCBI dbSNP (Database of Single Nucleotide Polymorphisms Build 142; common category, minor allele frequency ≥1% in at least one of the 26 major populations, with at least two unrelated individuals having the minor allele).
For correlation analysis, RNA-seq data sets were normalized for the total number of mapped reads by using DESeq (Anders and Huber 2010) and plotted with ggplot2 in R. To assess tissue expression profiles for mature miRNAs detected in plasma, reads mapped to genomic features (Ensembl GRCh38 release 76) were filtered by size and reads shorter than 30 nt were intersected with miRBase 21 to obtain reads for mature miRNAs. The latter were intersected with a published database to obtain RNA-seq expression values (Landgraf et al. 2007), which were then normalized for different tissues and plotted with ggplot2 in R.
To identify RNAs with poly(U) tails, unmapped reads after the first TopHat alignment (Pass 1; see above) were processed by using cutadapt and custom scripts to find a stretch of ≥10 Us with <10% other nucleotides at the beginning of the Reads 2. The corresponding Reads 1 were then mapped to human genome reference sequence using Bowtie2 local alignment to identify the RNA species to which the poly(U) tails are appended, and were used for IGV plots.
Excel spreadsheets for miRNAs, tRNAs, and other small ncRNAs identified by TGIRT-seq in different plasma RNA preparations are included as a Supplemental Data File.
DATA DEPOSITION
The RNA-seq data sets in this manuscript have been deposited in the National Center for Biotechnology Information Sequence Read Archive (http://www.ncbi.nlm.nih.gov/sra) under accession number SRP064378.
SUPPLEMENTAL MATERIAL
Supplemental material is available for this article.
COMPETING INTEREST STATEMENT
Thermostable group II intron reverse transcriptase (TGIRT) enzymes and methods for their use are the subject of patents and patent applications that have been licensed by the University of Texas at Austin and East Tennessee State University to InGex, LLC. A.M.L. and the University of Texas are minority equity holders in InGex, LLC, and A.M.L., S.M. and other present and former Lambowitz laboratory members receive royalty payments from sales of TGIRT enzymes and licensing of intellectual property.
Supplementary Material
ACKNOWLEDGMENTS
We thank Vishwanath Iyer (UT Austin) for comments on the manuscript. This work was supported by National Institutes of Health (NIH) grants GM37949 and GM37951 and Welch Foundation Grant F-1607.
Footnotes
Article published online ahead of print. Article and publication date are at http://www.rnajournal.org/cgi/doi/10.1261/rna.054809.115.
REFERENCES
- Anders S, Huber W. 2010. Differential expression analysis for sequence count data. Genome Biol 11: R106. [DOI] [PMC free article] [PubMed] [Google Scholar]
- Ansmant I, Motorin Y, Massenet S, Grosjean H, Branlant C. 2001. Identification and characterization of the tRNA:Ψ31-synthase (Pus6p) of Saccharomyces cerevisiae. J Biol Chem 276: 34934–34940. [DOI] [PubMed] [Google Scholar]
- Arroyo JD, Chevillet JR, Kroh EM, Ruf IK, Pritchard CC, Gibson DF, Mitchell PS, Bennett CF, Pogosova-Agadjanyan EL, Stirewalt DL, et al. 2011. Argonaute2 complexes carry a population of circulating microRNAs independent of vesicles in human plasma. Proc Natl Acad Sci 108: 5003–5008. [DOI] [PMC free article] [PubMed] [Google Scholar]
- Batista PJ, Chang HY. 2013. Long noncoding RNAs: cellular address codes in development and disease. Cell 152: 1298–1307. [DOI] [PMC free article] [PubMed] [Google Scholar]
- Brown JB, Boley N, Eisman R, May GE, Stoiber MH, Duff MO, Booth BW, Wen J, Park S, Suzuki AM, et al. 2014. Diversity and dynamics of the Drosophila transcriptome. Nature 512: 393–399. [DOI] [PMC free article] [PubMed] [Google Scholar]
- Brunner AL, Beck AH, Edris B, Sweeney RT, Zhu SX, Li R, Montgomery K, Varma S, Gilks T, Guo X, et al. 2012. Transcriptional profiling of long non-coding RNAs and novel transcribed regions across a diverse panel of archived human cancers. Genome Biol 13: R75. [DOI] [PMC free article] [PubMed] [Google Scholar]
- Burgos KL, Javaherian A, Bomprezzi R, Ghaffari L, Rhodes S, Courtright A, Tembe W, Kim S, Metpally R, Van Keuren-Jensen K. 2013. Identification of extracellular miRNA in human cerebrospinal fluid by next-generation sequencing. RNA 19: 712–722. [DOI] [PMC free article] [PubMed] [Google Scholar]
- Burnett BP, McHenry CS. 1997. Posttranscriptional modification of retroviral primers is required for late stages of DNA replication. Proc Natl Acad Sci 94: 7210–7215. [DOI] [PMC free article] [PubMed] [Google Scholar]
- Cabili MN, Trapnell C, Goff L, Koziol M, Tazon-Vega B, Regev A, Rinn JL. 2011. Integrative annotation of human large intergenic noncoding RNAs reveals global properties and specific subclasses. Genes Dev 25: 1915–1927. [DOI] [PMC free article] [PubMed] [Google Scholar]
- Chen R, Mias GI, Li-Pook-Than J, Jiang L, Lam HY, Chen R, Miriami E, Karczewski KJ, Hariharan M, Dewey FE, et al. 2012. Personal omics profiling reveals dynamic molecular and medical phenotypes. Cell 148: 1293–1307. [DOI] [PMC free article] [PubMed] [Google Scholar]
- Chen X, Taylor DW, Fowler CC, Galan JE, Wang HW, Wolin SL. 2013. An RNA degradation machine sculpted by Ro autoantigen and noncoding RNA. Cell 153: 166–177. [DOI] [PMC free article] [PubMed] [Google Scholar]
- Clark JM. 1988. Novel non-templated nucleotide addition reactions catalyzed by procaryotic and eucaryotic DNA polymerases. Nucleic Acids Res 16: 9677–9686. [DOI] [PMC free article] [PubMed] [Google Scholar]
- Cocquet J, Chong A, Zhang G, Veitia RA. 2006. Reverse transcriptase template switching and false alternative transcripts. Genomics 88: 127–131. [DOI] [PubMed] [Google Scholar]
- Croce CM. 2009. Causes and consequences of microRNA dysregulation in cancer. Nat Rev Genet 10: 704–714. [DOI] [PMC free article] [PubMed] [Google Scholar]
- Dhahbi JM, Spindler SR, Atamna H, Boffelli D, Mote P, Martin DI. 2013a. 5′-YRNA fragments derived by processing of transcripts from specific YRNA genes and pseudogenes are abundant in human serum and plasma. Physiol Genomics 45: 990–998. [DOI] [PubMed] [Google Scholar]
- Dhahbi JM, Spindler SR, Atamna H, Yamakawa A, Boffelli D, Mote P, Martin DI. 2013b. 5′ tRNA halves are present as abundant complexes in serum, concentrated in blood cells, and modulated by aging and calorie restriction. BMC Genomics 14: 298. [DOI] [PMC free article] [PubMed] [Google Scholar]
- Enyeart PJ, Mohr G, Ellington AD, Lambowitz AM. 2014. Biotechnological applications of mobile Group II introns and their reverse transcriptases: gene targeting, RNA-seq, and non-coding RNA analysis. Mob DNA 5: 2. [DOI] [PMC free article] [PubMed] [Google Scholar]
- Esteller M. 2011. Non-coding RNAs in human disease. Nat Rev Genet 12: 861–874. [DOI] [PubMed] [Google Scholar]
- Fabbri M, Paone A, Calore F, Galli R, Gaudio E, Santhanam R, Lovat F, Fadda P, Mao C, Nuovo GJ, et al. 2012. MicroRNAs bind to toll-like receptors to induce prometastatic inflammatory response. Proc Natl Acad Sci 109: E2110–E2116. [DOI] [PMC free article] [PubMed] [Google Scholar]
- Fan HC, Blumenfeld YJ, Chitkara U, Hudgins L, Quake SR. 2008. Noninvasive diagnosis of fetal aneuploidy by shotgun sequencing DNA from maternal blood. Proc Natl Acad Sci 105: 16266–16271. [DOI] [PMC free article] [PubMed] [Google Scholar]
- Fu H, Feng J, Liu Q, Sun F, Tie Y, Zhu J, Xing R, Sun Z, Zheng X. 2009. Stress induces tRNA cleavage by angiogenin in mammalian cells. FEBS Lett 583: 437–442. [DOI] [PubMed] [Google Scholar]
- Golinelli MP, Hughes SH. 2002. Nontemplated nucleotide addition by HIV-1 reverse transcriptase. Biochemistry 41: 5894–5906. [DOI] [PubMed] [Google Scholar]
- Grasedieck S, Sorrentino A, Langer C, Buske C, Döhner H, Mertens D, Kuchenbauer F. 2013. Circulating microRNAs in hematological diseases: principles, challenges, and perspectives. Blood 121: 4977–4984. [DOI] [PubMed] [Google Scholar]
- Halse AK, Wahren-Herlenius M, Jonsson R. 1999. Ro/SS-A- and La/SS-B-reactive B lymphocytes in peripheral blood of patients with Sjögren's syndrome. Clin Exp Immunol 115: 208–213. [DOI] [PMC free article] [PubMed] [Google Scholar]
- Hansen KD, Brenner SE, Dudoit S. 2010. Biases in Illumina transcriptome sequencing caused by random hexamer priming. Nucleic Acids Res 38: e131. [DOI] [PMC free article] [PubMed] [Google Scholar]
- Hardin JA, Rahn DR, Shen C, Lerner MR, Wolin SL, Rosa MD, Steitz JA. 1982. Antibodies from patients with connective tissue diseases bind specific subsets of cellular RNA-protein particles. J Clin Invest 70: 141–147. [DOI] [PMC free article] [PubMed] [Google Scholar]
- Head SR, Komori HK, LaMere SA, Whisenant T, Van Nieuwerburgh F, Salomon DR, Ordoukhanian P. 2014. Library construction for next-generation sequencing: overviews and challenges. Biotechniques 56: 61–64. [DOI] [PMC free article] [PubMed] [Google Scholar]
- He N, Jahchan NS, Hong E, Li Q, Bayfield MA, Maraia RJ, Luo K, Zhou Q. 2008. A La-related protein modulates 7SK snRNP integrity to suppress P-TEFb-dependent transcriptional elongation and tumorigenesis. Mol Cell 29: 588–599. [DOI] [PMC free article] [PubMed] [Google Scholar]
- Houseley J, Tollervey D. 2009. The many pathways of RNA degradation. Cell 136: 763–776. [DOI] [PubMed] [Google Scholar]
- Hu WS, Hughes SH. 2012. HIV-1 reverse transcription. Cold Spring Harb Perspect Med 2: a006882. [DOI] [PMC free article] [PubMed] [Google Scholar]
- Huang X, Yuan T, Tschannen M, Sun Z, Jacob H, Du M, Liang M, Dittmar RL, Liu Y, Liang M, et al. 2013. Characterization of human plasma-derived exosomal RNAs by deep sequencing. BMC Genomics 14: 319. [DOI] [PMC free article] [PubMed] [Google Scholar]
- Jackman JE, Montange RK, Malik HS, Phizicky EM. 2003. Identification of the yeast gene encoding the tRNA m1G methyltransferase responsible for modification at position 9. RNA 9: 574–585. [DOI] [PMC free article] [PubMed] [Google Scholar]
- Katayama S, Tomaru Y, Kasukawa T, Waki K, Nakanishi M, Nakamura M, Nishida H, Yap CC, Suzuki M, Kawai J, et al. 2005. Antisense transcription in the mammalian transcriptome. Science 309: 1564–1566. [DOI] [PubMed] [Google Scholar]
- Katibah GE, Qin Y, Sidote DJ, Yao J, Lambowitz AM, Collins K. 2014. Broad and adaptable RNA structure recognition by the human interferon-induced tetratricopeptide repeat protein IFIT5. Proc Natl Acad Sci 111: 12025–12030. [DOI] [PMC free article] [PubMed] [Google Scholar]
- Keller A, Leidinger P, Bauer A, Elsharawy A, Haas J, Backes C, Wendschlag A, Giese N, Tjaden C, Ott K, et al. 2011. Toward the blood-borne miRNome of human diseases. Nat Methods 8: 841–843. [DOI] [PubMed] [Google Scholar]
- Khorkova O, Myers AJ, Hsiao J, Wahlestedt C. 2014. Natural antisense transcripts. Hum Mol Genet 23: R54–R63. [DOI] [PMC free article] [PubMed] [Google Scholar]
- Kickhoefer VA, Poderycki MJ, Chan EK, Rome LH. 2002. The La RNA-binding protein interacts with the vault RNA and is a vault-associated protein. J Biol Chem 277: 41282–41286. [DOI] [PubMed] [Google Scholar]
- Kim D, Pertea G, Trapnell C, Pimentel H, Kelley R, Salzberg SL. 2013. TopHat2: accurate alignment of transcriptomes in the presence of insertions, deletions and gene fusions. Genome Biol 14: R36. [DOI] [PMC free article] [PubMed] [Google Scholar]
- Koh W, Pan W, Gawad C, Fan HC, Kerchner GA, Wyss-Coray T, Blumenfeld YJ, El-Sayed YY, Quake SR. 2014. Noninvasive in vivo monitoring of tissue-specific global gene expression in humans. Proc Natl Acad Sci 111: 7361–7366. [DOI] [PMC free article] [PubMed] [Google Scholar]
- Kopreski MS, Benko FA, Gocke CD. 2001. Circulating RNA as a tumor marker: detection of 5T4 mRNA in breast and lung cancer patient serum. Ann N Y Acad Sci 945: 172–178. [PubMed] [Google Scholar]
- Lambowitz AM, Belfort M. 2015. Mobile bacterial group II introns at the crux of eukaryotic evolution. Microbiol Spectr 3: MDNA3-0050-2014. [DOI] [PMC free article] [PubMed] [Google Scholar]
- Lamm AT, Stadler MR, Zhang H, Gent JI, Fire AZ. 2011. Multimodal RNA-seq using single-strand, double-strand, and CircLigase-based capture yields a refined and extended description of the C. elegans transcriptome. Genome Res 21: 265–275. [DOI] [PMC free article] [PubMed] [Google Scholar]
- Landgraf P, Rusu M, Sheridan R, Sewer A, Iovino N, Aravin A, Pfeffer S, Rice A, Kamphorst AO, Landthaler M, et al. 2007. A mammalian microRNA expression atlas based on small RNA library sequencing. Cell 129: 1401–1414. [DOI] [PMC free article] [PubMed] [Google Scholar]
- Langmead B, Salzberg SL. 2012. Fast gapped-read alignment with Bowtie 2. Nat Methods 9: 357–359. [DOI] [PMC free article] [PubMed] [Google Scholar]
- Levin JZ, Yassour M, Adiconis X, Nusbaum C, Thompson DA, Friedman N, Gnirke A, Regev A. 2010. Comprehensive comparative analysis of strand-specific RNA sequencing methods. Nat Methods 7: 709–715. [DOI] [PMC free article] [PubMed] [Google Scholar]
- Linsen SE, de Wit E, Janssens G, Heater S, Chapman L, Parkin RK, Fritz B, Wyman SK, de Bruijn E, Voest EE, et al. 2009. Limitations and possibilities of small RNA digital gene expression profiling. Nat Methods 6: 474–476. [DOI] [PubMed] [Google Scholar]
- Lowe TM, Eddy SR. 1997. tRNAscan-SE: a program for improved detection of transfer RNA genes in genomic sequence. Nucleic Acids Res 25: 955–964. [DOI] [PMC free article] [PubMed] [Google Scholar]
- Lu Z, Matera AG. 2014. Vicinal: a method for the determination of ncRNA ends using chimeric reads from RNA-seq experiments. Nucleic Acids Res 42: e79. [DOI] [PMC free article] [PubMed] [Google Scholar]
- Lu J, Getz G, Miska EA, Alvarez-Saavedra E, Lamb J, Peck D, Sweet-Cordero A, Ebert BL, Mak RH, Ferrando AA, et al. 2005. MicroRNA expression profiles classify human cancers. Nature 435: 834–838. [DOI] [PubMed] [Google Scholar]
- Mader RM, Schmidt WM, Sedivy R, Rizovski B, Braun J, Kalipciyan M, Exner M, Steger GG, Mueller MW. 2001. Reverse transcriptase template switching during reverse transcriptase-polymerase chain reaction: artificial generation of deletions in ribonucleotide reductase mRNA. J Lab Clin Med 137: 422–428. [DOI] [PubMed] [Google Scholar]
- Malecki M, Viegas SC, Carneiro T, Golik P, Dressaire C, Ferreira MG, Arraiano CM. 2013. The exoribonuclease Dis3L2 defines a novel eukaryotic RNA degradation pathway. EMBO J 32: 1842–1854. [DOI] [PMC free article] [PubMed] [Google Scholar]
- Markert A, Grimm M, Martinez J, Wiesner J, Meyerhans A, Meyuhas O, Sickmann A, Fischer U. 2008. The La-related protein LARP7 is a component of the 7SK ribonucleoprotein and affects transcription of cellular and viral polymerase II genes. EMBO Rep 9: 569–575. [DOI] [PMC free article] [PubMed] [Google Scholar]
- Martin M. 2011. Cutadapt removes adapter sequences from high-throughput sequencing reads. EMBnet J 17: 10–12. [Google Scholar]
- Mathews MB, Bernstein RM. 1983. Myositis autoantibody inhibits histidyl-tRNA synthetase: a model for autoimmunity. Nature 304: 177–179. [DOI] [PubMed] [Google Scholar]
- Mitchell PS, Parkin RK, Kroh EM, Fritz BR, Wyman SK, Pogosova-Agadjanyan EL, Peterson A, Noteboom J, O'Briant KC, Allen A, et al. 2008. Circulating microRNAs as stable blood-based markers for cancer detection. Proc Natl Acad Sci 105: 10513–10518. [DOI] [PMC free article] [PubMed] [Google Scholar]
- Mohr S, Ghanem E, Smith W, Sheeter D, Qin Y, King O, Polioudakis D, Iyer VR, Hunicke-Smith S, Swamy S, et al. 2013. Thermostable group II intron reverse transcriptase fusion proteins and their use in cDNA synthesis and next-generation RNA sequencing. RNA 19: 958–970. [DOI] [PMC free article] [PubMed] [Google Scholar]
- Moussay E, Wang K, Cho JH, van Moer K, Pierson S, Paggetti J, Nazarov PV, Palissot V, Hood LE, Berchem G, et al. 2011. MicroRNA as biomarkers and regulators in B-cell chronic lymphocytic leukemia. Proc Natl Acad Sci 108: 6573–6578. [DOI] [PMC free article] [PubMed] [Google Scholar]
- Norbury CJ. 2013. Cytoplasmic RNA: a case of the tail wagging the dog. Nat Rev Mol Cell Biol 14: 643–653. [DOI] [PubMed] [Google Scholar]
- Ozsolak F, Milos PM. 2011. RNA sequencing: advances, challenges and opportunities. Nat Rev Genet 12: 87–98. [DOI] [PMC free article] [PubMed] [Google Scholar]
- Portal MM, Pavet V, Erb C, Gronemeyer H. 2015. Human cells contain natural double-stranded RNAs with potential regulatory functions. Nat Struct Mol Biol 22: 89–97. [DOI] [PubMed] [Google Scholar]
- Raabe CA, Tang TH, Brosius J, Rozhdestvensky TS. 2014. Biases in small RNA deep sequencing data. Nucleic Acids Res 42: 1414–1426. [DOI] [PMC free article] [PubMed] [Google Scholar]
- Robinson JT, Thorvaldsdóttir H, Winckler W, Guttman M, Lander ES, Getz G, Mesirov JP. 2011. Integrative genomics viewer. Nat Biotechnol 29: 24–26. [DOI] [PMC free article] [PubMed] [Google Scholar]
- Rosa MD, Hendrick JP Jr, Lerner MR, Steitz JA, Reichlin M. 1983. A mammalian tRNAHis-containing antigen is recognized by the polymyositis-specific antibody anti-Jo-1. Nucleic Acids Res 11: 853–870. [DOI] [PMC free article] [PubMed] [Google Scholar]
- Rosenfeld N, Aharonov R, Meiri E, Rosenwald S, Spector Y, Zepeniuk M, Benjamin H, Shabes N, Tabak S, Levy A, et al. 2008. MicroRNAs accurately identify cancer tissue origin. Nat Biotechnol 26: 462–469. [DOI] [PubMed] [Google Scholar]
- Routsias JG, Tzioufas AG. 2010. B-cell epitopes of the intracellular autoantigens Ro/SSA and La/SSB: tools to study the regulation of the autoimmune response. J Autoimmun 35: 256–264. [DOI] [PubMed] [Google Scholar]
- Sai Lakshmi S, Agrawal S. 2008. piRNABank: a web resource on classified and clustered Piwi-interacting RNAs. Nucleic Acids Res 36: D173–D177. [DOI] [PMC free article] [PubMed] [Google Scholar]
- Satoh T, Okano T, Matsui T, Watabe H, Ogasawara T, Kubo K, Kuwana M, Fertig N, Oddis CV, Kondo H, et al. 2005. Novel autoantibodies against 7SL RNA in patients with polymyositis/dermatomyositis. J Rheumatol 32: 1727–1733. [PubMed] [Google Scholar]
- Schoenberg DR, Maquat LE. 2012. Regulation of cytoplasmic mRNA decay. Nat Rev Genet 13: 246–259. [DOI] [PMC free article] [PubMed] [Google Scholar]
- Shen PS, Park J, Qin Y, Li X, Parsawar K, Larson MH, Cox J, Cheng Y, Lambowitz AM, Weissman JS, et al. 2015. Protein synthesis. Rqc2p and 60S ribosomal subunits mediate mRNA-independent elongation of nascent chains. Science 347: 75–78. [DOI] [PMC free article] [PubMed] [Google Scholar]
- Silva J, García V, García JM, Peña C, Domínguez G, Díaz R, Lorenzo Y, Hurtado A, Sánchez A, Bonilla F. 2007. Circulating Bmi-1 mRNA as a possible prognostic factor for advanced breast cancer patients. Breast Cancer Res 9: R55. [DOI] [PMC free article] [PubMed] [Google Scholar]
- Spornraft M, Kirchner B, Haase B, Benes V, Pfaffl MW, Riedmaier I. 2014. Optimization of extraction of circulating RNAs from plasma—enabling small RNA sequencing. PLoS One 9: e107259. [DOI] [PMC free article] [PubMed] [Google Scholar]
- Valadi H, Ekström K, Bossios A, Sjöstrand M, Lee JJ, Lötvall JO. 2007. Exosome-mediated transfer of mRNAs and microRNAs is a novel mechanism of genetic exchange between cells. Nat Cell Biol 9: 654–659. [DOI] [PubMed] [Google Scholar]
- Vickers KC, Palmisano BT, Shoucri BM, Shamburek RD, Remaley AT. 2011. MicroRNAs are transported in plasma and delivered to recipient cells by high-density lipoproteins. Nat Cell Biol 13: 423–433. [DOI] [PMC free article] [PubMed] [Google Scholar]
- Walter P, Blobel G. 1982. Signal recognition particle contains a 7S RNA essential for protein translocation across the endoplasmic reticulum. Nature 299: 691–698. [DOI] [PubMed] [Google Scholar]
- Wang Z, Gerstein M, Snyder M. 2009. RNA-seq: a revolutionary tool for transcriptomics. Nat Rev Genet 10: 57–63. [DOI] [PMC free article] [PubMed] [Google Scholar]
- Wang K, Yuan Y, Cho JH, McClarty S, Baxter D, Galas DJ. 2012. Comparing the microRNA spectrum between serum and plasma. PLoS One 7: e41561. [DOI] [PMC free article] [PubMed] [Google Scholar]
- Werner A. 2013. Biological functions of natural antisense transcripts. BMC Biol 11: 31. [DOI] [PMC free article] [PubMed] [Google Scholar]
- Wilhelm BT, Landry JR. 2009. RNA-seq-quantitative measurement of expression through massively parallel RNA-sequencing. Methods 48: 249–257. [DOI] [PubMed] [Google Scholar]
- Williams Z, Ben-Dov IZ, Elias R, Mihailovic A, Brown M, Rosenwaks Z, Tuschl T. 2013. Comprehensive profiling of circulating microRNA via small RNA sequencing of cDNA libraries reveals biomarker potential and limitations. Proc Natl Acad Sci 110: 4255–4260. [DOI] [PMC free article] [PubMed] [Google Scholar]
- Xue D, Shi H, Smith JD, Chen X, Noe DA, Cedervall T, Yang DD, Eynon E, Brash DE, Kashgarian M, et al. 2003. A lupus-like syndrome develops in mice lacking the Ro 60-kDa protein, a major lupus autoantigen. Proc Natl Acad Sci 100: 7503–7508. [DOI] [PMC free article] [PubMed] [Google Scholar]
- Yamasaki S, Ivanov P, Hu GF, Anderson P. 2009. Angiogenin cleaves tRNA and promotes stress-induced translational repression. J Cell Biol 185: 35–42. [DOI] [PMC free article] [PubMed] [Google Scholar]
- Zernecke A, Bidzhekov K, Noels H, Shagdarsuren E, Gan L, Denecke B, Hristov M, Köppel T, Jahantigh MN, Lutgens E, et al. 2009. Delivery of microRNA-126 by apoptotic bodies induces CXCL12-dependent vascular protection. Sci Signal 2: ra81. [DOI] [PubMed] [Google Scholar]
- Zheng G, Qin Y, Clark WC, Dai Q, Yi C, He C, Lambowitz AM, Pan T. 2015. Efficient and quantitative high-throughput tRNA sequencing. Nat Methods 12: 835–837. [DOI] [PMC free article] [PubMed] [Google Scholar]
Associated Data
This section collects any data citations, data availability statements, or supplementary materials included in this article.