

Abstract
Background
Impaired renal function is common among older patients. Deficiency of vitamin D is a frequent phenomenon among patients with impaired renal function, who are likely to develop cardiovascular diseases. This study aimed to explore the association of 25 (OH) D levels with left ventricular mass and arterial stiffness in older patients with impaired renal function.
Material/Methods
Based on their admission estimate glomerular filtration rate (eGFR), 273 inpatients (≥65 years) were allocated into a normal eGFR group (≥60 ml/min) and an impaired eGFR group (<60 ml/min). The 25 (OH) D levels were measured and the left ventricular mass index (LVMI) was estimated. Pulse wave velocity (PWV) was used to explore arterial stiffness.
Results
The 25 (OH) D levels of patients in the impaired eGFR group were significantly lower than in the normal eGFR group [(11.92±6.01) μg/L vs. (18.14±8.07) μg/L, p<0.05). LVMI and PWV were both significantly higher in the impaired eGFR group than in the normal eGFR group [(104.89±33.50) g/m2 vs. (92.95±18.95) g/m2, P<0.05; (15.99±3.10) m/s vs. (13.62±2.90) m/s, P<0.05]. After adjusting for age, sex, eGFR, cardiovascular risk factors, serum calcium, and iPTH levels, the inverse association between LVMI and 25 (OH) D, PWV, and 25 (OH) D were statistically significant.
Conclusions
Vitamin D level is lower in older patients with impaired renal function. Lower vitamin D levels were correlated with higher left ventricular mass and increased arterial stiffness in older patients.
MeSH Keywords: Hypertrophy, Left Ventricular; Vascular Stiffness; Vitamin D
Background
The proportion of older people in the general population is steadily increasing worldwide [1]. Population-based studies documented that impaired renal function is common in older patients. The 3rd National Health and Nutrition Examination Survey (NHANES) reported that 35% of elderly persons have an estimated glomerular filtration rate (eGFR) of less than 60 ml/min [2]. Impaired renal function is exhibited in older patients. The characteristics of kidney dysfunction include diminished GFR, soft tissue calcification, abnormal bone and mineral metabolism, and endocrine dysfunction. Secondary hyperparathyroidism and vitamin D deficiency might also contribute to the progression of renal disease and cardiovascular disease-related morbidity and mortality [3,4]. Older patients with impaired renal function are at increased risk of renal failure, death, and other adverse events [5,6].
Vitamin D is a fat-soluble vitamin regulating calcium and phosphorus homeostasis in the body. Epidemiological evidence suggests an association between vitamin D status and cardiovascular disease [7,8]. An indicator of overall vitamin D status is serum concentration of 25 (OH) D [9]. The 25 (OH) D was measured to find the relationship between heart and kidney disease, and, in some studies, the crosstalk between the kidney and heart. Low vitamin D level was associated with increased arterial stiffness and left ventricular hypertrophy (LVH) in the general population and in children with chronic kidney disease [10–12].
The objective of this clinical trial was to evaluate the relationship between vitamin D levels and left ventricular mass and arterial stiffness in older patients with impaired renal function.
Material and Methods
Participants
The study was performed at the Department of Geriatrics in the Chao-Yang Hospital (Capital Medical University, Beijing, China). The study adhered to the principles set forth by the Declaration of Helsinki. The study protocol was approved by the Medical Ethics Committee. All patients provided informed consent, verbally and in writing, to participate after they were informed of risks associated with the study. The study recruited patients from September 2012 to May 2015 in the spring and autumn. The inclusion criteria were: patients who were admitted to the hospital, 65 years or older, and agreed to join in this study. Exclusion criteria were: patients with any congenital or structural heart disease, acute kidney injury, severe endocrine diseases such as thyroid disease or parathyroid gland function hyperthyroidism, acute severe infectious diseases, bone marrow tumor, vitamin D supplementation, and long-term use of hormone or immunosuppressive drugs. Baseline characteristics were ascertained by chart review. Venous blood samples were obtained from patients to measure serum 25 (OH) D, intact parathyroid hormone (iPTH), creatinine, calcium, phosphorus, cholesterol, triglycerides, and glycosylated hemoglobin (HbA1C). In order to estimate glomerular filtration rate (eGFR), the chronic kidney disease epidemiology collaboration (CKD-EPI) equation was used [13]. Based on the patients’ eGFR at admission (using 60 ml/min as the limit), patients were allocated into either the impaired renal function group (eGFR <60 ml/min) or the normal renal function group (eGFR ≥60 ml/min).
Echocardiography
Echocardiography (Philips IE33, USA) was used to evaluate cardiac structure and function, using standard institutional protocol in the echocardiography laboratory. By using echocardiography, left ventricular end-diastolic dimension (LVEDD) could be measured, as well as left ventricular end-systolic dimension (LVSDD), inter-ventricular septal thickness at end-diastole (IVSd), posterior wall thickness at end-diastole (PWd), left ventricular ejection fraction (LVEF), early mitral inflow velocity (E), and late mitral inflow velocity (A). Left ventricular mass (LVM) was calculated using the measurements obtained by 2-dimensional directed M-mode echocardiography according to the American Society of Echocardiography criteria. The formula for the calculation of LVM is 0.8{1.04[([LVEDD + IVSd +PWd]3 − LVEDD3)]} + 0.6. Left ventricular mass indexed (LVMI) to body surface area was estimated by LV cavity dimension and wall thickness at end-diastole [14,15].
Pulse wave velocity
Pulse wave velocity is a useful noninvasive measurement to evaluate arterial stiffness [16,17]. After 15 min of rest in the supine position, carotid-femoral pulse wave velocity (PWV) was assessed by the Complior SP device (ALAM MEDICAL, France). The distance from the carotid to femoral artery recording sites was measured by use of a measuring tape, and this length was divided by the time interval between the rapid upstroke in the pulse wave at the carotid and femoral arteries. PWV was calculated automatically. The reference point was a peak R-wave on the electrocardiography.
Statistical analysis
Categorical data are presented as the proportion and chi square analysis was used to compare groups. Continuous data are presented as mean ± standard deviation (SD). Two-sample t test or Mann-Whitney U test was used to compare data between the impaired eGFR group and the normal eGFR group. Correlation was assessed by calculating Pearson’s and Spearman’s correlation coefficients. General linear models were usually used for identifying the differences in age-adjusted means of PWV across 25 (OH) D tertiles. The association between PWV and 25 (OH) D levels, LVMI and 25 (OH) D levels was discovered and tested by multiple linear regression analysis. The variance inflation factor was used to test models adjusted for potential confounding factors based on the relevant literature, including age, sex, eGFR, cardiovascular risk factors (hypertension, diabetes, hypercholesterolemia, and smoking), serum calcium, and iPTH levels. Using the variance inflation factor, we tested multicollinearity among the covariates. On 2-tailed tests, a P value <0.05 was considered statistically significant. We conducted statistical analysis by using SPSS version 19.0 software (SPSS Inc., Chicago, IL, USA).
Results
Patient characteristics and vitamin D levels
A total of 273 eligible older inpatients were included in the study. These patients all accepted baseline assessment and 25 (OH) D measurement. Patients were divided into 2 groups based on their admission eGFR: 152 patients were allocated into the normal eGFR group and 121 patients were allocated into the impaired eGFR group. There were145 patients in the normal eGFR group and 117 patients in the impaired eGFR group who completed the cardiac ultrasound and PWV examination (Figure 1).
Figure 1.
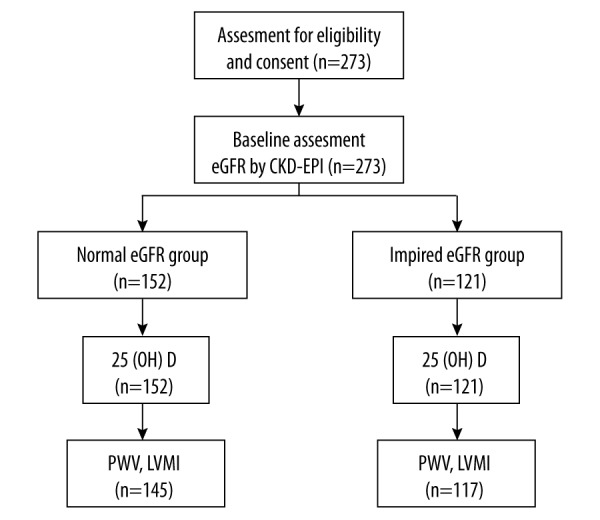
Flow diagram of the study population.
No significant differences were found in the baseline clinical characters between these 2 groups (Table 1). The 25 (OH) D levels between the 2 groups were significantly different. The 25 (OH) D levels of patients in the impaired eGFR group were significantly lower than in the normal eGFR group [(11.92±6.01) μg/L vs. (18.14±8.07) μg/L, P<0.05]. iPTH was also significantly different between these 2 groups. The impaired eGFR group showed significant increases in iPTH levels compared to the normal eGFR group [(66.20±17.07) ng/ml vs. (41.55±10.57) ng/ml, P<0.05]. The levels of serum calcium, phosphorus, calcium-phosphorus product, cholesterol, and triglycerides did not show any large differences between the 2 groups.
Table 1.
Demographic and clinical characteristics for patients.
| Normal eGFR group (n=152) | Impaired eGFR group (n=121) | P | |
|---|---|---|---|
| Age (y) | 80.68±6.87 | 81.86±6.08 | 0.864 |
| Male (%) | 98 (64.47%) | 70 (57.85%) | 0.317 |
| BMI (kg/m2) | 25.88±3.30 | 26.50±4.01 | 0.720 |
| Current smoker, n (%) | 31 (20.39%) | 23 (19.00%) | 0.879 |
| Hypertension, n (%) | 103 (67.76%) | 84 (69.42%) | 0.794 |
| Diabetes, n (%) | 63 (41.45%) | 52 (42.98%) | 0.806 |
| SBP (mmHg) | 132.83±16.68 | 138.38±14.29 | 0.794 |
| DBP (mmHg) | 72.34±11.74 | 74.78±11.39 | 0.189 |
| Total-cholesterol (mmol/L) | 4.05±0.92 | 4.24±1.06 | 0.422 |
| LDL-cholesterol (mmol/L) | 2.13±0.68 | 2.18±0.69 | 0.357 |
| HDL-cholesterol (mmol/L) | 1.19±0.32 | 1.20±0.38 | 0.061 |
| Triglycerides (mmol/L) | 1.27±0.71 | 1.34±0.69 | 0.181 |
| HbA1C (%) | 6.49±1.01 | 6.36±1.11 | 0.290 |
| Creatinine (mmol/L) | 82.24±13.91 | 148.92±91.91 | <0.001 |
| eGFR (ml/min/1.73 m2) | 74.52±12.50 | 42.17±13.67 | <0.001 |
| Serum calcium (mmol/L) | 2.17±0.23 | 2.17±0.13 | 0.198 |
| Serum phosphate (mmol/L) | 1.09±0.17 | 1.14±0.23 | 0.250 |
| Calcium × phosphorus | 2.32±0.44 | 2.41±0.56 | 0.449 |
| Intact PTH (pg/mL) | 41.55±10.57 | 66.20±17.07 | <0.001 |
| 25 (OH) D (μg/L) | 18.14±8.07 | 11.92±6.01 | <0.001 |
Data are shown by mean ± standard deviation for continuous variables and percentages (%) for categorical variables. BMI – body mass index; SBP – systolic blood pressure; DBP – diastolic blood pressure; LDL – low-density lipoprotein; HDL – high-density lipoprotein; HbA1C – glycosylated hemoglobin; eGFR – estimated glomerular filtration rate; PTH – parathyroid hormone.
Comparison by echocardiography
Patients underwent echocardiography according to the established hospital protocol. LVMI was significantly different between the 2 groups (Table 2). The LVMI was higher in the impaired eGFR group (104.89±33.50) g/m2 than in the normal eGFR group (92.95±18.95) g/m2. The LVEF of the impaired eGFR group was lower than in the normal eGFR group; however, the discrepancy was not large [(67.26±9.12)% vs. (69.34±6.86)%, P>0.05].
Table 2.
Results of echocardiolgraphy.
| Normal eGFR group (n=145) | Impaired eGFR group (n=117) | P | |
|---|---|---|---|
| LVEDD (mm) | 45.65±4.16 | 46.38±4.46 | 0.196 |
| LVSDD (mm) | 27.74±4.20 | 28.81±7.08 | 0.082 |
| IVSd (mm) | 10.43±1.29 | 10.97±2.14 | 0.019 |
| PWd (mm) | 9.73±1.31 | 10.40±1.53 | 0.034 |
| LVEF (%) | 69.34±6.86 | 67.26±9.12 | 0.053 |
| E (cm/s) | 75.13±23.96 | 85.66±24.59 | 0.347 |
| A (cm/s) | 99.10±24.14 | 105.22±24.44 | 0.635 |
| E/A ratio | 0.78±0.32 | 0.82±0.33 | 0.781 |
| LV mass (g) | 162.46±34.88 | 180.39±57.11 | 0.004 |
| LVMI (g/m2) | 92.95±18.95 | 104.89±33.50 | 0.006 |
Data are shown by mean ± standard deviation for continuous variables and percentages (%) for categorical variables. LVEDD – left ventricular end-diastolic dimension; LVSDD – left ventricular end-systolic dimension; IVSd – interventricular septal thickness at end-diastole; PWd – posterior wall thickness at end-diastole; LVEF – left ventricular ejection fraction; E – early mitral inflow velocity; A – late mitral inflow velocity; LV mass – left ventricular mass; LVMI – left ventricular mass index.
In the multivariate linear regression analysis, there was an intense inverse association between the 25 (OH) levels and LVMI (β=−0.880, P=0.004), and an inverse association between eGFR and LVMI (β=−0.386, P<0.01). Multiple regression analysis showed that low 25 (OH) D levels and eGFR were independent predictors of increased LVMI in older patients.
Relationship between vitamin D levels and LVMI
To verify whether the relationship between the 25 (OH) D levels and LVMI, and to see if it makes an contribution to confounding variables, age and sex were added as covariates to adjust linear model relating 25 (OH) D and LVMI (Table 3, model 1). The bond between the 25 (OH) D levels and LVMI remained quite remarkable after adjustment for age and sex. The association between 25 (OH) D levels and LVMI decreased slightly yet remained statistically significant after eGFR was added to the model (Table 3, model 2). In addition, this link remained important after the coordination of cardiovascular risk factors, hypertension, diabetes, hypercholesterolemia, and smoking (Table 3, model 3). Eventually, the association between 25 (OH) D levels and LVMI remained remarkable for adjusted calcium and iPTH levels (Table 3, model 4).
Table 3.
Examining the relationship between 25 (OH) D and LVMI.
| Model 1 | Model 2 | Model 3 | Model 4 | |
|---|---|---|---|---|
| β | −0.880 | −0.649 | −0.880 | −0.921 |
| P value | 0.004 | 0.032 | 0.004 | 0.007 |
Model 1 – age and gender were adjusted linear model relating 25 (OH) D and LVMI; Model 2 – eGFR was adjusted; Model 3 – cardiovascular risk factors were adjusted, smoking, hypercholesterolemia, hypertension and diabetes; Model 4 – calcium and iPTH levels were adjusted.
Comparison by pulse wave velocity
Carotid-femoral PWV was measured between the normal eGFR group and the impaired eGFR group. PWV was higher in patients with impaired eGFR than in those with normal eGFR [(15.99±3.10) m/s vs. (13.62±2.90) m/s, P<0.05].
We found a significant negative association of eGFR and 25 (OH) D levels with PWV (β=−0.076, P<0.01; β=−0.309, P=0.047), and a significant positive association of age with PWV (β=0.576, P<0.01) through the multivariate linear regression analysis.
Relationship between vitamin D levels and PWV
Multivariable analysis adjusting for key confounders was conducted. In order to verify and dig out the bond between the 25 (OH) D levels and PWV, knowing that this bond does not contribute to the key confounders, age and sex that were added as covariates to adjust the linear model relating 25 (OH) D and PWV (Table 4, model 1). This association between the 25 (OH) D levels and PWV was reduced, but still remained statistically significant after an adjustment for age and sex. The association between 25 (OH) D levels and PWV was also reduced but remained statistically significant after eGFR was added to the model (Table 4, model 2). This association remained significant after changing cardiovascular risk factors for adjustment, which included hypertension, diabetes, hypercholesterolemia, and smoking (Table 4, model 3). The association of 25 (OH) D levels with PWV was reduced yet remained significant after calcium and iPTH levels were adjusted (Table 4, model 4).
Table 4.
Examining the relationship between 25 (OH) D and PWV.
| Model 1 | Model 2 | Model 3 | Model 4 | |
|---|---|---|---|---|
| β | −0.091 | −0.076 | −0.098 | −0.094 |
| P value | 0.014 | 0.042 | 0.00 | 0.034 |
Model 1 – age and gender were added as covariates to adjust linear model relating 25 (OH) D and PWV; Model 2 – eGFR was adjusted; Model 3 – cardiovascular risk factors were adjusted, smoking, hypercholesterolemia, hypertension and diabetes; Model 4 – calcium and iPTH levels.
Discussion
In this study we evaluated the relationship of vitamin D with LVMI and arterial stiffness in older patients. Higher LVMI and PWV were observed in the impaired renal function group compared to the normal renal function group. The 25 (OH) D levels were also negatively associated with LVMI after adjusting for the main potential confounders. The inverse association between the 25 (OH) D levels and PWV was still significant after adjusting for key confounders.
In the general population, a strong association between vitamin D deficiency and cardiovascular disease has been found [18]. Lack of vitamin D influences the cardiovascular system, causing atherosclerosis, enabling vascular inflammation, endothelial dysfunction, formation of foam cells, and proliferation of smooth muscle cells, vascular calcification, fibrosis, and cardiac hypertrophy [19]. It also leads to myocardial and arterial thickening and left ventricular hypertrophy [20,21]. A prospective cross-sectional study including 3258 patients followed up for a mean of 7.7 years indicated that low concentration of 25 (OH) D was significantly correlated with all-cause mortality and cardiovascular mortality. An increased risk for all-cause mortality (HR=2.08, 95%CI 1.60–2.70) in patients with vitamin D deficiency was also observed compared to those without vitamin D deficiency [22]. Prior studies have found a relationship between vitamin D deficiency and left ventricular hypertrophy, especially in patients with chronic kidney disease. Lack of vitamin D was also related with left ventricular mass increasing in children with chronic kidney disease [10], possibly due to vitamin D receptor activation and vitamin D-mediated regulation of the RAAS [23].
In older patients, the pathophysiological states of combined kidney and heart dysfunction are common. The aging process results in remarkable changes in the kidney, both anatomical and functional. Older patients often have varying degrees of impaired renal function [24]. Vitamin D deficiency is common in patients with impaired renal function, and may also contribute to disease progression [25]. In the current report, 273 older patients (≥65 years) were divided into 2 groups based on their admission eGFR. The 25 (OH) D levels were lower in patients with impaired renal function (eGFR < 60 ml/min) than in those with normal renal function (eGFR ≥60 ml/min). Some older patients with cardiovascular disease also suffered from renal disease, and other patients with impaired renal function might have heart disease. Several animal studies have shown a possible link between vitamin D levels and kidney-heart function. Martin et al. found that rats with mild renal insufficiency had impaired diastolic function and early cardiac fibrosis, which progressed to a more global left ventricular remodeling and dysfunction [26]. The mechanisms leading to the states of combined kidney and heart dysfunction are multifactorial. Increased activity of the renin-angiotensin and sympathetic nervous systems, oxidative stress, and inflammation are typically associated with both kidney and heart dysfunction [27], possibly linked to vitamin D levels. Vitamin D has been reported to regulate vascular smooth muscle, the renin-angiotensin system, cardiac cell function, inflammatory and fibrotic pathways, endothelium, and immune response [11]. Lack of vitamin D may result in artery and myocardium thickening and left ventricular hypertrophy.
The major limitation of this study is that we cannot make a firm conclusion about a cause and effect relationship of vitamin D with left ventricular mass and arterial stiffness. Another limitation is that we used a small inpatient sample at a single hospital, making it difficult to divide the subjects into sub-groups. Also, the statistical power of the study might have been influenced. Further clinical trials are needed to expand the sample size and confirm these findings.
Conclusions
Vitamin D was found at lower levels in older patients with impaired renal function compared to those with normal renal function. Vitamin D deficiency was also found to be associated with increased left ventricular mass and arterial stiffness in older patients with impaired renal function.
Acknowledgements
The authors are grateful to all study participants. We also thank the nurses who performed blood withdrawal.
Footnotes
Declaration of interest
The authors report no conflicts of interest.
Source of support: The study was supported by the Beijing Health Science Foundation (No. 2013-13) and the Youth Research Foundation of Beijing Chao-Yang Hospital (No.2010-CJ)
References
- 1.World Health Organization. Good health adds life to years: Global brief for World Health Day 2012. [serial online] 2012 April; 1: [28 screens] 2012. Available from: URL: http://www.who.int/ageing/publications/whd2012_global_brief/en/
- 2.Coresh J, Astor BC, Greene T, et al. Prevalence of chronic kidney disease and decreased kidney function in the adult US population: Third National Health and Nutrition Examination Survey. Am J Kidney Dis. 2003;41:1–12. doi: 10.1053/ajkd.2003.50007. [DOI] [PubMed] [Google Scholar]
- 3.Izumaru K, Ninomiya T, Nagata M, et al. Serum 1,25-dihydroxyvitamin d and the development of kidney dysfunction in a Japanese community. Circ J. 2014;78:732–37. doi: 10.1253/circj.cj-13-0422. [DOI] [PubMed] [Google Scholar]
- 4.Samefors M, Östgren CJ, Mölstad S, et al. Vitamin D deficiency in elderly people in Swedish nursing homes is associated with increased mortality. Eur J Endocrinol. 2014;170:667–75. doi: 10.1530/EJE-13-0855. [DOI] [PubMed] [Google Scholar]
- 5.Hemmelgarn BR, Manns BJ, Lloyd A, et al. Relation between kidney function, proteinuria, and adverse outcomes. JAMA. 2010;303:423–29. doi: 10.1001/jama.2010.39. [DOI] [PubMed] [Google Scholar]
- 6.O’Hare AM, Bertenthal D, Covinsky KE, et al. Mortality risk stratification in chronic kidney disease: one size for all ages? J Am Soc Nephrol. 2006;17:846–53. doi: 10.1681/ASN.2005090986. [DOI] [PubMed] [Google Scholar]
- 7.Giovannucci E, Liu Y, Hollis BW, et al. 25-hydroxyvitamin D and risk of myocardial infarction in men: a prospective study. Arch Intern Med. 2008;168:1174–80. doi: 10.1001/archinte.168.11.1174. [DOI] [PMC free article] [PubMed] [Google Scholar]
- 8.Wang TJ, Pencina MJ, Booth SL, et al. Vitamin D deficiency and risk of cardiovascular disease. Circulation. 2008;117:503–11. doi: 10.1161/CIRCULATIONAHA.107.706127. [DOI] [PMC free article] [PubMed] [Google Scholar]
- 9.Rosen CJ. Clinical practice Vitamin D insufficiency. N Engl J Med. 2011;364:248–54. doi: 10.1056/NEJMcp1009570. [DOI] [PubMed] [Google Scholar]
- 10.Patange AR, Valentini RP, Gothe MP, et al. Vitamin D deficiency is associated with increased left ventricular mass and diastolic dysfunction in children with chronic kidney disease. Pediatr Cardiol. 2013;34:536–42. doi: 10.1007/s00246-012-0489-z. [DOI] [PubMed] [Google Scholar]
- 11.Mario C, Markus K, Daniel Z. The vitamin D system: A crosstalk between the heart and kidney. Eur J Heart Fail. 2010;12:1031–41. doi: 10.1093/eurjhf/hfq112. [DOI] [PubMed] [Google Scholar]
- 12.Sokol SI, Tsang P, Aggarwal V, et al. Vitamin D status and risk of cardiovascular events: lessons learned via systematic review and meta-analysis. Cardiol Rev. 2011;19:192–201. doi: 10.1097/CRD.0b013e31821da9a5. [DOI] [PubMed] [Google Scholar]
- 13.White SL, Polkinghorne KR, Atkins RC, et al. Comparison of the prevalence and mortality risk of CKD in Australia using the CKD Epidemiology Collaboration (CKD-EPI) and Modification of Diet in Renal Disease (MDRD) Study GFR estimating equations: the AusDiab (Australian Diabetes, Obesity and Lifestyle) Study. Am J Kidney Dis. 2010;55:660–70. doi: 10.1053/j.ajkd.2009.12.011. [DOI] [PubMed] [Google Scholar]
- 14.Lang RM, Bierig M, Devereux RB, et al. Recommendations for chamber quantification. J Am Soc Echocardiogr. 2005;18:1454–57. doi: 10.1016/j.echo.2005.10.005. [DOI] [PubMed] [Google Scholar]
- 15.Devereux RB, Alonso DR, Lutas EM, et al. Echocardiographic assessment of left ventricular hypertrophy: comparison to necropsy findings. Am J Cardiol. 1986;57:450–58. doi: 10.1016/0002-9149(86)90771-x. [DOI] [PubMed] [Google Scholar]
- 16.Yapei Y, Xiaoyan R, Sha Z, et al. Clinical significance of arterial stiffness and thickness biomarkers in type 2 diabetes mellitus: an up-to-date meta-analysis. Med Sci Monit. 2015;21:2467–75. doi: 10.12659/MSM.894693. [DOI] [PMC free article] [PubMed] [Google Scholar]
- 17.Avci A, Demir K, Kaya Z, et al. Arterial stiffness and carotid intima-media thickness in diabetic peripheral neuropathy. Med Sci Monit. 2014;20:2074–81. doi: 10.12659/MSM.892648. [DOI] [PMC free article] [PubMed] [Google Scholar]
- 18.Fallo F, Catena C, Camozzi V, et al. Low serum 25-hydroxyvitamin D levels are associated with left ventricular hypertrophy in essential hypertension. Nutr Metab Cardiovas. 2012;22:871–76. doi: 10.1016/j.numecd.2011.06.001. [DOI] [PubMed] [Google Scholar]
- 19.Mozos I, Marginean O. Links between vitamin D deficiency and cardiovascular diseases. Biomed Res Int. 2015;2015:109275. doi: 10.1155/2015/109275. [DOI] [PMC free article] [PubMed] [Google Scholar]
- 20.Lai S, Coppola B, Dimko M, et al. Vitamin D deficiency, insulin resistance, and ventricular hypertrophy in the early stages of chronic kidney disease. Ren Fail. 2014;36:58–64. doi: 10.3109/0886022X.2013.832308. [DOI] [PubMed] [Google Scholar]
- 21.Assalin HB, Rafacho BP, dos Santos PP, et al. Impact of the length of vitamin D deficiency on cardiac remodeling. Circ Heart Fail. 2013;6:809–16. doi: 10.1161/CIRCHEARTFAILURE.112.000298. [DOI] [PubMed] [Google Scholar]
- 22.Dobnig H, Pilz S, Scharnagl H, et al. Independent association of low serum 25-hydroxyvitamin d and 1,25-dihydroxyvitamin d levels with all-cause and cardiovascular mortality. Arch Intern Med. 2008;168:1340–49. doi: 10.1001/archinte.168.12.1340. [DOI] [PubMed] [Google Scholar]
- 23.Li YC. Vitamin D regulation of the renin-angiotensin system. J Cell Biochem. 2003;88:327–31. doi: 10.1002/jcb.10343. [DOI] [PubMed] [Google Scholar]
- 24.Esposito C, Dal Canton A. Functional changes in the aging kidney. J Nephrol. 2010;23:S41–45. [PubMed] [Google Scholar]
- 25.Satirapoj B, Limwannata P, Chaiprasert A, et al. Vitamin D insufficiency and deficiency with stages of chronic kidney disease in an Asian population. BMC Nephrol. 2013;14:206. doi: 10.1186/1471-2369-14-206. [DOI] [PMC free article] [PubMed] [Google Scholar]
- 26.Martin FL, McKie PM, Cataliotti A, et al. Experimental mild renal insufficiency mediates early cardia apoptosis, fibrosis, and diastolic dysfunction: a kidney-heart connection. Am J Physiol Regul Integr Comp Physiol. 2012;15:292–99. doi: 10.1152/ajpregu.00194.2011. [DOI] [PMC free article] [PubMed] [Google Scholar]
- 27.Mühlberger I, Mönks K, Fechete R, et al. Molecular pathways and crosstalk characterizing the cardiorenal syndrome. OMICS. 2012;16:105–12. doi: 10.1089/omi.2011.0121. [DOI] [PubMed] [Google Scholar]