

Summary
Age is the strongest risk factor for many diseases including neurodegenerative disorders, coronary heart disease, type 2 diabetes and cancer. Due to increasing life expectancy and low birth rates, the incidence of age‐related diseases is increasing in industrialized countries. Therefore, understanding the relationship between diseases and aging and facilitating healthy aging are major goals in medical research. In the last decades, the dimension of biological data has drastically increased with high‐throughput technologies now measuring thousands of (epi) genetic, expression and metabolic variables. The most common and so far successful approach to the analysis of these data is the so‐called reductionist approach. It consists of separately testing each variable for association with the phenotype of interest such as age or age‐related disease. However, a large portion of the observed phenotypic variance remains unexplained and a comprehensive understanding of most complex phenotypes is lacking. Systems biology aims to integrate data from different experiments to gain an understanding of the system as a whole rather than focusing on individual factors. It thus allows deeper insights into the mechanisms of complex traits, which are caused by the joint influence of several, interacting changes in the biological system. In this review, we look at the current progress of applying omics technologies to identify biomarkers of aging. We then survey existing systems biology approaches that allow for an integration of different types of data and highlight the need for further developments in this area to improve epidemiologic investigations.
Keywords: data integration, graphical models, high‐throughput data, omics, systems biology
Introduction
Aging is often described as the progressive accumulation of changes with time leading to a loss of physiological aptitude and fertility, an increased susceptibility to disease and ultimately to death (Harman, 1988, 2001; Kirkwood & Austad, 2000; Vijg & Suh, 2005; López‐Otín et al., 2013). Despite considerable effort and the development of many theories, the underlying process is still largely unknown (Kirkwood & Austad, 2000; Weinert & Timiras, 2003; Rattan, 2006).
Researchers distinguish between chronological and biological age. Chronological age is defined as the absolute time that an individual lives. In contrast, biological age is a broader concept that takes the individual physical and mental health into account, thus capturing individual differences of the aging process. Most aging studies search for associations of chronological age with clinical and molecular phenotypes (Warming et al., 2002). However, several studies used phenotypes, such as lung function, grip strength or bone mineral density, as proxies to investigate molecular changes in biological aging (Jackson et al., 2003; Bell et al., 2012; Levine, 2013). Researchers also investigated reasons of retarded biological aging and longevity by comparing centenarians with younger controls (Biagi et al., 2012; Sebastiani et al., 2012).
The life expectancy in the UK increased by 5.3 years for men and 4.7 for women over the last two decades and is predicted to further increase in the next twenty years (Oeppen & Vaupel, 2002; Office for National Statistics 2014). With increasing life expectancy, age‐related diseases are expected to rise dramatically (700 000 people suffered from dementia in 2000, 800 000 in 2012 and approximately 1 million people will be affected by dementia in 2021 (Alzheimer's Society 2014)) with major impacts on healthcare costs. Thus, a better understanding of aging and its influence on disease is a long term public health goal and a hot topic of current medical research.
Omics technologies provide valuable tools to study aging on the molecular level. Reductionist data analyses, testing the measured variables separately for association with age, have been extensively applied. Such studies successfully identified hundreds of epigenetic mutations, gene expression levels, metabolite concentrations to be linked with chronological and/or biological age (see below for details). Even though these results improved our understanding of aging as a complex phenotype, the mechanisms underlying these associations and the impact of interactions between different biological entities remain elusive in most cases. In contrast to reductionist approaches, systems biology aims to analyse all components of a biological process simultaneously taking into account their interactions and their intrinsic hierarchical structure (Ideker et al., 2001; Barabási & Oltvai, 2004). With more and more high‐throughput data becoming available, systems biology has led to many new methods and their successful application on age and age‐related phenotypes (as outlined below).
In this review, we will briefly summarize the current progress in ‘omics’ technologies and their application in aging research. We will then highlight some problems of the reductionist approach and discuss how these may be overcome using systems biology. We present a selection of statistical methods used in systems biology along with their current and possible future applications in the field of aging research to move from biomarkers of aging to a more holistic understanding of the aging process.
Omics and aging
New technologies allow the measurement of ‘omics’ data and numerous association studies have been conducted. Valdes et al. (2013) thoroughly reviewed the application of these technologies to identify molecular markers of aging from each omics level. Therefore, the following section will only briefly highlight some key results and concentrate on recent findings.
Genomics
Genomics was the first omics field for which high‐throughput measurements became available. Current chips are able to measure up to 5 million single nucleotide polymorphisms (SNPs) (Ha et al., 2014). Today, next‐generation sequencing technology is slowly replacing the chip technology as the cost of sequencing has dropped below $0.10 per million bp (Liu et al., 2012). Thus, gene variation is nowadays often available at single nucleotide resolution.
While aging (or rather longevity) itself was found to be only about 20% heritable (Murabito et al., 2012), many age‐related diseases are highly heritable. For instance, Alzheimer's disease (AD) shows a heritability above 70% (Gatz et al., 2006) and osteoarthritis (Ishimori et al., 2010) or cataract show 50% heritability (Hammond et al., 2001).
The GenAge database contains about 300 human candidate genes for aging based on homology with model organisms (Tacutu et al., 2013). Sebastiani et al. (2012) recently published a refined model consisting of 281 SNPs to distinguish between centenarians and younger controls in a cohort of 1715 people. One of these SNPs is located in ApoE, which is so far the only gene that has been reliably associated with longevity at genomewide significance level (Deelen et al., 2011; Nebel et al., 2011). Common genetic variants at this locus have been associated with accelerated aging and cognitive decline (Johnson, 2006; Davies et al., 2014), possibly by increasing the risk for coronary artery disease, stroke and AD (Smith, 2002). Even though some studies provided evidence that mutations of FOXO transcription factors are related to longevity (Willcox et al., 2008; Flachsbart et al., 2009), as well, GWASs failed to replicate this at the level of genomewide significance.
Epigenomics
Epigenomics describes the study of heritable changes in the genome that are not caused by DNA sequence mutations (Lodish, 2013). The most common epigenetic mechanism is DNA methylation, which is known to often silence gene expression. In contrast to the genome, which is the same in all cells, the epigenome is an important factor of cell differentiation leading to profound epigenetic differences across different cell types (Meissner, 2010). The current methylation chip by Illumina measures over 485 000 methylation sites and covers 99% of all RefSeq genes (Illumnia 2011). However, it covers less than 10% of variable regions (Ziller et al., 2013).
The epigenome is influenced by environmental and lifestyle factors (Nakajima et al., 2010; Alegría‐Torres et al., 2011; Breitling et al., 2011) and is associated with many complex diseases such as neurodegenerative disorders (reviewed by Portela & Esteller, 2010) and cancer (Ehrlich, 2002; Horvath, 2013). Nearly 500 differentially methylated regions were found to be associated with chronological age and age‐related phenotypes such as lung function, cholesterol levels and maternal longevity (Bell et al., 2012). A recent study by Weidner et al. (2014) showed that methylation patterns of just three sites are sufficient to predict chronological age. Thus, many of the previously identified methylation sites might not be independently associated with age. Interestingly, variation in methylation with age is consistent across several tissues and cell types (Horvath, 2013). Together, they form a global pattern of hypomethylation in repetitive sequences, hypermethylation in promoter regions and higher intercell variability (Cevenini et al., 2008; Bacalini et al., 2014). Besides DNA methylation, other epigenetic changes, such as histone methylation and acetylation, have been found to be associated with longevity in model organisms (Dang et al., 2009; Greer et al., 2010). Investigating these modifications in humans could shed light on so far unknown mechanisms of aging.
Transcriptomics
Genes are transcribed into RNA molecules, which are further processed in a tightly controlled process. The entirety of the RNA transcripts is referred to as transcriptome. It can be divided in coding RNAs, which are further translated in proteins, and noncoding RNAs, which perform various functions, such as regulation of gene expression (Eddy, 2001). Transcript abundances can be measured by either chips or sequencing methods.
Similar to the epigenome, gene expression was shown to dramatically change with age. A pioneer study comparing postmortem human frontal cortex tissue samples between 30 individuals of different ages yielded 463 differentially expressed genes (Lu et al., 2004). Despite the small sample size, results were replicated in subsequent experiments. Four years later, Berchtold et al. (2008) identified several thousand age‐related changes in gene expression in four different brain tissues. Later studies by different groups identified profound changes in the transcriptome with age in further tissues, such as skin, adipose tissue (N = 865) (Glass et al., 2013) and kidney (N = 134) (Rodwell et al., 2004). Most of these changes did not overlap in different tissues. A meta‐analysis across different species and tissues revealed only 73 genes consistently associated with age (de Magalhães et al., 2009). This suggests that most observed age‐related changes in the transcriptome are either species and tissue specific or false‐positive discoveries (reviewed by Valdes et al., 2013). In their meta‐analysis, genes related to immune response and lysosome tended to be overexpressed, while genes related to mitochondria and oxidative phosphorylation were underexpressed in elderly (de Magalhães et al., 2009).
Proteomics
Proteins are translated from coding transcripts. Due to alternative splicing and post‐translational protein modifications, the number of proteins is estimated to be two orders of magnitudes higher than the number of genes (Ginsburg & Haga, 2006). However, current proteomic techniques based on immunoassays, protein arrays or mass spectrometry can measure only a small fraction of the proteome (up to 1000 proteins in a sample). The most comprehensive description of the human proteome across various tissues to date consists of 18 097 proteins (19 376 isoforms) collected from ten thousand mass spectrometry experiments (Wilhelm et al., 2014).
Due to these technicalities, ‘proteomics’ studies in aging research so far focused on smaller sets of proteins and small sample sizes. In an early study of protein abundance in the vastus lateralis muscle, Gelfi et al. (2006) observed higher abundance of several proteins involved in aerobic metabolism and a lower abundance of proteins involved in anaerobic metabolism in the elderly. Besides this, six transport proteins were consistently underexpressed in older individuals. However, only 12 samples were analysed in this study without replication. A recent study by our group analysed over 1000 proteins in 200 plasma samples using the SOMAscan assay (Menni et al., 2015). Eleven proteins were found to strongly associate with chronological age as well as age‐related phenotypes such as lung function and blood pressure. The results were replicated in an independent cohort.
Even though comprehensive proteomics studies are still missing, proteins are likely to be associated with several age‐related diseases. For instance, cardiovascular disease (Mehra et al., 2005) and AD (Swardfager et al., 2010) are consistently associated with elevated levels of pro‐inflammatory cytokines.
Post‐translational modifications – glycomics
Post‐translational modifications are important elements of proteins, which can alter their biochemical properties such as protein structure, binding preferences and enzyme activity. There are many different modifications ranging from addition of small molecules (e.g. acetylation or phosphorylation), over addition of larger molecules such as lipids or sugar chains (e.g. palmitoylation, glycosylation), to the addition of whole proteins (e.g. ubiquitination).
The most common modification is glycosylation, which attaches sugar chains to proteins. The attached oligosaccharides – glycans – are supposed to mainly serve as structural elements of proteins or specific binding sites for other glycans or proteins (Varki et al., 2009). However, glycans are highly diverse and many of them are not yet characterized or annotated. Thus, glycans might have many additional functions. For example, glycans in the gut act as food for microbes (Koropatkin et al., 2012), which could be implicated in immune functions that are important in aging. Recent development allows the high‐throughput measurement of glycans of either a single protein or all proteins simultaneously (Royle et al., 2008; Pucić et al., 2011).
The application of this technology on epidemiological cohorts revealed that glycan structures are stable for one individual over time (Gornik et al., 2009) but very diverse within a population (Knezević et al., 2009; Pucić et al., 2011). Differences in glycomes were found to be related with various cancers (Fuster & Esko, 2005; Adamczyk et al., 2012). Recently, Kristic et al. (2013) showed that IgG glycans are strongly associated with age: a linear combination of three glycans explained 58% of the observed variance of chronological age (Kristic et al., 2013) in a study of four independent populations with 5117 participants in total.
Metabolomics
Metabolomics investigates the low‐molecular‐weight molecules in a biological system. The measured molecules are often referred to as metabolites as many of them act as educts, products and intermediates of the cellular metabolism. Currently, the Human Metabolome Database (Wishart et al., 2013) contains more than 40 000 distinct metabolites from different tissues. Similar to proteomics, to date, there is no analytical method available to determine and quantify all metabolites in a single experiment. Current platforms, using either chromatography coupled with mass spectrometry or nuclear magnetic resonance, can measure roughly a thousand metabolites in untargeted settings and a smaller number using predefined targeted approaches. The restriction of the targeted approach comes with the advantages of higher sensitivity, absolute instead of relative quantification and straight‐forward compound identification (Patti et al., 2012; Tzoulaki et al., 2014).
In 2008, the first metabolome‐wide association study on age analysed the plasma metabolome of 269 individuals using an untargeted approach. The authors found 100 of 300 compounds to correlate with chronological age (Lawton et al., 2008). More recently, larger cohorts were employed to study the association of metabolites and age using both targeted and untargeted metabolomics platforms. Yu et al. (2012) analysed 131 targeted metabolites in 2162 individuals from the KORA study, while we analysed 280 untargeted metabolites in 6055 twins from the TwinsUK cohort (Menni et al., 2013b). Both studies identified half of the analysed metabolites to be associated with chronological age. Many of the those metabolites were also found to significantly correlate with age‐related phenotypes such as lung function, bone mineral density and cholesterol levels (Menni et al., 2013b), AD (N = 93) (Orešič et al., 2011), cancer (reviewed by Teicher et al., 2012) and type 2 diabetes (N = 100) (Suhre et al., 2010; Menni et al., 2013a). One of those metabolites is C‐glycosyltryptophan, a potential degradation product of glycosylated proteins.
Microbiomics
The human microbiome describes the complete set of microbial species (and their genomes) hosted by the human body. The largest microbial community resides in the gut, where microbial cells and their genes outnumber human cells (10:1) and genes (100:1) (Peterson et al., 2009; Zhu et al., 2010; The Human Microbiome Project 2014a). More than 10 000 different species with millions of protein‐coding genes were identified by the Human Microbiome Project (Turnbaugh et al., 2007; Peterson et al., 2009; Biagi et al., 2012) and >1000 of these microbes have so far been fully sequenced (The Human Microbiome Project 2014b). Although twin studies have found a modest genetic influence on some phyla, most of the variation is environmental (Goodrich et al., 2014).
The composition of the microbe flora varies a lot across individuals (Turnbaugh et al., 2007; Zhu et al., 2010) and even between different parts of the body (Kong, 2011). It has a huge influence on many biological processes such as immune response, metabolism and disease (Zhu et al., 2010; Grice & Segre, 2012). While the microbiome seems to be relatively stable during adulthood, it changes significantly in later life (Guigoz et al., 2008; Biagi et al., 2010; Claesson et al., 2011). Biagi et al. (2010) observed drastic changes in the gut microbiome of centenarians compared with young adults as well as elderly, namely a general loss of diversity and increased abundance of bacilli and proteobacteria. The latter were reported to promote inflammation under certain conditions (Round & Mazmanian, 2009). Similar findings were revealed in other elderly populations, which also considered the dietary and residential situation of elderly patients (Claesson et al., 2012).
Phenomics
Simultaneously with omics data, the dimension of clinical and lifestyle traits, particularly clinically used intermediate traits, keeps increasing. Epidemiological studies collected thousands of clinically relevant phenotypes beyond omics data types. These range from anthropometric measures to health and lifestyle questionnaires (Moayyeri et al., 2013). Collecting high‐dimensional clinical data is important to unveil pleiotropy of genes and interactions amongst clinical phenotypes such as comorbidities (Houle et al., 2010). Driven by omics technologies, statistical and bioinformatic methods to analyse high‐dimensional data are becoming available. These facilitate the investigation of numerous clinical phenotypes in parallel, thus defining the new field of phenomics (Houle et al., 2010).
Phenomics is especially important for aging research. Dozens of clinical phenotypes, such as Parkinson's (Reeve et al., 2014), AD (McAuley et al., 2009), body mass index, blood pressure (Mungreiphy et al., 2011) and bone mineral density (Warming et al., 2002), as well as lifestyle parameters, such as nutrition (Wieser et al., 2011), smoking and physical activity, are strongly related to age (Harman, 1988; Wang et al., 2009). Composite measures such as the Rockwood frailty index (Rockwood & Mitnitski, 2007) combine several of those clinical traits to form a more homogenous phenotype – frailty – from its diverse appearance. Such frailty measures can be considered as measures for biological age (Mitnitski et al., 2013). Many of these (and other) clinical phenotypes correlate or even depend on each other (McAuley et al., 2009; Baylis et al., 2014). Only extensive collection of data and their joint analysis will help to unveil these dependencies and find causal relationships.
From omics to systems biology
Most of the studies summarized above concentrated on the bivariate associations of age (or age‐related diseases) with one type of omics data. However, there are strong interdependencies within and between the different omics data (see Fig. 1).
Figure 1.
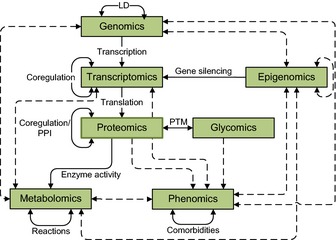
Interdependencies of omics data: The figure illustrates dependencies which can be observed within almost any omics data set. Solid lines indicate biological processes which cause dependencies, while dashed lines represent observed associations.
Correlations can be observed practically between all levels of biological organization. Following the central dogma of molecular biology, genomics, transcriptomics and proteomics are correlated ‘by definition’. Furthermore, metabolite concentrations are influenced by genetic variants (Shin et al., 2014) and epigenetic factors (Petersen et al., 2014) mediated through changes in gene expression or enzyme activity. Methylation levels do not only influence the gene expression (Jaenisch & Bird, 2003), but are also correlated with gene variants (Bell et al., 2012) and environmental factors (Breitling et al., 2011). Our group has recently demonstrated that even the microbe composition is partly under host genetic influence (Goodrich et al., 2014). Similarly, all levels of omics data are influenced by genetics as well as by environment and aging. Correlations, however, do not only occur between but also within each type of data. For instance, in genomics linkage disequilibrium, the correlated occurrence of SNPs is a ubiquitous phenomenon. Transcription factors often coregulate the expression of multiple genes (Allocco et al., 2004), and methylation patterns of neighbouring CpG sites were reported to be correlated (Bell et al., 2012). Metabolites are linked by a network of biochemical reactions, causing strong correlations between them (Krumsiek et al., 2011). Even phenotypes often cluster. Comorbidities, the over proportional co‐occurrence of diseases, were shown to affect many diseases possibly through shared underlying mechanisms (Goh et al., 2007).
These biological correlations can confound the associations and this is a major issue of current research. For instance, 153 metabolites were found by our group to be associated with age, but subsequent analyses showed that only 22 of them are associated with age independently (Menni et al., 2013b). Similarly, 21 of 24 measured IgG glycans were correlated with age, but only 3 of them explain 58% of the variance (Kristic et al., 2013). The same was found for epigenetic data (Weidner et al., 2014). Huge lists of associations with aging are being unveiled using all kinds of data, but the biologically interesting, causal associations are often obscured by this wealth of results. Approaches taking simultaneously information from all omics levels into account are needed to reconstruct the processes involved in aging on a systems level (Valdes et al., 2013).
Even though high‐throughput technologies are advancing and more and more data are becoming available, integration of omics remains a challenging problem. Besides the restricted availability of multi‐omics data sets for the same samples, technical limitations hamper the integration process. While genomics and transcriptomics are able to measure the entire set of variants, other omics (e.g. proteomics and metabolomics) measure only a small fraction of all entities. Many high‐throughput technologies suffer from considerable technical variation and strong batch effects. Stringent quality control and thorough data normalization are crucial when analysing this type of data. Furthermore, the complexity of the organism has to be taken into account. While the genome is more or less stable, all other levels of omics change between cell types and over time. Many samples, such as whole blood, contain a mixture of different cell types with potentially different epigenomes, transcriptomes (Houseman et al., 2012; Jaffe & Irizarry, 2014). Finally, different organs and cells influence each other. The blood metabolome, for instance, is heavily influenced by processes occurring in the liver or in other organs, and multitissue samples are needed to fully understand these. This in turn is not always feasible in an epidemiological setting as collection of tissues often involves invasive procedures. Nevertheless, data integration is an important and active field of research. A first step of data integration is the integration and joint interpretation of separate results. The Digital Ageing Atlas (Craig et al., 2014) summarizes more than 4000 age‐related changes across different technologies to facilitate systems‐level analyses of aging.
Introduction to systems biology
The aim of systems biology is to understand the system and its functions as a whole rather than as separate components (Cassman, 2005), with the final objective to mathematically model biological systems and simulate their outcomes. As a first step, the complex interactions and dependencies between these components must be formally described to enable systematic analysis and simulation of the biological system of interest. A technique widely used in systems biology is to translate biological interactions into mathematically well‐defined networks (graphs). For instance, metabolites interact in chemical reactions, thus forming a network in which nodes describe the metabolic compounds and edges indicate chemical reactions. Similarly, transcription factors bind DNA to control gene expression, forming the gene regulatory network (GRN) and interacting proteins build a protein–protein interaction network (PPI) (cf. Fig. 2B). These networks interact, making data integration an important aspect of systems biology. One example for a phenotypic network was created by Goh et al. (2007) using diseases as nodes and connecting diseases with shared genetic risk factor by edges (cf. Fig. 2A). By doing so, they showed that many disorders share a set of underlying genetic risk variants and that similar diseases are caused by similar genes.
Figure 2.
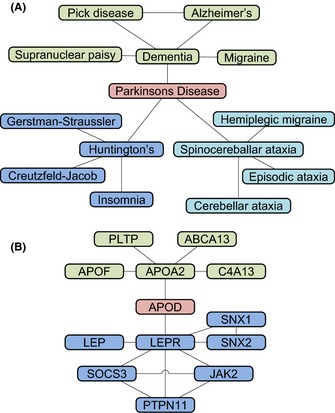
Topological Properties of Biological Networks (A) is an excerpt from the human disease network (Goh et al., 2007). Nodes represent diseases; these are connected if they are associated with the same gene. Parkinson's disease connects three isolated disease clusters (colours), thus having a low clustering coefficient (0%) and high betweenness (72%). (B) is the close neighbourhood of the ApoD protein in a PPI network from STRING DB (Franceschini et al., 2013) using only experimentally confirmed interactions. ApoD connects two clusters and is, despite the low degree (2) and clustering coefficient (0%), a central node (betweenness centrality: 53%). In contrast, LEPR is central within the blue cluster (degree: 7, clustering: 14%).
Graphs can be explored using a variety of established algorithms. One common task is the identification of modules, that is subgraphs in which nodes share certain properties. In biological networks, modules correspond to functional units, such as the glycolysis pathway in the metabolic network. The modules are usually interconnected and together form a hierarchical structure in which the distribution of node degrees – the number of edges per node – follows the power law (Barabási & Oltvai, 2004). Hence, most nodes have only few connections and few nodes have many connections. These highly connected nodes are called hubs (Albert et al., 2000; Jeong et al., 2001). Several other measures exist to describe the topology of networks and topological features of nodes. For example, the clustering coefficient measures how densely the neighbourhood of a node is connected and thus highlights nodes which are central within a cluster (e.g. LEPR in Fig. 2A). Another measure is the betweenness centrality, which measures the proportion of pairwise shortest paths containing a node. It thus quantifies the importance of a node for connecting other nodes from different modules (e.g. Parkinson's disease in Fig. 2A and APOD in Fig. 2B). The highly connected, central nodes are thought to be key players in the system, connecting several modules and controlling network fluxes. They were shown to be of particular importance for many diseases and survival of the organism (Barabási & Oltvai, 2004; Joy et al., 2005; Yu et al., 2007).
Many software packages for graph analysis and visualization are publicly available. For instance, the R package igraph (Csardi & Nepusz, 2006) or the standalone program Cytoscape (Shannon et al., 2003) can be used to analyse and visualize graphs. Cytoscape also provides easy integration of biological databases such as Gene Ontology (Ashburner et al., 2000), Reactome (Croft et al., 2014), the Kyoto Encyclopaedia of Genes and Genomes (KEGG) (Kanehisa & Goto, 2000) or BioGRID (Chatr‐Aryamontri et al., 2013) by third‐party apps. Several methods were developed to identify modules of nodes which are jointly affected by the condition of interest. Two publicly available examples are the Cytoscape plugin jActiveModules (Ideker et al., 2002) and the R package BioNet (Beisser et al., 2010).
Here, we present a selection of current methods to construct and analyse biological networks as an approach to systems biology and their impact on aging research.
Enrichment and network topology analysis in predefined networks
A popular approach to put the results of an association study in a systems biology context is projecting the variables of interest – such as age‐related genes, proteins or metabolites – onto known biological (reference) networks. The neighbourhood of these target variables and their topological properties can then be assessed using the experimentally predefined PPI, GRN or metabolic networks. Instead of interpreting individual entities separately, a priori knowledge about their interactions and common functions can be used to identify modules that are jointly affected by the condition of interest.
Several databases offer a collection of experimentally identified interactions that can be used as predefined reference networks for enrichment and topology. In case of PPI, the Human Protein Reference Database provides more than 40 000 PPIs (Keshava Prasad et al., 2009), the Database of Interacting Proteins more than 7000 interactions (Xenarios et al., 2002) and the MIPS mammalian protein–protein database roughly 1000 hand‐curated interactions of human proteins (Pagel et al., 2005). GRN are provided by the ChIPBase (Yang et al., 2013), which contains six million transcription factor binding sites from >300 experiments. Metabolic reactions are amongst others provided by KEGG.
Enrichment analysis is a convenient way to incorporate existing knowledge from biological reference networks without analysing graph topology directly. Therefore, predefined (functional) modules within the reference networks are used to test overrepresentation of associated genes, proteins or metabolites in these groups. When investigating genes, researchers usually use Gene Ontology to group genes based on biological processes, molecular functions or subcellular localization. For metabolites, the KEGG and Reactome databases provide curated information about biochemical pathways. The R packages GSEABase, GAGE (Luo et al., 2009) and the webservice MSEA (Xia & Wishart, 2010) are just some of many available implementations and variations in the original gene set enrichment analysis (Subramanian et al., 2005) algorithm.
In aging research, enrichment analysis unveiled an overexpression of genes involved in immune response, lysosome and glycoproteins and an underexpression of mitochondrial‐ and oxidative phosphorylation‐related genes in old people compared with young (de Magalhães et al., 2009). In human brain tissue, oxidative stress/DNA repair and inflammation‐related genes were shown to be enriched in the set of differentially expressed genes between young and old individuals (Lu et al., 2004). Enrichment analysis facilitates the identification of pathways that are important for the aging process. It thus helps to make sense out of the individual associations and find biological interpretations for the observed molecular changes.
To become independent of predefined module annotation and to enable more detailed network analysis, the variables of interest can also be mapped directly on the known PPI, GRN or metabolism networks. Modules can then be identified dynamically based on the measured data. Moreover, additional topological properties of the variables of interest can be assessed.
Studying human PPI networks revealed that genes that are associated with aging by homology have higher node degrees and higher betweenness centrality compared with other genes (Bell et al., 2009). Furthermore, aging‐related genes are not spread throughout the interactome, but cluster in few tightly connected modules. These modules were enriched in DNA damage repair and stress response genes (Kriete et al., 2011). The high connectivity of aging genes was used by Tacutu et al. (2012) to select neighbours of longevity‐related genes in a PPI network as longevity‐gene candidates. Subsequent experiments in C. elegans revealed 30 new longevity‐associated genes, proving the potential of network biology for candidate gene selection. Using a modified PPI network, Wang et al. (2009) showed a tight connection of the genetic causes of aging and disease. These results indicate that aging does not occur due to random errors but is an organized process. Another PPI‐based approach to data integration was developed by West et al. (2013). They incorporated epigenomic data by assigning DNA methylation sites to each protein in the graph and then identifying modules of differentially methylated genes/proteins in the resulting network. By doing so, they avoided predefined gene sets as used by enrichment analysis. The analysis revealed three differentially methylated modules, which were replicated across several tissues. Two of them contained mainly transcription regulating genes, while the third one contained genes related to stem cell differentiation.
A drawback of experimentally derived PPI or GRN is that such methods detect up to 50% false positives while many true interactions are missed (Huang & Bader, 2009; Marbach et al., 2012). Even more importantly, those reference networks completely ignore the tempo‐spatial properties of the interactions. This restricts results to already observed, possibly inactive interactions. One method to overcome the static nature of PPI networks are Negative–Positive (NP) networks (Xia et al., 2006). These integrate the PPI network with transcriptomics data by restricting it to edges between (anti‐)correlated proteins/genes. Therefore, only those interactions (=edges) that are active under the observed condition are further analysed. Xue et al. (2007) applied this method to the previously mentioned data set of brain gene expression and unveiled two anticorrelated modules containing cell proliferation‐ and cell differentiation‐related proteins. Two other modules consisting of protein processing and immunity‐related genes, respectively, were found to be slightly correlated with the cell proliferation module. A recent study went one step further and restricted a PPI network to highly expressed genes in different stages of aging for each sample separately, thus generating a set of dynamic binding networks instead of a single network. Even though the global properties of all those graphs were very similar, the centrality of several genes correlated with age (Faisal & Milenković, 2014).
Incorporating biological networks to analyse aging‐related changes showed the tight connection of aging and disease on a molecular level. Furthermore, it has been shown that aging affects central genes, which are important for the network integrity (Bell et al., 2009). While network‐based enrichment and analysis using PPI networks is common for genetic and transcriptomics data, it has not been applied to aging studies using metabolomics data. This could be a promising approach to systematically identify metabolic pathways jointly affected by the aging process.
Analysis of data‐derived networks
Despite their successful applications, all approaches presented so far rely on predefined, static networks. To overcome the limitations of such networks, inferring networks directly from the measured data is the next step.
Weighted gene co‐expression network analysis
The weighted gene co‐expression network analysis (WGCNA) (Zhang & Horvath, 2005) infers gene–gene interaction networks directly from transcriptomics data. Miller et al. (2008) applied this method to the previously mentioned gene expression data set of 30 human frontal cortex samples at different ages and then compared the results with a network derived from an AD transcriptomics study. It revealed significant overlap between healthy aging and AD, suggesting that there might be a shared molecular basis for both processes. Three AD network modules overlapped with aging network modules, containing mostly synapses‐, transport‐ and transcriptional regulation‐related genes.
Gaussian graphical models
Despite the successful application of WGCNA on transcriptomics data, Krumsiek et al. (2011) showed that ordinary correlations are not suitable to analyse metabolomics data from large cohort studies. They analysed metabolite concentrations of >1000 samples and found that more than half of all pairs of 151 metabolites correlated significantly, even when using a restrictive Bonferroni correction at an alpha level of 0.01. This is largely due to indirect associations, which cannot be distinguished from direct associations by the Pearson correlation coefficient. Graphical models (GMs), also known as conditional independence graphs, were proposed to overcome this problem and infer biological meaningful networks from metabolomics (Steuer, 2006; Krumsiek et al., 2011) as well as other omics data (de la Fuente et al., 2004; Yuan et al., 2011; Mangin et al., 2012). GMs are probabilistic models where an edge between two variables illustrates their conditional dependence given all other variables in the model. Implicitly, the absence of an edge represents the conditional independence of the according variables. Several algorithms to infer GMs from purely binary data are publicly available as R packages (Wainwright et al., 2006; Höfling & Tibshirani, 2009; Guo et al., 2010; Ravikumar et al., 2010). Their counterparts for purely continuous data are Gaussian graphical models (GGMs), which use partial correlations to infer graphs. A partial correlation of two variables X and Y conditioned on a set of variables Z quantifies the portion of the correlation between X and Y which cannot be attributed to Z. Several algorithms exist to infer GGMs (d'Aspremont et al., 2006; Meinshausen & Bühlmann, 2006; Yuan & Lin, 2007; Friedman et al., 2008; Mazumder & Hastie, 2012). Several of them, such as the well‐established graphical lasso (Friedman et al., 2008; Mazumder & Hastie, 2012), use regularization to further reduce the number of edges in the graph. This allows researchers to concentrate on fewer high‐confidence interactions.
Gaussian graphical models can reconstruct biological pathways from metabolomics and transcriptomics data, but have not yet been applied in aging research. However, their application could help reduce the ‘overabundance’ of results to fewer, meaningful associations. The major drawback of GMs is that they can only be used for pure Gaussian or pure binary data. Shin et al. (2014) overcame this problem by first constructing a GGM from metabolite concentrations and then adding gene variants as nodes and connecting them with associated metabolites. The resulting network illustrates the genetic control of the metabolism in an intuitive way. However, it is no longer a GM, and edges do not indicate conditional independence any more.
Mixed graphical models
Recent developments allow the integration of different types of data while maintaining the favourable properties of GGMs, namely mixed graphical models (MGMs) (Tur & Castelo, 2012; Chen et al., 2013; Fellinghauer et al., 2013; Lee & Hastie, 2015). Fellinghauer et al. (2013) proposed a very flexible algorithm based on stability selection (Meinshausen & Bühlmann, 2010). It makes use of established methods such as random forests or regression models to rank interactions between variables of different types. Thus, it can handle many different data types such as disease states, metabolite levels and gene variants. Due to the usage of stability selection, it has an intrinsic error control. MGMs provide a powerful tool for multivariate analyses of high‐dimensional data, but have not been applied in biological research, yet. Their application could shed light on the complex relationship between aging and disease.
Gaussian graphical models as well as MGMs are undirected models. Therefore, neither of them can be used to infer causal direction. In epidemiological research, Mendelian randomization is a common approach to infer causality from observational data. It takes advantage of the invariability of gene variants to separate the study population in groups, thus mimicking a randomized controlled trial (for further details, see Brion et al., 2014). Mendelian randomization can be used to further investigate edges of interest that were previously identified by GMs. However, it relies on stable associations with genetic variants and assumes that this genetic variant is not related to any other potential confounding factor. Due to these restrictions, it is not suitable to infer large‐scale networks.
Bayesian networks
Another approach that allows inferring causality from observational data under certain assumptions is based on Bayesian networks (BNs). Similar to GGMs, BNs are probabilistic models in which edges represent the conditional independence between variables. However, BNs are DAGs, thus distinguishing between an influence of X on Y and the influence of Y on X. In return, the acyclicity of the causal graph is an assumption which might not hold true for biological networks. The application of BNs on high‐throughput transcriptomics data by Friedman et al. (2000) demonstrated the potential of this method to extract biological meaningful associations without prior knowledge. Several different methods are available to estimate the structure of BNs from binary, continuous and even mixed data such as the R packages bnlearn (Scutari, 2010) (Table 1).
Table 1.
Overview over system biology methods and their application in aging
| Method | Prerequisites | Applies to | Availability | Application |
|---|---|---|---|---|
| Enrichment Analysis | Module definition (e.g. gene sets from Gene Ontology) | Genomics Transcriptomics Proteomics Metabolomics | Several R packages (e.g. GSEABase, GAGE, MSEA), online tools DAVID or Enrichr | Lu et al. (2004), de Magalhães et al. (2009) |
| Network Mapping | Predefined network, such as protein–protein interaction (PPI) networks, gene regulatory network (GRN) or metabolic network | Any omics data | R package igraph, Cytoscape with various plugins | Wang et al. (2009), Bell et al. (2009), West et al. (2013), Faisal & Milenković (2014) |
| NP Networks | PPI Network | Transcriptomics | – | Xue et al. (2007) |
| Weighted Gene Co‐Expression Network Analysis (WGCNA) | – | Transcriptomics (and possibly other continuous data) | R package WGCNA | Miller et al. (2008) |
| Gaussian graphical models (GGMs) | – | Any multivariate Gaussian distributed data | Several R packages (e.g. ggm or glasso) | Applied to metabolomics data by Krumsiek et al. (2011) |
| Mixed graphical models (MGMs) | – | Binary, continuous and mixed data | – | |
| Bayesian Networks | – | Binary, continuous and mixed data | Several R packages (e.g. bnlearn, gRain, abn, deal) | Applied to transcriptomics data by Friedman et al. (2000) |
The methods presented here are just a selection of the available methods for graph inference. Several other methods such as Boolean networks (Shmulevich et al., 2002) or differential equation systems (Chen et al., 1999; Lorenz et al., 2009) are commonly used for modelling biological networks.
The development of new techniques facilitates graph inference from high‐dimensional data, and the presented studies illustrate their usefulness in biological research. However, most graph inference methods rely on large sample sizes and usually more samples than variables are needed. When analysing omics data, particularly genomics or transcriptomics, this is often not feasible and it is referred to as the n≪p problem. Another common problem is overfitting of models due to the high number of parameters. Some techniques such as regularization have been proposed to relax these constraints and reduce overfitting. Nevertheless, stringent cross‐validation and replication in independent cohorts should be employed to avoid spurious results. Finally, many high‐throughput methods suffer from considerable technical variation and strong batch effects. Researchers should carefully normalize all measurements according to current standards before integrating different data sets.
Model biological systems
The ultimate goal of systems biology is not only the qualitative exploration, but the quantitative modelling of the organism, facilitating in silico experiments, hypotheses generation and predictions.
The first – and so far only ‐ attempt to model a whole organism was conducted by Karr et al. (2012). They created a model of a mycoplasma genitalium cell simulating cell cycle and predicting metabolite concentrations. However, the model is far from perfect (Freddolino & Tavazoie, 2012) and too primitive to be adapted to more complex organisms. Currently, modelling eukaryotic cells or even whole organisms is not feasible. Also, processes like aging are too complex to be entirely modelled. However, some effort has been undertaken to create network representations of smaller subsystems as well as certain aspects of the aging process. For instance, Gillespie et al. (2004) simulated aging of yeast based on the accumulation of extrachromosomal ribosomal DNA circles. Also, Oda & Kitano (2006) summarized results from several hundred studies to create a model of the Toll‐like receptor (TLR) signalling network. The same group also created a similar model for epidermal growth factor receptor signalling (Oda et al., 2005). Both studies revealed a bowtie‐like global structure with one important key regulator. However, both networks are only qualitative descriptions without kinetic parameters. Thus, they cannot be used for computer simulations.
Other groups concentrated on even smaller subsystems to facilitate quantitative modelling. One study investigated the influence of increased cortisol levels on hippocampus activity (McAuley et al., 2009). A quantitative model was created to simulate the decline in hippocampal output with age and the acceleration of this process due to acute and chronic increases in cortisol levels. Simulations using ordinary differential equations suggested that chronic increase in cortisol levels leads to faster decline in hippocampal output than acute bursts, but could be treated more efficiently. Sozou & Kirkwood (2001) modelled cell senescence based on telomere shortening and oxidative stress. The same group also described the influence of chaperones and accumulation of misfolded proteins on aging (Proctor et al., 2005). Other groups investigated various further aspects of the aging process, such as mitochondrial fusion and fission events and accumulation of defective mitochondria (Kowald et al., 2005; Figge et al., 2012), incomplete replication of epigenetic information (Przybilla et al., 2014) and age‐related alterations in the lipid metabolism (McAuley & Mooney, 2015). Adjusting the kinetics of such models to correspond to experimental observations allows to come up with plausible hypotheses about the causes of aging.
In contrast to earlier presented networks, which inferred large‐scale networks from data (top‐down approach), these approaches model small subsystems in high details based on expert a priori knowledge (bottom‐up approach). Such bottom‐up models allow mechanistic insights into the processes of aging that cannot be generated by individual association studies. Moreover, they facilitate the development of new hypothesis and testing the plausibility of current hypothesis.
Conclusions and challenges
The major recent advances of omics technologies are now enabling the simultaneous measurement of millions of biochemical entities. Association studies have revealed many associations of omics data with aging and age‐related diseases. After decades of reductionist studies, network analysis and integrated omics data analysis have begun to target the aging process at a systems level. As a result, some studies take into account also the interaction effects between variables. However, given the complexity of aging, new methods are needed to further unveil the multiple interactions.
Systems biology already provides such methods, but their application on real biological problems lags behind. For example, GGMs have been adapted to mixed data types and could readily be applied in aging research. Also, several studies developed models of processes that contribute to aging. These provide detailed knowledge about important components of the aging process and their interactions. Building on these results, future studies should aim to integrate these different parts to gain a more systems‐level understanding of aging.
However, in many cases, the available data limit the possibilities. Problems such as incomplete data, asynchronous experiments, strong batch effects and insufficient sample sizes have to be dealt with. Another issue is the limited availability of multi‐omics data sets, which complicates replication of results in this field. A variety of different methods, protocols and platforms further hampers reproducible results. As replication of results is crucial to prevent spurious results and validation, methods like splitting the available data into discovery and replication sets should be considered more often.
Despite these obstacles, there are several large population studies in existence with multi‐omics data available which could be explored using systems biology approaches. For instance, the GTEx project aims to collect gene expression and methylation data from multitissue samples (The Gtex Consortium 2013). Simultaneously, the development of new methods should help to analyse real, partially incomplete data sets and facilitate analysis of multitissue and multi‐organ data, thus enabling the investigation of real systems‐level effects. Addressing these problems and developing integrated models of aging should improve our understanding of the aging process, thus allowing the development of strategies to improve health in old age.
Funding
This work was supported by the EU Framework Programme 7 small‐scale focused research collaborative project EurHEALTHAging [277849]; TwinsUK was funded by the Wellcome Trust; European Community's Seventh Framework Programme [FP7/2007‐2013]. The study also receives support from the National Institute for Health Research (NIHR) Clinical Research Facility at Guy's & St Thomas' NHS Foundation Trust and NIHR Biomedical Research Centre based at Guy's and St Thomas' NHS Foundation Trust and King's College London. TDS is a NIHR senior research fellow.
Conflict of interest
None declared.
References
- Adamczyk B, Tharmalingam T, Rudd PM (2012) Glycans as cancer biomarkers. Biochim. Biophys. Acta 1820, 1347–1353. [DOI] [PubMed] [Google Scholar]
- Albert R, Jeong H, Barabazi A‐L (2000) Error and attack tolerance of complex networks. Nature 406, 378–382. [DOI] [PubMed] [Google Scholar]
- Alegría‐Torres JA, Baccarelli A, Bollati V (2011) Epigenetics and lifestyle. Epigenomics 3, 267–277. [DOI] [PMC free article] [PubMed] [Google Scholar]
- Allocco DJ, Kohane IS, Butte AJ (2004) Quantifying the relationship between co‐expression, co‐regulation and gene function. BMC Bioinformatics 5, 18. [DOI] [PMC free article] [PubMed] [Google Scholar]
- Alzheimer's Society (2014) Demography. Available at: http://www.alzheimers.org.uk.
- Ashburner M, Ball CA, Blake JA, Botstein D, Butler H, Cherry JM, Davis AP, Dolinski K, Dwight SS, Eppig JT, Harris MA, Hill DP, Issel‐Tarver L, Kasarskis A, Lewis S, Matese JC, Richardson JE, Ringwald M, Rubin GM, Sherlock G (2000) Gene ontology: tool for the unification of biology. The gene ontology consortium. Nat. Genet. 25, 25–29. [DOI] [PMC free article] [PubMed] [Google Scholar]
- d'Aspremont A, Banerjee O, El Ghaoui L (2006) First‐order methods for sparse covariance selection. J. Mach. Learn. Res. 10, 883–906. [Google Scholar]
- Bacalini MG, Friso S, Olivieri F, Pirazzini C, Giuliani C, Capri M, Santoro A, Franceschi C, Garagnani P (2014) Present and future of anti‐ageing epigenetic diets. Mech. Ageing Dev. 136–137, 101–115. [DOI] [PubMed] [Google Scholar]
- Barabási A‐L, Oltvai ZN (2004) Network biology: understanding the cell's functional organization. Nat. Rev. Genet. 5, 101–113. [DOI] [PubMed] [Google Scholar]
- Baylis D, Ntani G, Edwards MH, Syddall HE, Bartlett DB, Dennison EM, Martin‐Ruiz C, von Zglinicki T, Kuh D, Lord JM, Aihie Sayer A, Cooper C (2014) Inflammation, telomere length, and grip strength: a 10‐year longitudinal study. Calcif. Tissue Int. 95, 54–63. [DOI] [PMC free article] [PubMed] [Google Scholar]
- Beisser D, Klau GW, Dandekar T, Müller T, Dittrich MT (2010) BioNet: an R‐Package for the functional analysis of biological networks. Bioinformatics 26, 1129–1130. [DOI] [PubMed] [Google Scholar]
- Bell R, Hubbard A, Chettier R, Chen D, Miller JP, Kapahi P, Tarnopolsky M, Sahasrabuhde S, Melov S, Hughes RE (2009) A human protein interaction network shows conservation of aging processes between human and invertebrate species. PLoS Genet. 5, e1000414. [DOI] [PMC free article] [PubMed] [Google Scholar]
- Bell JT, Tsai P‐C, Yang T‐P, Pidsley R, Nisbet J, Glass D, Mangino M, Zhai G, Zhang F, Valdes A, Shin S‐Y, Dempster EL, Murray RM, Grundberg E, Hedman AK, Nica A, Small KS, Dermitzakis ET, McCarthy MI, Mill J, Spector TD, Deloukas P (2012) Epigenome‐wide scans identify differentially methylated regions for age and age‐related phenotypes in a healthy ageing population. PLoS Genet. 8, e1002629. [DOI] [PMC free article] [PubMed] [Google Scholar]
- Berchtold NC, Cribbs DH, Coleman PD, Rogers J, Head E, Kim R, Beach T, Miller C, Troncoso J, Trojanowski JQ, Zielke HR, Cotman CW (2008) Gene expression changes in the course of normal brain aging are sexually dimorphic. Proc. Natl Acad. Sci. U. S. A. 105, 15605–15610. [DOI] [PMC free article] [PubMed] [Google Scholar]
- Biagi E, Nylund L, Candela M, Ostan R, Bucci L, Pini E, Nikkïla J, Monti D, Satokari R, Franceschi C, Brigidi P, De Vos W (2010) Through ageing, and beyond: gut microbiota and inflammatory status in seniors and centenarians. PLoS ONE 5, e10667. [DOI] [PMC free article] [PubMed] [Google Scholar]
- Biagi E, Candela M, Fairweather‐Tait S, Franceschi C, Brigidi P (2012) Aging of the human metaorganism: the microbial counterpart. Age (Dordr). 34, 247–267. [DOI] [PMC free article] [PubMed] [Google Scholar]
- Breitling LP, Yang R, Korn B, Burwinkel B, Brenner H (2011) Tobacco‐smoking‐related differential DNA methylation: 27K discovery and replication. Am. J. Hum. Genet. 88, 450–457. [DOI] [PMC free article] [PubMed] [Google Scholar]
- Brion MA, Benyamin B, Visscher PM, Smith GD (2014) Beyond the single SNP: emerging developments in mendelian randomization in the ‘omics ‘era. Curr. Epidemiol. Reports 1, 228–236. [Google Scholar]
- Cassman M (2005) Barriers to progress in systems biology. Nature 438, 1079. [DOI] [PubMed] [Google Scholar]
- Cevenini E, Invidia L, Lescai F, Salvioli S, Tieri P, Castellani G, Franceschi C (2008) Human models of aging and longevity. Expert Opin. Biol. Ther. 8, 1393–1405. [DOI] [PubMed] [Google Scholar]
- Chatr‐Aryamontri A, Breitkreutz B‐J, Heinicke S, Boucher L, Winter A, Stark C, Nixon J, Ramage L, Kolas N, O'Donnell L, Reguly T, Breitkreutz A, Sellam A, Chen D, Chang C, Rust J, Livstone M, Oughtred R, Dolinski K, Tyers M (2013) The BioGRID interaction database: 2013 update. Nucleic Acids Res. 41, D816–D823. [DOI] [PMC free article] [PubMed] [Google Scholar]
- Chen T, He HL, Church GM (1999) Modeling gene expression with differential equations. Pac. Symp. Biocomput. 4, 29–40. [PubMed] [Google Scholar]
- Chen S, Witten D, Shojaie A (2013) Selection and Estimation for Mixed Graphical Models. Available at: http://arxiv.org/abs/1311.0085 [Accessed January 7, 2014]. [DOI] [PMC free article] [PubMed]
- Claesson MJ, Cusack S, O'Sullivan O, Greene‐Diniz R, de Weerd H, Flannery E, Marchesi JR, Falush D, Dinan T, Fitzgerald G, Stanton C, van Sinderen D, O'Connor M, Harnedy N, O'Connor K, Henry C, O'Mahony D, Fitzgerald AP, Shanahan F, Twomey C, Hill C, Ross RP, O'Toole PW (2011) Composition, variability, and temporal stability of the intestinal microbiota of the elderly. Proc. Natl Acad. Sci. U. S. A. 108(Suppl), 4586–4591. [DOI] [PMC free article] [PubMed] [Google Scholar]
- Claesson MJ, Jeffery IB, Conde S, Power SE, O'Connor EM, Cusack S, Harris HMB, Coakley M, Lakshminarayanan B, O'Sullivan O, Fitzgerald GF, Deane J, O'Connor M, Harnedy N, O'Connor K, O'Mahony D, van Sinderen D, Wallace M, Brennan L, Stanton C, Marchesi JR, Fitzgerald AP, Shanahan F, Hill C, Ross RP, O'Toole PW (2012) Gut microbiota composition correlates with diet and health in the elderly. Nature 488, 178–184. [DOI] [PubMed] [Google Scholar]
- Craig T, Smelick C, Tacutu R, Wuttke D, Wood SH, Stanley H, Janssens G, Savitskaya E, Moskalev A, Arking R, de Magalhaes JP (2014) The Digital Ageing Atlas: integrating the diversity of age‐related changes into a unified resource. Nucleic Acids Res. 43, D873–D878. [DOI] [PMC free article] [PubMed] [Google Scholar]
- Croft D, Mundo AF, Haw R, Milacic M, Weiser J, Wu G, Caudy M, Garapati P, Gillespie M, Kamdar MR, Jassal B, Jupe S, Matthews L, May B, Palatnik S, Rothfels K, Shamovsky V, Song H, Williams M, Birney E, Hermjakob H, Stein L, D'Eustachio P (2014) The reactome pathway knowledgebase. Nucleic Acids Res. 42, D472–D477. [DOI] [PMC free article] [PubMed] [Google Scholar]
- Csardi G, Nepusz T (2006) The igraph software package for complex network research. InterJournal Complex Sy, 1695, Available at: http://igraph.org. [Google Scholar]
- Dang W, Steffen KK, Perry R, Dorsey JA, Johnson FB, Shilatifard A, Kaeberlein M, Kennedy BK, Berger SL (2009) Histone H4 lysine 16 acetylation regulates cellular lifespan. Nature 459, 802–807. [DOI] [PMC free article] [PubMed] [Google Scholar]
- Davies G, Harris SE, Reynolds CA, Payton A, Knight HM, Liewald DC, Lopez LM, Luciano M, Gow AJ, Corley J, Henderson R, Murray C, Pattie A, Fox HC, Redmond P, Lutz MW, Chiba‐Falek O, Linnertz C, Saith S, Haggarty P, McNeill G, Ke X, Ollier W, Horan M, Roses AD, Ponting CP, Porteous DJ, Tenesa A, Pickles A, Starr JM, Whalley LJ, Pedersen NL, Pendleton N, Visscher PM, Deary IJ (2014) A genome‐wide association study implicates the APOE locus in nonpathological cognitive ageing. Mol. Psychiatry 19, 76–87. [DOI] [PMC free article] [PubMed] [Google Scholar]
- Deelen J, Beekman M, Uh HW, Helmer Q, Kuningas M, Christiansen L, Kremer D, van der Breggen R, Suchiman HED, Lakenberg N, van den Akker EB, Passtoors WM, Tiemeier H, van Heemst D, de Craen AJ, Rivadeneira F, de Geus EJ, Perola M, van der Ouderaa FJ, Gunn DA, Boomsma DI, Uitterlinden AG, Christensen K, van Duijn CM, Heijmans BT, Houwing‐Duistermaat JJ, Westendorp RGJ, Slagboom PE (2011) Genome‐wide association study identifies a single major locus contributing to survival into old age; the APOE locus revisited. Aging Cell 10, 686–698. [DOI] [PMC free article] [PubMed] [Google Scholar]
- Eddy SR (2001) Non‐coding RNA genes and the modern RNA world. Nat. Rev. Genet. 2, 919–929. [DOI] [PubMed] [Google Scholar]
- Ehrlich M (2002) DNA methylation in cancer: too much, but also too little. Oncogene 21, 5400–5413. [DOI] [PubMed] [Google Scholar]
- Faisal FE, Milenković T (2014) Dynamic networks reveal key players in aging. Bioinformatics 30, 1721–1729. [DOI] [PubMed] [Google Scholar]
- Fellinghauer B, Bühlmann P, Ryffel M, von Rhein M, Reinhardt JD (2013) Stable graphical model estimation with Random Forests for discrete, continuous, and mixed variables. Comput. Stat. Data Anal. 64, 132–152. [Google Scholar]
- Figge MT, Reichert AS, Meyer‐Hermann M, Osiewacz HD (2012) Deceleration of fusion‐fission cycles improves mitochondrial quality control during aging. PLoS Comput. Biol. 8, e1002576. [DOI] [PMC free article] [PubMed] [Google Scholar]
- Flachsbart F, Caliebe A, Kleindorp R, Blanché H, von Eller‐Eberstein H, Nikolaus S, Schreiber S, Nebel A (2009) Association of FOXO3A variation with human longevity confirmed in German centenarians. Proc. Natl Acad. Sci. U. S. A. 106, 2700–2705. [DOI] [PMC free article] [PubMed] [Google Scholar]
- Franceschini A, Szklarczyk D, Frankild S, Kuhn M, Simonovic M, Roth A, Lin J, Minguez P, Bork P, von Mering C, Jensen LJ (2013) STRING v9.1: protein‐protein interaction networks, with increased coverage and integration. Nucleic Acids Res. 41, D808–D815. [DOI] [PMC free article] [PubMed] [Google Scholar]
- Freddolino PL, Tavazoie S (2012) The dawn of virtual cell biology. Cell 150, 248–250. [DOI] [PMC free article] [PubMed] [Google Scholar]
- Friedman N, Linial M, Nachman I, Pe'er D (2000) Using Bayesian networks to analyze expression data. J. Comput. Biol. 7, 601–620. [DOI] [PubMed] [Google Scholar]
- Friedman J, Hastie T, Tibshirani R (2008) Sparse inverse covariance estimation with the graphical lasso. Biostatistics 9, 432–441. [DOI] [PMC free article] [PubMed] [Google Scholar]
- de la Fuente A, Bing N, Hoeschele I, Mendes P (2004) Discovery of meaningful associations in genomic data using partial correlation coefficients. Bioinformatics 20, 3565–3574. [DOI] [PubMed] [Google Scholar]
- Fuster MM, Esko JD (2005) The sweet and sour of cancer: glycans as novel therapeutic targets. Nat. Rev. Cancer 5, 526–542. [DOI] [PubMed] [Google Scholar]
- Gatz M, Reynolds CA, Fratiglioni L, Johansson B, Mortimer JA, Berg S, Fiske A, Pedersen NL (2006) Role of genes and environments for explaining Alzheimer disease. Arch. Gen. Psychiatry 63, 168–174. [DOI] [PubMed] [Google Scholar]
- Gelfi C, Vigano A, Ripamonti M, Pontoglio A, Begum S, Pellegrino MA, Grassi B, Bottinelli R, Wait R, Cerretelli P (2006) The human muscle proteome in aging. J. Proteome Res. 5, 1344–1353. [DOI] [PubMed] [Google Scholar]
- Gillespie CS, Proctor CJ, Boys RJ, Shanley DP, Wilkinson DJ, Kirkwood TBL (2004) A mathematical model of ageing in yeast. J. Theor. Biol. 229, 189–196. [DOI] [PubMed] [Google Scholar]
- Ginsburg GS, Haga SB (2006) Translating genomic biomarkers into clinically useful diagnostics. Expert Rev. Mol. Diagn. 6, 179–191. [DOI] [PubMed] [Google Scholar]
- Glass D, Viñuela A, Davies MN, Ramasamy A, Parts L, Knowles D, Brown AA, Hedman AK, Small KS, Buil A, Grundberg E, Nica AC, Meglio P, Nestle FO, Ryten M, Durbin R, McCarthy MI, Deloukas P, Dermitzakis ET, Weale ME, Bataille V, Spector TD (2013) Gene expression changes with age in skin, adipose tissue, blood and brain. Genome Biol. 14, R75. [DOI] [PMC free article] [PubMed] [Google Scholar]
- Goh K, Cusick ME, Valle D, Childs B, Vidal M, Barabási A‐L (2007) The human disease network. Proc. Natl Acad. Sci. U. S. A. 104, 8685–8690. [DOI] [PMC free article] [PubMed] [Google Scholar]
- Goodrich JK, Waters JL, Poole AC, Sutter JL, Koren O, Blekhman R, Beaumont M, Van Treuren W, Knight R, Bell JT, Spector TD, Clark AG, Ley RE (2014) Human genetics shape the gut microbiome. Cell 159, 789–799. [DOI] [PMC free article] [PubMed] [Google Scholar]
- Gornik O, Wagner J, Pucić M, Knezević A, Redzic I, Lauc G (2009) Stability of N‐glycan profiles in human plasma. Glycobiology 19, 1547–1553. [DOI] [PubMed] [Google Scholar]
- Greer EL, Maures TJ, Hauswirth AG, Green EM, Leeman DS, Maro GS, Han S, Banko MR, Gozani O, Brunet A (2010) Members of the H3K4 trimethylation complex regulate lifespan in a germline‐dependent manner in C. elegans . Nature 466, 383–387. [DOI] [PMC free article] [PubMed] [Google Scholar]
- Grice EA, Segre JA (2012) The human microbiome: our second genome. Annu. Rev. Genomics Hum. Genet. 13, 151–170. [DOI] [PMC free article] [PubMed] [Google Scholar]
- Guigoz Y, Doré J, Schiffrin EJ (2008) The inflammatory status of old age can be nurtured from the intestinal environment. Curr. Opin. Clin. Nutr. Metab. Care 11, 13–20. [DOI] [PubMed] [Google Scholar]
- Guo J, Levina E, Michailidis G, Zhu J (2010) Joint Structure Estimation for Categorical Markov Networks.
- Ha N‐T, Freytag S, Bickeboeller H (2014) Coverage and efficiency in current SNP chips. Eur. J. Hum. Genet. 22, 1124–1130. [DOI] [PMC free article] [PubMed] [Google Scholar]
- Hammond CJ, Duncan DD, Snieder H, de Lange M, West SK, Spector TD, Gilbert CE (2001) The heritability of age‐related cortical cataract: the twin eye study. Invest. Ophthalmol. Vis. Sci. 42, 601–605. [PubMed] [Google Scholar]
- Harman D (1988) The aging process. Basic Life Sci. 49, 1057–1065. [DOI] [PubMed] [Google Scholar]
- Harman D (2001) Aging: overview. Ann. N. Y. Acad. Sci. 928, 1–21. [DOI] [PubMed] [Google Scholar]
- Höfling H, Tibshirani R (2009) Estimation of sparse binary pairwise markov networks using pseudo‐likelihoods. J. Mach. Learn. Res. 10, 883–906. [PMC free article] [PubMed] [Google Scholar]
- Horvath S (2013) DNA methylation age of human tissues and cell types. Genome Biol. 14, R115. [DOI] [PMC free article] [PubMed] [Google Scholar]
- Houle D, Govindaraju DR, Omholt S (2010) Phenomics: the next challenge. Nat. Rev. Genet. 11, 855–866. [DOI] [PubMed] [Google Scholar]
- Houseman E, Accomando WP, Koestler DC, Christensen BC, Marsit CJ, Nelson HH, Wiencke JK, Kelsey KT (2012) DNA methylation arrays as surrogate measures of cell mixture distribution. BMC Bioinformatics 13, 86. [DOI] [PMC free article] [PubMed] [Google Scholar]
- Huang H, Bader JS (2009) Precision and recall estimates for two‐hybrid screens. Bioinformatics 25, 372–378. [DOI] [PMC free article] [PubMed] [Google Scholar]
- Ideker T, Galitski T, Hood L (2001) A new approach to decoding life: systems biology. Annu. Rev. Genomics Hum. Genet. 2, 343–372. [DOI] [PubMed] [Google Scholar]
- Ideker T, Ozier O, Schwikowski B, Siegel AF (2002) Discovering regulatory and signalling circuits in molecular interaction networks. Bioinformatics 18(Suppl 1), S233–S240. [DOI] [PubMed] [Google Scholar]
- Illumnia (2011) Infinium HumanMethylation450 BeadChip Kit. Available at: http://www.illumina.com/products/methylation_450_beadchip_kits.ilmn [Accessed June 11, 2014].
- Ishimori ML, Altman RD, Cohen MJ, Cui J, Guo X, Rotter JI, Weisman MH (2010) Heritability patterns in hand osteoarthritis: the role of osteophytes. Arthritis. Res. Ther. 12, R180. [DOI] [PMC free article] [PubMed] [Google Scholar]
- Jackson SHD, Weale MR, Weale RA (2003) Biological age–what is it and can it be measured? Arch. Gerontol. Geriatr. 36, 103–115. [DOI] [PubMed] [Google Scholar]
- Jaenisch R, Bird A (2003) Epigenetic regulation of gene expression: how the genome integrates intrinsic and environmental signals. Nat. Genet. 33(Suppl), 245–254. [DOI] [PubMed] [Google Scholar]
- Jaffe AE, Irizarry RA (2014) Accounting for cellular heterogeneity is critical in epigenome‐wide association studies. Genome Biol. 15, R31. [DOI] [PMC free article] [PubMed] [Google Scholar]
- Jeong H, Mason SP, Barabási AL, Oltvai ZN (2001) Lethality and centrality in protein networks. Nature 411, 41–42. [DOI] [PubMed] [Google Scholar]
- Johnson TE (2006) Recent results: biomarkers of aging. Exp. Gerontol. 41, 1243–1246. [DOI] [PubMed] [Google Scholar]
- Joy MP, Brock A, Ingber DE, Huang S (2005) High‐betweenness proteins in the yeast protein interaction network. J. Biomed. Biotechnol. 2005, 96–103. [DOI] [PMC free article] [PubMed] [Google Scholar]
- Kanehisa M, Goto S (2000) KEGG: kyoto encyclopedia of genes and genomes. Nucleic Acids Res. 28, 27–30. [DOI] [PMC free article] [PubMed] [Google Scholar]
- Karr JR, Sanghvi JC, Macklin DN, Gutschow MV, Jacobs JM, Bolival B, Assad‐Garcia N, Glass JI, Covert MW (2012) A whole‐cell computational model predicts phenotype from genotype. Cell 150, 389–401. [DOI] [PMC free article] [PubMed] [Google Scholar]
- Keshava Prasad TS, Goel R, Kandasamy K, Keerthikumar S, Kumar S, Mathivanan S, Telikicherla D, Raju R, Shafreen B, Venugopal A, Balakrishnan L, Marimuthu A, Banerjee S, Somanathan DS, Sebastian A, Rani S, Ray S, Harrys Kishore CJ, Kanth S, Ahmed M, Kashyap MK, Mohmood R, Ramachandra YL, Krishna V, Rahiman BA, Mohan S, Ranganathan P, Ramabadran S, Chaerkady R, Pandey A (2009) Human protein reference database–2009 update. Nucleic Acids Res. 37, D767–D772. [DOI] [PMC free article] [PubMed] [Google Scholar]
- Kirkwood TB, Austad SN (2000) Why do we age? Nature 408, 233–238. [DOI] [PubMed] [Google Scholar]
- Knezević A, Polasek O, Gornik O, Rudan I, Campbell H, Hayward C, Wright A, Kolcic I, O'Donoghue N, Bones J, Rudd PM, Lauc G (2009) Variability, heritability and environmental determinants of human plasma N‐glycome. J. Proteome Res. 8, 694–701. [DOI] [PubMed] [Google Scholar]
- Kong HH (2011) Skin microbiome: genomics‐based insights into the diversity and role of skin microbes. Trends Mol. Med. 17, 320–328. [DOI] [PMC free article] [PubMed] [Google Scholar]
- Koropatkin NM, Cameron EA, Martens EC (2012) How glycan metabolism shapes the human gut microbiota. Nat. Rev. Microbiol. 10, 323–335. [DOI] [PMC free article] [PubMed] [Google Scholar]
- Kowald A, Jendrach M, Pohl S, Bereiter‐Hahn J, Hammerstein P (2005) On the relevance of mitochondrial fusions for the accumulation of mitochondrial deletion mutants: a modelling study. Aging Cell 4, 273–283. [DOI] [PubMed] [Google Scholar]
- Kriete A, Lechner M, Clearfield D, Bohmann D (2011) Computational systems biology of aging. Wiley Interdiscip. Rev. Syst. Biol. Med. 3, 414–428. [DOI] [PubMed] [Google Scholar]
- Kristic J, Vuckovic F, Menni C, Klaric L, Keser T, Beceheli I, Pucic‐Bakovic M, Novokmet M, Mangino M, Thaqi K, Rudan P, Novokmet N, Sarac J, Missoni S, Kolcic I, Polasek O, Rudan I, Campbell H, Hayward C, Aulchenko Y, Valdes A, Wilson JF, Gornik O, Primorac D, Zoldos V, Spector T, Lauc G (2013) Glycans are a novel biomarker of chronological and biological ages. J. Gerontol. A Biol. Sci. Med. Sci., 69, 1–11. [DOI] [PMC free article] [PubMed] [Google Scholar]
- Krumsiek J, Suhre K, Illig T, Adamski J, Theis FJ (2011) Gaussian graphical modeling reconstructs pathway reactions from high‐throughput metabolomics data. BMC Syst. Biol. 5, 21. [DOI] [PMC free article] [PubMed] [Google Scholar]
- Lawton KA, Berger A, Mitchell M, Milgram KE, Evans AM, Guo L, Hanson RW, Kalhan SC, Ryals JA, Milburn MV (2008) Analysis of the adult human plasma metabolome. Pharmacogenomics 9, 383–397. [DOI] [PubMed] [Google Scholar]
- Lee JD, Hastie TJ (2015) Learning the structure of mixed graphical models. J. Comput. Graph. Stat. 24, 230–253. [DOI] [PMC free article] [PubMed] [Google Scholar]
- Levine ME (2013) Modeling the rate of senescence: can estimated biological age predict mortality more accurately than chronological age? J. Gerontol. A Biol. Sci. Med. Sci. 68, 667–674. [DOI] [PMC free article] [PubMed] [Google Scholar]
- Liu L, Li Y, Li S, Hu N, He Y, Pong R, Lin D, Lu L, Law M (2012) Comparison of next‐generation sequencing systems. J. Biomed. Biotechnol. 2012, 1–11. [DOI] [PMC free article] [PubMed] [Google Scholar]
- Lodish HF (2013) Molecular Cell Biology, 7th edn New York: W.H. Freeman and Co. [Google Scholar]
- López‐Otín C, Blasco MA, Partridge L, Serrano M, Kroemer G (2013) The hallmarks of aging. Cell 153, 1194–1217. [DOI] [PMC free article] [PubMed] [Google Scholar]
- Lorenz DR, Cantor CR, Collins JJ (2009) A network biology approach to aging in yeast. Proc. Natl Acad. Sci. U. S. A. 106, 1145–1150. [DOI] [PMC free article] [PubMed] [Google Scholar]
- Lu T, Pan Y, Kao S, Li C, Kohane I, Chan J, Yankner BA (2004) Gene regulation and DNA damage in the ageing human brain. Nature 429, 883–891. [DOI] [PubMed] [Google Scholar]
- Luo W, Friedman MS, Shedden K, Hankenson KD, Woolf PJ (2009) GAGE: generally applicable gene set enrichment for pathway analysis. BMC Bioinformatics 10, 161. [DOI] [PMC free article] [PubMed] [Google Scholar]
- de Magalhães JP, Curado J, Church GM (2009) Meta‐analysis of age‐related gene expression profiles identifies common signatures of aging. Bioinformatics 25, 875–881. [DOI] [PMC free article] [PubMed] [Google Scholar]
- Mangin B, Siberchicot A, Nicolas S, Doligez A, This P, Cierco‐Ayrolles C (2012) Novel measures of linkage disequilibrium that correct the bias due to population structure and relatedness. Heredity (Edinb). 108, 285–291. [DOI] [PMC free article] [PubMed] [Google Scholar]
- Marbach D, Costello JC, Küffner R, Vega NM, Prill RJ, Camacho DM, Allison KR, Kellis M, Collins JJ, Stolovitzky G (2012) Wisdom of crowds for robust gene network inference. Nat. Methods 9, 796–804. [DOI] [PMC free article] [PubMed] [Google Scholar]
- Mazumder R, Hastie T (2012) The graphical lasso: new insights and alternatives. Electron. J. Stat. 6, 2125–2149. [DOI] [PMC free article] [PubMed] [Google Scholar]
- McAuley MT, Mooney KM (2015) Computationally modeling lipid metabolism and aging: a mini‐review. Comput. Struct. Biotechnol. J. 13, 38–46. [DOI] [PMC free article] [PubMed] [Google Scholar]
- McAuley MT, Kenny RA, Kirkwood TBL, Wilkinson DJ, Jones JJL, Miller VM (2009) A mathematical model of aging‐related and cortisol induced hippocampal dysfunction. BMC Neurosci. 10, 26. [DOI] [PMC free article] [PubMed] [Google Scholar]
- Mehra VC, Ramgolam VS, Bender JR (2005) Cytokines and cardiovascular disease. J. Leukoc. Biol. 78, 805–818. [DOI] [PubMed] [Google Scholar]
- Meinshausen N, Bühlmann P (2006) High‐dimensional graphs and variable selection with the Lasso. Ann. Stat. 34, 1436–1462. [Google Scholar]
- Meinshausen N, Bühlmann P (2010) Stability selection. J. R. Stat. Soc. Ser. B (Statistical Methodol. 72, 417–473. [Google Scholar]
- Meissner A (2010) Epigenetic modifications in pluripotent and differentiated cells. Nat. Biotechnol. 28, 1079–1088. [DOI] [PubMed] [Google Scholar]
- Menni C, Fauman E, Erte I, Perry JRB, Kastenmüller G, Shin SY, Petersen AK, Hyde C, Psatha M, Ward KJ, Yuan W, Milburn M, Palmer CNA, Frayling TM, Trimmer J, Bell JT, Gieger C, Mohney RP, Brosnan MJ, Suhre K, Soranzo N, Spector TD (2013a) Biomarkers for type 2 diabetes and impaired fasting glucose using a nontargeted metabolomics approach. Diabetes 62, 4270–4276. [DOI] [PMC free article] [PubMed] [Google Scholar]
- Menni C, Kastenmüller G, Petersen AK, Bell JT, Psatha M, Tsai P‐C, Gieger C, Schulz H, Erte I, John S, Brosnan MJ, Wilson SG, Tsaprouni L, Lim EM, Stuckey B, Deloukas P, Mohney R, Suhre K, Spector TD, Valdes AM (2013b) Metabolomic markers reveal novel pathways of ageing and early development in human populations. Int. J. Epidemiol. 42, 1111–1119. [DOI] [PMC free article] [PubMed] [Google Scholar]
- Menni C, Kiddle SJ, Mangino M, Vinuela A, Psatha M, Steves C, Sattlecker M, Buil A, Newhouse S, Nelson S, Williams S, Voyle N, Soininen H, Kloszewska I, Mecocci P, Tsolaki M, Vellas B, Lovestone S, Spector TD, Dobson R, Valdes AM (2015) Circulating proteomic signatures of chronological age. J. Gerontol. Ser. A Biol. Sci. Med. Sci. 70, 809–816. [DOI] [PMC free article] [PubMed] [Google Scholar]
- Miller JA, Oldham MC, Geschwind DH (2008) A systems level analysis of transcriptional changes in Alzheimer's disease and normal aging. J. Neurosci. 28, 1410–1420. [DOI] [PMC free article] [PubMed] [Google Scholar]
- Mitnitski A, Song X, Rockwood K (2013) Assessing biological aging: the origin of deficit accumulation. Biogerontology 14, 709–717. [DOI] [PMC free article] [PubMed] [Google Scholar]
- Moayyeri A, Hammond CJ, Valdes AM, Spector TD (2013) Cohort profile: TwinsUK and healthy ageing twin study. Int. J. Epidemiol. 42, 76–85. [DOI] [PMC free article] [PubMed] [Google Scholar]
- Mungreiphy NK, Kapoor S, Sinha R (2011) Association between BMI, blood pressure, and age: study among tangkhul naga tribal males of northeast India. J. Anthropol. 2011, 1–6. [Google Scholar]
- Murabito JM, Yuan R, Lunetta KL (2012) The search for longevity and healthy aging genes: insights from epidemiological studies and samples of long‐lived individuals. J. Gerontol. A Biol. Sci. Med. Sci. 67, 470–479. [DOI] [PMC free article] [PubMed] [Google Scholar]
- Nakajima K, Takeoka M, Mori M, Hashimoto S, Sakurai A, Nose H, Higuchi K, Itano N, Shiohara M, Oh T, Taniguchi S (2010) Exercise effects on methylation of ASC gene. Int. J. Sports Med. 31, 671–675. [DOI] [PubMed] [Google Scholar]
- Nebel A, Kleindorp R, Caliebe A, Nothnagel M, Blanché H, Junge O, Wittig M, Ellinghaus D, Flachsbart F, Wichmann HE, Meitinger T, Nikolaus S, Franke A, Krawczak M, Lathrop M, Schreiber S (2011) A genome‐wide association study confirms APOE as the major gene influencing survival in long‐lived individuals. Mech. Ageing Dev. 132, 324–330. [DOI] [PubMed] [Google Scholar]
- Oda K, Kitano H (2006) A comprehensive map of the toll‐like receptor signaling network. Mol. Syst. Biol. 2, 2006.0015. [DOI] [PMC free article] [PubMed] [Google Scholar]
- Oda K, Matsuoka Y, Funahashi A, Kitano H (2005) A comprehensive pathway map of epidermal growth factor receptor signaling. Mol. Syst. Biol. 1, 2005.0010. [DOI] [PMC free article] [PubMed] [Google Scholar]
- Oeppen J, Vaupel JW (2002) Demography. Broken limits to life expectancy. Science 296, 1029–1031. [DOI] [PubMed] [Google Scholar]
- Office for National Statistics (2014) Historic and Projected Data from the Period and Cohort Life Tables, 2012‐based revised. Available at: http://www.ons.gov.uk/ons/publications/re-reference-tables.html?edition=tcm:77-355125.
- Orešič M, Hyötyläinen T, Herukka S‐K, Sysi‐Aho M, Mattila I, Seppänan‐Laakso T, Julkunen V, Gopalacharyulu PV, Hallikainen M, Koikkalainen J, Kivipelto M, Helisalmi S, Lötjönen J, Soininen H (2011) Metabolome in progression to Alzheimer's disease. Transl. Psychiatry 1, e57. [DOI] [PMC free article] [PubMed] [Google Scholar]
- Pagel P, Kovac S, Oesterheld M, Brauner B, Dunger‐Kaltenbach I, Frishman G, Montrone C, Mark P, Stümpflen V, Mewes H‐W, Ruepp A, Frishman D (2005) The MIPS mammalian protein‐protein interaction database. Bioinformatics 21, 832–834. [DOI] [PubMed] [Google Scholar]
- Patti GJ, Yanes O, Siuzdak G (2012) Innovation: metabolomics: the apogee of the omics trilogy. Nat. Rev. Mol. Cell Biol. 13, 263–269. [DOI] [PMC free article] [PubMed] [Google Scholar]
- Petersen AK, Zeilinger S, Kastenmüller G, Werner RM, Brugger M, Peters A, Meisinger C, Strauch K, Hengstenberg C, Pagel P, Huber F, Mohney RP, Grallert H, Illig T, Adamski J, Waldenberger M, Gieger C, Suhre K (2014) Epigenetics meets metabolomics: an epigenome‐wide association study with blood serum metabolic traits. Hum. Mol. Genet. 23, 534–545. [DOI] [PMC free article] [PubMed] [Google Scholar]
- Peterson J, Garges S, Giovanni M, McInnes P, Wang L, Schloss JA, Bonazzi V, McEwen JE, Wetterstrand KA, Deal C, Baker CC, Di Francesco V, Howcroft TK, Karp RW, Lunsford RD, Wellington CR, Belachew T, Wright M, Giblin C, David H, Mills M, Salomon R, Mullins C, Akolkar B, Begg L, Davis C, Grandison L, Humble M, Khalsa J, Little AR, Peavy H, Pontzer C, Portnoy M, Sayre MH, Starke‐Reed P, Zakhari S, Read J, Watson B, Guyer M (2009) The NIH human microbiome project. Genome Res. 19, 2317–2323. [DOI] [PMC free article] [PubMed] [Google Scholar]
- Portela A, Esteller M (2010) Epigenetic modifications and human disease. Nat. Biotechnol. 28, 1057–1068. [DOI] [PubMed] [Google Scholar]
- Proctor CJ, Soti C, Boys RJ, Gillespie CS, Shanley DP, Wilkinson DJ, Kirkwood TBL (2005) Modelling the actions of chaperones and their role in ageing. Mech. Ageing Dev. 126, 119–131. [DOI] [PubMed] [Google Scholar]
- Przybilla J, Rohlf T, Loeffler M, Galle J (2014) Understanding epigenetic changes in aging stem cells ‐ a computational model approach. Aging Cell 13, 320–328. [DOI] [PMC free article] [PubMed] [Google Scholar]
- Pucić M, Knezević A, Vidic J, Adamczyk B, Novokmet M, Polasek O, Gornik O, Supraha‐Goreta S, Wormald MR, Redzić I, Campbell H, Wright A, Hastie ND, Wilson JF, Rudan I, Wuhrer M, Rudd PM, Josić D, Lauc G (2011) High throughput isolation and glycosylation analysis of IgG‐variability and heritability of the IgG glycome in three isolated human populations. Mol. Cell Proteomics 10, M111.010090. [DOI] [PMC free article] [PubMed] [Google Scholar]
- Rattan SIS (2006) Theories of biological aging: genes, proteins, and free radicals. Free Radic. Res. 40, 1230–1238. [DOI] [PubMed] [Google Scholar]
- Ravikumar P, Wainwright MJ, Lafferty JD (2010) High‐dimensional Ising model selection using ℓ 1 ‐regularized logistic regression. Ann. Stat. 38, 1287–1319. [Google Scholar]
- Reeve A, Simcox E, Turnbull D (2014) Ageing and Parkinson's disease: why is advancing age the biggest risk factor?. Ageing Res. Rev. 14C, 19–30. [DOI] [PMC free article] [PubMed] [Google Scholar]
- Rockwood K, Mitnitski A (2007) Frailty in relation to the accumulation of deficits. J. Gerontol. Ser. A Biol. Sci. Med. Sci. 62, 722–727. [DOI] [PubMed] [Google Scholar]
- Rodwell GEJ, Sonu R, Zahn JM, Lund J, Wilhelmy J, Wang L, Xiao W, Mindrinos M, Crane E, Segal E, Myers BD, Brooks JD, Davis RW, Higgins J, Owen AB, Kim SK (2004) A transcriptional profile of aging in the human kidney. PLoS Biol. 2, e427. [DOI] [PMC free article] [PubMed] [Google Scholar]
- Round JL, Mazmanian SK (2009) The gut microbiota shapes intestinal immune responses during health and disease. Nat. Rev. Immunol. 9, 313–323. [DOI] [PMC free article] [PubMed] [Google Scholar]
- Royle L, Campbell MP, Radcliffe CM, White DM, Harvey DJ, Abrahams JL, Kim Y‐G, Henry GW, Shadick NA, Weinblatt ME, Lee DM, Rudd PM, Dwek RA (2008) HPLC‐based analysis of serum N‐glycans on a 96‐well plate platform with dedicated database software. Anal. Biochem. 376, 1–12. [DOI] [PubMed] [Google Scholar]
- Scutari M (2010) Learning Bayesian networks with the bnlearn R package. J. Stat. Softw. 35, 1–22.21603108 [Google Scholar]
- Sebastiani P, Solovieff N, Dewan AT, Walsh KM, Puca A, Hartley SW, Melista E, Andersen S, Dworkis DA, Wilk JB, Myers RH, Steinberg MH, Montano M, Baldwin CT, Hoh J, Perls TT (2012) Genetic signatures of exceptional longevity in humans. PLoS ONE 7, e29848. [DOI] [PMC free article] [PubMed] [Google Scholar]
- Shannon P, Markiel A, Ozier O, Baliga NS, Wang JT, Ramage D, Amin N, Schwikowski B, Ideker T (2003) Cytoscape: a software environment for integrated models of biomolecular interaction networks. Genome Res. 13, 2498–2504. [DOI] [PMC free article] [PubMed] [Google Scholar]
- Shin S‐Y, Fauman EB, Petersen A‐K, Krumsiek J, Santos R, Huang J, Arnold M, Erte I, Forgetta V, Yang T‐P, Walter K, Menni C, Chen L, Vasquez L, Valdes AM, Hyde CL, Wang V, Ziemek D, Roberts P, Xi L, Grundberg E, Waldenberger M, Richards JB, Mohney RP, Milburn MV, John SL, Trimmer J, Theis FJ, Overington JP, Suhre K, Brosnan MJ, Gieger C, Kastenmüller G, Spector TD, Soranzo N (2014) An atlas of genetic influences on human blood metabolites. Nat. Genet. 46, 543–550. [DOI] [PMC free article] [PubMed] [Google Scholar]
- Shmulevich I, Dougherty ER, Kim S, Zhang W (2002) Probabilistic Boolean networks: a rule‐based uncertainty model for gene regulatory networks. Bioinformatics 18, 261–274. [DOI] [PubMed] [Google Scholar]
- Smith JD (2002) Apolipoproteins and aging: emerging mechanisms. Ageing Res. Rev. 1, 345–365. [DOI] [PubMed] [Google Scholar]
- Sozou PD, Kirkwood TB (2001) A stochastic model of cell replicative senescence based on telomere shortening, oxidative stress, and somatic mutations in nuclear and mitochondrial DNA. J. Theor. Biol. 213, 573–586. [DOI] [PubMed] [Google Scholar]
- Steuer R (2006) Review: on the analysis and interpretation of correlations in metabolomic data. Brief. Bioinform. 7, 151–158. [DOI] [PubMed] [Google Scholar]
- Subramanian A, Tamayo P, Mootha VK, Mukherjee S, Ebert BL, Gillette MA, Paulovich A, Pomeroy SL, Golub TR, Lander ES, Mesirov JP (2005) Gene set enrichment analysis: a knowledge‐based approach for interpreting genome‐wide expression profiles. Proc. Natl Acad. Sci. U. S. A. 102, 15545–15550. [DOI] [PMC free article] [PubMed] [Google Scholar]
- Suhre K, Meisinger C, Döring A, Altmaier E, Belcredi P, Gieger C, Chang D, Milburn MV, Gall WE, Weinberger KM, Mewes H‐W, Hrabé de Angelis M, Wichmann H‐E, Kronenberg F, Adamski J, Illig T (2010) Metabolic footprint of diabetes: a multiplatform metabolomics study in an epidemiological setting. PLoS ONE 5, e13953. [DOI] [PMC free article] [PubMed] [Google Scholar]
- Swardfager W, Lanctôt K, Rothenburg L, Wong A, Cappell J, Herrmann N (2010) A meta‐analysis of cytokines in Alzheimer's disease. Biol. Psychiatry 68, 930–941. [DOI] [PubMed] [Google Scholar]
- Tacutu R, Shore DE, Budovsky A, de Magalhães JP, Ruvkun G, Fraifeld VE, Curran SP (2012) Prediction of C. elegans longevity genes by human and worm longevity networks. PLoS ONE 7, 4–12. [DOI] [PMC free article] [PubMed] [Google Scholar]
- Tacutu R, Craig T, Budovsky A, Wuttke D, Lehmann G, Taranukha D, Costa J, Fraifeld VE, de Magalhães JP (2013) Human ageing genomic resources: integrated databases and tools for the biology and genetics of ageing. Nucleic Acids Res. 41, D1027–D1033. [DOI] [PMC free article] [PubMed] [Google Scholar]
- Teicher BA, Linehan WM, Helman LJ (2012) Targeting cancer metabolism. Clin. Cancer Res. 18, 5537–5545. [DOI] [PMC free article] [PubMed] [Google Scholar]
- The Gtex Consortium (2013) The genotype‐tissue expression (GTEx) project. Nat. Genet. 45, 580–585. [DOI] [PMC free article] [PubMed] [Google Scholar]
- The Human Microbiome Project (2014a) NIH Human Microbiome Project defines normal bacterial makeup of the body. Available at: http://www.nih.gov/news/health/jun2012/nhgri-13.htm [Accessed June 3, 2014].
- The Human Microbiome Project (2014b) Reference Genomes Data. Available at: http://www.hmpdacc.org/HMRGD.
- Tur I, Castelo R (2012) Learning high‐dimensional mixed graphical models with missing values In Proceedings of the Sixth European Workshop on Probabilistic Graphical Models (A Cano, M Gomez‐Olmedo, TD Nielsen. ed.). Granada: DECSAI, University of Granada, pp. 323–330. [Google Scholar]
- Turnbaugh PJ, Ley RE, Hamady M, Fraser‐Liggett CM, Knight R, Gordon JI (2007) The human microbiome project. Nature 449, 804–810. [DOI] [PMC free article] [PubMed] [Google Scholar]
- Tzoulaki I, Ebbels TMD, Valdes A, Elliott P, Ioannidis JPA (2014) Design and analysis of metabolomics studies in epidemiological research: a primer on ‐omic technologies. Am. J. Epidemiol. 180, 129–139. Available at: http://www.ncbi.nlm.nih.gov/pubmed/24966222 [Accessed June 30, 2014]. [DOI] [PubMed] [Google Scholar]
- Valdes AM, Glass D, Spector TD (2013) Omics technologies and the study of human ageing. Nat. Rev. Genet. 14, 601–607. [DOI] [PubMed] [Google Scholar]
- Varki A, Cummings R, Esko J, Freeze H, Stanley P, Bertozzi C, Hart G, Etzler M (2009) Essentials of Glycobiology, 2nd edn The Consortium of Glycobiology Editors, ed., Cold Spring habour, NY: Cold Spring Harbor Laboratory; Auflage: 0002. Available at: http://www.ncbi.nlm.nih.gov/books/NBK1918/?report=reader [Accessed June 11, 2014]. [PubMed] [Google Scholar]
- Vijg J, Suh Y (2005) Genetics of longevity and aging. Annu. Rev. Med. 56, 193–212. [DOI] [PubMed] [Google Scholar]
- Wainwright MJ, Ravikumar P, Lafferty JD (2006) High‐dimensional graphical model selection using l1 ‐regularized logistic regression In Neural Information Processing Systems. (Schölkopf B. and Platt J.C. and Hoffman T., ed). Vancouver: MIT Press, pp 1465–1472. [Google Scholar]
- Wang J, Zhang S, Wang Y, Chen L, Zhang X‐S (2009) Disease‐aging network reveals significant roles of aging genes in connecting genetic diseases. PLoS Comput. Biol. 5, e1000521. [DOI] [PMC free article] [PubMed] [Google Scholar]
- Warming L, Hassager C, Christiansen C (2002) Changes in bone mineral density with age in men and women: a longitudinal study. Osteoporos. Int. 13, 105–112. [DOI] [PubMed] [Google Scholar]
- Weidner CI, Lin Q, Koch CM, Eisele L, Beier F, Ziegler P, Bauerschlag DO, Jöckel K‐H, Erbel R, Mühleisen TW, Zenke M, Brümmendorf TH, Wagner W (2014) Aging of blood can be tracked by DNA methylation changes at just three CpG sites. Genome Biol. 15, R24. [DOI] [PMC free article] [PubMed] [Google Scholar]
- Weinert BT, Timiras PS (2003) Invited review: theories of aging. J. Appl. Physiol. 95, 1706–1716. [DOI] [PubMed] [Google Scholar]
- West J, Beck S, Wang X, Teschendorff AE (2013) An integrative network algorithm identifies age‐associated differential methylation interactome hotspots targeting stem‐cell differentiation pathways. Sci. Rep. 3, 1630. [DOI] [PMC free article] [PubMed] [Google Scholar]
- Wieser D, Papatheodorou I, Ziehm M, Thornton JM (2011) Computational biology for ageing. Philos. Trans. R. Soc. Lond. B Biol. Sci. 366, 51–63. [DOI] [PMC free article] [PubMed] [Google Scholar]
- Wilhelm M, Schlegl J, Hahne H, Moghaddas Gholami A, Lieberenz M, Savitski MM, Ziegler E, Butzmann L, Gessulat S, Marx H, Mathieson T, Lemeer S, Schnatbaum K, Reimer U, Wenschuh H, Mollenhauer M, Slotta‐Huspenina J, Boese J‐H, Bantscheff M, Gerstmair A, Faerber F, Kuster B (2014) Mass‐spectrometry‐based draft of the human proteome. Nature 509, 582–587. [DOI] [PubMed] [Google Scholar]
- Willcox BJ, Donlon TA, He Q, Chen R, Grove JS, Yano K, Masaki KH, Willcox DC, Rodriguez B, Curb JD (2008) FOXO3A genotype is strongly associated with human longevity. Proc. Natl Acad. Sci. U. S. A. 105, 13987–13992. [DOI] [PMC free article] [PubMed] [Google Scholar]
- Wishart DS, Jewison T, Guo AC, Wilson M, Knox C, Liu Y, Djoumbou Y, Mandal R, Aziat F, Dong E, Bouatra S, Sinelnikov I, Arndt D, Xia J, Liu P, Yallou F, Bjorndahl T, Perez‐Pineiro R, Eisner R, Allen F, Neveu V, Greiner R, Scalbert A (2013) HMDB 3.0–the human metabolome database in 2013. Nucleic Acids Res. 41, D801–D807. [DOI] [PMC free article] [PubMed] [Google Scholar]
- Xenarios I, Salwínski L, Duan XJ, Higney P, Kim S‐M, Eisenberg D (2002) DIP, the database of interacting proteins: a research tool for studying cellular networks of protein interactions. Nucleic Acids Res. 30, 303–305. [DOI] [PMC free article] [PubMed] [Google Scholar]
- Xia J, Wishart DS (2010) MSEA: a web‐based tool to identify biologically meaningful patterns in quantitative metabolomic data. Nucleic Acids Res. 38, W71–W77. [DOI] [PMC free article] [PubMed] [Google Scholar]
- Xia K, Xue H, Dong D, Zhu S, Wang J, Zhang Q, Hou L, Chen H, Tao R, Huang Z, Fu Z, Chen Y‐G, Han J‐DJ (2006) Identification of the proliferation/differentiation switch in the cellular network of multicellular organisms. PLoS Comput. Biol. 2, e145. [DOI] [PMC free article] [PubMed] [Google Scholar]
- Xue H, Xian B, Dong D, Xia K, Zhu S, Zhang Z, Hou L, Zhang Q, Zhang Y, Han J‐DJ (2007) A modular network model of aging. Mol. Syst. Biol. 3, 147. [DOI] [PMC free article] [PubMed] [Google Scholar]
- Yang J‐H, Li J‐H, Jiang S, Zhou H, Qu L‐H (2013) ChIPBase: a database for decoding the transcriptional regulation of long non‐coding RNA and microRNA genes from ChIP‐Seq data. Nucleic Acids Res. 41, D177–D187. [DOI] [PMC free article] [PubMed] [Google Scholar]
- Yu H, Kim PM, Sprecher E, Trifonov V, Gerstein M (2007) The importance of bottlenecks in protein networks: correlation with gene essentiality and expression dynamics. PLoS Comput. Biol. 3, e59. [DOI] [PMC free article] [PubMed] [Google Scholar]
- Yu Z, Zhai G, Singmann P, He Y, Xu T, Prehn C, Römisch‐Margl W, Lattka E, Gieger C, Soranzo N, Heinrich J, Standl M, Thiering E, Mittelstraß K, Wichmann H‐E, Peters A, Suhre K, Li Y, Adamski J, Spector TD, Illig T, Wang‐Sattler R (2012) Human serum metabolic profiles are age dependent. Aging Cell 11, 960–967. [DOI] [PMC free article] [PubMed] [Google Scholar]
- Yuan M, Lin Y (2007) Model selection and estimation in the Gaussian graphical model. Biometrika 94, 19–35. [Google Scholar]
- Yuan Y, Li C‐T, Windram O (2011) Directed partial correlation: inferring large‐scale gene regulatory network through induced topology disruptions. PLoS ONE 6, e16835. [DOI] [PMC free article] [PubMed] [Google Scholar]
- Zhang B, Horvath S (2005) A general framework for weighted gene co‐expression network analysis. Stat. Appl. Genet. Mol. Biol. 4, Article17. [DOI] [PubMed] [Google Scholar]
- Zhu B, Wang X, Li L (2010) Human gut microbiome: the second genome of human body. Protein Cell 1, 718–725. [DOI] [PMC free article] [PubMed] [Google Scholar]
- Ziller MJ, Gu H, Müller F, Donaghey J, Tsai LT‐Y, Kohlbacher O, De Jager PL, Rosen ED, Bennett DA, Bernstein BE, Gnirke A, Meissner A (2013) Charting a dynamic DNA methylation landscape of the human genome. Nature 500, 477–481. [DOI] [PMC free article] [PubMed] [Google Scholar]