

Abstract
Objective
Multiple sclerosis (MS) is an inflammatory demyelinating disease of the central nervous system (CNS). Myeloid phagocytes, including blood monocytes recruited to demyelinating lesions, may play a dual role in MS: on one hand, they might enhance CNS damage after differentiating toward a proinflammatory phenotype; on the other, they promote remyelination and repair through effective phagocytosis of myelin debris. We have previously determined that the retinoid X receptor (RXR) plays an important role in monocyte phagocytosis of myelin. Peroxisome proliferator‐activated receptor γ is an RXR binding partner that plays a key role in myeloid cell biology and is targeted by the thiazolidinedione group of antidiabetics such as pioglitazone. Consequently, the purpose of this study was to determine if monocyte functions and differentiation profiles differ in MS patients compared to healthy volunteers (HV) and whether pioglitazone can reverse these differences to promote CNS recovery.
Methods
Monocytes were isolated from MS patients and HV (n ≥ 36/group), and their ability to phagocytose myelin and modulate inflammation in the presence/absence of 1 μmol/L pioglitazone (the in vivo achievable concentration) was quantified by flow cytometry, transcriptional profiling, and proteomic assays.
Results
MS monocytes display impaired phagocytosis of myelin debris and enhanced proinflammatory differentiation. Pioglitazone treatment causes partial normalization of identified monocyte abnormalities in MS and fully reverses the deficit in myelin phagocytosis.
Interpretation
These findings suggest that by inhibiting proinflammatory differentiation of monocytes and enhancing their phagocytosis of myelin, pioglitazone may be a useful adjunct therapy to immunomodulatory agents that target dysregulated adaptive immunity in MS.
Keywords: Anti‐inflammatory, monocytes, multiple sclerosis, myelin, pioglitazone
Introduction
Multiple sclerosis (MS) is the most common inflammatory demyelinating disease of the central nervous system (CNS), affecting more than 2 million people worldwide.1 In MS, the innate immune response is mainly mediated by microglia and circulating monocytes, recruited to MS inflammatory lesions. These cells may have dichotomous functions, participating in CNS tissue destruction2 and facilitating remyelination and repair.3 While monocytes/macrophages were found in animal studies to actively strip myelin from axons in early demyelinating lesions,4 it remains unclear, especially in MS, if phagocytosed myelin is functionally intact or already dysfunctional and therefore represents debris that needs to be cleared before effective remyelination can occur.5, 6
Myeloid cells are highly plastic and capable of differentiation toward two phenotypical extremes, called M1 (proinflammatory) and M2 (anti‐inflammatory), although in vivo situations always comprise some combination of both.7 Consequently, in vivo monocytes/macrophages display a continuum of activation states.8 In animal models of MS, proinflammatory monocytes worsen neurological symptoms,9 whereas the release of anti‐inflammatory cytokines and recruitment of immunoregulatory monocytes has been shown to reduce disability.10 These anti‐inflammatory monocytes may not only regulate inflammation in MS but also promote repair through the release of growth factors.11, 12, 13
We have previously shown that one key target for promoting myelin debris phagocytosis in impaired aging models is the retinoid X receptor (RXR).14 However, RXR activation only partially recovered myelin debris phagocytosis and RXR inhibition did not completely impair remyelination in young subjects, suggesting that other factors, such as modulation of specific binding partners of RXR, may be playing a role in myelin debris clearance. One permissive binding partner, peroxisome proliferator‐activated receptor γ (PPARγ), has been shown to modulate inflammation in atherosclerotic foam cell macrophages and leads to a more anti‐inflammatory phenotype,15, 16 while also reducing lesion formation in MS.17, 18 In addition, activating both RXR and its permissive binding partners has been shown to have a synergistic effect on gene transcription.19, 20, 21 Therefore, the aim of this study was to determine the functional and molecular differences between healthy volunteer (HV) and MS patient monocytes, and identify the effects of PPARγ activation via pioglitazone on monocyte phenotype, differentiation and functions, including myelin phagocytosis.
Methods
Subjects
Studies were performed according to U.S. National Institutes of Health guidelines and all subjects signed informed consent. Study subjects were grouped into young HV (≤35 years old, n = 36), old HV (≥55 years old, n = 36), or MS patients (n = 70). MS patients were diagnosed based on the 2010 revisions of the McDonald diagnostic criteria22; demographic data are presented in Figure S1. Results from monocytes from this cohort of subjects, pertaining to their role in phagocytosis, have previously been presented.14
Human monocyte isolation
Peripheral blood mononuclear cells were isolated from whole blood using lymphocyte separation medium (Lonza, Basel, Switzerland). CD14+ monocytes were isolated by positive selection (MACS Miltenyi, San Diego, CA). Monocytes were plated in 6‐well plates (1 × 10⁶/well [for RNA isolation and supernatant collection]) or in 96‐well plates (1 × 10⁵/well [for flow cytometry]) in X‐vivo without phenol red (Lonza). Pioglitazone (Sigma) has an oral dose of 30 mg/day with C max = 800 ng/mL, ~2 μmol/L.23 We selected the in vivo achievable 1 μmol/L concentration. Bexarotene was used as described in Natrajan et al.14
Myelin isolation
Brain tissue from a postmortem primary progressive MS patient was used for myelin isolation as described.24 Myelin pellets were resuspended in PBS1X and stored at −80°C. For flow cytometry, myelin was labeled with pHrodo Green STP Ester (Life Technologies, Carlsbad, CA) according to manufacturer's instructions, as its fluorescence is specifically activated in the low pH of the phagosome.25
Microarrays and ingenuity pathway analysis
Monocytes were used from two donor groups (Young HV and MS patients; n = 4/group) with three conditions: resting (no treatment), phagocytosing (treated with myelin, 10 μg/mL), and pioglitazone‐treated (1 μmol/L) phagocytosing (phagocytosing + pio). After 2 h, cells were collected in Trizol (Invitrogen, Carlsbad, CA) and stored at −80°C until RNA isolations using a miRNeasy kit (Qiagen, Germantown, MD). Microarrays analysis was performed by the NHGRI Microarray Core Facility; the details are described in Data S1.
Flow cytometry
Monocytes were incubated with 1 μmol/L pioglitazone or dimethyl sulfoxide/phosphate buffered saline (DMSO/PBS) for 1 h at 37°C. Cells were stained with CD14‐APC (eBioscience, San Diego, CA, 17‐0149, 1:500) for 10 min at 37°C. Cells were resuspended in warm X‐vivo (Lonza). 10 μg/mL pHrodo‐labeled myelin was added to phagocytosing groups for 20 min at 37°C. Cold FACS buffer was then added and cells were analyzed immediately on a BD‐LSR II flow cytometer using BD‐FACSDiva 6.1 software (BD, Franklin Lakes, NJ). Gating for myelin was based on non‐phagocytosing controls and expression of surface markers was based on comparison of mean fluorescence intensity (MFI). Phagocytosis index = (FITC+ fluorescence in treated groups)/(FITC+ fluorescence in nonphagocytosing controls).
Electrochemiluminescence immunoassays
Electrochemiluminescence immunoassays (ECLIA) were developed and optimized to quantify the concentrations of sCD14 in cell culture supernatants using the MesoScale Discovery system as described26 (see also Data S1).
SOMAscan
SOMAscan (SomaLogic, Boulder, CO) is a multiplexed proteomic analysis using 1128 protein‐capture SOMAmers (Slow Off‐rate Modified Aptamers) – single‐stranded, chemically‐modified DNA molecules that play a dual role of protein affinity‐binding reagents and a DNA sequence recognized by complementary probes.27, 28, 29 SOMAmers, selected against proteins in their native conformations, cover secreted and intracellular/extracellular proteins, including receptors, cytokines, kinases, proteases, growth factors, and hormones. We employed SOMAscan to analyze 75 μL of supernatants from resting controls, myelin‐phagocytosing and pioglitazone‐treated phagocytosing MS monocytes (n = 3/group) pooled for duplicates (n = 6/group total).
ELISA validation
SOMAscan results were validated using supernatants from HV and MS monocytes (resting, myelin‐phagocytosing, pioglitazone‐treated phagocytosing, n = 26/group) using commercial enzyme‐linked immunosorbent assays (ELISAs) (C3: ab108822, TIMP metallopeptidase inhibitor 1 (TIMP‐1): ab100651, and matrix metalloproteinase 9 (MMP‐9): ab100610; Abcam, Cambridge, UK), each sample analyzed in duplicate. Protein concentration was estimated by four‐parameter logistic curve.
Human M1/M2 macrophage cultures
The detailed protocol for M1/M2 differentiation is schematically depicted in Figure S2. Cells were resuspended in X‐vivo and 1 × 10⁵ cells/treatment group were stained with CD163‐PE (R&D, FAB1607P, 1:250) and CD11b‐APC (eBioscience, 9017‐0118, 1:300) for 15 min at 37°C. After staining, 10 μg/mL pHrodo labeled myelin was added to phagocytosing groups for 20 min/37°C. Cells were washed and fixed (BD Cytofix, BD) for 20 min at 4°C. Plates were centrifuged (250g/4°C/5 min) and washed twice before acquisition on a BD LSRII flow cytometer using FACSDiva 6.1 Software.
Statistics
For flow cytometry and ELISAs, power analysis was conducted (nQuery program) using an internal pilot study. Based on a significance level of 0.05, a sample size of 18 subjects was required to have 80% power for detecting the difference between pre and posttreatment using a paired t‐test.
Seven outcome measures were collected: phagocytosis index (MFI), surface CD14 (MFI), surface CD163 (MFI), sCD14 (pg/mL), C3 (ng/mL), TIMP‐1 (pg/mL), and MMP‐9 (pg/mL). There were two levels in the diagnosis group (MS and HV), and three levels in treatment groups for all outcome measures (resting, phagocytosing, and pioglitazone‐treated) except for M1/M2 macrophage cultures in which there were two levels (phagocytosing and pioglitazone). Inverse transformation was applied to M1/M2 macrophage cultures, and log transformation was applied to MMP‐9 ELISAs. Data are presented by mean ± standard error or confidence intervals in all graphs. A two‐way repeated measures analysis of variance (ANOVA) with heterogeneous compound symmetry covariance structure was used to examine the effect of diagnosis group, treatment, and the interaction between them. Pairwise comparisons among group and treatment combinations were conducted with Tukey's correction procedure. For myelin phagocytosis (Untreated only), analysis of covariance (ANCOVA) was performed to evaluate the effect of diagnosis group (MS vs. HV) with age as a covariate. The assumption of homogeneous regression slopes was examined by testing the interaction between diagnosis group and age. SAS 9.2 (SAS, Cary, NC) and Graphpad Prism (Graphpad, La Jolla, CA) software were used for the statistical analysis and P < 0.05 was used as the significance level.
Results
Monocytes from MS patients display reduced myelin debris phagocytosis, which is not age‐dependent
We have previously shown that in HV, efficacy of myelin phagocytosis declines with age and that MS patients have decreased myelin phagocytosis.14 The surprising observation was that age played no significant role in the efficacy of myelin phagocytosis in MS, such that both young (≤35 years old) and old (≥55 years old) MS patients exhibited a similar, ~25% decrease, in myelin phagocytosis in comparison to young (≤35 years old) HV (Fig. 1A and B). Analogously, while we measured significant negative correlation between efficacy of myelin phagocytosis and age in HV, there was no relationship between age and myelin phagocytosis index in MS (Fig. 1C). Consequently, we merged MS patients into a single group for further studies.
Figure 1.
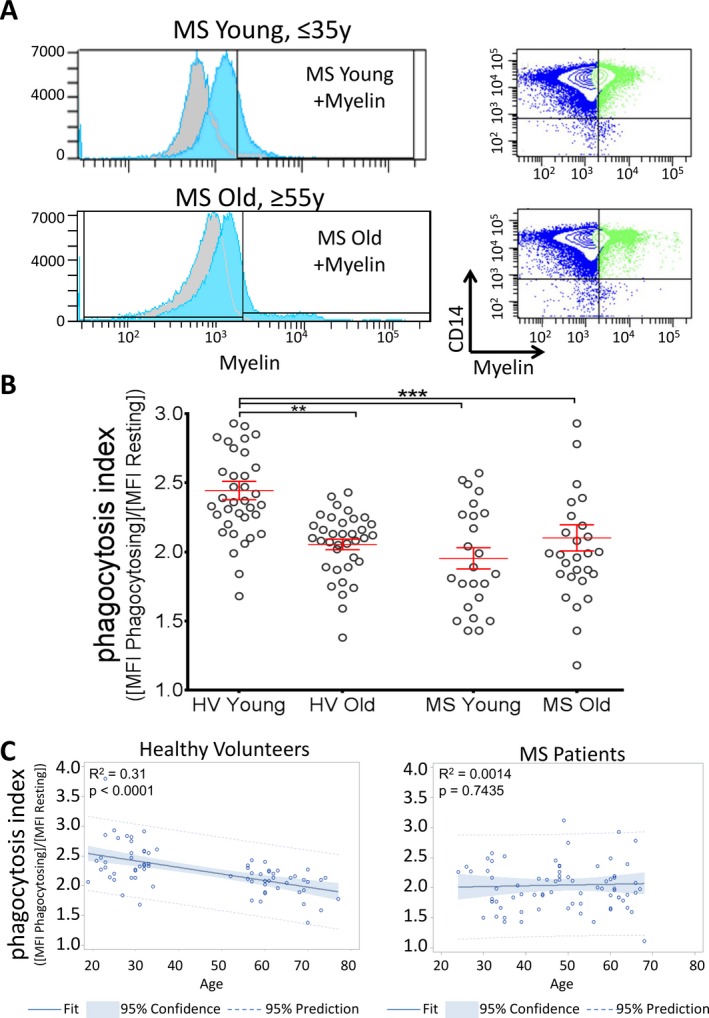
Myelin debris phagocytosis is reduced in MS patient monocytes. (A) Monocytes from young (≤35 years old, n = 36) and old (≥55 years old, n = 36) HV were treated with myelin debris, and phagocytosis was compared to young and old MS patients. Myelin+ gate was determined by non‐phagocytosing resting cells (gray background plots). (B) Monocytes from MS patients show significantly impaired myelin debris phagocytosis by flow cytometry regardless of age, in both young (phagocytosis index = 1.95 ± 0.12, n = 24) and old (2.10 ± 0.09, n = 51) MS groups compared to young HV (2.44 ± 0.07). HV Young versus Old data previously presented.14 Phagocytosis index = (MFI myelin‐phagocytosing monocytes/MFI resting monocytes). Adjusted P‐values for pairwise comparisons in a two‐way repeated measures ANOVA with Tukey's test. Mean ± SEM, **P < 0.01, ***P < 0.001. Data are also presented in Figure 6. (C) When age is treated as a continuous variable, there is a linear correlation among HV, with a decline in phagocytosis with age; R 2 = 0.31, P < 0.0001. However, in MS, there is no correlation between phagocytosis and age. ANCOVA and linear regression model, R 2 = 0.0014, P = 0.74. MS, multiple sclerosis; HV, healthy volunteers; MFI, mean fluorescence intensity; ANOVA, analysis of variance; ANCOVA, analysis of covariance.
Transcriptional profiling identifies baseline differences in mRNA expression between MS and HV monocytes, with MS monocytes skewed toward a proinflammatory phenotype
Microarrays were used to determine if the functional defect in MS monocytes resulted from baseline transcriptional variations in monocyte profiles. RNA was isolated from MS and HV monocytes (n = 4/group) before and after myelin debris phagocytosis.
The principal component analysis revealed that disease status was a greater determinant of independent clustering than myelin debris phagocytosis (Fig. 2A), with highly significant differences seen between MS patients and HV, irrespective of myelin phagocytosis. Ingenuity pathway analysis identified that the most highly expressed pathways in MS were involved in inflammatory functions previously identified as important for MS pathogenesis, including IL‐17 signaling,1, 30 expression of pattern recognition receptors, and chemokine/cytokine signaling (Fig. 2B, Table S1).
Figure 2.
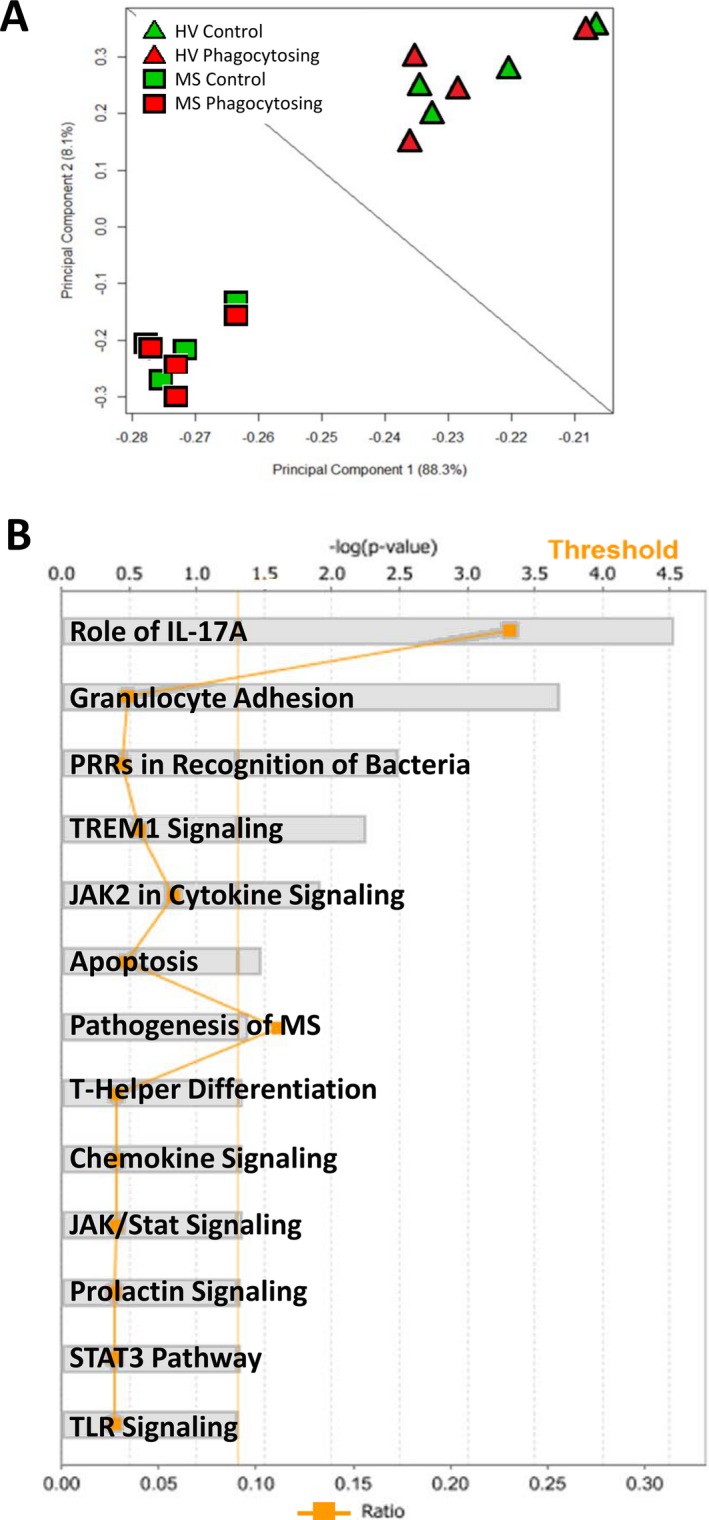
Monocytes from MS patients cluster independently from HV and display enhanced inflammatory pathways. Microarrays were used to compare MS patient monocytes to monocytes from HV. (A) A principal component analysis clearly distinguishes independent clustering of MS patient monocytes and HV. (B) Canonical pathways significantly upregulated in MS patient monocytes were determined by Ingenuity Pathway Analysis. Several of these top pathways are important in proinflammatory functions of monocytes (IL‐17 signaling, bacterial recognition, TLR signaling, pathogenesis of MS) (see Supplementary References). All pathways achieved a threshold greater than 1% (straight orange line). Ratios for number of genes in the pathway enriched in the dataset compared to total number of known genes in the pathway are represented by the jagged orange line. Two‐way ANOVA under Benjamini‐Hochberg, False Discovery Rate, Matthew's Correlation Coefficient (BH FDR MCC) with Tukey's test. P < 0.05, n = 4/group. MS, multiple sclerosis; HV, healthy volunteers; ANOVA, analysis of variance.
Pioglitazone treatment reduces inflammation by enhancing expression and release of anti‐inflammatory markers in MS patient phagocytes
Based on the observation of baseline proinflammatory phenotypes in MS‐derived monocytes, we investigated the effects of physiological concentrations of a PPARγ activator (pioglitazone; 1 μmol/L) on inflammatory phenotype and myelin debris phagocytosis, again using expression profiling.
Pioglitazone‐treated phagocytosing monocytes were compared to untreated cells from both MS and HV, using a stringent analysis, which considered only genes where all samples (n = 4/group) displayed consistent expression levels and were significantly different from untreated groups. This analysis yielded only eight highly specific genes affected by pioglitazone treatment in MS monocytes, all having a functional relationship to the proinflammatory CD14 pathway (Fig. 3A). Pioglitazone increased the expression levels of these eight immunoregulatory genes in MS patient monocytes to the levels seen in HV (Fig. 3B). Reduced PPARγ expression in MS monocytes and the transcriptional effects of pioglitazone were validated with qPCR and PPAR PCR Arrays (Fig. S3).
Figure 3.
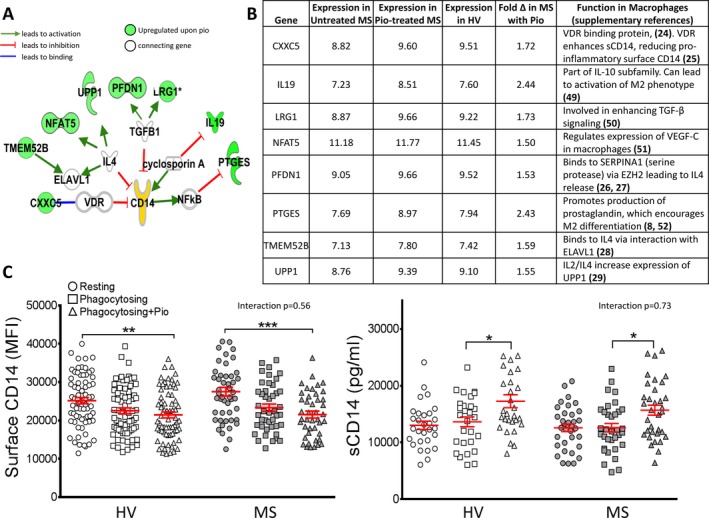
Pioglitazone treatment upregulates genes related to immunoregulation and causes shedding of proinflammatory CD14. Microarrays were used to compare MS patient monocytes and monocytes from HV to those treated with pioglitazone. (A) Eight genes were significantly upregulated in all pioglitazone‐treated phagocytosing MS monocytes and reached expression levels comparable to HV. The connections between these genes and the proinflammatory marker CD14 are mapped here, with all eight genes related to anti‐inflammatory functions in macrophages. Green = upregulated upon pioglitazone treatment. Two‐way ANOVA under BH FDR MCC with Tukey's test. P < 0.05, n = 4/group. (B) Gene function related to immunoregulatory pathways. (C) Surface CD14 and soluble CD14 (sCD14) were determined both before and after pioglitazone treatment. Surface expression was significantly reduced in pioglitazone‐treated, myelin‐phagocytosing monocytes compared to resting controls in HV (n = 36) and MS patients (n = 44). Pioglitazone treatment significantly increased sCD14 levels in MS patients (15.8 ± 1.0 ng/mL) and HV (17.3 ± 1.1 ng/mL) compared to myelin‐phagocytosing cells in MS (12.7 ± 0.7 ng/mL) and HV (13.5 ± 0.8 ng/mL) groups (n = 30/group). Adjusted P‐values for pairwise comparisons in a two‐way repeated measures ANOVA with Tukey's test. Mean ± SEM, *P < 0.05, **P < 0.01, ***P < 0.001. MS, multiple sclerosis; HV, healthy volunteers; ANOVA, analysis of variance.
Due to the increased expression of CD14‐related immunoregulatory genes upon pioglitazone treatment, we studied the effects of pioglitazone on CD14 expression. Surface CD14 is identified as an inflammatory marker on monocytes,31, 32 whereas shed soluble CD14 (sCD14) is associated with reduced inflammatory activity.33, 34 Surface CD14 was significantly reduced upon pioglitazone treatment, whereas higher sCD14 levels were detected in the supernatants of pioglitazone‐treated monocytes compared to phagocytosing controls in both cohorts (Fig. 3C). Interestingly, phagocytosis of myelin debris itself demonstrated a tendency for monocytes to downmodulate surface CD14 and upregulate sCD14 in the supernatants, even though these changes did not reach statistical significance. Nevertheless, it suggests that myelin phagocytosis in the absence of a proinflammatory environment differentiates monocytes to a healing‐promoting phenotype.
Proteomic analysis of monocyte‐derived supernatants confirms broad immunomodulatory effects of pioglitazone on human monocytes
Since biomarkers can be used as pharmacodynamic markers of a drug's in vivo efficacy, we studied monocyte‐secreted markers using multiplex proteomic SOMAscan technology (SomaLogic). Pioglitazone‐treated phagocytosing MS monocytes showed at least >25% change in 47 molecules compared to resting cells (Fig. 4A, Table S2). Of these, 35 proteins display at least a >1.5‐fold up/downregulation. When plotting the relevance of these proteins in inflammatory functions, 27 pioglitazone‐induced proteins have an anti‐inflammatory function in monocytes while the eight remaining modified proteins are proinflammatory, as mapped by Ingenuity Pathway Analysis (Fig. 4B). Specifically, pioglitazone inhibits secretion of MS‐related proinflammatory proteins MMP‐9 and SLAMF7.35, 36 In contrast, pioglitazone increases release of complement component 3 (C3) (which plays a role in enhancing myelin debris clearance and resolving CNS inflammation37, 38), the anti‐inflammatory chemokines CCL2, CCL7, and CCL18, TIMP‐1 (an inhibitor of MMP‐9), and BMPR1A, a member of the growth‐promoting TGF‐β family. In fact, pioglitazone induces several proteins related to TGF‐β signaling (Table S2).
Figure 4.
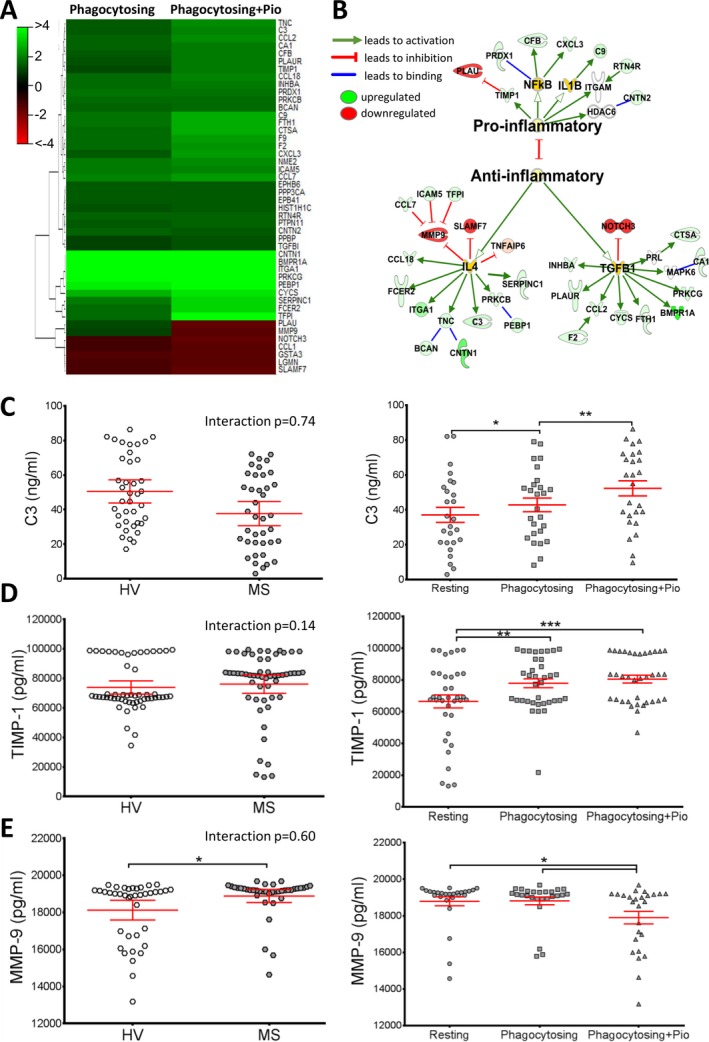
Pioglitazone treatment enhances release of immunoregulatory (anti‐inflammatory) proteins by MS patient monocytes. SOMAscan technology was used to compare protein expression in supernatants from myelin‐phagocytosing MS patient monocytes before and after pioglitazone treatment. (A) Heat map representing 46 proteins with a >25% change upon myelin phagocytosis (left column) and phagocytosing + pio treatment (right column) in MS monocytes. (B) Those proteins highly altered after pioglitazone treatment (>1.5‐fold change) are mapped, indicating activation of anti‐inflammatory (27 proteins) or proinflammatory signaling (8 proteins). n = 6/group. (C) Three proteins were validated by ELISA. HV monocytes trend toward a slightly higher C3 concentration (50.5 ± 4.8 ng/mL) than MS (37.6 ± 5.7 ng/mL) (n.s.). C3 release significantly increased upon phagocytosis (43.5 ± 4.0 ng/mL) and further upon pioglitazone treatment (51.9 ± 4.0 ng/mL), confirming the SomaLogic results. (D) TIMP‐1 levels showed no difference between HV and MS, but displayed a significant increase upon both myelin phagocytosis (77.9 ± 2.8 ng/mL) and pioglitazone treatment (80.5 ± 2.4 ng/mL). (E) Conversely, MMP‐9 release was significantly lower in HV (18.1 ± 0.5 ng/mL) compared to MS patients (18.9 ± 0.4 ng/mL). It was significantly reduced after pioglitazone treatment (17.9 ± 0.7 ng/mL) compared to myelin‐phagocytosing (18.8 ± 0.4 ng/mL) monocytes. MMP‐9 data had a large kurtosis and was log transformed. Adjusted P‐values for pairwise comparisons in a two‐way repeated measures ANOVA with Tukey's test. Mean ± 95% CI, *P < 0.05, **P < 0.01, ***P < 0.001, n = 26/group. MS, multiple sclerosis; ELISA, enzyme‐linked immunosorbent assays; HV, healthy volunteer; ANOVA, analysis of variance.
To confirm the results from the SOMAscan, three representative molecules, two upregulated and one downregulated by pioglitazone, were validated in HV and MS monocyte supernatants. C3, upregulated upon pioglitazone treatment and chosen due its role in immunoregulation and myelin debris clearance, had a tendency to be released more by HV monocytes compared to MS monocytes, although this did not reach statistical significance. However, myelin phagocytosis increased C3 secretion, and pioglitazone had a further enhancing effect (Fig. 4C). MMP‐9, a matrix metalloproteinase associated with the opened blood brain barrier in MS, and its inhibitor, TIMP‐1, were chosen due to their validated relationship to the MS disease process.39, 40 TIMP‐1 showed no statistical difference between HV and MS monocytes, but was significantly increased upon both myelin phagocytosis and pioglitazone treatment (Fig. 4D). MS monocytes secreted higher levels of MMP‐9 in comparison to HV monocytes, with a statistically significant decrease in MMP‐9 upon pioglitazone treatment (Fig. 4E). With this, we conclude that ELISA results fully validated selected markers from the SOMAscan assay.
Pioglitazone augments differentiation of monocytes toward an M2 phenotype
Results thus far demonstrate that MS monocytes have a proinflammatory phenotype and physiological concentrations of pioglitazone partially normalize their skewed differentiation. However, monocytes can readily modify their functional and phenotypical state based on environmental cues. Therefore, we asked whether pioglitazone affects strong in vitro differentiation of monocytes toward macrophages of two extreme opposite phenotypes: M1, proinflammatory or M2, anti‐inflammatory (Fig. S2).
M1 macrophages have a more rounded appearance compared to more bipolar M2 macrophages in culture (consistent with previous studies41). We observed a tendency for M1 myelin‐phagocytosing macrophages to have a more elongated phenotype under pioglitazone (Fig. 5A), but pioglitazone failed to induce higher surface expression of the M2 marker CD163 on M1‐differentiated macrophages (Fig. 5B). In contrast, pioglitazone significantly enhanced surface expression of CD163 on M2‐differentiated macrophages in MS‐derived and HV macrophages compared to HV resting cells (Fig. 5C). Because we observed no change in soluble CD163 levels in myelin‐phagocytosing cells (data not shown), we conclude that pioglitazone induced de novo CD163 expression during macrophage differentiation.
Figure 5.
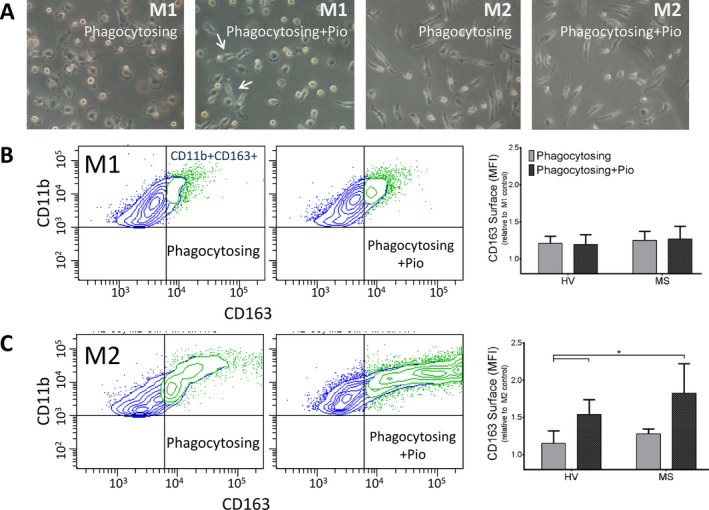
Pioglitazone treatment increases expression of the M2 surface marker CD163 on MS patient macrophages. (A) Light micrographs of M1 and M2 monocyte‐derived macrophages. M1 macrophages display a flattened, amoeboid phenotype with some cells elongated upon pioglitazone treatment (arrows). M2‐polarized macrophages display a bipolar appearance. (B) There is no change in CD163 expression in CD11b+ M1‐polarized, myelin‐phagocytosing macrophages compared to resting cells after treatment with 1 μmol/L pioglitazone. (C) M2, pioglitazone‐treated macrophages display increased CD163 expression upon myelin debris phagocytosis compared to HV macrophages, indicating further anti‐inflammatory polarization. Adjusted P‐values for pairwise comparisons in a adjusted P‐values for pairwise comparisons in a two‐way repeated measures ANOVA with Tukey's test. Mean ± SEM, *P < 0.05, n = 10/group. MS, multiple sclerosis; HV, healthy volunteer; ANOVA, analysis of variance.
Pioglitazone promotes myelin debris phagocytosis in monocytes from MS patients
As baseline skewing toward an inflammatory phenotype in MS‐derived monocytes is effectively reversed by pioglitazone, and M2 macrophages are more efficient in myelin phagocytosis as compared to M1 macrophages,42 we studied the effect of pioglitazone on myelin phagocytosis. Additionally, because PPARγ is a binding partner of RXR, and activation of RXR by the FDA‐approved drug bexarotene improved, but did not completely normalize the myelin phagocytosis deficit in MS‐derived monocytes,14 we also asked whether pioglitazone and bexarotene exert additive or synergistic effect(s).
Young HV monocytes were able to effectively phagocytose debris before and after both pioglitazone and the combined pioglitazone + bexarotene treatment (Fig. 6A). As previously seen,14 there was a significant defect in myelin debris phagocytosis in MS patient monocytes compared to HV (Fig. 6B). When MS monocytes were treated with 1 μmol/L pioglitazone, phagocytosis significantly increased. The combined treatment of pioglitazone with bexarotene did not increase myelin debris phagocytosis by MS monocytes further (Fig. 6C), likely because pioglitazone alone completely normalized the defect in myelin phagocytosis by MS patient monocytes.
Figure 6.
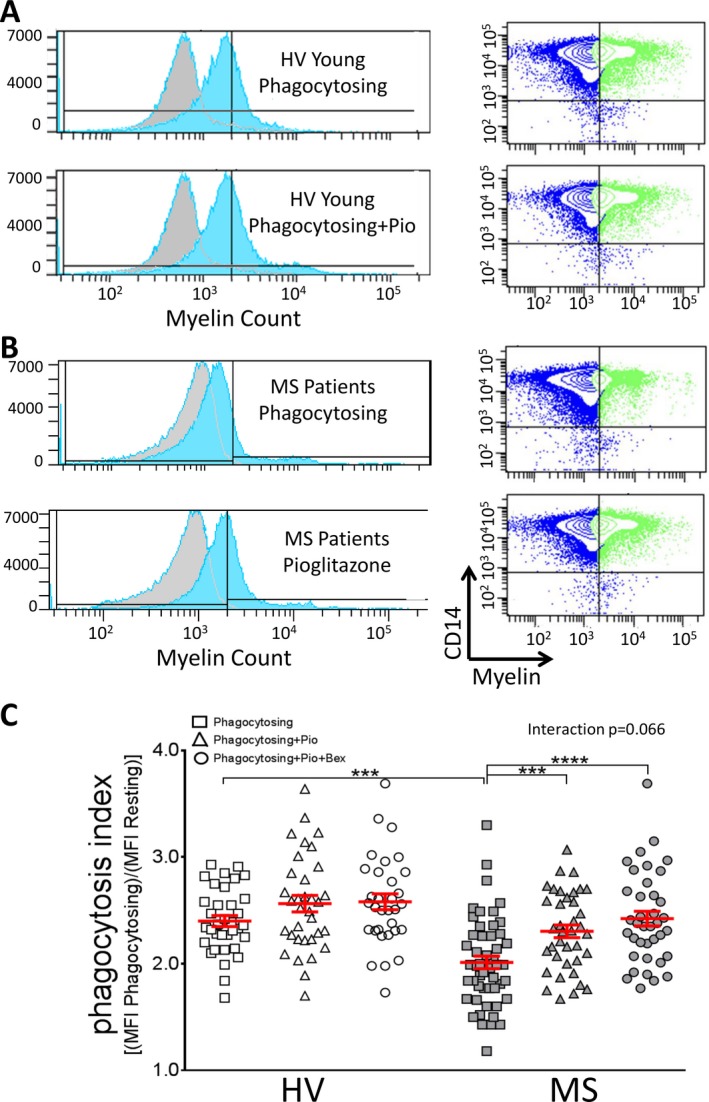
Pioglitazone significantly improves myelin debris phagocytosis in MS patient monocytes. (A and B) Monocytes from young healthy volunteers (A, n = 36) and MS patients (B, n = 60) were treated with myelin debris and pioglitazone. Histograms and flow cytometry plots displaying myelin‐phagocytosing monocytes are shown. Myelin+ gate was determined by nonphagocytosing control cells (gray background plots). (C) Monocytes from MS patients (2.06 ± 0.05) show significantly impaired myelin debris phagocytosis by flow cytometry compared to young HV (2.44 ± 0.07). This impairment was significantly improved in MS patients by adding 1 μmol/L pioglitazone (2.39 ± 0.06), and combining 1 μmol/L pioglitazone + bexarotene treatment did not further increase phagocytosis (2.49 ± 0.06). Both treated MS groups were no longer significantly different from HV after treatment. Adjusted P‐values for pairwise comparisons in a two‐way repeated measures ANOVA with Tukey's test. Data are also presented in Figure 1. Mean ± SEM, ***P < 0.001, ****P < 0.0001. MS, multiple sclerosis; HV, healthy volunteer; ANOVA, analysis of variance.
Discussion
Current disease modifying therapies for MS target mostly dysregulated adaptive immune responses. However, components of innate immunity, such as monocytes/macrophages, dendritic cells and innate lymphoid cells, determine both level of activation and phenotype of the adaptive immune responses.43, 44, 45, 46 While the role of blood‐derived monocytes in the MS disease process remains controversial, animal models of CNS inflammation convincingly demonstrate that depending on their phenotype, these myeloid cells may mediate immunopathology (in a highly proinflammatory environment) or remyelination and CNS repair.5, 6
Cerebrospinal fluid (CSF) of MS patients is reproducibly devoid of monocytes in comparison to enrichment of adaptive immune cells, and the B cell/monocyte ratio, significantly elevated in MS, is associated with worse clinical outcomes.47, 48 These in vivo observations would favor a beneficial role of blood‐derived monocytes in the MS disease process, such as their role in efficient clearance of myelin debris, necessary for speedy and efficient remyelination.6, 14 It was this beneficial role of monocytes we sought to study and enhance in the current and previous study. However, to our surprise, we observed baseline differences in the phenotype and function(s) of monocytes between MS patients and HV: MS‐derived monocytes were skewed toward a proinflammatory phenotype and were deficient in myelin phagocytosis, irrespective of patients' age. This suggests that MS disease state itself influences monocyte functions. Indeed, many identified MS susceptibility alleles encode proteins expressed in the myeloid lineage,49, 50 possibly underlying functional defects in myelin phagocytosis as part of the MS disease process in much the same way that functional defects in phagocytosis of apoptotic cells are linked to systemic lupus erythematosus.51
The most important results from this study indicate that in vivo achievable concentrations of pioglitazone not only completely normalize the functional defect in myelin phagocytosis, but also at least partially reverse the abnormal proinflammatory phenotype of MS monocytes. For example, pioglitazone enhances the cytokine IL‐19, which is a member of the anti‐inflammatory IL‐10 family52 along with LRG1, which has been shown to enhance TGF‐β release in macrophages, increasing their role in regeneration.53 In addition, NFAT5 regulates the expression of VEGF,54 another important growth factor, and prostaglandin E sythase (PTGES) promotes production of prostaglandin and encourages M2 differentiation.8, 55 Pioglitazone treatment also increases sCD14, which has previously been elevated in stable MS patients' serum,56 and reduces surface CD14, which has previously been correlated with proinflammatory activation in the CNS57 and is lowered by helminth infections that are protective against MS.58
This suggests that pioglitazone may be an excellent adjunct therapy to current disease modifying therapies that target adaptive immunity, especially those that do not interfere with monocyte recruitment into the CNS. A pilot study of pioglitazone add‐on to IFN‐β demonstrated no effect on Expanded Disability Status Scale (EDSS) but observed slower decline in gray matter atrophy in comparison to placebo after 1 year of therapy on the daily dose of 30 mg/day.59 The same investigators also reported beneficial effects of pioglitazone treatment on diffusion tensor imaging‐related parameters on brain MRI.18 While these data are highly encouraging, they need to be reproduced in a well‐powered trial. Presented results may facilitate such a trial, because we identified monocyte‐released factors (sCD14, C3, MMP‐9, TIMP‐1) that can be assayed in the CSF as pharmacodynamic markers for testing intrathecal effects of pioglitazone on monocytes/macrophages in the CSF and CNS tissue, as these markers are reproducibly affected by pioglitazone in vitro and can be measured in the CSF of MS patients.26, 60, 61
Author Contributions
M. S. N., R. J. M. F., and B. B. conceived of the project. M. S. N. and B. B. designed the study, performed the analysis/interpretation, and wrote the manuscript. M. S. N. acquired the data. M. K. and P. K. developed methodology/analysis for ECLIA and SOMAscan. K. R. J. performed bioinformatics. T. W. performed statistical analysis. All authors critically revised the manuscript.
Conflict of Interest
Dr. Bielekova is a co‐inventor on NIH patents related to daclizumab therapy of multiple sclerosis and as such has received patent royalty payments. This COI is not related to current work.
Supporting information
Data S1. Methods.
Figure S1. Demographic data for healthy volunteers (HV) and MS patients. (A) Demographic characteristics, including age, race, gender, and history of treatment with disease modifying therapies, for the three subject groups (young HV, old HV, and MS patients). (B) Pretreatment of patients with disease modifying MS drugs did not significantly affect the phagocytosis index.
Figure S2. M1/M2 macrophage polarization from human CD14+ monocytes. Cells were cultured and differentiated for 7 days in pro‐ and anti‐inflammatory conditions toward M1 and M2 polarization. Effects of pioglitazone treatment and myelin debris phagocytosis on CD163 expression on CD11b+ macrophages were determined by flow cytometry.
Figure S3. Pioglitazone reverses impaired expression and activation of PPARγ pathways in MS patient monocytes. Monocytes from HV and MS patients were treated with myelin debris and pioglitazone, and cDNA was isolated. (A) The PPAR Targets PCR Array (SABiosciences) was used to determine changes in genes in the PPAR pathway. Fold changes were calculated by comparing HV or MS cells to resting controls. The heat map depicts genes in the PPAR pathway with ¦FC¦ > 1.5, showing PPAR‐related genes upregulated in phagocytosing HV monocytes compared to phagocytosing MS patient cells. Pioglitazone enhanced expression of genes in the PPAR pathway in MS monocytes. Green = upregulated, Red = downregulated, n = 6/group. (B) Fold changes in PPARγ expression were determined by conventional qPCR. PPARγ expression is significantly greater in phagocytosing HV monocytes compared to MS patients, and expression increased after pioglitazone treatment in both HV and MS monocytes. Two‐way repeated‐measures ANOVA with Tukey's test, **P < 0.01, ***P < 0.001, n = 8/group.
Table S1. Genes important in monocyte function and phagocytosis are dysregulated in MS patient monocytes. Ingenuity pathway analysis was used to determine genes changed in the top canonical pathways in MS patients.
Table S2. Proteins in MS patient monocyte supernatants affected by myelin phagocytosis and pioglitazone treatment (relative to resting controls). Using SOMAscan technology, pioglitazone was found to enhance several proteins involved in antioxidant functions, anti‐inflammatory activation of monocytes, and growth factor signalling.
Acknowledgments
We thank the NDU clinical team for providing patient samples, the National Institutes of Health Blood Bank for healthy donors, and Abdel Elkahloun and WeiWei Wu for microarray assistance. This work was supported by grants from the NINDS/National Institutes of Health Intramural Research Program, U.K. MS Society, Wellcome‐Trust, and the Gates‐Cambridge Scholarship.
References
- 1. McFarland HF, Martin R. Multiple sclerosis: a complicated picture of autoimmunity. Nat Immunol 2007;8:913–919. [DOI] [PubMed] [Google Scholar]
- 2. Trebst C, Sorensen TL, Kivisakk P, et al. CCR1+/CCR5+ mononuclear phagocytes accumulate in the central nervous system of patients with multiple sclerosis. Am J Pathol 2001;159:1701–1710. [DOI] [PMC free article] [PubMed] [Google Scholar]
- 3. Kotter MR, Setzu A, Sim FJ, et al. Macrophage depletion impairs oligodendrocyte remyelination following lysolecithin‐induced demyelination. Glia 2001;35:204–212. [DOI] [PubMed] [Google Scholar]
- 4. Yamasaki R, Lu H, Butovsky O, et al. Differential roles of microglia and monocytes in the inflamed central nervous system. J Exp Med 2014;211:1533–1549. [DOI] [PMC free article] [PubMed] [Google Scholar]
- 5. Kotter MR, Zhao C, van Rooijen N, Franklin RJM. Macrophage‐depletion induced impairment of experimental CNS remyelination is associated with a reduced oligodendrocyte progenitor cell response and altered growth factor expression. Neurobiol Dis 2005;18:166–175. [DOI] [PubMed] [Google Scholar]
- 6. Ruckh JM, Zhao JW, Shadrach JL, et al. Rejuvenation of regeneration in the aging central nervous system. Cell Stem Cell 2012;10:96–103. [DOI] [PMC free article] [PubMed] [Google Scholar]
- 7. Peferoen LA, Vogel DY, Ummenthum K, et al. Activation status of human microglia is dependent on lesion formation stage and remyelination in multiple sclerosis. J Neuropathol Exp Neurol 2015;74:48–63. [DOI] [PubMed] [Google Scholar]
- 8. Sica A, Mantovani A. Macrophage plasticity and polarization: in vivo veritas. J Clin Invest 2012;122:787–795. [DOI] [PMC free article] [PubMed] [Google Scholar]
- 9. Mikita J, Dubourdieu‐Cassagno N, Deloire MS, et al. Altered M1/M2 activation patterns of monocytes in severe relapsing experimental rat model of multiple sclerosis. Amelioration of clinical status by M2 activated monocyte administration. Mult Scler 2011;17:2–15. [DOI] [PubMed] [Google Scholar]
- 10. Sloane E, Ledeboer A, Seibert W, et al. Anti‐inflammatory cytokine gene therapy decreases sensory and motor dysfunction in experimental multiple sclerosis: MOG‐EAE behavioral and anatomical symptom treatment with cytokine gene therapy. Brain Behav Immun 2009;23:92–100. [DOI] [PMC free article] [PubMed] [Google Scholar]
- 11. Miron VE, Boyd A, Zhao JW, et al. M2 microglia and macrophages drive oligodendrocyte differentiation during CNS remyelination. Nat Neurosci 2013;16:1211–1218. [DOI] [PMC free article] [PubMed] [Google Scholar]
- 12. Zhao C, Li WW, Franklin RJM. Differences in the early inflammatory responses to toxin‐induced demyelination are associated with the age‐related decline in CNS remyelination. Neurobiol Aging 2006;27:1298–1307. [DOI] [PubMed] [Google Scholar]
- 13. Takahashi K, Prinz M, Stagi M, et al. TREM2‐transduced myeloid precursors mediate nervous tissue debris clearance and facilitate recovery in an animal model of multiple sclerosis. PLoS Med 2007;4:e124. [DOI] [PMC free article] [PubMed] [Google Scholar]
- 14. Natrajan MS, de la Fuente AG, Crawford AH, et al. Retinoid X receptor activation reverses age‐related deficiencies in myelin debris phagocytosis and remyelination. Brain 2015; Advance online publication: http://dx.doi.org/10.1093/brain/awv289. [DOI] [PMC free article] [PubMed] [Google Scholar]
- 15. Odegaard JI, Ricardo‐Gonzalez RR, Goforth MH, et al. Macrophage‐specific PPARgamma controls alternative activation and improves insulin resistance. Nature 2007;447:1116–1120. [DOI] [PMC free article] [PubMed] [Google Scholar]
- 16. Ricote M, Li AC, Willson TM, et al. The peroxisome proliferator‐activated receptor‐gamma is a negative regulator of macrophage activation. Nature 1998;391:79–82. [DOI] [PubMed] [Google Scholar]
- 17. Bright JJ, Walline CC, Kanakasabai S, Chakraborty S. Targeting PPAR as a therapy to treat multiple sclerosis. Expert Opin Ther Targets 2008;12:1565–1575. [DOI] [PubMed] [Google Scholar]
- 18. Shukla DK, Kaiser CC, Stebbins GT, Feinstein DL. Effects of pioglitazone on diffusion tensor imaging indices in multiple sclerosis patients. Neurosci Lett 2010;472:153–156. [DOI] [PubMed] [Google Scholar]
- 19. Chawla A, Repa JJ, Evans RM, Mangelsdorf DJ. Nuclear receptors and lipid physiology: opening the X‐files. Science 2001;294:1866–1870. [DOI] [PubMed] [Google Scholar]
- 20. Ogawa D, Stone JF, Takata Y, et al. Liver x receptor agonists inhibit cytokine‐induced osteopontin expression in macrophages through interference with activator protein‐1 signaling pathways. Circ Res 2005;96:e59–e67. [DOI] [PubMed] [Google Scholar]
- 21. Roszer T, Menendez‐Gutierrez MP, Cedenilla M, Ricote M. Retinoid X receptors in macrophage biology. Trends Endocrinol Metab 2013;24:460–468. [DOI] [PubMed] [Google Scholar]
- 22. Polman CH, Reingold SC, Banwell B, et al. Diagnostic criteria for multiple sclerosis: 2010 revisions to the McDonald criteria. Ann Neurol 2011;69:292–302. [DOI] [PMC free article] [PubMed] [Google Scholar]
- 23. Eckland D, Danhof M. Clinical pharmacokinetics of pioglitazone. Exp Clin Endocrinol Diabetes 2000;108(Suppl 2):234–242. [Google Scholar]
- 24. Wuest SC, Mexhitaj I, Chai NR, et al. A complex role of herpes viruses in the disease process of multiple sclerosis. PLoS One 2014;9:e105434. [DOI] [PMC free article] [PubMed] [Google Scholar]
- 25. Kroner A, Greenhalgh AD, Zarruk JG, et al. TNF and increased intracellular iron alter macrophage polarization to a detrimental M1 phenotype in the injured spinal cord. Neuron 2014;83:1098–1116. [DOI] [PubMed] [Google Scholar]
- 26. Komori M, Blake A, Greenwood M, et al. Cerebrospinal fluid markers reveal intrathecal inflammation in progressive multiple sclerosis. Ann Neurol 2015;78:3–20. [DOI] [PMC free article] [PubMed] [Google Scholar]
- 27. Gold L, Walker JJ, Wilcox SK, Williams S. Advances in human proteomics at high scale with the SOMAscan proteomics platform. N Biotechnol 2012;29:543–549. [DOI] [PubMed] [Google Scholar]
- 28. Kraemer S, Vaught JD, Bock C, et al. From SOMAmer‐based biomarker discovery to diagnostic and clinical applications: a SOMAmer‐based, streamlined multiplex proteomic assay. PLoS One 2011;6:e26332. [DOI] [PMC free article] [PubMed] [Google Scholar]
- 29. Gold L, Ayers D, Bertino J, et al. Aptamer‐based multiplexed proteomic technology for biomarker discovery. PLoS One 2010;5:e15004. [DOI] [PMC free article] [PubMed] [Google Scholar]
- 30. Matusevicius D, Kivisakk P, He B, et al. Interleukin‐17 mRNA expression in blood and CSF mononuclear cells is augmented in multiple sclerosis. Mul Scler 1999;5:101–104. [DOI] [PubMed] [Google Scholar]
- 31. Levy E, Xanthou G, Petrakou E, et al. Distinct roles of TLR4 and CD14 in LPS‐induced inflammatory responses of neonates. Pediatr Res 2009;66:179–184. [DOI] [PubMed] [Google Scholar]
- 32. Triantafilou M, Triantafilou K. Lipopolysaccharide recognition: CD14, TLRs and the LPS‐activation cluster. Trends Immunol 2002;23:301–304. [DOI] [PubMed] [Google Scholar]
- 33. Kitchens RL, Thompson PA. Modulatory effects of sCD14 and LBP on LPS‐host cell interactions. J Endotoxin Res 2005;11:225–229. [DOI] [PubMed] [Google Scholar]
- 34. Hailman E, Vasselon T, Kelley M, et al. Stimulation of macrophages and neutrophils by complexes of lipopolysaccharide and soluble CD14. J Immunol 1996;156:4384–4390. [PubMed] [Google Scholar]
- 35. Bar‐Or A, Nuttall RK, Duddy M, et al. Analyses of all matrix metalloproteinase members in leukocytes emphasize monocytes as major inflammatory mediators in multiple sclerosis. Brain 2003;126(Pt 12):2738–2749. [DOI] [PubMed] [Google Scholar]
- 36. Booth D. Do pathogens contribute to multiple sclerosis aetiology? Microbiol Aust 2013;34:144–146. [Google Scholar]
- 37. Bruck W, Friede RL. The role of complement in myelin phagocytosis during PNS wallerian degeneration. J Neurol Sci 1991;103:182–187. [DOI] [PubMed] [Google Scholar]
- 38. Badou A, Bennasser Y, Moreau M, et al. Tat protein of human immunodeficiency virus type 1 induces interleukin‐10 in human peripheral blood monocytes: implication of protein kinase C‐dependent pathway. J Virol 2000;74:10551–10562. [DOI] [PMC free article] [PubMed] [Google Scholar]
- 39. Trentini A, Manfrinato MC, Castellazzi M, et al. TIMP‐1 resistant matrix metalloproteinase‐9 is the predominant serum active isoform associated with MRI activity in patients with multiple sclerosis. Mult Scler 2015;21:1121–1130. doi: 10.1177/1352458514560925 [DOI] [PubMed] [Google Scholar]
- 40. Waubant E, Goodkin D, Gee L, et al. Serum MMP‐9 and TIMP‐1 levels are related to MRI activity in relapsing multiple sclerosis. Neurology 1999;53:1397–1401. [DOI] [PubMed] [Google Scholar]
- 41. Edin S, Wikberg ML, Rutegård J, et al. Phenotypic skewing of macrophages in vitro by secreted factors from colorectal cancer cells. PLoS One 2013;8:e74982. [DOI] [PMC free article] [PubMed] [Google Scholar]
- 42. Boven LA, Van Meurs M, Van Zwam M, et al. Myelin‐laden macrophages are anti‐inflammatory, consistent with foam cells in multiple sclerosis. Brain 2006;129(Pt 2):517–526. [DOI] [PubMed] [Google Scholar]
- 43. Perry JS, Han S, Xu Q, et al. Inhibition of LTi cell development by CD25 blockade is associated with decreased intrathecal inflammation in multiple sclerosis. Sci Transl Med 2012;4:145ra06. [DOI] [PMC free article] [PubMed] [Google Scholar]
- 44. Bielekova B, Catalfamo M, Reichert‐Scrivner S, et al. Regulatory CD56bright natural killer cells mediate immunomodulatory effects of IL‐2R‐alpha‐targeted therapy (daclizumab) in multiple sclerosis. Proc Natl Acad Sci USA 2006;103:5941–5946. [DOI] [PMC free article] [PubMed] [Google Scholar]
- 45. Chitta S, Santambrogio L, Stern LJ. GMCSF in the absence of other cytokines sustains human dendritic cell precursors with T cell regulatory activity and capacity to differentiate into functional dendritic cells. Immunol Lett 2008;116:41–54. [DOI] [PubMed] [Google Scholar]
- 46. Wuest SC, Edwan JH, Martin JF, et al. A role for interleukin‐2 trans‐presentation in dendritic cell‐mediated T cell activation in humans, as revealed by daclizumab therapy. Nat Med 2011;17:604–609. [DOI] [PMC free article] [PubMed] [Google Scholar]
- 47. Cepok S, Jacobsen M, Schock S, et al. Patterns of cerebrospinal fluid pathology correlate with disease progression in multiple sclerosis. Brain 2001;124(Pt 11):2169–2176. [DOI] [PubMed] [Google Scholar]
- 48. Han S, Lin YC, Wu T, et al. Comprehensive immunophenotyping of cerebrospinal fluid cells in patients with neuroimmunological diseases. J Immunol 2014;192:2551–2563. [DOI] [PMC free article] [PubMed] [Google Scholar]
- 49. Farh KK, Marson A, Zhu J, et al. Genetic and epigenetic fine mapping of causal autoimmune disease variants. Nature 2015;518:337–343. [DOI] [PMC free article] [PubMed] [Google Scholar]
- 50. International Multiple Sclerosis Genetics C , Beecham AH, Patsopoulos NA, et al. Analysis of immune‐related loci identifies 48 new susceptibility variants for multiple sclerosis. Nat Genet 2013;45:1353–1360. [DOI] [PMC free article] [PubMed] [Google Scholar]
- 51. Majai G, Kiss E, Tarr T, et al. Decreased apopto‐phagocytic gene expression in the macrophages of systemic lupus erythematosus patients. Lupus 2014;23:133–145. [DOI] [PubMed] [Google Scholar]
- 52. Richards J, Gabunia K, Kelemen SE, et al. Interleukin‐19 increases angiogenesis in ischemic hind limbs by direct effects on both endothelial cells and macrophage polarization. J Mol Cell Cardiol 2015;79:21–31. [DOI] [PMC free article] [PubMed] [Google Scholar]
- 53. Song W, Wang X. The role of TGFβ1 and LRG1 in cardiac remodelling and heart failure. Biophys Rev 2015;7:91–104. [DOI] [PMC free article] [PubMed] [Google Scholar]
- 54. Wiig H, Schroder A, Neuhofer W, et al. Immune cells control skin lymphatic electrolyte homeostasis and blood pressure. J Clin Invest 2013;123:2803–2815. [DOI] [PMC free article] [PubMed] [Google Scholar]
- 55. Sica A, Schioppa T, Mantovani A, Allavena P. Tumour‐associated macrophages are a distinct M2 polarised population promoting tumour progression: potential targets of anti‐cancer therapy. Eur J Cancer 2006;42:717–727. [DOI] [PubMed] [Google Scholar]
- 56. Lutterotti A, Kuenz B, Gredler V, et al. Increased serum levels of soluble CD14 indicate stable multiple sclerosis. J Neuroimmunol 2006;181:145–149. [DOI] [PubMed] [Google Scholar]
- 57. Nguyen MD, Julien JP, Rivest S. Innate immunity: the missing link in neuroprotection and neurodegeneration? Nat Rev Neurol 2002;3:216–227. [DOI] [PubMed] [Google Scholar]
- 58. Kooij G, Braster R, Koning JJ, et al. Trichuris suis induces human non‐classical patrolling monocytes via the mannose receptor and PKC: implications for multiple sclerosis. Acta Neuropathol Commun 2015;3:45. [DOI] [PMC free article] [PubMed] [Google Scholar]
- 59. Kaiser CC, Shukla DK, Stebbins GT, et al. A pilot test of pioglitazone as an add‐on in patients with relapsing remitting multiple sclerosis. J Neuroimmunol 2009;211:124–130. [DOI] [PubMed] [Google Scholar]
- 60. Wang Y, Hancock AM, Bradner J, et al. Complement 3 and factor h in human cerebrospinal fluid in Parkinson's disease, Alzheimer's disease, and multiple‐system atrophy. Am J Pathol 2011;178:1509–1516. [DOI] [PMC free article] [PubMed] [Google Scholar]
- 61. Kolb SA, Lahrtz F, Paul R, et al. Matrix metalloproteinases and tissue inhibitors of metalloproteinases in viral meningitis: upregulation of MMP‐9 and TIMP‐1 in cerebrospinal fluid. J Neuroimmunol 1998;84:143–150. [DOI] [PubMed] [Google Scholar]
Associated Data
This section collects any data citations, data availability statements, or supplementary materials included in this article.
Supplementary Materials
Data S1. Methods.
Figure S1. Demographic data for healthy volunteers (HV) and MS patients. (A) Demographic characteristics, including age, race, gender, and history of treatment with disease modifying therapies, for the three subject groups (young HV, old HV, and MS patients). (B) Pretreatment of patients with disease modifying MS drugs did not significantly affect the phagocytosis index.
Figure S2. M1/M2 macrophage polarization from human CD14+ monocytes. Cells were cultured and differentiated for 7 days in pro‐ and anti‐inflammatory conditions toward M1 and M2 polarization. Effects of pioglitazone treatment and myelin debris phagocytosis on CD163 expression on CD11b+ macrophages were determined by flow cytometry.
Figure S3. Pioglitazone reverses impaired expression and activation of PPARγ pathways in MS patient monocytes. Monocytes from HV and MS patients were treated with myelin debris and pioglitazone, and cDNA was isolated. (A) The PPAR Targets PCR Array (SABiosciences) was used to determine changes in genes in the PPAR pathway. Fold changes were calculated by comparing HV or MS cells to resting controls. The heat map depicts genes in the PPAR pathway with ¦FC¦ > 1.5, showing PPAR‐related genes upregulated in phagocytosing HV monocytes compared to phagocytosing MS patient cells. Pioglitazone enhanced expression of genes in the PPAR pathway in MS monocytes. Green = upregulated, Red = downregulated, n = 6/group. (B) Fold changes in PPARγ expression were determined by conventional qPCR. PPARγ expression is significantly greater in phagocytosing HV monocytes compared to MS patients, and expression increased after pioglitazone treatment in both HV and MS monocytes. Two‐way repeated‐measures ANOVA with Tukey's test, **P < 0.01, ***P < 0.001, n = 8/group.
Table S1. Genes important in monocyte function and phagocytosis are dysregulated in MS patient monocytes. Ingenuity pathway analysis was used to determine genes changed in the top canonical pathways in MS patients.
Table S2. Proteins in MS patient monocyte supernatants affected by myelin phagocytosis and pioglitazone treatment (relative to resting controls). Using SOMAscan technology, pioglitazone was found to enhance several proteins involved in antioxidant functions, anti‐inflammatory activation of monocytes, and growth factor signalling.