Abstract
MicroRNAs (miRNAs) play important roles in cancer progression by altering transcriptional control. The purpose of this study is to identify and explore specific miRNAs as prognostic and predictive biomarkers for bile duct cancer (BDC) by analyzing Next-generation data. miRNA expression profiles and corresponding clinical information of BDC samples were extracted from The Cancer Genome Atlas (TCGA). The differentially expressed miRNAs were determined by SAMR package in R software. Target genes of those miRNAs were predicted by Targetscan. Functional enrichment analysis and hypergeometric test analysis of target genes were performed. Then, diagnosis accuracy of miRNAs was judged by ROC Curves analysis. Total 120 differentially expressed miRNAs were obtained, of which six important miRNAs were selected and predicted as prognosis and predicting biomarkers in BDC. Besides, functional analysis showed that both enriched pathways were significantly related with ion binding, which might involve in the carcinogenesis of BDC. Moreover, top 3 important pathways sharing the most influence were noted. Our results demonstrated that hsa-miR-483-5p, hsa-miR-675, hsa-miR-139-3p, hsa-miR-598, hsa-miR-625 and hsa-miR-187 could serve as prognostic and predictive markers for survival of BDC patients and could potentially be provided as targets for future therapy.
Keywords: Bile duct cancer, microRNA, target gene, functional enrichment, pathway analysis
Introduction
Currently, bile duct cancer (BDC) is the second most common primary hepatobiliary cancer, with an increasing incidence rate and become a potential threat to human health worldwide [1,2]. The investigation of BDC associated genes for early detection or therapeutic targeting could potentially improve the survival rates. Although in recent years, considerable efforts have been done to investigate the miRNAs and genes involved in BDC pathogenesis and progress [3], the precise pathogenesis and biomarkers involved in the development of BDC also needs further elucidation.
MicroRNAs (miRNAs or miRs) are small and non-coding small RNAs endogenous molecules, and mainly in the un-translated region of mRNA, involving in post-transcriptional gene regulation [4]. Notably, miRNAs play roles in several physiological activities with important regulatory functions [5], especially in progress of cancer. Actually, miRNAs have been showed to be the potential implication targets for cancer diagnosis and prognosis [6,7]. The possible relationship between miRNAs and oncogenesis is explored by next-generation sequencing tumor versus normal tissues in recent reports [8]. For example, it have been demonstrated that miRNAs, such as miRNA-21 [9], miR-141 and miR-200b [10], to be involved in the malignant transformation of cholangiocytes and contributed to the different clinical biofeatures of cholangiocarcinoma [8]. The development of genome-wide sequencing and bioinformatics facilitate the discovery of such prognostic and predictive indicators. Moreover, The Cancer Genome Atlas (TCGA), which launched in 2005 by the National Institute of Health (NIH), create a comprehensive “atlas” of cancer genomic profiles. Therefore, we utilized The Cancer Genome Atlas (TCGA) as a publicly available dataset to identify differentially expressed miRNAs, hoping to explore functions that miRNAs play in the development and progression of BDC.
Ordinarily, TCGA was utilized as a reference to increase the available sample size, compare RNA sequencing between normal and BDC samples, as well differentially expressed genes and gene networks. Thus, this novel bioinformatics pipeline could help us identify and filter out potential artifacts due to the small sample size. Accordingly, differentially expressed miRNAs were credible for further study.
In our study, we tried to identify differentially expressed miRNAs as prognostic and predictive biomarkers for BDC. Additionally, both enriched GO terms and KEGG pathways were analyzed for further understanding of the functions in which these miRNAs participated. Finally, the predicted miRNAs will have high potential to play critical roles in the progression of BDC and could potentially provide as targets for future therapy.
Materials and methods
Source data and primary analysis
To yield the detection error, three separate batches were analyzed from TCGA dataset (https://tcga-data.nci.nih.gov/tcga/tcgaHome2.jsp) with total 45 specimens, incorporating 9 normal specimens of bile ducts and 36 specimens of BDC. Sequencing of the dataset was based on Illumina HiSeq platform [11].
The dataset acquired above contained 1046 noted miRNA expression data. Expression data of each sample from three batches were standardized, and the standardization between different samples was performed by Limma package of R software [12]. As a result, the differences between experiments of different samples were revoked. Only those miRNAs overlapping for two or three times among three batches were selected.
Screening of differentially expressed miRNAs
Differentially expressed miRNAs between normal and cancer specimens of bile ducts were screened by SAMR (significance analysis of microarrays) [13] package in R software, under the condition of FC (fold change) was 2 and FDR (false discovery rate) less than 0.05. Then cluster analysis was performed to guarantee those miRNAs could classify normal and BDC specimens well. After that, principal component analysis was utilized to observe the contradistinction between those two kinds of specimens.
Analysis about target genes of differentially expressed miRNAs
The putative targets of differentially expressed miRNAs were acquired from Mirtarbase [14] database. Functional Gene Ontology (GO) biological processes terms, as well as KEGG (Kyoto Encyclopedia of Genes and Genomes) pathways of the putative targets of candidate miRNAs were performed basing on DAVID (database for annotation visualization and integrated discovery) [15]. The DAVID could calculate out the P-value of functional enrichment and P-value after Benjamini correction. Putative targets of miRNAs were predicted by TargetScan Human 6.2 software [16]. Then GO terms and KEGG analysis were utilized to obtain potential medical target point. The differences were considered statistically significant for P-value <0.05.
Functional network of differently expressed miRNA
The topological properties of validated targets of interested miRNAs protein network were analyzed and modularized by network analyzer in Cytoscape software [17], then top 3 modules with P-value of significant less than 1.0e-05 were functional analyzed.
Diagnosis accuracy of important miRNA as biological marker of BDC
We could obtain important miRNAs, which were predicted as biological markers, after above performance. Next, the diagnosis accuracy of important miRNAs as biological markers of BDC was judged by ROC curves. ROC curves were analyzed by MedCalc software [18], and AUC (area under curve) which was a index of the diagnosis accuracy was calculated by the analysis.
Results
Differently expressed miRNAs in BDC
Total 1041 differentially expressed miRNAs were acquired after principal component analysis and cluster analysis. There was a significant difference between those two kinds of specimens, because normal specimens were scattered in right upper, while the cancer specimens in left lower (Figure 1). In addition, normal specimens were scattered at the right cluster while cancer specimens at the left cluster in Figure 2, which means miRNA expression was different between normal specimens and BDC specimens.
Figure 1.
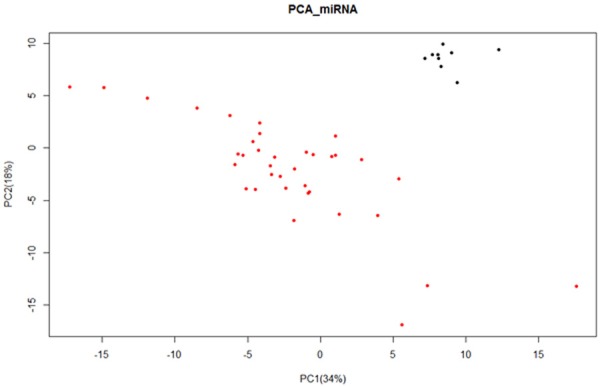
Principal component analysis of the expression of miRNA. The abscissa axis represents that the first principal component occupies 34%, while the longitudinal axis represents that the second principal component occupies 18%. Red spots show specimens of bile duct cancer, while black spots show normal specimens.
Figure 2.
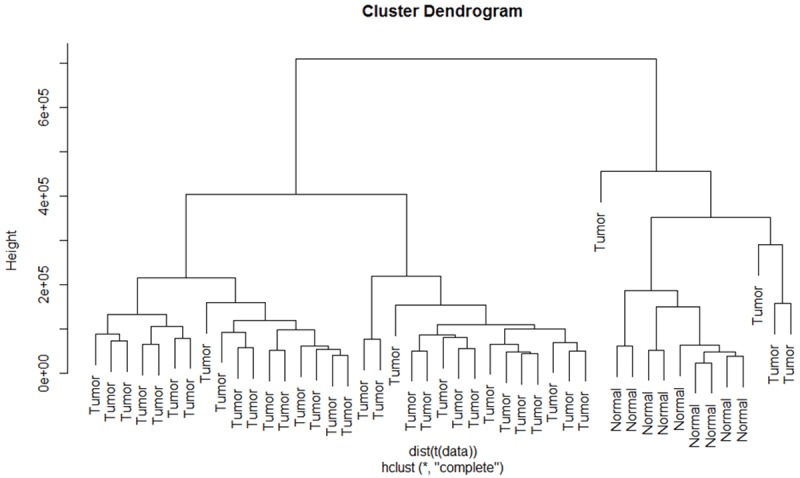
Dendrogram of differentially expressed miRNAs by cluster analysis. The longitudinal axis represents the difference degree between specimens, the cluster tree shows specimens share similar expression volume will gather together. Normal specimens are scattered at the right cluster.
Analysis of differently expressed miRNA
Total 120 differentially expressed miRNAs between normal and BDC specimens were obtained after screening by SAMR [13] package. There were 59 up-regulated miRNAs and 61 down-regulated miRNAs accounting for quartiles 49.2% and 50.8% of differentially expressed miRNAs, respectively (Figures 3 and 4).
Figure 3.
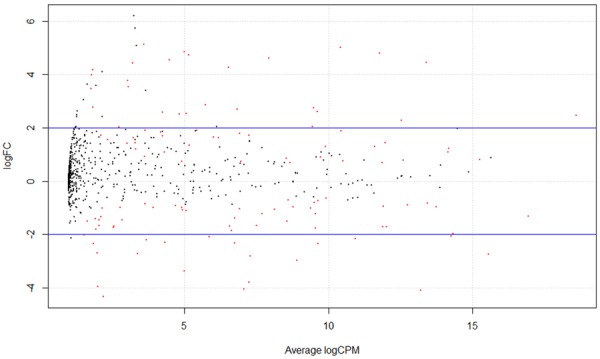
Difference of miRNA expression analysis. Black spot shows normal expression miRNA, Red spot shows different expression miRNA, red spot above the figure was up-regulated miRNAs while red spot blow the figure shows down-regulated miRNA.
Figure 4.
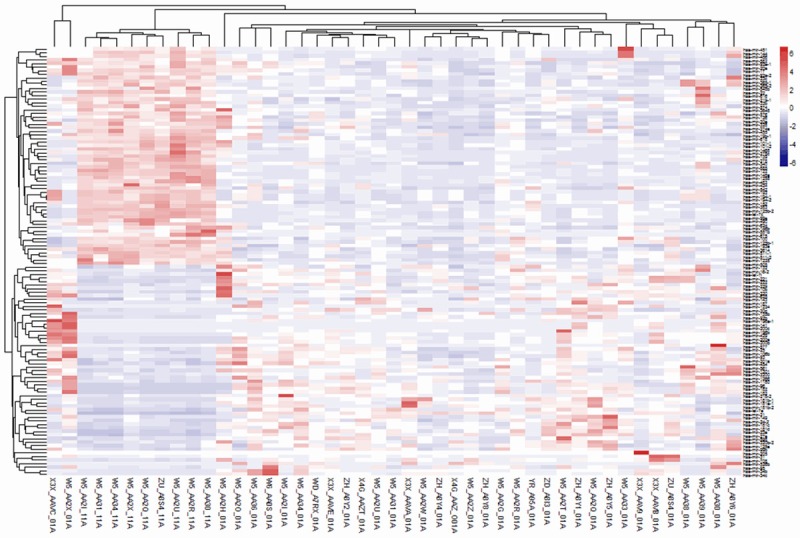
Cluster analysis of differentially expressed miRNA. The below abscissa axis represents specimen. The right longitudinal axis represents miRNA, and the left longitudinal axis represents cluster of miRNA. Red shows up-regulated miRNAs while green shows down-regulated miRNAs. There are two clusters of those specimens clustering: one is normal specimens of bile ducts and the other one is bile duct cancer specimens. Besides, there are two clusters of miRNA expression clustering: one is down-regulated miRNAs of bile duct cancer specimens and the other one is up-regulated miRNAs of bile duct cancer specimens.
Analysis about target genes of differentially expressed miRNAs
Total 4371 down-regulated target genes and 3810 up-regulated target genes were predicted by Targetscan software. In GO biological processes of putative targets of important miRNAs, 9 up-regulated and 11 down-regulated differentially expressed miRNAs were significantly enriched. Likewise, analysis of KEGG pathway showed differentially expressed miRNAs enriched in 4 up-regulated and 4 down-regulated pathways. Furthermore, the most significantly down-regulated GO terms and KEGG pathways were cation binding and Jak-STAT (the Janus kinase-signal transducer and activator of transcription) signaling pathway, respectively. The most significantly up-regulated GO terms and KEGG pathways were ion binding and graft-versus-host disease, respectively (Figure 5).
Figure 5.
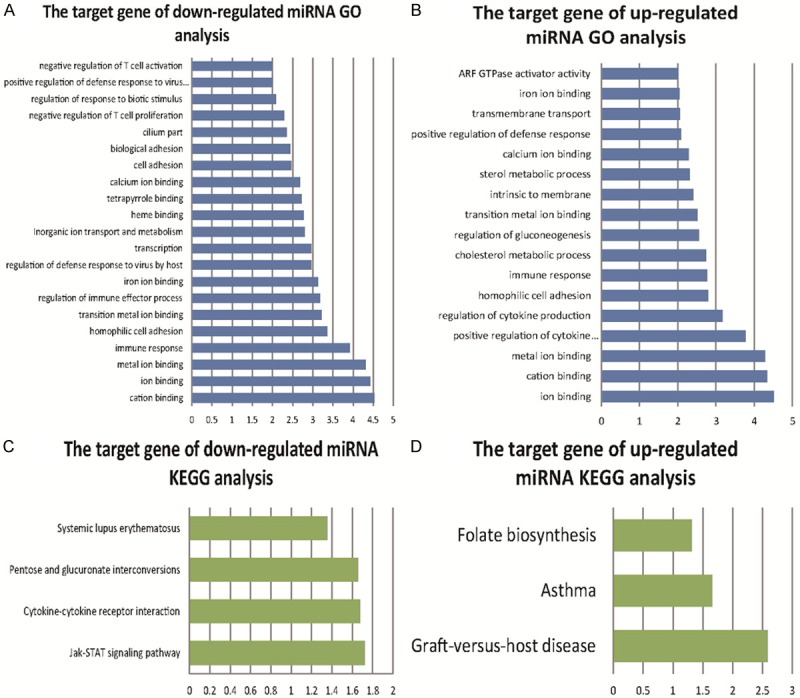
The GO terms and enriched KEGG pathways of target genes of differentially expressed miRNA. (A and B) are GO terms of target genes of differentially expressed miRNA, while (C and D) are KEGG pathways. The abscissa axis represents the level of discrepancy between different target genes expression. The longitudinal axis represents functional annotations. The closer the correlation between target genes and annotations is the higher level of the difference.
Interaction network and functional analysis of interested miRNAs and target genes in BDC
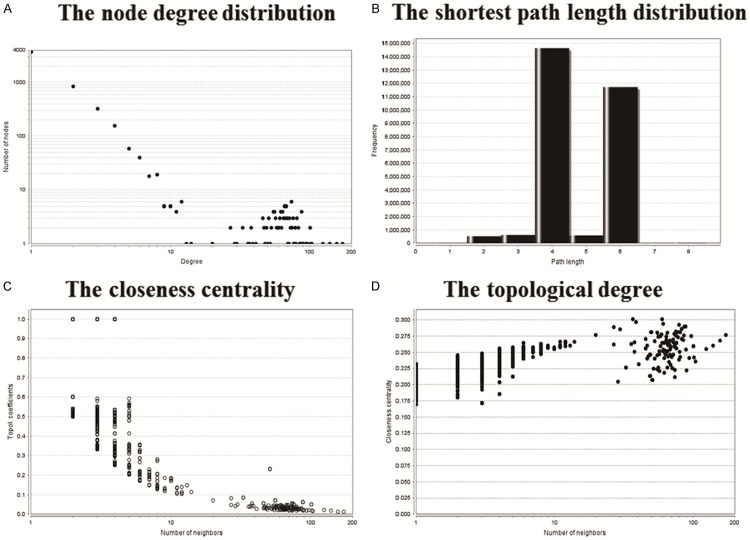
We calculated the important topological parameters, such as node degree distribution, shortest path length distribution, closeness centrality and the topological degree (Figure 6), then found that the degree distribution of the interaction network of differentially expressed miRNAs and target genes followed the Power-law of network, and had small-world network characteristics (short average shortest path and large average clustering coefficient).
Figure 6.
Topological properties of Interaction network of differentially expressed miRNAs and target genes. A. The node degree distribution; B. The shortest path length distribution; C. The closeness centrality; D. The topological degree.
Moreover, as shown in Figure 7, every miRNA has conglomerate target genes, and miRNAs can co-function on the same target gene. Top 3 miRNAs of down-regulated miRNAs and up-regulated miRNAs on node degree were acquired after screening and functional analysis, respectively. As a result, there were 173 target genes in hsa-miR-483-5p, 157 target genes in hsa-miR-675 and 140 target genes in hsa-miR-139-3p, among those 3 down-regulated miRNAs. Meanwhile, there were 104 target genes in hsa-miR-598, 97 in hsa-miR-625 and 94 in hsa-miR-187, among those 3 up-regulated miRNAs.
Figure 7.
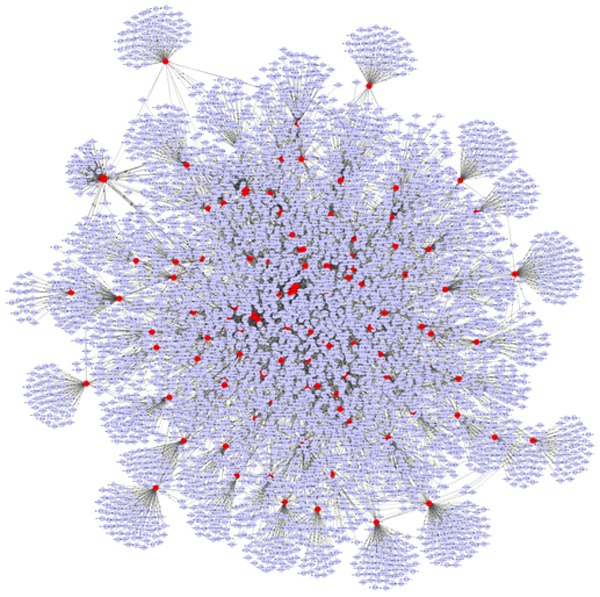
Interaction network of differentially expressed miRNAs and target genes. Gray spots show target genes and red spots show miRNA.
Likewise, KEGG analysis was utilized to annotate target genes. As a result, top 3 important pathways, such as nuclear receptors in lipid metabolism and toxicity, phosphatidylinositol signaling system and endocytosis, were nuclear receptors in lipid metabolism and toxicity, phosphatidylinositol signaling system and endocytosis (Table 1).
Table 1.
Enriched KEGG pathway classification of top 3 modules
| Term | Genes | |
|---|---|---|
| module 1 | h_nuclearRsPathway: Nuclear Receptors in Lipid Metabolism and Toxicity | NM_177435, NM_001017535, NM_000376, NM_004391, NM_000778 |
| module 2 | hsa04070: Phosphatidylinositol signaling system | NM_001105540, NM_005185, NM_001135637, NM_001135638, NM_002220, NM_003557, NM_003646, NM_001135636, NM_019892, NM_201533, NM_201532 |
| module 3 | hsa04144: Endocytosis | NM_015470, NM_152284, NM_001135637, NM_001135638, NM_003557, NM_001135636, NM_018209, NM_024591, NM_019619, NM_175609, NM_015075, NM_001111125, NM_014043 |
The accuracy of important miRNAs as biological marker of BDC
Among down-regulated miRNAs, AUC of hsa-miR-483-5p, hsa-miR-675 and hsa-miR-139-3p were 0.997, 0.978 and 1.000, respectively. While among up-regulated miRNA, AUC of hsa-miR-598, hsa-miR-625 and hsa-miR-187 were 0.818, 0.846 and 0.676, respectively (Figure 8). These results of AUC indicated that those six miRNAs shared high diagnosis accuracy as biological markers of BDC, as AUC was a index of the diagnosis accuracy.
Figure 8.
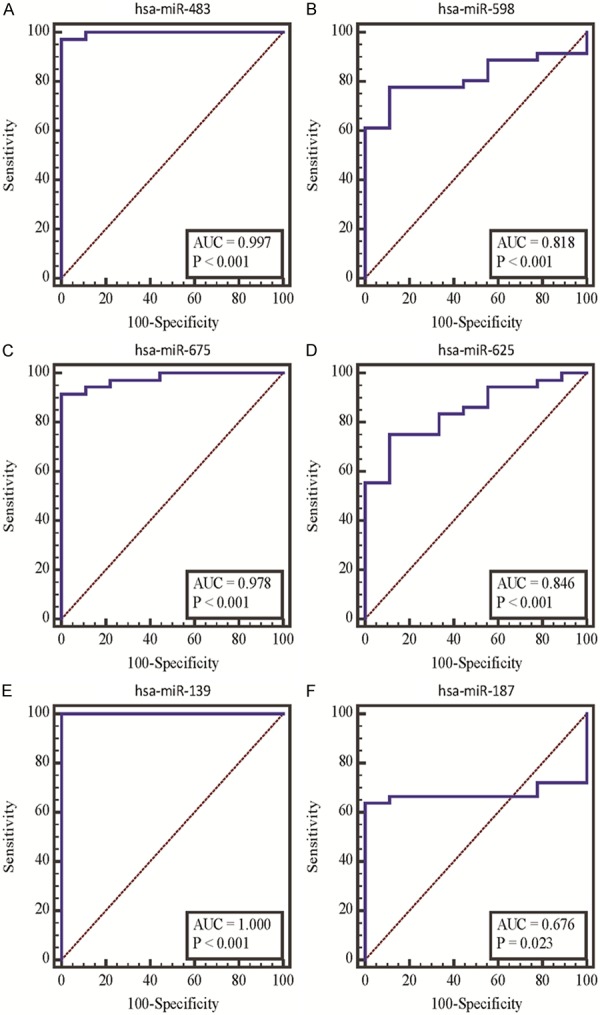
ROC curves analysis of significantly altered miRNAs. The abscissa axis represents specificity and the longitudinal axis represents sensitivity. AUC is area under curve.
Discussions
In this study, we identified total 120 differentially expressed miRNAs after principal component analysis, such as miRNA-21, miR-302, let-7a, let-7b and miR-204. More importantly, six important miRNAs, hsa-miR-483-5p, hsa-miR-675, hsa-miR-139-3p, hsa-miR-598, hsa-miR-625 and hsa-miR-187, were predicted as biomarkers in prognosis and prediction of BDC. Then target genes of those differentially expressed miRNAs were acquired and executed for functional annotation by DAVID. Meanwhile, both significantly altered GO terms and KEGG pathways, such as cation binding, Jak-STAT signaling pathway, ion binding and graft-versus-host disease, were related with ion binding. Moreover, top 3 important pathways sharing the highest influence were nuclear receptors in lipid metabolism and toxicity, phosphatidylinositol signaling system and endocytosis.
In this study, miRNA-21 was significantly up-regulated, which was in accordance with previous results that miRNA-21 were highly over-expressed in malignant cholangiocytes [10]. MiRNA-21 directly targeted some anti-oncogenes, such as TPM1, PDCD4 (programmed cell death 4), maspin and PTEN (phosphatase and tensin homolog) [19]. Besides, maspin as the target gene of miRNA-21 might participate in the process of biology function during cholangiocarcinoma. Moreover, literatures pointed that miRNA-21 might promote cell proliferation by down-modulating the expression of tumor suppressor phosphatase and tension homolog [10,20] and might increase migration properties of tumor [21]. In addition, miRNA-21 was suggested to contribute to chemoresistance in cholangiocarcinoma by regulating the chemotherapy-induced apoptosis [22]. Meanwhile the down-regulating of miRNA-21 could enhance the sensitivity of BDC cells to anticancer drugs gemcitabine [10]. Also, miRNA-21 might play an important role in cholangiocarcinoma by inhibiting the proliferation and accelerating the apoptosis of cholangiocarcinoma RBE cells [10,23]. All in all, miRNA-21 might affect the propagation, invasion and translation of tumor by down-regulating anti-oncogenes.
As members of let-7 family, both let-7a and let-7b were down-regulated in BDC, while target gene of let-7a was anti-oncogene NF-2 (neurofibromin 2). Considering that NF-2 could negatively regulate the expression of stat-3 (signal transducer and activator of transcription 3) [24,25], who was the conditional signal sensing and activating transcription factor, we suggest that let-7a might modulate the procession and enhanced drug resistance [24] of BDC through regulating Stat-3. In addition, oncogene HMGA2 (high mobility group A2) was the target gene of let-7. let-7 negalatively regulate HMGA2 and then depress propagation of lung cancer [26], which implies let-7 might play tumor suppressor functions.
MiRNA-302 which was down-regulated in our study targeted the MCL-1 (myeloid cell leukemia 1), an anti-apoptotic Bcl-2 (b-cell lymphoma 2) family member, and MCL-1 was shown to be regulated by miRNAs [27]; while Bcl-2, another anti-apoptotic Bcl-2 family member, was targeted by miR-204, who was also down-regulated in our study and other papers [8]. By analogy, we reasoned that those down-regulated miRNAs might contribute to the pathogenesy of BDC through modulating proapoptotic mechanisms. It was in urgent need to explore the exactly pathogenesy.
The GO terms and KEGG pathways of target genes of differentially expressed miRNAs showed that the generation of BDC affected the ion combining capacity of target protein which was important for maintaining normal physiological function. For instance, protein phosphorylation site was impacted and induced incorret phosphorylation which might lead to the change of mero-milieu or milieu, so dysfunction of protein activation and inactivation were induced. As a result, the interaction between protein and DNA was changed as well. Ion combining correlated protein, such as calcium-binding proteins A4 [28], and ion combing tyrosine phosphorylation mediation genes, such as phosphoinositide-3-kinase [29] and protein kinase A RII-like [30], were proved to be closely related with invasion and translation of malignant tumor. As mentioned above, it might hit us clues that expression difference of those target genes might participate in progress of BDC.
Notably, early detection, diagnosis and treatment were the key to decrease mortality and improve the prognosis of cancer. Considering that the expression of miRNAs was closely related with metastasis [31] and drug tolerance of tumor [32], we predicted six important significantly expressed miRNAs as a biomarker for predicting BDC prognosis, which was confirmed by ROC curves analysis. Although, many works had done to investigate genetic variants and abnormal miRNAs, such as KRAS (kirsten rat sarcoma viral oncogene homolog), BRAF (B-Raf proto-oncogene, serine/threonine kinase), EGFR (epidermal growth factor receptor) and TP53 (tumor protein p53), clinical outcome of the disease has not been improved [33]. Our study identified new miRNAs and target genes, hoping to provide a new thought on BDC therapy to improve treatment effectiveness.
More importantly, the accuracy analysis results showed six miRNAs, hsa-miR-483-5p, hsa-miR-675, hsa-miR-139-3p, hsa-miR-598, hsa-miR-625 and hsa-miR-187 could be served as biomarkers for BDC. MiR-483-5p was proved to upregulate in adrenocortical cancer [34] and suppress the proliferation of glioma cells [35]. Besides, miR-139 could suppress metastasis and progression of hepatocellular carcinoma [36]. However, those six miRNAs were determined as biomarkers, and were persuasive and feasible for important implications in clinical practice about targeted therapy of BDC first time.
Conclusions
In summary, we identified miRNA-21, miR-302, let-7a, let-7b and miR-204 which might relate with pathogenesis of BDC. More importantly, we predicted six miRNAs, hsa-miR-483-5p, hsa-miR-675, hsa-miR-139-3p, hsa-miR-598, hsa-miR-625 and hsa-miR-187, as biomarkers prognosis and predicting in BDC, implying the application for diagnostic and prognostic tools and treatments.
Disclosure of conflict of interest
None.
References
- 1.Khan SA, Davidson BR, Goldin RD, Heaton N, Karani J, Pereira SP, Rosenberg WM, Tait P, Taylor-Robinson SD, Thillainayagam AV, Thomas HC, Wasan H British Society of Gastroenterology. Guidelines for the diagnosis and treatment of cholangiocarcinoma: an update. Gut. 2012;61:1657–1669. doi: 10.1136/gutjnl-2011-301748. [DOI] [PubMed] [Google Scholar]
- 2.Shaib Y, El-Serag HB. The epidemiology of cholangiocarcinoma. Semin Liver Dis. 2004;24:115–125. doi: 10.1055/s-2004-828889. [DOI] [PubMed] [Google Scholar]
- 3.Shen FZ, Zhang BY, Feng YJ, Jia ZX, An B, Liu CC, Deng XY, Kulkarni AD, Lu Y. Current research in perineural invasion of cholangiocarcinoma. J Exp Clin Cancer Res. 2010;10:24. doi: 10.1186/1756-9966-29-24. [DOI] [PMC free article] [PubMed] [Google Scholar]
- 4.Ambros V. MicroRNA pathways in flies and worms: growth, death, fat, stress, and timing. Cell. 2003;113:673–676. doi: 10.1016/s0092-8674(03)00428-8. [DOI] [PubMed] [Google Scholar]
- 5.Yekta S, Shih IH, Bartel DP. MicroRNA-directed cleavage of HOXB8 mRNA. Science. 2004;304:594–596. doi: 10.1126/science.1097434. [DOI] [PubMed] [Google Scholar]
- 6.Lu J, Getz G, Miska EA, Alvarez-Saavedra E, Lamb J, Peck D, Sweet-Cordero A, Ebert BL, Mak RH, Ferrando AA, Downing JR, Jacks T, Horvitz HR, Golub TR. MicroRNA expression profiles classify human cancers. Nature. 2005;435:834–838. doi: 10.1038/nature03702. [DOI] [PubMed] [Google Scholar]
- 7.Murakami Y, Yasuda T, Saigo K, Urashima T, Toyoda H, Okanoue T, Shimotohno K. Comprehensive analysis of microRNA expression patterns in hepatocellular carcinoma and non-tumorous tissues. Oncogene. 2006;25:2537–2545. doi: 10.1038/sj.onc.1209283. [DOI] [PubMed] [Google Scholar]
- 8.Chen L, Yan HX, Yang W, Hu L, Yu LX, Liu Q, Li L, Huang DD, Ding J, Shen F, Zhou WP, Wu MC, Wang HY. The role of microRNA expression pattern in human intrahepatic cholangiocarcinoma. J Hepatol. 2009;50:358–369. doi: 10.1016/j.jhep.2008.09.015. [DOI] [PubMed] [Google Scholar]
- 9.You H HQ, Liu C. Effect of miRNA-21 on the Proliferation and Apoptosis of Cholangiocarcinoma Cells by Targeted maspin. Practical Preventive Medicine. 2011;7:006. [Google Scholar]
- 10.Meng F, Henson R, Lang M, Wehbe H, Maheshwari S, Mendell JT, Jiang J, Schmittgen TD, Patel T. Involvement of human micro-RNA in growth and response to chemotherapy in human cholangiocarcinoma cell lines. Gastroenterology. 2006;130:2113–2129. doi: 10.1053/j.gastro.2006.02.057. [DOI] [PubMed] [Google Scholar]
- 11.Quail MA, Smith M, Coupland P, Otto TD, Harris SR, Connor TR, Bertoni A, Swerdlow HP, Gu Y. A tale of three next generation sequencing platforms: comparison of Ion Torrent, Pacific Biosciences and Illumina MiSeq sequencers. BMC Genomics. 2012;13:341. doi: 10.1186/1471-2164-13-341. [DOI] [PMC free article] [PubMed] [Google Scholar]
- 12.Autio R, Kilpinen S, Saarela M, Kallioniemi O, Hautaniemi S, Astola J. Comparison of Affymetrix data normalization methods using 6926 experiments across five array generations. BMC Bioinformatics. 2009;10:24. doi: 10.1186/1471-2105-10-S1-S24. [DOI] [PMC free article] [PubMed] [Google Scholar]
- 13.Tusher VG, Tibshirani R, Chu G. Significance analysis of microarrays applied to the ionizing radiation response. Proc Natl Acad Sci U S A. 2001;98:5116–5121. doi: 10.1073/pnas.091062498. [DOI] [PMC free article] [PubMed] [Google Scholar]
- 14.Hsu SD, Lin FM, Wu WY, Liang C, Huang WC, Chan WL, Tsai WT, Chen GZ, Lee CJ, Chiu CM, Chien CH, Wu MC, Huang CY, Tsou AP, Huang HD. miRTarBase: a database curates experimentally validated microRNA-target interactions. Nucleic Acids Res. 2011;39:D163–169. doi: 10.1093/nar/gkq1107. [DOI] [PMC free article] [PubMed] [Google Scholar]
- 15.Dennis G Jr, Sherman BT, Hosack DA, Yang J, Gao W, Lane HC, Lempicki RA. DAVID: Database for Annotation, Visualization, and Integrated Discovery. Genome Biol. 2003;4:P3. [PubMed] [Google Scholar]
- 16.Lewis BP, Jones-Rhoades MW, Bartel DP, Burge CB. Prediction of mammalian microRNA targets. Cell. 2003;115:787–798. doi: 10.1016/s0092-8674(03)01018-3. [DOI] [PubMed] [Google Scholar]
- 17.Shannon P, Markiel A, Ozier O, Baliga NS, Wang JT, Ramage D, Amin N, Schwikowski B, Ideker T. Cytoscape: a software environment for integrated models of biomolecular interaction networks. Genome Res. 2003;13:2498–2504. doi: 10.1101/gr.1239303. [DOI] [PMC free article] [PubMed] [Google Scholar]
- 18.Bland JM, Altman DG. Statistical methods for assessing agreement between two methods of clinical measurement. Lancet. 1986;1:307–310. [PubMed] [Google Scholar]
- 19.Zhu S, Wu H, Wu F, Nie D, Sheng S, Mo YY. MicroRNA-21 targets tumor suppressor genes in invasion and metastasis. Cell Res. 2008;18:350–359. doi: 10.1038/cr.2008.24. [DOI] [PubMed] [Google Scholar]
- 20.Stutes M, Tran S, DeMorrow S. Genetic and epigenetic changes associated with cholangiocarcinoma: from DNA methylation to microRNAs. World J Gastroenterol. 2007;13:6465–6469. doi: 10.3748/wjg.v13.i48.6465. [DOI] [PMC free article] [PubMed] [Google Scholar]
- 21.Selaru FM, Olaru AV, Kan T, David S, Cheng Y, Mori Y, Yang J, Paun B, Jin Z, Agarwal R, Hamilton JP, Abraham J, Georgiades C, Alvarez H, Vivekanandan P, Yu W, Maitra A, Torbenson M, Thuluvath PJ, Gores GJ, LaRusso NF, Hruban R, Meltzer SJ. MicroRNA-21 is overexpressed in human cholangiocarcinoma and regulates programmed cell death 4 and tissue inhibitor of metalloproteinase 3. Hepatology. 2009;49:1595–1601. doi: 10.1002/hep.22838. [DOI] [PMC free article] [PubMed] [Google Scholar]
- 22.Munoz-Garrido P, Garcia-Fernandez de Barrena M, Hijona E, Carracedo M, Marin JJ, Bujanda L, Banales JM. MicroRNAs in biliary diseases. World J Gastroenterol. 2012;18:6189–6196. doi: 10.3748/wjg.v18.i43.6189. [DOI] [PMC free article] [PubMed] [Google Scholar]
- 23.Huang Q, Liu L, Liu CH, You H, Shao F, Xie F, Lin XS, Hu SY, Zhang CH. MicroRNA-21 regulates the invasion and metastasis in cholangiocarcinoma and may be a potential biomarker for cancer prognosis. Asian Pac J Cancer Prev. 2013;14:829–834. doi: 10.7314/apjcp.2013.14.2.829. [DOI] [PubMed] [Google Scholar]
- 24.Meng F, Henson R, Wehbe-Janek H, Smith H, Ueno Y, Patel T. The MicroRNA let-7a modulates interleukin-6-dependent STAT-3 survival signaling in malignant human cholangiocytes. J Biol Chem. 2007;282:8256–8264. doi: 10.1074/jbc.M607712200. [DOI] [PubMed] [Google Scholar]
- 25.Johnson MD, O’Connell M, Vito F, Bakos RS. Increased STAT-3 and synchronous activation of Raf-1-MEK-1-MAPK, and phosphatidylinositol 3-Kinase-Akt-mTOR pathways in atypical and anaplastic meningiomas. J Neurooncol. 2009;92:129–136. doi: 10.1007/s11060-008-9746-7. [DOI] [PubMed] [Google Scholar]
- 26.Lee YS, Dutta A. The tumor suppressor microRNA let-7 represses the HMGA2 oncogene. Genes Dev. 2007;21:1025–1030. doi: 10.1101/gad.1540407. [DOI] [PMC free article] [PubMed] [Google Scholar]
- 27.Mott JL, Kobayashi S, Bronk SF, Gores GJ. mir-29 regulates Mcl-1 protein expression and apoptosis. Oncogene. 2007;26:6133–6140. doi: 10.1038/sj.onc.1210436. [DOI] [PMC free article] [PubMed] [Google Scholar]
- 28.Mazzucchelli L. Protein S100A4: too long overlooked by pathologists? Am J Pathol. 2002;160:7–13. doi: 10.1016/S0002-9440(10)64342-8. [DOI] [PMC free article] [PubMed] [Google Scholar]
- 29.Choy E, Hornicek F, MacConaill L, Harmon D, Tariq Z, Garraway L, Duan Z. High-throughput genotyping in osteosarcoma identifies multiple mutations in phosphoinositide-3-kinase and other oncogenes. Cancer. 2012;118:2905–2914. doi: 10.1002/cncr.26617. [DOI] [PMC free article] [PubMed] [Google Scholar]
- 30.Newell AE, Fiedler SE, Ruan JM, Pan J, Wang PJ, Deininger J, Corless CL, Carr DW. Protein kinase A RII-like (R2D2) proteins exhibit differential localization and AKAP interaction. Cell Motil Cytoskeleton. 2008;65:539–552. doi: 10.1002/cm.20279. [DOI] [PubMed] [Google Scholar]
- 31.Pogribny IP, Filkowski JN, Tryndyak VP, Golubov A, Shpyleva SI, Kovalchuk O. Alterations of microRNAs and their targets are associated with acquired resistance of MCF-7 breast cancer cells to cisplatin. Int J Cancer. 2010;127:1785–1794. doi: 10.1002/ijc.25191. [DOI] [PubMed] [Google Scholar]
- 32.Blower PE, Chung JH, Verducci JS, Lin S, Park JK, Dai Z, Liu CG, Schmittgen TD, Reinhold WC, Croce CM, Weinstein JN, Sadee W. MicroRNAs modulate the chemosensitivity of tumor cells. Mol Cancer Ther. 2008;7:1–9. doi: 10.1158/1535-7163.MCT-07-0573. [DOI] [PubMed] [Google Scholar]
- 33.Andersen JB, Thorgeirsson SS. Genetic profiling of intrahepatic cholangiocarcinoma. Curr Opin Gastroenterol. 2012;28:266–272. doi: 10.1097/MOG.0b013e3283523c7e. [DOI] [PMC free article] [PubMed] [Google Scholar]
- 34.Soon PS, Tacon LJ, Gill AJ, Bambach CP, Sywak MS, Campbell PR, Yeh MW, Wong SG, Clifton-Bligh RJ, Robinson BG, Sidhu SB. miR-195 and miR-483-5p identified as predictors of poor prognosis in adrenocortical cancer. Clin Cancer Res. 2009;15:7684–7692. doi: 10.1158/1078-0432.CCR-09-1587. [DOI] [PubMed] [Google Scholar]
- 35.Wang L, Shi M, Hou S, Ding B, Liu L, Ji X, Zhang J, Deng Y. MiR-483-5p suppresses the proliferation of glioma cells via directly targeting ERK1. FEBS Lett. 2012;586:1312–1317. doi: 10.1016/j.febslet.2012.03.035. [DOI] [PubMed] [Google Scholar]
- 36.Wong CC, Wong CM, Tung EK, Au SL, Lee JM, Poon RT, Man K, Ng IO. The microRNA miR-139 suppresses metastasis and progression of hepatocellular carcinoma by down-regulating Rho-kinase 2. Gastroenterology. 2011;140:322–331. doi: 10.1053/j.gastro.2010.10.006. [DOI] [PubMed] [Google Scholar]


