Abstract

In the first step of olfaction, odorants are bound and solubilized by small globular odorant binding proteins (OBPs) which shuttle them to the membrane of a sensory neuron. Low ligand affinity and selectivity at this step enable the recognition of a wide range of chemicals. Honey bee Apis mellifera’s OBP14 (AmelOBP14) binds different plant odorants in a largely hydrophobic cavity. In long molecular dynamics simulations in the presence and absence of ligand eugenol, we observe a highly dynamic C-terminal region which forms one side of the ligand-binding cavity, and the ligand drifts away from its crystallized orientation. Hamiltonian replica exchange simulations, allowing exchanges of conformations sampled by the real ligand with those sampled by a noninteracting dummy molecule and several intermediates, suggest an alternative, quite different ligand pose which is adopted immediately and which is stable in long simulations. Thermodynamic integration yields binding free energies which are in reasonable agreement with experimental data.
Introduction
Insects depend strongly on olfactory cues both for communication and for orientation. A good understanding of their olfactory systems is important both in agriculture and in the control of insect-mediated diseases. Odorants are usually volatile and poorly soluble molecules. When they enter the aqueous lymph of the sensilla on an insect’s antennae they bind to odorant binding proteins (OBPs),1,2 which shuttle them to the membrane-bound odorant receptors (ORs) of a sensory neuron. The signal is then relayed to the OR either directly by the ligand or by the ligand-bound OBP.3
OBPs are small soluble proteins highly concentrated in the sensillar lymph.1,2 Their role is not completely understood: In addition to shuttling the odorant and participation in signal relay, they might also serve to sequester and control the amount of free odorants in the extracellular space.3
One group of OBPs are the pheromone binding proteins (PBPs), which are tuned to one specific ligand or a narrow range of related compounds. The so-called general OBPs (gOBPs) on the other hand are characterized by low ligand specificity and affinities in the micromolar range. They bind odorants in a combinatorial manner.4,5 The same ligand can be bound—with different affinities—by more than one OBP of a species, and each OBP can bind several different ligands. In addition, multiple ligand binding poses have been proposed in some cases. For example, NMR data for ASP2 (antennal-specific protein 2) from the honey bee indicates that the hydrophobic ligand IBMP (2-isobutyl-3-methoxypyrazine) can bind in two alternative stable conformations.6 Crystal structures of ASP1 suggest that its cavity can accommodate ligand 9-ODA (9-keto-2(E)-decenoic acid) in different orientations and in one or two copies or accompanied by additional ligands.7
The structure of insect OBPs comprises six conserved α-helices. Typically three interlinked disulfide bonds (classical OBPs) make them very stable,8 while also classes with only two (C-minus OBPs) and several more (plus-C OBPs) disulfide bridges exist. Changes in the protein conformation upon ligand binding have been found in pheromone binding proteins from the moth Bombyx mori (BmorPBP) and the honey bee Apis mellifera (AmelASP1).7,9−11 In addition, an influence of pH on the structure of the C-terminus and thereby on the uptake or release of the ligand has been proposed.7,11−18
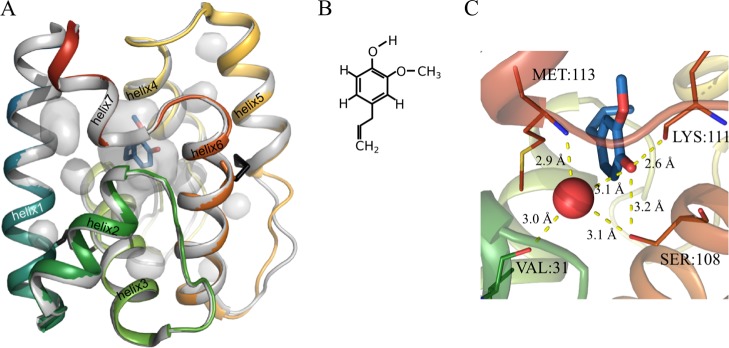
OBP14 from Apis mellifera (AmelOBP14), one of 21 OBPs in the honey bee, is found in the larvae and in the mandibular glands of hive bees, as well as in the antennae.19,20 Crystal structures show the 119 amino acids long protein folded into 7 α-helices21 (Figure 1A). With five cysteines and two disulfide bridges, it belongs to the C-minus class of OBPs. Introduction of a third disulfide bridge as found in classical OBPs does not disturb the conformation at all,21 while increasing the melting temperature by 10 °C.22
Figure 1.
(A) Crystal structure of eugenol-bound AmelOBP14 (colored cartoon representation, PDB-ID 3S0E) superimposed on the apo crystal structure (gray cartoon representation, PDB-ID 3S0A). Internal cavities of the ligand-bound structure are shown as transparent gray surfaces, those of the apo structure are highly similar and omitted for clarity. The two disulfide bridges are shown in black. The N-terminus of the protein is in blue, the C-terminus in red. (B) The chemical structure of eugenol. (C) Close-up of eugenol in the binding cavity. A network of hydrogen bonds (yellow dotted lines) connects the ligand and a conserved water molecule (red sphere) to side chains in helix 2 (green), 6 (orange), and 7 (red).
AmelOBP14 has been shown to bind semiochemicals (chemicals that convey information between organisms) like eugenol (4-allyl-2-methoxyphenol; Figure 1B) and other related phenyl compounds, but also linear molecules like citralva.20,21 Crystal structures of AmelOBP14 have been published with three different ligands, which all fit into the largely hydrophobic and completely closed-off cavity without distorting it strongly.21 Dissociation constants in the nano- to micromolar range have been determined experimentally for several ligands. Those that were found to bind more strongly positively affect protein thermal stability.22,23 In addition, two forms of apo structures were reported, which do not differ much in terms of overall protein shape, neither from each other nor from the structures with a ligand bound.21
In the current work, we set out to quantify the binding free energy of eugenol to a model of AmelOBP14. Eugenol is one of the biological ligands of AmelOBP14 with a comparably high affinity,20,21,24 and one of the few for which a crystal structure is available. Initial simulations led us to believe that the binding orientation observed in the crystal structure is not the only stable conformation and we have performed extensive molecular dynamics simulations to investigate the binding orientations of eugenol to AmelOBP14. We study changes in the protein conformation and ligand orientation as well as the influence of active-site waters during several microseconds of MD simulations.
The ligand binding free energy is computed using the double-decoupling method.25,26 In this approach, the nonbonded interactions of the ligand are turned off in a number of discrete steps, typically described by a coupling parameter. We employ a Hamiltonian replica exchange setup to connect the various intermediate states. This approach has the added advantage that alternative conformations of the ligand, which are readily sampled when the compound is decoupled from the protein, are mixed into the simulations of the real ligand–protein complex in a physically relevant way. This way alternative binding poses that are not observed in regular MD may be sampled efficiently.27
We propose that the protein conformation in solution is rather dynamic, and alternative binding orientations of eugenol compared to the X-ray structure may play a significant role in binding. Even though the spacious and largely hydrophobic cavity, moderate ligand binding affinities, and promiscuous binding make AmelOBP14 a challenging model for computational methods, the computed binding free energies are in reasonable agreement with experimental estimates.
Methods
We performed multiple MD simulations of AmelOBP14 in the presence and absence of its ligand eugenol. The influence of cavity water and an alternative ligand orientation was studied in further sets of simulations. Free energies were extracted from sets of simulations with varying ligand Hamiltonians, both without and with replica exchange (“RE” and “TI” simulations, respectively). All performed simulations involving the protein amount to a total of 16.66 μs of simulation time and are listed in Table 1.
Table 1. Overview of Performed Simulations of AmelOBP14.
| simulation name | # | ligand | length [ns]a | sim. engine | cavity waterb | ligand orientationc |
|---|---|---|---|---|---|---|
| EOL | 1–4 | EOL | 4 × 200 | gromos | + | crystal |
| 5–6 | EOL | 2 × 1000 | gromacs | + | crystal | |
| 7–8 | EOL | 2 × 850 | gromacs | + | crystal | |
| 9–12 | EOL | 4 × 200 | gromacs | + | crystal | |
| EOL-nw | 1–4 | EOL | 4 × 200 | gromos | crystal | |
| EOL-re | 1–2 | EOL | 2 × 200 | gromos | + | RE |
| 3–4 | EOL | 2 × 1000 | gromacs | + | RE | |
| 5–6 | EOL | 2 × 700 | gromacs | + | RE | |
| apo | 1–4 | 4 × 200 | gromos | + | crystal | |
| 5–6 | 2 × 1000 | gromacs | + | crystal | ||
| 7–8 | 2 × 700 | gromacs | + | crystal | ||
| RE | 1–2 | EOL | 2 × 20 (× 16) | gromos | + | crystal |
| RE-nw | 1–2 | EOL | 2 × 20 (× 16) | gromos | crystal | |
| TI | 1–2 | EOL | 2 × 20 (× 16) | gromos | + | crystal |
| TI-nw | 1–2 | EOL | 2 × 20 (× 16) | gromos | crystal |
The numbers in brackets indicate the replicas, i.e., parallel simulations with varying ligand Hamiltonian.
The + indicates that water molecules in addition to the one that is observable in the crystal structure were present in the cavity at the start of the simulations.
Ligand orientation at the start of the simulation, which was either the one from the crystal structure (“crystal”) or the dominant structure found in the RE simulations.
Initial MD simulations over 200 ns and replica exchange simulations were performed using the GROMOS11 biomolecular simulation package (http://www.gromos.net).28 Longer MD simulations up to 1 μs were run with GROMACS 5.0.4.29,30 Parameter set 54A8 of the GROMOS force field31 was used in all cases. AmelOBP14 crystal structures in the apo form (PDB ID: 3S0A) and in complex with eugenol (PDB ID: 3S0E) were retrieved from the PDB data bank. Force field parameters for eugenol were derived by analogy to similar functional groups in the force field and are provided in the Supporting Information.
Hydrogen atoms were added to the crystal structures according to geometric criteria followed by a short energy minimization using the steepest-descent algorithm. The proteins were placed in a rectangular periodic box and solvated with roughly 4700 simple point charge (SPC) water molecules.32 The system was relaxed by a further steepest descent energy minimization with position restraints on the solute atoms, and three Na+ ions were added to neutralize the system. This corresponds to a concentration of about 30 mM and is in the range of experimental buffer concentrations.21,24 For the “nw” simulations (“no water”), all water molecules inside the ligand-binding cavity, except the one which is observed in the crystal structure, were manually removed at this step.
All production simulations were preceded by an equilibration period which started with initial random velocities generated from a Maxwell–Boltzmann distribution at 50 K. From there, the systems were heated up to 300 K in six steps of 20 ps, while concomitantly, position restraints on the solute atoms were reduced from 2.5 × 10⁴ to 0.0 kJ mol–1 nm–2. At the end of this equilibration period, roto-translational constraints on the solute were introduced to keep its longest axis aligned with the longest box edge, and 300 ps of simulation were run before starting the production runs.
The parallel runs of apo, EOL, and EOL-nw plain MD simulations started from equilibrated systems derived from different initial random velocities. For the plain MD EOL-re simulations, snapshots from the replica exchange (RE) simulations in which the ligand adopts an alternative pose (see below) served as starting configurations.
All simulations were performed with a time step of 2 fs using the leapfrog algorithm. Temperature and pressure (1 atm) were maintained using the weak-coupling scheme with coupling times τT = 0.1 ps and τP = 0.5 ps (GROMOS) or 1.6 ps (GROMACS) and an estimated isothermal compressibility of 4.575 × 10⁻⁴ (kJ mol–1 nm–3)−1.33 Bond lengths were constrained to their ideal values using the SHAKE algorithm34 (GROMOS) or the LINCS algorithm35 (GROMACS). Long-range electrostatic interactions beyond a cutoff of 1.4 nm were truncated and approximated via a generalized reaction field approach with a dielectric permittivity of 61.36
RE simulations were started from the same equilibrated structures as the plain MD simulations, and the simulation parameters were kept the same except for the absence of pressure coupling and the fact that the ligand was coupled to a separate temperature bath. This was necessary because the ligand in the dummy state cools down dramatically due to the absence of interactions, and this low temperature is propagated via the replica exchanges into the real ligand state.
Each RE simulation consisted of 16 parallel simulations (replicas) whose Hamiltonian is a combination of the Hamiltonian of the real ligand EOL and of the noninteracting dummy according to H(λ) = λ2HDUM + (1 – λ2)HEOL(λ), where λ is a coupling parameter ranging from 0 to 1. In that way, H(λ) at λ = 0 corresponds to the Hamiltonian of the real ligand, HEOL(0), and H(λ) at λ = 1 to the Hamiltonian of the dummy, HDUM. The λ-dependence of HEOL(λ) introduces the soft-core potential for all values of λ ≠ 0 to avoid singularities.37 At regular time intervals (every 2 ps), exchanges of the Hamiltonian between neighboring replicas were attempted and accepted with a probability depending on the energy difference according to the Metropolis criterion. A simulation of the free ligand in a box of 1082 SPC water molecules was set up in the same way with 20 replicas. In the protein-bound RE simulations, a distance restraint preventing the decoupled ligand from leaving the cavity was also coupled to λ (force constant at λ = 0: 0 kJ mol–1; maximal force constant at λ = 1: 400 kJ mol–1). It was applied between the center of geometry of the ligand’s ring and the center of geometry of the Cα atoms of four carefully chosen protein residues (L6, I32, I68, and Q105), which falls into the center of the ligand binding cavity and robustly stays there during the simulations.
We also performed thermodynamic integration simulations without replica exchange (“TI”-simulations in Table 1) but with otherwise identical settings and lengths. Simulations at every λ value were started after a 100 ps equilibration period, the starting coordinates were taken from the end of the equilibration period of the preceding value of λ.
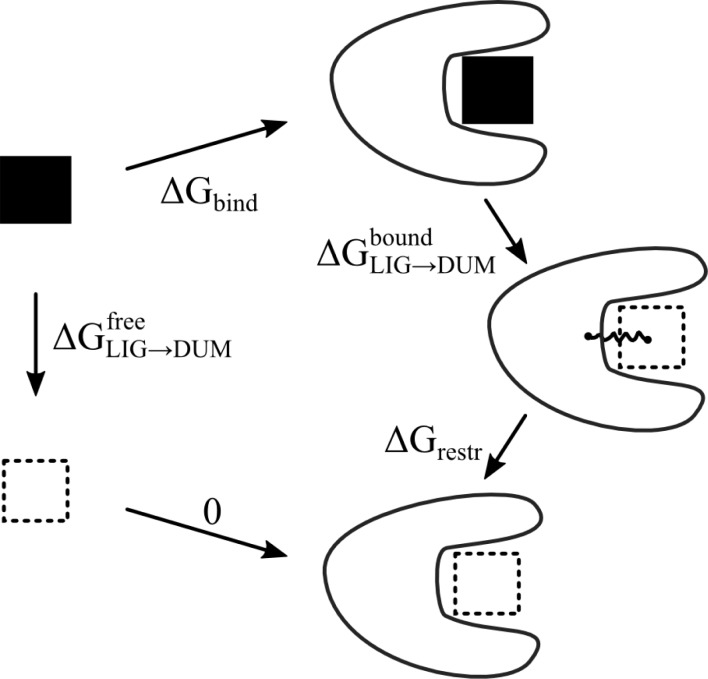
Binding free energies were determined by the double decoupling method through the thermodynamic cycle depicted in Figure 2.38,39 The free energy difference between the real and the dummy state (ΔGLIG→DUM) was calculated using thermodynamic integration according to eq 1.
| 1 |
Figure 2.
Thermodynamic cycle to calculate the binding free energy (ΔGbind) using the double decoupling approach. ΔGLIG→DUMfree and ΔGLIG→DUM are the free energies of decoupling the ligand from its surrounding in the free and bound states. ΔGrestr is the free energy of restraining a dummy ligand to a certain volume inside the protein using a harmonic distance restraint.
The angular brackets indicate
an ensemble average obtained at λ.  was written out every
0.2 ps during the
simulations. Statistical error estimates on the ensemble averages
were calculated from block averaging40 and
were integrated numerically to yield the error values for the free
energies. The free energy component due to the introduction of the
distance restraint (ΔGrestr) was
accounted for analytically.26 Including
a standard state correction, this becomes
| 2 |
where V0 is the standard state volume (1.661 nm3), kB is the Boltzmann constant, T is the temperature, and K is the force constant of the harmonic distance restraint.
Coordinate trajectories were written out every 2 ps and analyzed using tools from the GROMOS++ package.41 Secondary structure elements were classified according to the DSSP rules.42 If not stated otherwise, atom positional root-mean-square deviations (RMSDs) of backbone heavy atoms (Cα, N, C) were determined with respect to the energy minimized crystal structures after superposition of centers of mass and a rotational least-squares superposition.43 Time traces of the number of water molecules were derived from the radial distribution function of water molecules within a distance of 0.7 nm from the center of the ligand binding cavity. Cluster analysis was performed using pairwise RMSDs after superposition of protein backbone atoms. Structures with RMSDs smaller than a defined cutoff of 0.2 nm are considered structural neighbors. The structure with the highest number of neighbors is the central member structure of the first cluster. After removing all structures belonging to the first cluster from the pool, the procedure is repeated until all structures are assigned to clusters.44 Water density inside the cavity throughout all snapshots assigned to one cluster was determined using GROMOS++ program iondens with a grid spacing of 0.1 nm.
Cavity volumes were calculated using trj_cavity.45 Structures were visualized using Pymol (www.pymol.org; The PyMOL Molecular Graphics System, Version 1.4.1 Schroedinger, LLC).
Results and Discussion
Protein Structure and Stability
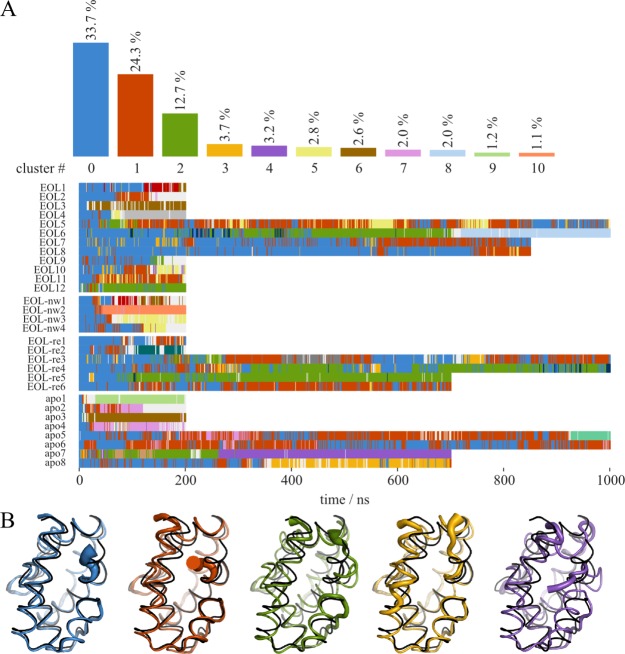
The protein conformation diverges from the crystal structure during the simulations. The atom-positional root-mean-square deviations with respect to the energy minimized crystal structure as well as the root-mean-square fluctuations for representative simulations are given in Figures S1 and S2 of the Supporting Information. To analyze the specific changes in the protein that lead to the divergence from the crystal structure, we did an analysis of conformational clusters,44,46 where structures with a pairwise RMSD of the backbone atoms of less than 0.2 nm are clustered together. Convergence of the simulations was confirmed by monitoring the total number of distinct protein conformations observed during individual simulations with increasing simulation time.47 The number of clusters is plotted in Figure S3, leveling off to approximately 10 clusters. Figure 3 shows the overall population of the biggest clusters and the time series of their occurrence for all plain MD simulations together. The first cluster (in blue) was enforced around the crystal structure conformation, which is left sooner or later in most simulations, but also revisited (Figure 3B). The most instable substructure is the short C-terminal helix 7 which loses its α-helical conformation in all simulations. The long helix 1 is observed to bend toward or away from helix 2, thereby either making space for helix 7 or occupying space which was previously occupied by helix 7. A movement of the substructure composed of helix 2 and the adjacent loop region away from helix 1 is seen in some structures as well as a disruption of helix 2.
Figure 3.
Analysis of conformational clusters obtained with a 0.2 nm backbone atom RMSD cutoff. (A) Overall occurrence and time series of the clustered conformations (clusters with an occurrence <1% were left out in the top bargraph). Cluster 0 (in blue) was enforced around the crystal structure. (B) Average structures of clusters 0–5 using the same color code as in A, overlaid on the crystal structure (black). The thickness of the tube representation corresponds to the local RMSF in all the snapshots assigned to the respective cluster.
Some divergence from the initial conformation is not unexpected when going from the crystal structure environment to aqueous solution in the simulations. The C-terminal helix 7, which is the most unstable in our simulations, is engaged in crystal contacts in the X-ray structure, which could have a stabilizing effect. In other crystal structures of insect OBPs with a C-terminus of similar length, it does not form a helix but is extended along the protein surface or entering the cavity, examples are Drosophila melanogaster LUSH (PDB-ID: 1OOF),48Culex quinquefasciatus CquiOBP1 (3OGN),49Anopheles gambiae AgamOBP4 (3Q8I),50 and AgamOBP20 (4F7F).51
In moth pheromone binding protein BmorPBP, a pH dependent switch has been proposed, where the C-terminus enters the cavity and forms a helix under acidic conditions.12,13 However, the conformation seems to be influenced also by other factors, as later the protein was crystallized in the same conformation in a ligand-free state at neutral pH.10,52 Multiple conformations are also observed in the C-terminus of AmelASP1; depending on pH and the presence of the ligand, it is found more or less deep in the cavity or part of a domain-swapped dimer.7,11 The studies on BmorPBP and AmelASP1 suggest that those OBPs change conformation upon ligand binding.
AmelOBP14, on the other hand, has been crystallized in the apo-form and with several ligands without big changes to overall protein conformation or the conformation of the C-terminus21 (PDB-ID 3S0A vs 3S0E backbone RMSD: 0.07 nm, overall RMSD: 0.13 nm). In our simulations, however, there are significant differences between the apo and ligand-bound form. When no ligand is present, the cavity closes very quickly, which is obvious not only in the first nanoseconds of all apo simulations but also when the ligand leaves the cavity as is observed in simulation EOL2 and intermittently also in EOL7 at around 500 ns (Figure 4).
Figure 4.
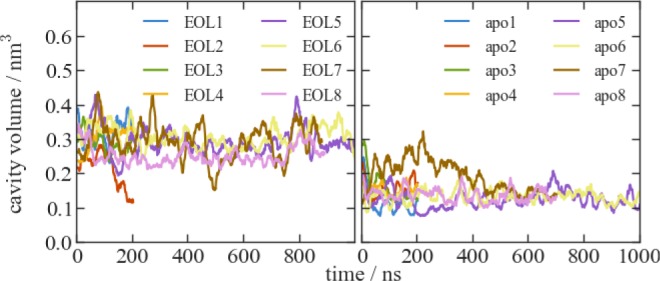
Time series of the volume of the largest cavity detected by trj_cavity45 in selected plain MD simulations of AmelOBP14 with and without ligand EOL. Because cavity volumes fluctuate strongly between single snapshots, the data have been moving average smoothed with a window size of 20.
The apoprotein has been crystallized in two forms (in different crystallization conditions and with different space groups), without big differences in conformation. In the structure we used as a starting point for our apo simulations (PDB-ID: 3S0A), the cavity is similar in size as the one in the EOL-bound structure (PDB-ID: 3S0E). Also in the second apo crystal structure (PDB-ID: 3S0F), it is only slightly smaller. The deposited density maps show electron density inside the cavity of both apo structures, which was interpreted as water molecules. However, the density in the 3S0A-apo structure resembles very closely the density of ligand citralva (Figure 5A and B), and the one in the 3S0F-apo structure can also be interpreted as a five-membered ring like imidazole (Figure 5C), which was part of the crystallization buffer. The presence of these molecules in the cavity of the apo crystal structures would explain our observations in the apo simulations. Apo-OBP14 might be more different from the ligand-bound form than suggested by the crystal structures. The closure of the active site may be explained by the loss of active site water as outlined in the next section.
Figure 5.
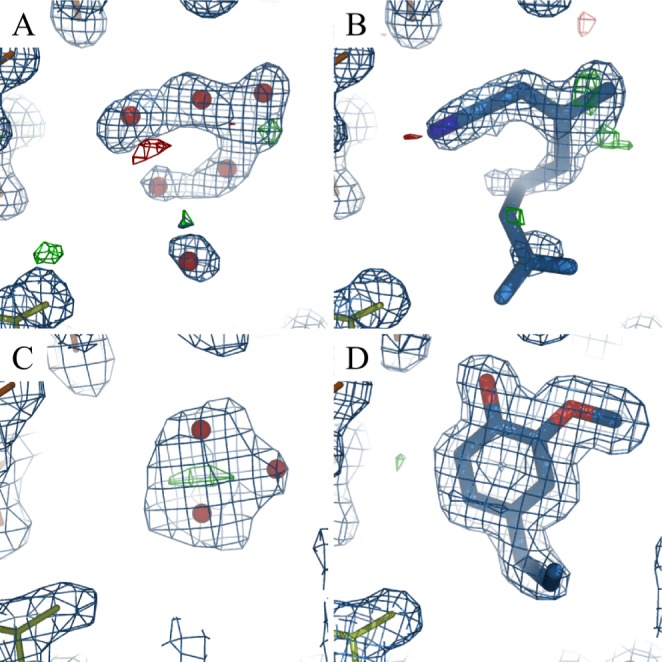
Electron density inside the cavity of AmelOBP14 crystal structures. (A) apo crystal form 1 (PDB-ID: 3S0A), (B) with ligand citralva (PDB-ID: 3S0D), (C) apo crystal form 2 (PDB-ID: 3S0F), and (D) with ligand eugenol (PDB-ID: 3S0E). Suggested water molecules are shown as red spheres. 2Fo–Fc maps (1σ) are shown in blue; Fo–Fc maps (3/–3σ) are shown in green and red, respectively.
Active Site Water
For a long time, the role of water molecules in the active site of protein structures has been underestimated in efforts to describe protein dynamics and protein–ligand interactions computationally.39,53 The amount of water molecules in an active site can be readily monitored from molecular simulations.46,54
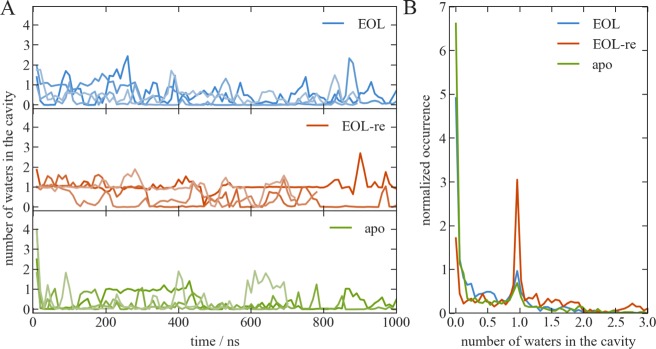
In the EOL-bound X-ray structure, only one water molecule inside the protein cavity is so stably bound that it is observable in the electron density of the crystal structure. It connects the hydroxy group of EOL to M113:N, V31:O, and S108:O in a network of hydrogen bonds (Figure 1C). This crystal water is also present in the X-ray structure of the apo protein, where also six additional water molecules were assigned to the electron density. During the solvation of the protein in the simulation box, further water molecules are added in the empty space of the cavity, leading to a total of four water molecules when EOL is present and about 15 when there is no ligand. During the first 10–20 ns of the simulations started from these systems, most of the water molecules leave, and on average only one remains (Figure 6). This is not unexpected after the observed rapid decrease in cavity volume in the apo simulations. Considering the predominantly hydrophobic nature of the cavity and ligand, it makes sense that water molecules relocate into the more favorable environment in the bulk solution.
Figure 6.
(A) Number of water molecules in the cavity during long MD simulations in the presence (top: EOL5–8, middle: EOL-re3–6) and absence (bottom, apo5–8) of the ligand. Each panel shows the time series for four independent simulations in different shades of the same color. (B) Histogram depiction of the number of water molecules in the cavity over all EOL, EOL-re, and apo simulations, respectively.
The water molecules that stay inside the cavity longest are observed close to the position of the crystal water, in a kind of pocket underneath the flap which contains helix 2 (green in Figure 1), close to the kink between the ligand and helix 6 and 7 (orange and red). Also, later in the long simulations, when for short periods water molecules reenter the cavity (peaks in Figure 6A), usually it is in this location.
In an additional set of four simulations (“nw”-simulations) started with no other water molecules in the cavity except for the one observed in the crystal structure, water molecules enter in some cases for short periods of time or also the last water molecule leaves. All in all, the picture is very comparable to the simulations started with a water-filled cavity, indicating that an equilibrium is reached in this respect. Comparing the EOL-bound simulations with the apo simulations, it appears that the apo structure has less affinity for active site water. If anything, the EOL tends to recruit water molecules rather than there being a stable active site water as suggested by the X-ray structures.
In the replica exchange simulations, water molecules leave most rapidly in the intermediate replicas, where the ligand-surrounding interactions are tuned down (Figure 7). When the interactions are completely off (“dummy ligand”), water tends to linger a little longer, while in the replica with the strongest interactions (toward the “real ligand”) two to three water molecules remain until the end of the 20 ns. In all plain MD simulations with EOL, only one water is left after the same amount of time (Figure 6). Those water molecules that stay in the RE simulations are found in the same pocket between the ligand and helix 2 as in the plain MD simulations.
Figure 7.
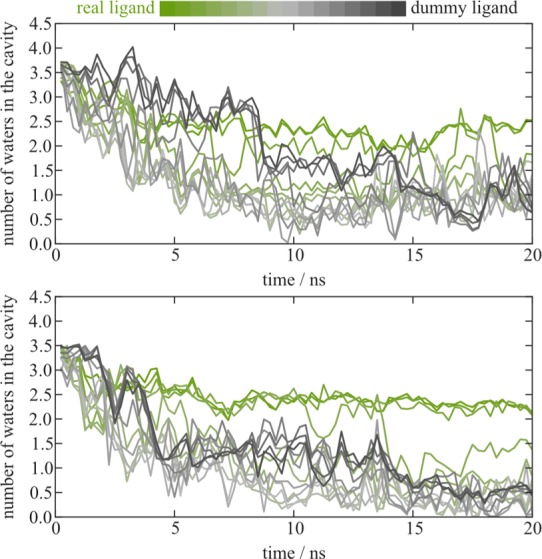
Number of water molecules in the cavity during RE simulations. In a color gradient from green to gray, the data for the 16 replica is shown. The top and bottom panels show data for two independent sets of simulations (RE1 and RE2).
The water molecules that stay in the real ligand state might be trapped in between EOL and protein, while in the dummy state there is no obstacle that prevents them from leaving. However, exchanges between the replica runs are observed reasonably often (the lowest switching efficiency is between λ = 0.6 and 0.7 with about 10%, all other steps usually switch in 20% to 100% of the cases), so it seems surprising that the trapped water molecules are not propagated to other runs and then able to leave. It seems that water molecules leave the fastest in the intermediate states (light gray in Figure 7), which might be a result of the decreased interactions with the ligand, while it still takes up space in the cavity, which it does less and less as the interactions are disappearing completely.
In the two RE simulations started without cavity water—except for the one observed in the crystal structure—the number of water molecules stays around 1 for the whole 20 ns (data not shown).
Ligand Poses
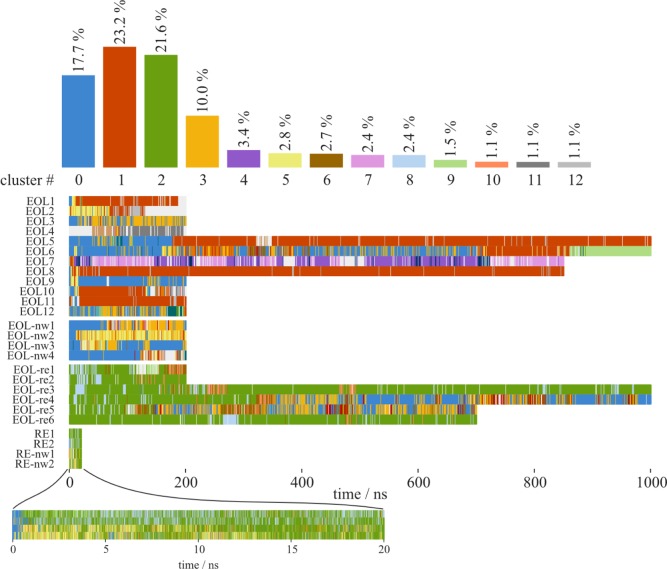
To get a view of the ligand behavior during the simulations, we clustered ligand conformations within an RMSD cutoff of 0.2 nm after superimposing the protein backbone of the structures. Figures 8 and 9 show the overall population of the orientational clusters, the time series of their occurrence, and representative structures, color-coded accordingly.
Figure 8.
Analysis of ligand conformational clusters obtained with an RMSD cutoff of 0.2 nm for the heavy atoms of the ligand when atoms of the protein backbone are superimposed. Top: overall occurrence of the conformations represented by the clusters. Bottom: time series of their occurrence. Cluster 0 (in blue) was enforced around the crystal structure. The corresponding structure snapshots are found in Figure 9.
Figure 9.
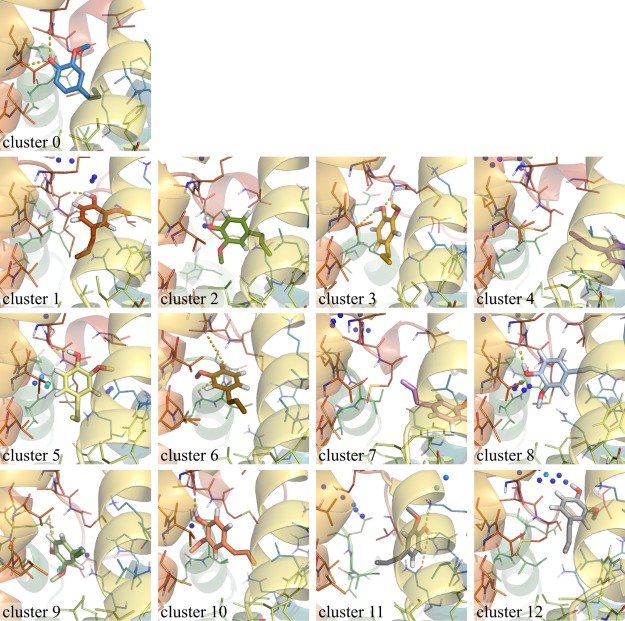
Central member structures of ligand conformational clusters using the same color code as in Figure 8. Colored spheres indicate grid points which are occupied by water molecules in more than 15% of snapshots assigned to the corresponding cluster (the grid points are rainbow-colored with a minimum (blue) of 15 and a maximum (red) of 70%). In all snapshots, the protein has been brought into the same orientation by superimposing the backbone atoms on the AmelOBP14 crystal structure. Hydrogen bonds which occur in more than 30% of the snapshots of a cluster are indicated by yellow dashed lines. A superposition and additional views of the first three clusters are provided in Figure S4 in the Supporting Information.
In the EOL-bound crystal structure, the electron density defines the position and orientation of the ligand very well (Figure 5D). The hydroxy group of EOL forms hydrogen bonds to S108:OG (helix 6) and L111:O (helix 7) and a water molecule (Figure 1C). Together with the adjacent backbone of T112, these are the only hydrophilic groups inside the cavity of the AmelOBP14 crystal structure. The hydrophobic tail of EOL points to the center of the hydrophobic cavity (Figure 9, cluster 0). In our simulations, the ligand shows extensive flexibility and freedom to adopt different poses (Figure 9). In many of them, the hydroxy group still forms hydrogen bonds to the protein, most commonly to residues in helix 7, but also helix 2 and helix 1. Several of the conformations where the ligand moves toward the space that is occupied by helix 7 (red in the figures) in the crystal structure are clearly only accessible because of the conformational changes and flexibility of this helix. An interdependence between the ligand conformations and the conformation of the protein, in particular helix 7, which provides H-bond donors and acceptors, would therefore not be surprising. While there is no obvious correlation between the changes of the ligand conformation and the loss of α-helical conformation of helix 7 or the protein backbone RMSD or backbone conformational clusters in general, such a correlation is observed by the concurrence of the protein backbone conformation of cluster 2 in Figure 3 and the ligand conformational cluster 3 (Figure 8).
While the cavity is completely closed-off in the crystal structure, the ligand seems close to leaving the cavity in several cases. It leaves for good only in simulation EOL2 (after about 140 ns), but also in simulation EOL7 it is found outside the cavity for short periods of time after which it returns to conformations visualized by cluster 4 or 7 in Figure 9.
A comparison of the 200 ns EOL and EOL-nw simulations suggests that the presence or absence of water molecules in the cavity at the start of the simulations has an influence on the stability of the most crystal-like ligand orientation. In the nw-simulations, it is retained much longer than in the simulations started with cavity water even though the number of cavity waters is the same in the two sets of simulations after the first 20 ns (Figure 8). One possible explanation might be that when the water molecules pass the ligand on their way out of the cavity, they give it some impulse to move away from the crystal conformation. Possibly without this kind of impulse, in the simulations which are started without cavity water, the ligand is more inert and stays in the original orientation for a longer time. However, with time the ligand samples similar conformations in both cases.
We also clustered ligand conformations in the RE simulations in the same manner as described for the plain MDs, considering only snapshots from the first replica, which has the full ligand-surrounding interactions. We obtain a different set of conformations than for the long MD simulations which were started from the crystal structure conformation. The by far most favored conformation in the two RE simulations started with cavity water is not similar to any sampled conformations in the MDs (“RE-conformation,” cluster 2 in Figure 9). Its hydroxy group is still interacting with hydrophilic groups in helix 7, but the ring has flipped so that the methoxy group is turned down toward helix 2 (green helix in Figure 9) and toward the additional 1–2 water molecules trapped in the cavity in the simulations started with water in the cavity.
In the RE-nw simulations, the ligand is at first predominantly oriented in a similar way to that in the major cluster observed in the plain MD simulations (Figure 8). However, also here the RE conformation is observed and becomes more prominent with time. In all the RE simulations, the ligand moves away remarkably quickly (within 1 ns) from the initial orientation, which is the one found in the crystal structure.
When plain MD simulations are started with a ligand in the orientation of the most populated cluster of the RE simulations (i.e., like cluster 2 in Figure 9), the ligand is stable in this orientation for hundreds of nanoseconds (Figure 8, EOL-re simulations). Only in two of the longer simulations, the ring flips to move the methoxy group up and orient itself more like in the crystal structure. The alternative pose observed in the RE simulations seems at least as stable in regular MD as the crystal structure pose which is abandoned frequently for alternative binding poses. We conclude that multiple binding modes of eugenol should be taken into account. Coordinates of the central member structures of the first few clusters are available in the Supporting Information.
Free Energy of Binding
By gradually turning off the interactions of the ligand with its surroundings in RE simulations of the unbound and protein-bound state (double decoupling), we can derive the binding free energy of EOL in the AmelOBP14 cavity using the thermodynamic cycle depicted in Figure 2. For the free ligand, ΔGEOL→DUM converges very quickly (Figure S5 in the Supporting Information), and the simulation was not prolonged beyond 5 ns. In the protein-bound state, convergence is much slower, as seen in the drift of the ΔGEOL→DUM values in Figure 10. Convergence seems to be reached faster in the simulations without the additional water in the cavity: within 10 ns, both RE-nw simulations reach values of ΔGEOL→DUM within each other’s error bounds and do not change drastically anymore. In the simulations with cavity water, fluctuations in ΔGEOL→DUM are stronger and a slight drift remains for simulation RE1.
Figure 10.
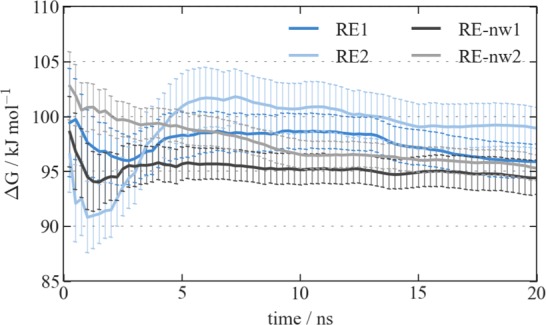
Cumulative timeseries of ΔGEOL→DUM showing its convergence with time in four independent RE simulations.
All simulations converge to reasonably similar values for the binding free energies which are in the range of experimental data (Table 2). Binding affinities are available from fluorescence measurements following the replacement of a fluorescent probe20,21 and electrical measurements on a reduced graphene oxide (rGO) transistor device.24 Our data tend more toward the latter, more directly measured values.
Table 2. Comparison of Binding Free Energies from RE Simulations and Experimental Measurementsa.
| ΔGEOL→DUM | ΔGrestraint | ΔGbind | |
|---|---|---|---|
| free | |||
| EOL | 52.3 ± 0.7 | ||
| protein-bound | |||
| RE1 | 95.9 ± 1.6 | –13.4 | –30.2 |
| RE2 | 99.0 ± 1.9 | –13.4 | –33.2 |
| RE-nw1 | 94.4 ± 1.6 | –13.4 | –28.7 |
| RE-nw2 | 95.3 ± 1.2 | –13.4 | –29.6 |
| experimental | |||
| rGO transistor24 | –25.3 | ||
| fluorescence replacement21 | –40.5 | ||
All free energies are in kJ mol–1.
We also calculated free energies in the same manner from sets of simulations without replica exchange (“TI”-simulations). There is a bigger spread in the data, errors on the binding free energy are larger, and the resulting curves for thermodynamic integration are less smooth (Figure S6 and Table S1 in the Supporting Information). Likely, this is a result of sudden changes in preferred ligand orientation when going from one intermediate simulation to the next, which can be observed in time series of the ligand root-mean-square deviation (Figure S7 in the Supporting Information).
Conclusion
The main advantage of the double decoupling approach with Hamiltonian replica exchange MD is the possibility to overcome barriers in the replicas with decreased ligand-surrounding interactions, yielding more varied ligand poses which can then be propagated back into the real ligand state via replica exchange.
The ligand conformation observed in the AmelOBP14 crystal structure is not particularly stable in our simulations. On the one hand, in the plain MD simulations, the ligand drifts away from the original orientation to a variety of different poses, which can even lead to ligand release. This is not surprising, considering that the ligand forms hydrogen bonds to the C-terminal helix 7, which is highly unstable, and it is close to other parts of the protein which undergo larger changes during long simulations.
On the other hand, in the RE simulations, the ligand in the real state immediately finds a very stable orientation where a flipping of the ring has moved the methoxy group to the other side of the cavity, while the hydroxy group still keeps its hydrogen bond. The fact that this ligand pose is never observed in plain MD simulations started from the crystal structure but is quite stable if the simulations are started from this new ligand orientation indicates that the two conformations are separated by a considerable energy barrier. The movement of the ligand to more distant positions with alternative H-bonding partners along with changes in the protein in the long simulations starting from the crystal structure might furthermore reduce the probability of the ligand to find a way to this newly identified orientation, so that we do not observe it even during extensive simulation times. In the RE simulations, the ligand overcomes the barrier very quickly, while its environment is bound to stay more similar because of the intrinsically shorter time scales.
Our results suggest that a ligand orientation different from the crystal structure is favorable in the solvated protein–ligand complex, which is not easily accessible without enhanced sampling techniques. An experimental validation of our predictions would be possible through elaborate NMR experiments.
OBPs are not highly selective and, like A. mellifera OBP14, many can fit a range of different ligands into their cavities.8 The spacious hydrophobic cavity with a hydrophilic anchor only on one side seems well suited to accommodate multiple possible binding poses. As observed previously for other promiscuous proteins, a versatile binding site allows for not only the accommodation of various ligands but also that of different binding poses.55,56 The crystal structure of AmelOBP14 shows very well-defined electron density for eugenol in the cavity (Figure 5D). However, in the absence of conformational restrictions induced by crystal contacts in helix 7, the ligand might be free to adopt a much wider range of different orientations within the cavity.
Acknowledgments
The authors thank Melanie Larisika, Christoph Nowak, and Wolfgang Knoll for fruitful discussions. Financial support of the Vienna Science and Technology Fund (WWTF; grant number LS08-QM03) and the European Research Council (ERC; grant number 260408) is gratefully acknowledged.
Supporting Information Available
The Supporting Information is available free of charge on the ACS Publications website at DOI: 10.1021/acs.jcim.5b00673.
The authors declare no competing financial interest.
Supplementary Material
References
- Vogt R. G.; Riddiford L. M. Pheromone Binding and Inactivation by Moth Antennae. Nature 1981, 293, 161–163 10.1038/293161a0. [DOI] [PubMed] [Google Scholar]
- Pelosi P.; Zhou J.-J.; Ban L. P.; Calvello M. Soluble Proteins in Insect Chemical Communication. Cell. Mol. Life Sci. 2006, 63, 1658–1676 10.1007/s00018-005-5607-0. [DOI] [PMC free article] [PubMed] [Google Scholar]
- Leal W. S. Odorant Reception in Insects: Roles of Receptors, Binding Proteins, and Degrading Enzymes. Annu. Rev. Entomol. 2013, 58, 373–391 10.1146/annurev-ento-120811-153635. [DOI] [PubMed] [Google Scholar]
- Sun Y. F.; De Biasio F.; Qiao H. L.; Iovinella I.; Yang S. X.; Ling Y.; Riviello L.; Battaglia D.; Falabella P.; Yang X. L.; Pelosi P. Two Odorant-Binding Proteins Mediate the Behavioural Response of Aphids to the Alarm Pheromone (E)-ß-farnesene and Structural Analogues. PLoS One 2012, 7, e32759. 10.1371/journal.pone.0032759. [DOI] [PMC free article] [PubMed] [Google Scholar]
- Swarup S.; Williams T. I.; Anholt R. R. H. Functional Dissection of Odorant Binding Protein Genes in Drosophila Melanogaster. Genes Brain Behav. 2011, 10, 648–657 10.1111/j.1601-183X.2011.00704.x. [DOI] [PMC free article] [PubMed] [Google Scholar]
- Lescop E.; Briand L.; Pernollet J.-C.; Guittet E. Structural Basis of the Broad Specificity of a General Odorant-Binding Protein from Honeybee. Biochemistry 2009, 48, 2431–2441 10.1021/bi802300k. [DOI] [PubMed] [Google Scholar]
- Pesenti M. E.; Spinelli S.; Bezirard V.; Briand L.; Pernollet J.-C.; Campanacci V.; Tegoni M.; Cambillau C. Queen Bee Pheromone Binding Protein pH-Induced Domain Swapping Favors Pheromone Release. J. Mol. Biol. 2009, 390, 981–990 10.1016/j.jmb.2009.05.067. [DOI] [PubMed] [Google Scholar]
- Pelosi P.; Mastrogiacomo R.; Iovinella I.; Tuccori E.; Persaud K. C. Structure and Biotechnological Applications of Odorant-Binding Proteins. Appl. Microbiol. Biotechnol. 2014, 98, 61–70 10.1007/s00253-013-5383-y. [DOI] [PubMed] [Google Scholar]
- Leal W. S.; Chen A. M.; Erickson M. L. Selective and pH-Dependent Binding of a Moth Pheromone to a Pheromone-Binding Protein. J. Chem. Ecol. 2005, 31, 2493–2499 10.1007/s10886-005-7458-4. [DOI] [PubMed] [Google Scholar]
- Lautenschlager C.; Leal W. S.; Clardy J. Coil-to-Helix Transition and Ligand Release of Bombyx mori Pheromone-Binding Protein. Biochem. Biophys. Res. Commun. 2005, 335, 1044–1050 10.1016/j.bbrc.2005.07.176. [DOI] [PubMed] [Google Scholar]
- Pesenti M. E.; Spinelli S.; Bezirard V.; Briand L.; Pernollet J.-C.; Tegoni M.; Cambillau C. Structural Basis of the Honey Bee PBP Pheromone and pH-induced Conformational Change. J. Mol. Biol. 2008, 380, 158–169 10.1016/j.jmb.2008.04.048. [DOI] [PubMed] [Google Scholar]
- Damberger F.; Nikonova L.; Horst R.; Peng G.; Leal W. S.; Wüthrich K. NMR Characterization of a pH-Dependent Equilibrium between Two Folded Solution Conformations of the Pheromone-Binding Protein from Bombyx Mori. Protein Sci. 2000, 9, 1038–1041 10.1110/ps.9.5.1038. [DOI] [PMC free article] [PubMed] [Google Scholar]
- Horst R.; Damberger F.; Luginbuhl P.; Guntert P.; Peng G.; Nikonova L.; Leal W. S.; Wuthrich K. NMR Structure Reveals Intramolecular Regulation Mechanism for Pheromone Binding and Release. Proc. Natl. Acad. Sci. U. S. A. 2001, 98, 14374–14379 10.1073/pnas.251532998. [DOI] [PMC free article] [PubMed] [Google Scholar]
- Leal W. S.; Barbosa R. M. R.; Xu W.; Ishida Y.; Syed Z.; Latte N.; Chen A. M.; Morgan T. I.; Cornel A. J.; Furtado A. Reverse and Conventional Chemical Ecology Approaches for the Development of Oviposition Attractants for Culex Mosquitoes. PLoS One 2008, 3, e3045. 10.1371/journal.pone.0003045. [DOI] [PMC free article] [PubMed] [Google Scholar]
- Leal W. S.; Ishida Y.; Pelletier J.; Xu W.; Rayo J.; Xu X.; Ames J. B. Olfactory Proteins Mediating Chemical Communication in the Navel Orangeworm Moth, Amyelois transitella. PLoS One 2009, 4, e7235. 10.1371/journal.pone.0007235. [DOI] [PMC free article] [PubMed] [Google Scholar]
- Wogulis M.; Morgan T.; Ishida Y.; Leal W. S.; Wilson D. K. The Crystal Structure of an Odorant Binding Protein from Anopheles Gambiae: Evidence for a Common Ligand Release Mechanism. Biochem. Biophys. Res. Commun. 2006, 339, 157–164 10.1016/j.bbrc.2005.10.191. [DOI] [PubMed] [Google Scholar]
- Xu W.; Xu X.; Leal W. S.; Ames J. B. Extrusion of the C-terminal Helix in Navel Orangeworm Moth Pheromone-Binding Protein (AtraPBP1) Controls Pheromone Binding. Biochem. Biophys. Res. Commun. 2011, 404, 335–338 10.1016/j.bbrc.2010.11.119. [DOI] [PMC free article] [PubMed] [Google Scholar]
- di Luccio E.; Ishida Y.; Leal W. S.; Wilson D. K. Crystallographic Observation of pH-Induced Conformational Changes in the Amyelois Transitella Pheromone-Binding Protein AtraPBP1. PLoS One 2013, 8, e53840. 10.1371/journal.pone.0053840. [DOI] [PMC free article] [PubMed] [Google Scholar]
- Dani F. R.; Iovinella I.; Felicioli A.; Niccolini A.; Calvello M. A.; Carucci M. G.; Qiao H.; Pieraccini G.; Turillazzi S.; Moneti G.; Pelosi P. Mapping the Expression of Soluble Olfactory Proteins in the Honeybee. J. Proteome Res. 2010, 9, 1822–1833 10.1021/pr900969k. [DOI] [PubMed] [Google Scholar]
- Iovinella I.; Dani F. R.; Niccolini A.; Sagona S.; Michelucci E.; Gazzano A.; Turillazzi S.; Felicioli A.; Pelosi P. Differential Expression of Odorant-Binding Proteins in the Mandibular Glands of the Honey Bee According to Caste and Age. J. Proteome Res. 2011, 10, 3439–3449 10.1021/pr2000754. [DOI] [PubMed] [Google Scholar]
- Spinelli S.; Lagarde A.; Iovinella I.; Legrand P.; Tegoni M.; Pelosi P.; Cambillau C. Crystal structure of Apis Mellifera OBP14, a C-minus Odorant-Binding Protein, and its Complexes with Odorant Molecules. Insect Biochem. Mol. Biol. 2012, 42, 41–50 10.1016/j.ibmb.2011.10.005. [DOI] [PubMed] [Google Scholar]
- Schwaighofer A.; Pechlaner M.; Oostenbrink C.; Kotlowski C.; Araman C.; Mastrogiacomo R.; Pelosi P.; Knoll W.; Nowak C.; Larisika M. Insights Into Structural Features Determining Odorant Affinities to Honey Bee Odorant-Binding Protein 14. Biochem. Biophys. Res. Commun. 2014, 446, 1042–1046 10.1016/j.bbrc.2014.03.054. [DOI] [PubMed] [Google Scholar]
- Schwaighofer A.; Kotlowski C.; Araman C.; Chu N.; Mastrogiacomo R.; Becker C.; Pelosi P.; Knoll W.; Larisika M.; Nowak C. Honey Bee Odorant-Binding Protein 14: Effects on Thermal Stability Upon Odorant Binding Revealed by FT-IR Spectroscopy and CD Measurements. Eur. Biophys. J. 2014, 43, 105–112 10.1007/s00249-013-0939-4. [DOI] [PubMed] [Google Scholar]
- Larisika M.; Kotlowski C.; Steininger C.; Mastrogiacomo R.; Pelosi P.; Schütz S.; Peteu S. F.; Kleber C.; Reiner-Rozman C.; Nowak C.; Knoll W. Electronic Olfactory Sensor Based on A. mellifera Odorant-Binding Protein 14 on a Reduced Graphene Oxide Field-Effect Transistor. Angew. Chem., Int. Ed. 2015, 54, 13245–13248 10.1002/anie.201505712. [DOI] [PMC free article] [PubMed] [Google Scholar]
- Gilson M. K.; Given J. A.; Bush B. L.; McCammon J. A. The Statistical-Thermodynamic Basis for Computation of Binding Affinities: a Critical Review. Biophys. J. 1997, 72, 1047–1069 10.1016/S0006-3495(97)78756-3. [DOI] [PMC free article] [PubMed] [Google Scholar]
- Boresch S.; Tettinger F.; Leitgeb M.; Karplus M. Absolute Binding Free Energies: A Quantitative Approach for Their Calculation. J. Phys. Chem. B 2003, 107, 9535–9551 10.1021/jp0217839. [DOI] [Google Scholar]
- Luitz M. P.; Zacharias M. Protein-Ligand Docking Using Hamiltonian Replica Exchange Simulations with Soft Core Potentials. J. Chem. Inf. Model. 2014, 54, 1669–1675 10.1021/ci500296f. [DOI] [PubMed] [Google Scholar]
- Schmid N.; Christ C. D.; Christen M.; Eichenberger A. P.; van Gunsteren W. F. Architecture, Implementation and Parallelisation of the GROMOS Software for Biomolecular Simulation. Comput. Phys. Commun. 2012, 183, 890–903 10.1016/j.cpc.2011.12.014. [DOI] [Google Scholar]
- Hess B.; Kutzner C.; van der Spoel D.; Lindahl E. GROMACS 4: Algorithms for Highly Efficient, Load-Balanced, and Scalable Molecular Simulation. J. Chem. Theory Comput. 2008, 4, 435–447 10.1021/ct700301q. [DOI] [PubMed] [Google Scholar]
- Pronk S.; Páll S.; Schulz R.; Larsson P.; Bjelkmar P.; Apostolov R.; Shirts M. R.; Smith J. C.; Kasson P. M.; van der Spoel D.; Hess B.; Lindahl E. GROMACS 4.5: a High-Throughput and Highly Parallel Open Source Molecular Simulation Toolkit. Bioinformatics 2013, 29, 845–854 10.1093/bioinformatics/btt055. [DOI] [PMC free article] [PubMed] [Google Scholar]
- Reif M. M.; Huenenberger P. H.; Oostenbrink C. New Interaction Parameters for Charged Amino Acid Side Chains in the GROMOS Force Field. J. Chem. Theory Comput. 2012, 8, 3705–3723 10.1021/ct300156h. [DOI] [PubMed] [Google Scholar]
- Berendsen H. J. C.; Postma J. P. M.; van Gunsteren W. F.; Hermans J. In Intermolecular Forces; Pullman B., Ed.; Reidel: Dordrecht, The Netherlands, 1981; pp 331–342. [Google Scholar]
- Berendsen H. J. C.; Postma J. P. M.; van Gunsteren W. F.; DiNola A.; Haak J. R. Molecular-Dynamics with Coupling to an External Bath. J. Chem. Phys. 1984, 81, 3684–3690 10.1063/1.448118. [DOI] [Google Scholar]
- Ryckaert J. P.; Ciccotti G.; Berendsen H. J. C. Numerical-Integration of Cartesian Equations of Motion of a System with Constraints - Molecular-Dynamics of N-Alkanes. J. Comput. Phys. 1977, 23, 327–341 10.1016/0021-9991(77)90098-5. [DOI] [Google Scholar]
- Hess B.; Bekker H.; Berendsen H. J. C.; Fraaije J. G. E. M. LINCS: A Linear Constraint Solver for Molecular Simulations. J. Comput. Chem. 1997, 18, 1463–1472. [DOI] [Google Scholar]
- Heinz T. N.; van Gunsteren W. F.; Hünenberger P. H. Comparison of Four Methods to Compute the Dielectric Permittivity of Liquids from Molecular Dynamics Simulations. J. Chem. Phys. 2001, 115, 1125–1136 10.1063/1.1379764. [DOI] [Google Scholar]
- Beutler T. C.; Mark A. E.; van Schaik R. C.; Gerber P. R.; van Gunsteren W. F. Avoiding Singularities and Numerical Instabilities in Free Energy Calculations Based on Molecular Simulations. Chem. Phys. Lett. 1994, 222, 529–539 10.1016/0009-2614(94)00397-1. [DOI] [Google Scholar]
- Tembre B. L.; Mc Cammon J. A. Ligand-Receptor Interactions. Comput. Chem. 1984, 8, 281–283 10.1016/0097-8485(84)85020-2. [DOI] [Google Scholar]
- Baron R.; McCammon J. A. Molecular Recognition and Ligand Association. Annu. Rev. Phys. Chem. 2013, 64, 151–175 10.1146/annurev-physchem-040412-110047. [DOI] [PubMed] [Google Scholar]
- Allen M. P.; Tildesley D. J.. Computer Simulation of Liquids; Clarendon Press: New York, 1989. [Google Scholar]
- Eichenberger A. P.; Allison J. R.; Dolenc J.; Geerke D. P.; Horta B. A. C.; Meier K.; Oostenbrink C.; Schmid N.; Steiner D.; Wang D.; van Gunsteren W. F. GROMOS++ Software for the Analysis of Biomolecular Simulation Trajectories. J. Chem. Theory Comput. 2011, 7, 3379–3390 10.1021/ct2003622. [DOI] [PubMed] [Google Scholar]
- Kabsch W.; Sander C. Dictionary of Protein Secondary Structure: Pattern Recognition of Hydrogen-Bonded and Geometrical Features. Biopolymers 1983, 22, 2577–2637 10.1002/bip.360221211. [DOI] [PubMed] [Google Scholar]
- Kearsley S. K. On the Orthogonal Transformation Used for Structural Comparisons. Acta Crystallogr., Sect. A: Found. Crystallogr. 1989, 45, 208–210 10.1107/S0108767388010128. [DOI] [Google Scholar]
- Daura X.; van Gunsteren W. F.; Mark A. E. Folding-Unfolding Thermodynamics of a β-Heptapeptide from Equilibrium Simulations. Proteins: Struct., Funct., Genet. 1999, 34, 269–280. [DOI] [PubMed] [Google Scholar]
- Paramo T.; East A.; Garzón D.; Ulmschneider M. B.; Bond P. J. Efficient Characterization of Protein Cavities within Molecular Simulation Trajectories: trj_cavity. J. Chem. Theory Comput. 2014, 10, 2151–2164 10.1021/ct401098b. [DOI] [PubMed] [Google Scholar]
- Baron R.; McCammon J. A. Dynamics, Hydration, and Motional Averaging of a Loop-Gated Artificial Protein Cavity: The W191G Mutant of Cytochrome C Peroxidase in Water as Revealed by Molecular Dynamics Simulations. Biochemistry 2007, 46, 10629–10642 10.1021/bi700866x. [DOI] [PubMed] [Google Scholar]
- Smith L. J.; Daura X.; van Gunsteren W. F. Assessing Equilibration and Convergence in Biomolecular Simulations. Proteins: Struct., Funct., Genet. 2002, 48, 487–496 10.1002/prot.10144. [DOI] [PubMed] [Google Scholar]
- Kruse S. W.; Zhao R.; Smith D. P.; Jones D. N. M. Structure of a Specific Alcohol-Binding Site Defined by the Odorant Binding Protein LUSH from Drosophila Melanogaster. Nat. Struct. Biol. 2003, 10, 694–700 10.1038/nsb960. [DOI] [PMC free article] [PubMed] [Google Scholar]
- Mao Y.; Xu X.; Xu W.; Ishida Y.; Leal W. S.; Ames J. B.; Clardy J. Crystal and Solution Structures of an Odorant-Binding Protein from the Southern House Mosquito Complexed with an Oviposition Pheromone. Proc. Natl. Acad. Sci. U. S. A. 2010, 107, 19102–19107 10.1073/pnas.1012274107. [DOI] [PMC free article] [PubMed] [Google Scholar]
- Davrazou F.; Dong E.; Murphy E. J.; Johnson H. T.; Jones D. N. M. New Insights into the Mechanism of Odorant Detection by the Malaria-transmitting Mosquito Anopheles gambiae. J. Biol. Chem. 2011, 286, 34175–34183 10.1074/jbc.M111.274712. [DOI] [PMC free article] [PubMed] [Google Scholar]
- Ziemba B. P.; Murphy E. J.; Edlin H. T.; Jones D. N. M. A Novel Mechanism of Ligand Binding and Release in the Odorant Binding Protein 20 from the Malaria Mosquito Anopheles gambiae. Protein Sci. 2013, 22, 11–21 10.1002/pro.2179. [DOI] [PMC free article] [PubMed] [Google Scholar]
- Lautenschlager C.; Leal W. S.; Clardy J. Bombyx mori Pheromone-Binding Protein Binding Non-Pheromone Ligands: Implications for Pheromone Recognition. Structure 2007, 15, 1148–1154 10.1016/j.str.2007.07.013. [DOI] [PMC free article] [PubMed] [Google Scholar]
- de Beer S. B. A.; Vermeulen N. P. E.; Oostenbrink C. The Role of Water Molecules in Computational Drug Design. Curr. Top. Med. Chem. 2010, 10, 55–66 10.2174/156802610790232288. [DOI] [PubMed] [Google Scholar]
- Bakowies D.; van Gunsteren W. F. Simulations of Apo and Holo-Fatty Acid Binding Protein: Structure and Dynamics of Protein, Ligand and Internal Water. J. Mol. Biol. 2002, 315, 713–736 10.1006/jmbi.2001.5202. [DOI] [PubMed] [Google Scholar]
- Stjernschantz E.; Oostenbrink C. Improved Ligand-Protein Binding Affinity Predictions Using Multiple Binding Modes. Biophys. J. 2010, 98, 2682–2691 10.1016/j.bpj.2010.02.034. [DOI] [PMC free article] [PubMed] [Google Scholar]
- Graf M. M. H.; Zhixiong L.; Bren U.; Haltrich D.; van Gunsteren W. F.; Oostenbrink C. Pyranose Dehydrogenase Ligand Promiscuity: A Generalized Approach to Simulate Monosaccharide Solvation, Binding, and Product Formation. PLoS Comput. Biol. 2014, 10, e1003995. 10.1371/journal.pcbi.1003995. [DOI] [PMC free article] [PubMed] [Google Scholar]
Associated Data
This section collects any data citations, data availability statements, or supplementary materials included in this article.


